
  |
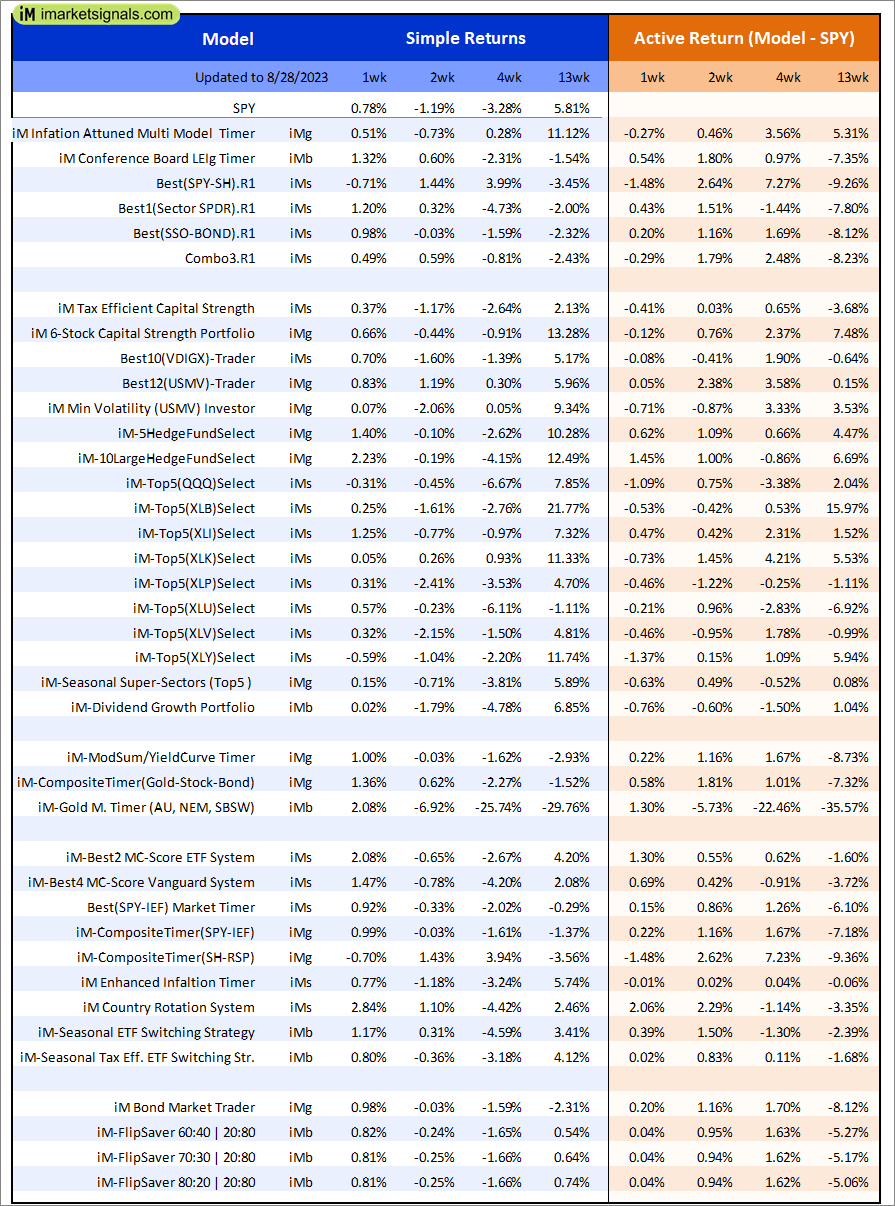
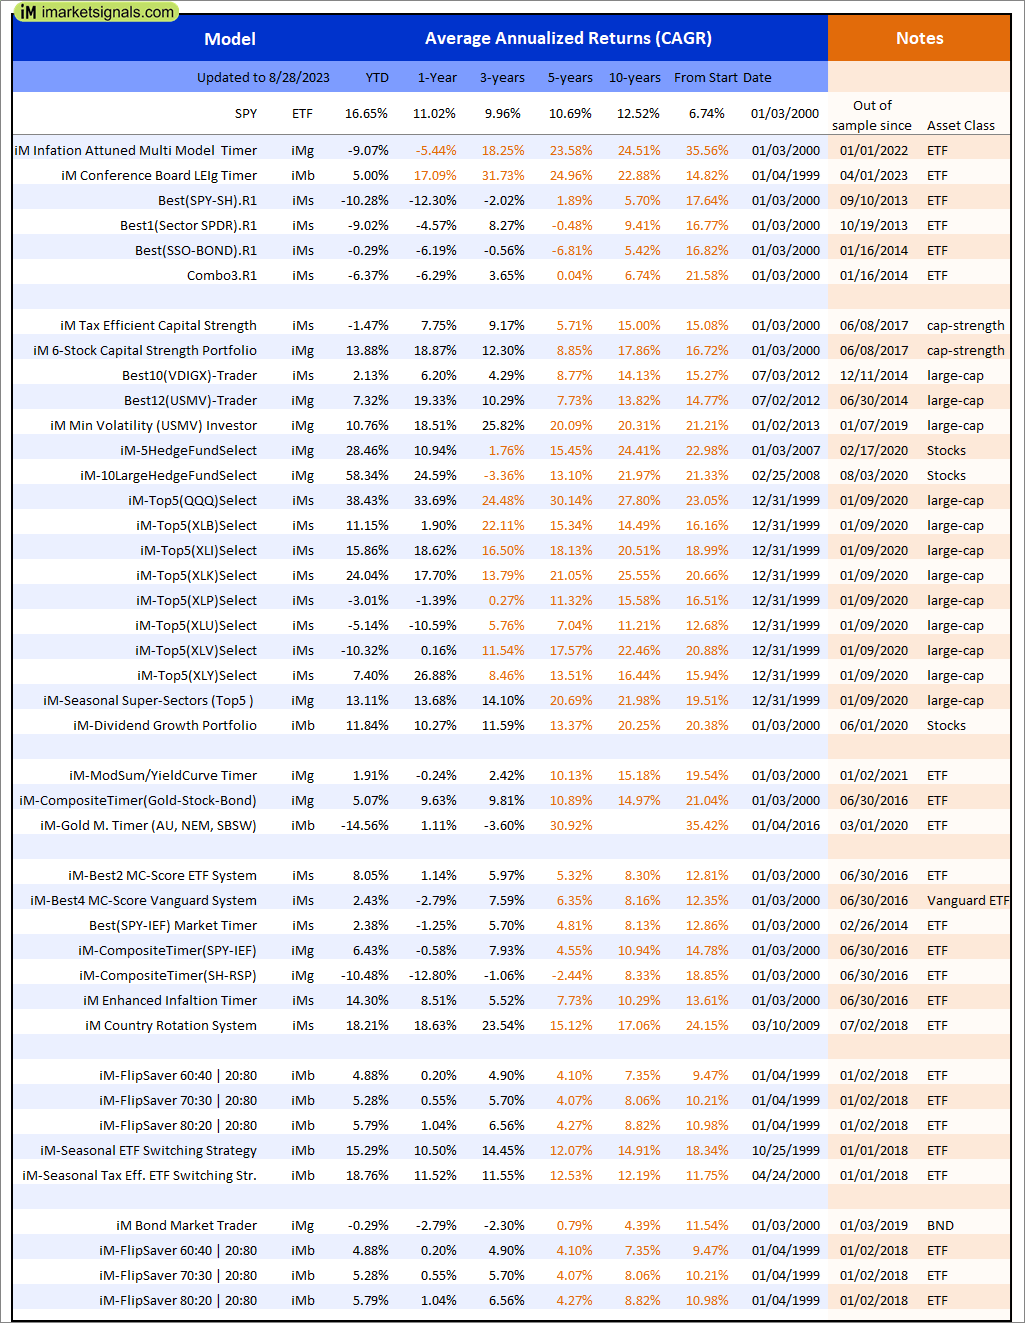
Out of sample performance summary of our models for the past 1, 2, 4 and 13 week periods. The active active return indicates how the models over- or underperformed the benchmark ETF SPY. Also the YTD, and the 1-, 3-, 5- and 10-year annualized returns are shown in the second table |
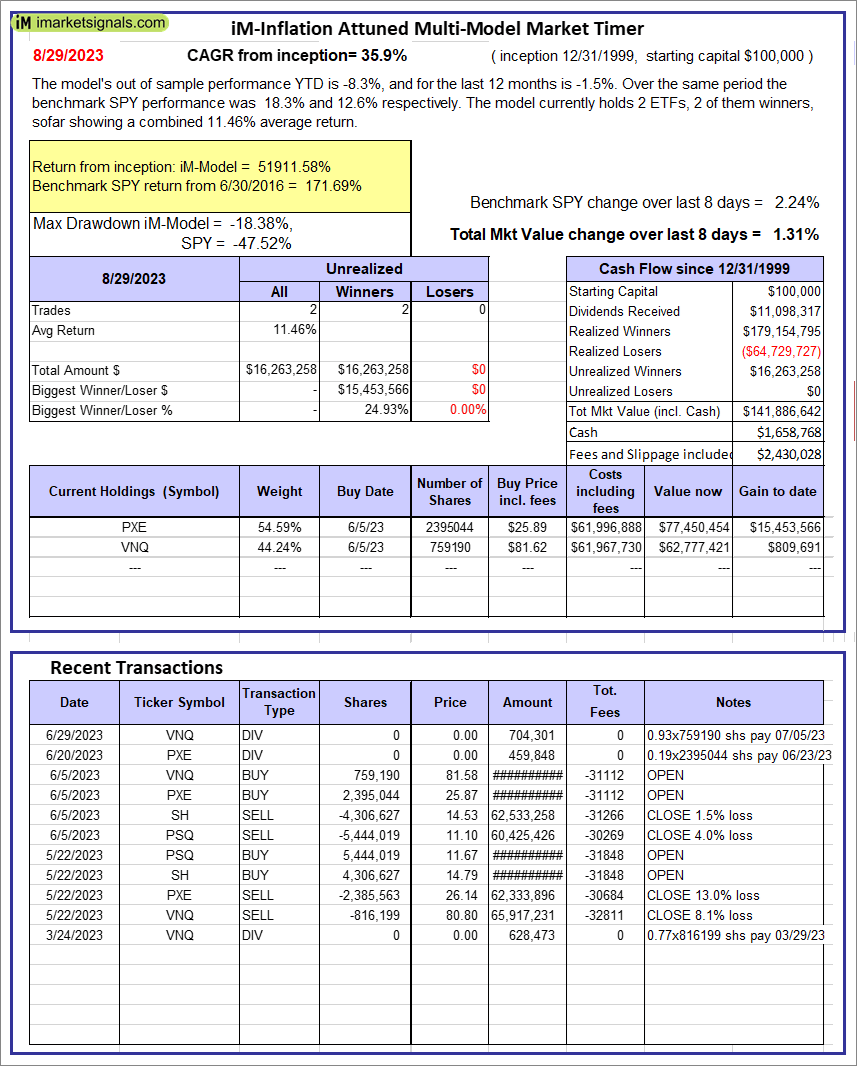 |
iM-Inflation Attuned Multi-Model Market Timer: The model’s out of sample performance YTD is -8.3%, and for the last 12 months is -1.5%. Over the same period the benchmark SPY performance was 18.3% and 12.6% respectively. Over the previous week the market value of the iM-Inflation Attuned Multi-Model Market Timer gained 1.31% at a time when SPY gained 2.24%. A starting capital of $100,000 at inception on 3/24/2017 would have grown to $141,886,642 which includes $1,658,768 cash and excludes $2,430,028 spent on fees and slippage. |
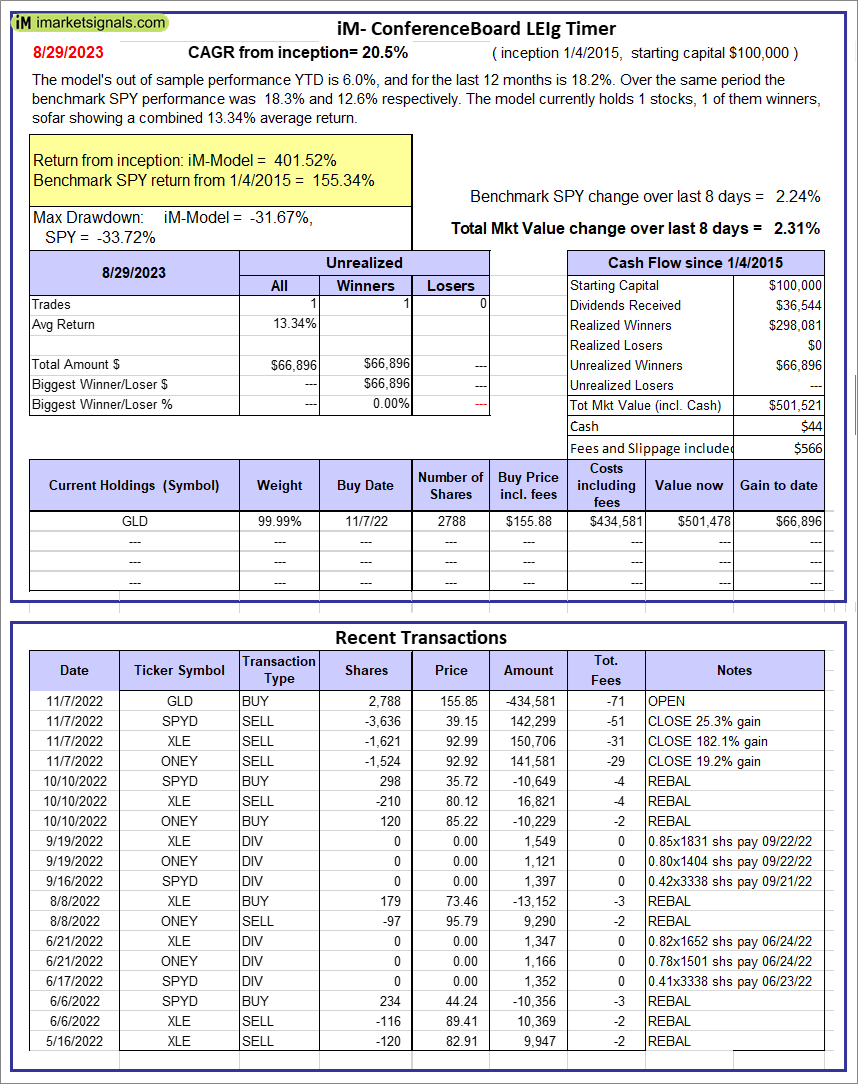 |
iM-Conference Board LEIg Timer: The model’s performance YTD is 14.3%, and for the last 12 months is 7.3%. Over the same period the benchmark SPY performance was 20.1% and 9.4% respectively. Over the previous week the market value of the iM-Conference Board LEIg Timer gained 2.31% at a time when SPY gained 2.24%. A starting capital of $100,000 at inception on 4/5/2017 would have grown to $501,521 which includes $44 cash and excludes $566 spent on fees and slippage. |
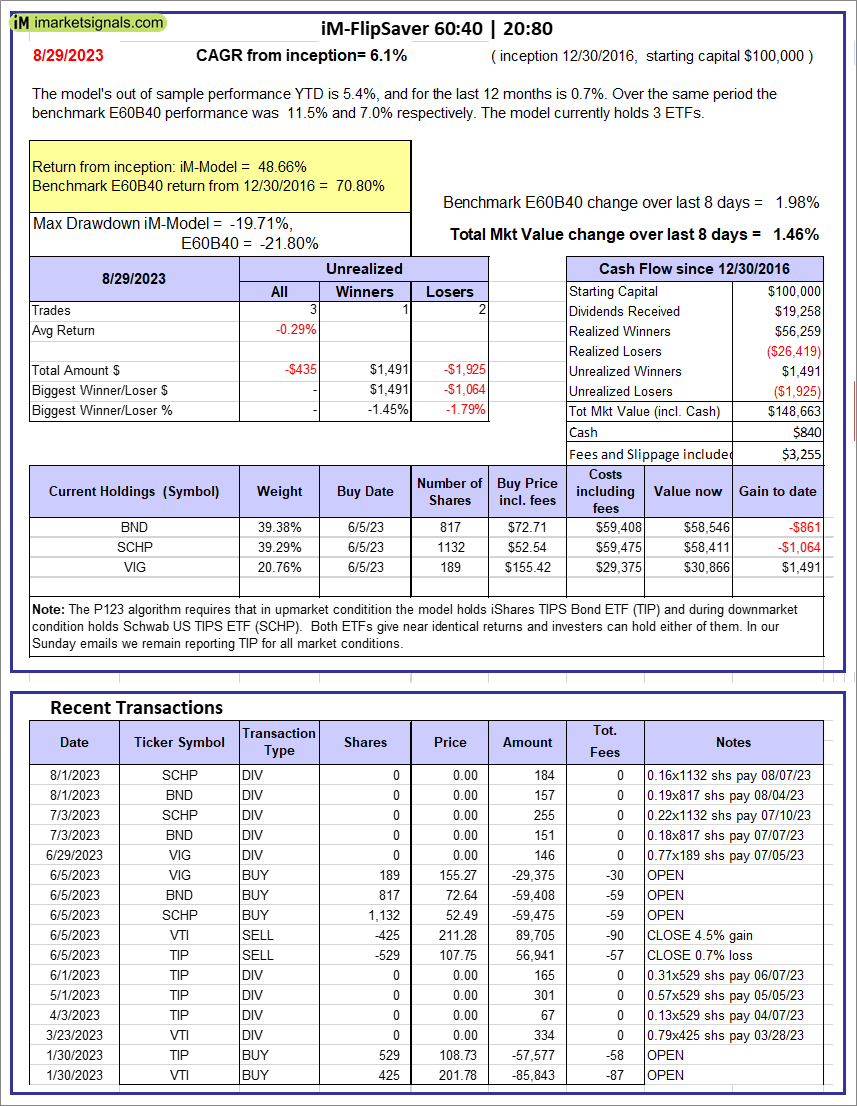 |
iM-FlipSaver 60:40 | 20:80 – 2017: The model’s out of sample performance YTD is 5.4%, and for the last 12 months is 0.7%. Over the same period the benchmark E60B40 performance was 11.5% and 7.0% respectively. Over the previous week the market value of iM-FlipSaver 80:20 | 20:80 gained 1.46% at a time when SPY gained 1.98%. A starting capital of $100,000 at inception on 7/16/2015 would have grown to $148,663 which includes $840 cash and excludes $3,255 spent on fees and slippage. |
 |
iM-FlipSaver 70:30 | 20:80 – 2017: The model’s out of sample performance YTD is 6.0%, and for the last 12 months is 1.2%. Over the same period the benchmark E60B40 performance was 11.5% and 7.0% respectively. Over the previous week the market value of iM-FlipSaver 70:30 | 20:80 gained 1.46% at a time when SPY gained 1.98%. A starting capital of $100,000 at inception on 7/15/2015 would have grown to $153,616 which includes $671 cash and excludes $3,432 spent on fees and slippage. |
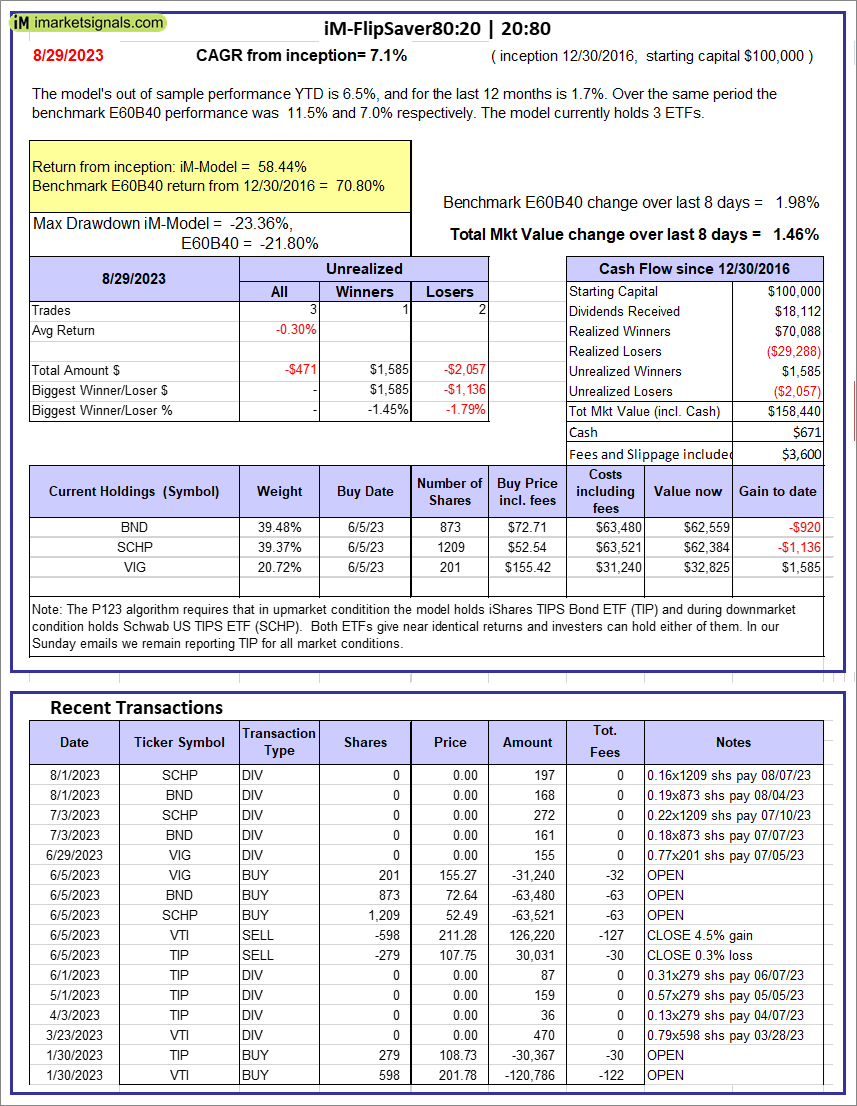 |
iM-FlipSaver 80:20 | 20:80 – 2017: The model’s out of sample performance YTD is 6.5%, and for the last 12 months is 1.7%. Over the same period the benchmark E60B40 performance was 11.5% and 7.0% respectively. Over the previous week the market value of iM-FlipSaver 80:20 | 20:80 gained 1.46% at a time when SPY gained 1.98%. A starting capital of $100,000 at inception on 1/2/2017 would have grown to $158,440 which includes $671 cash and excludes $3,600 spent on fees and slippage. |
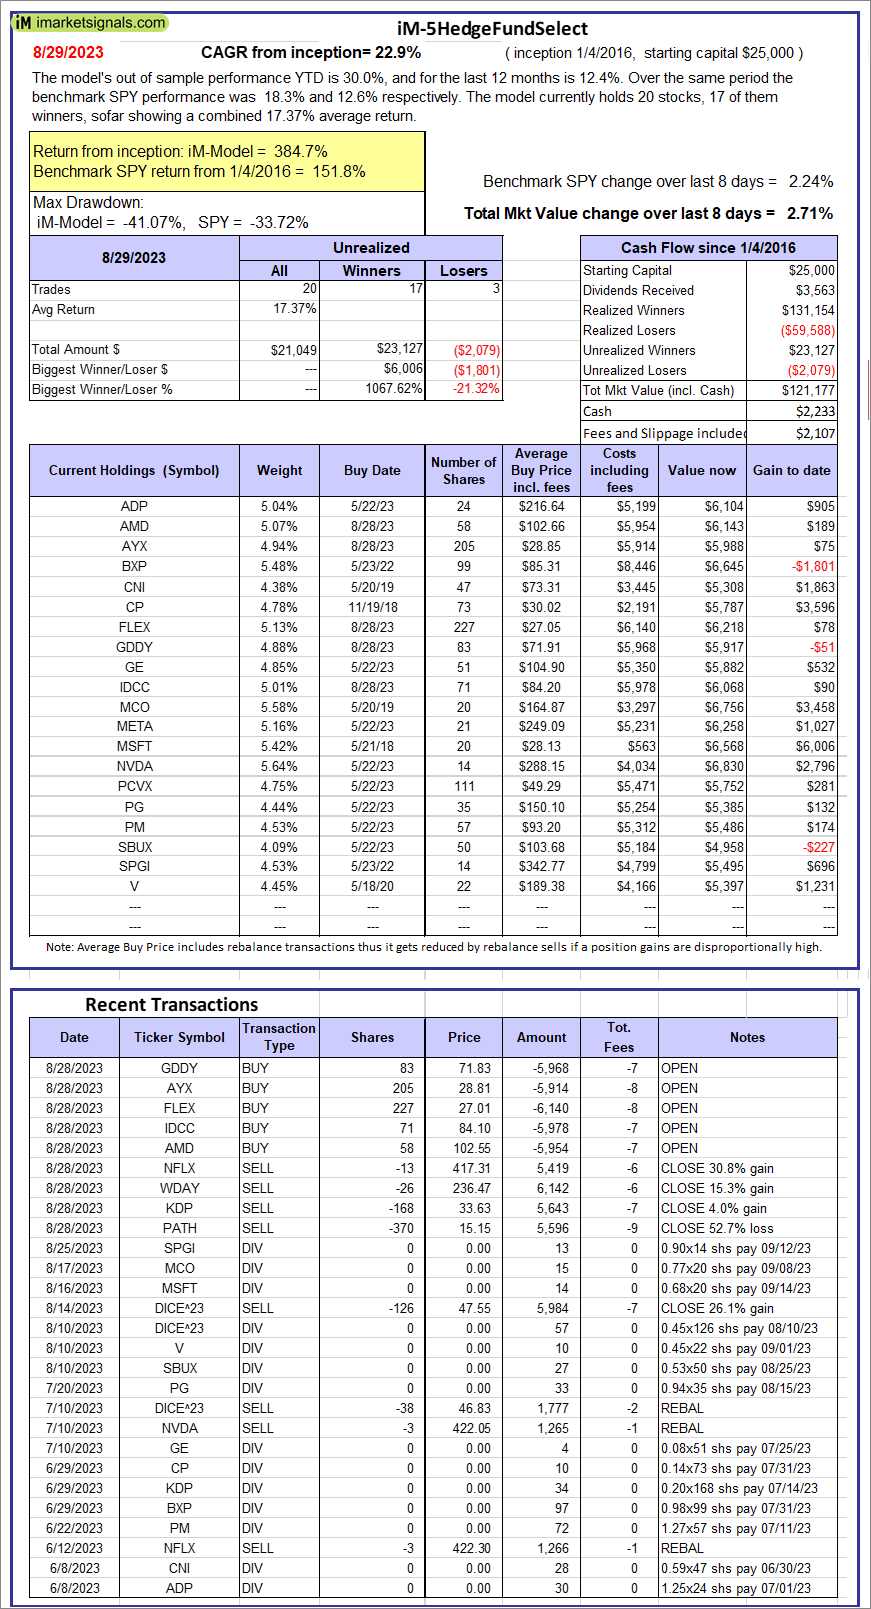 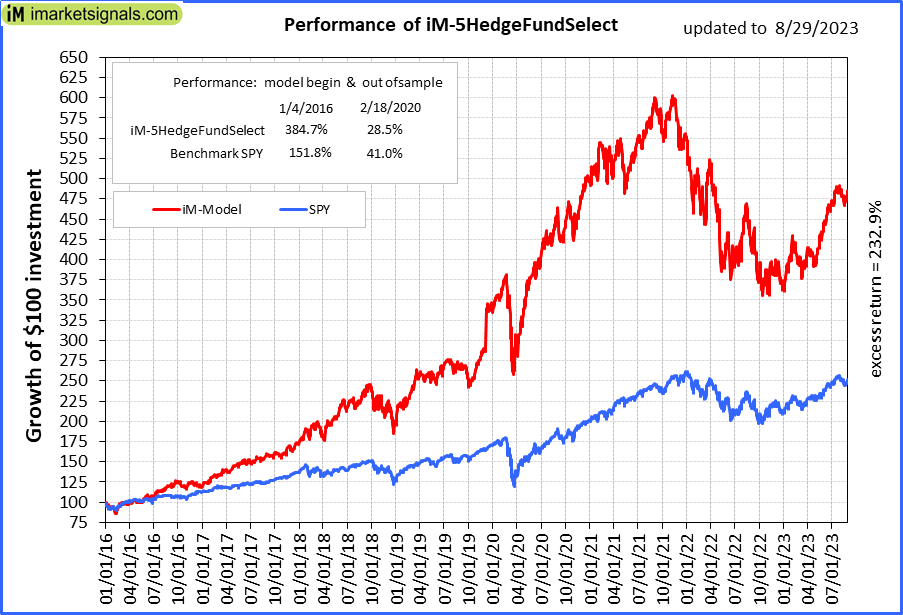 |
iM-5HedgeFundSelect: Since inception, on 1/5/2016, the model gained 384.71% while the benchmark SPY gained 151.77% over the same period. Over the previous week the market value of iM-5HedgeFundSelect gained 2.71% at a time when SPY gained 2.24%. A starting capital of $25,000 at inception on 1/5/2016 would have grown to $121,177 which includes $2,233 cash and excludes $2,107 spent on fees and slippage. |
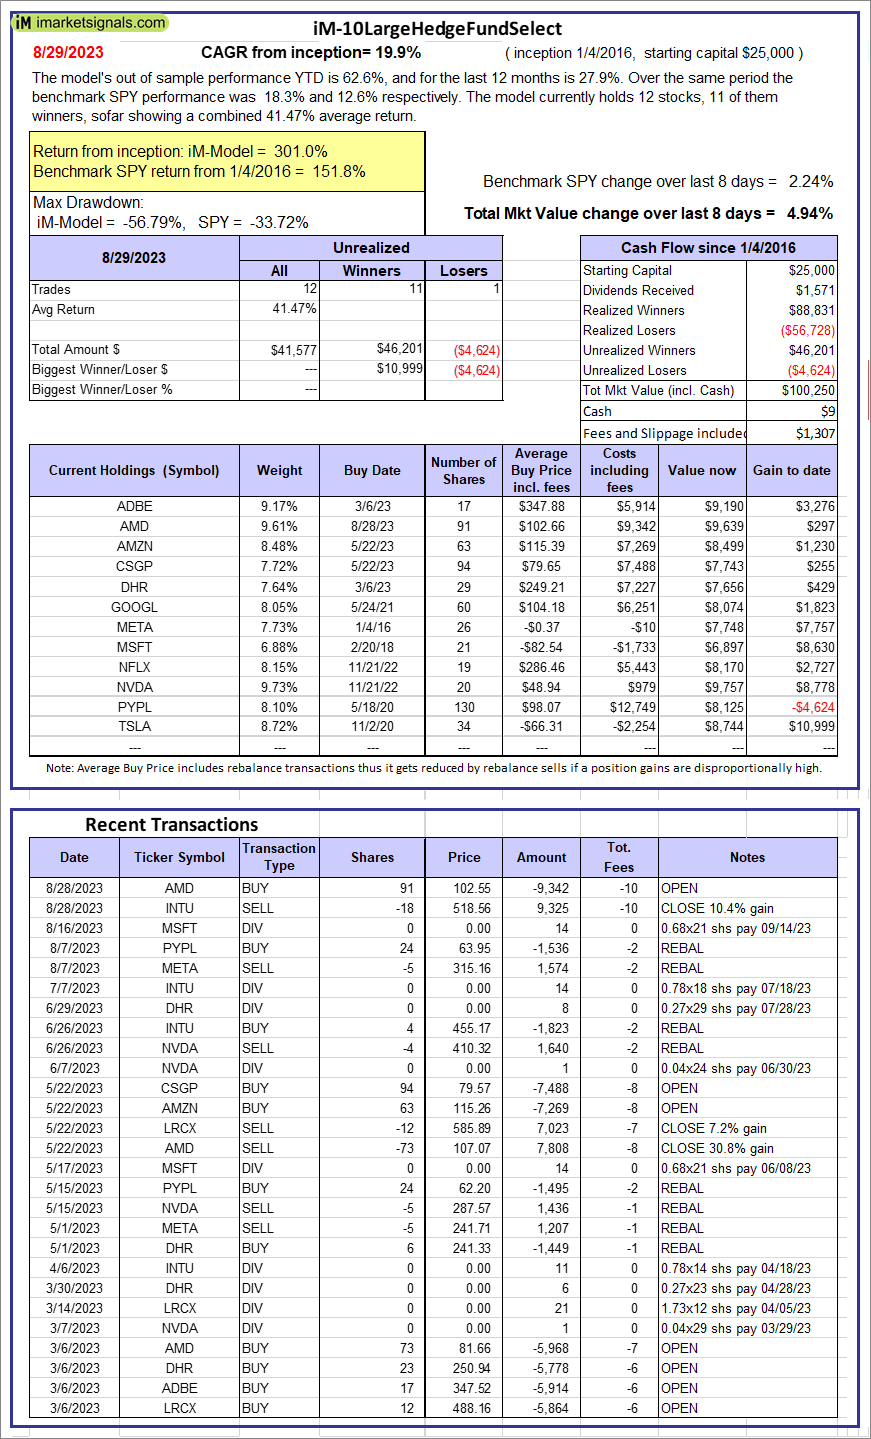 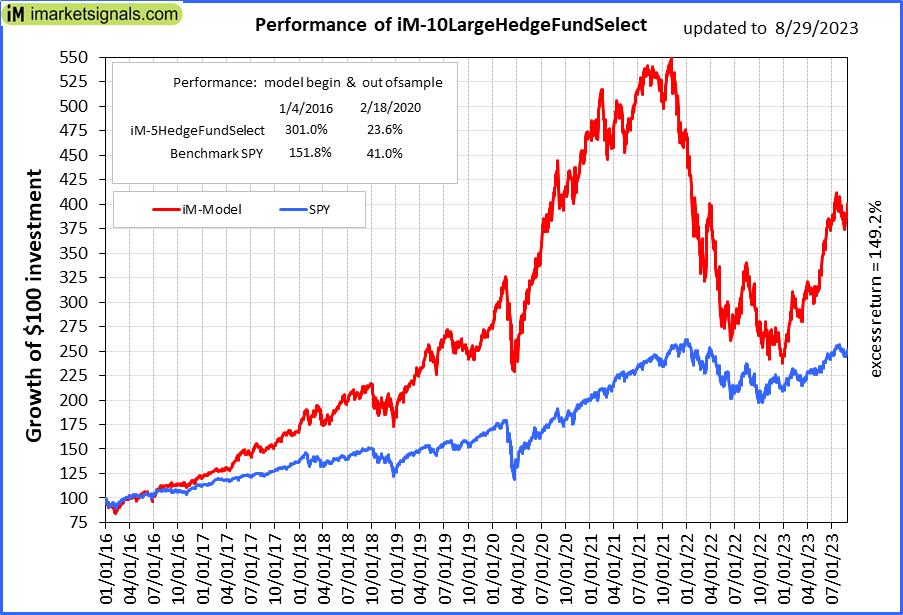 |
iM-10LargeHedgeFundSelect: Since inception, on 1/5/2016, the model gained 301.00% while the benchmark SPY gained 151.77% over the same period. Over the previous week the market value of iM-10LargeHedgeFundSelect gained 4.94% at a time when SPY gained 2.24%. A starting capital of $25,000 at inception on 1/5/2016 would have grown to $100,250 which includes $9 cash and excludes $1,307 spent on fees and slippage. |
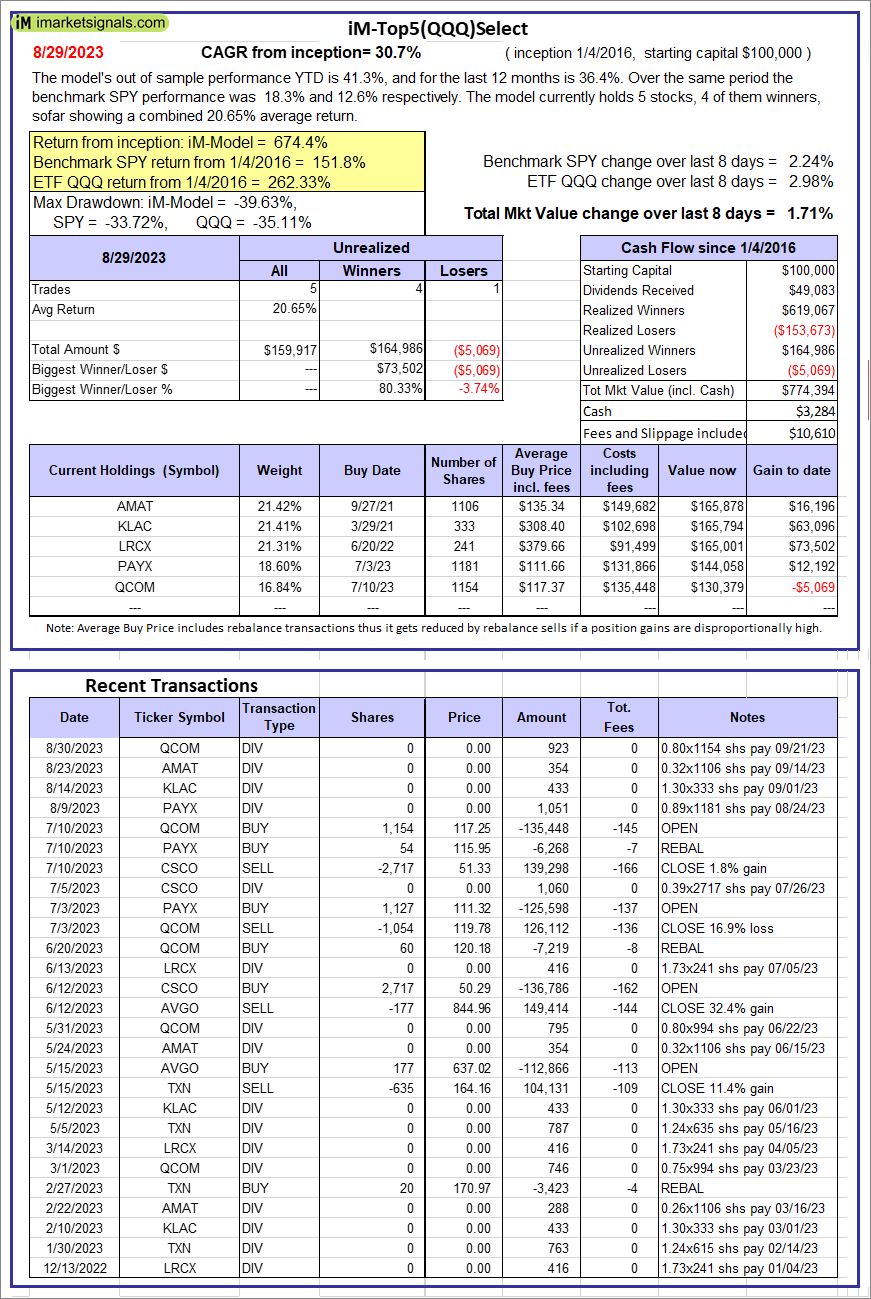 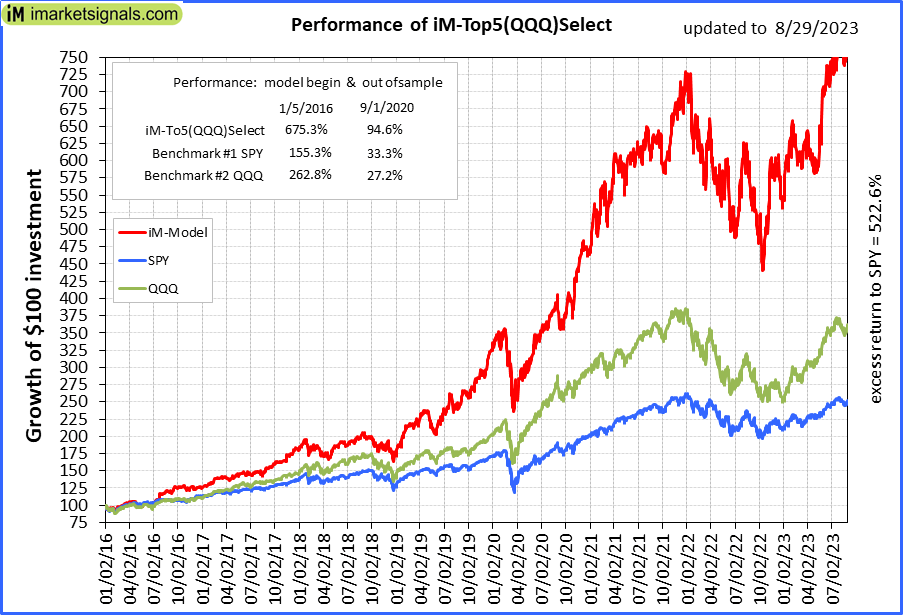 |
iM-Top5(QQQ)Select: Since inception, on 1/5/2016, the model gained 674.39% while the benchmark SPY gained 151.77% over the same period. Over the previous week the market value of iM-Top5(QQQ)Select gained 1.71% at a time when SPY gained 2.24%. A starting capital of $100,000 at inception on 1/5/2016 would have grown to $774,394 which includes $3,284 cash and excludes $10,610 spent on fees and slippage. |
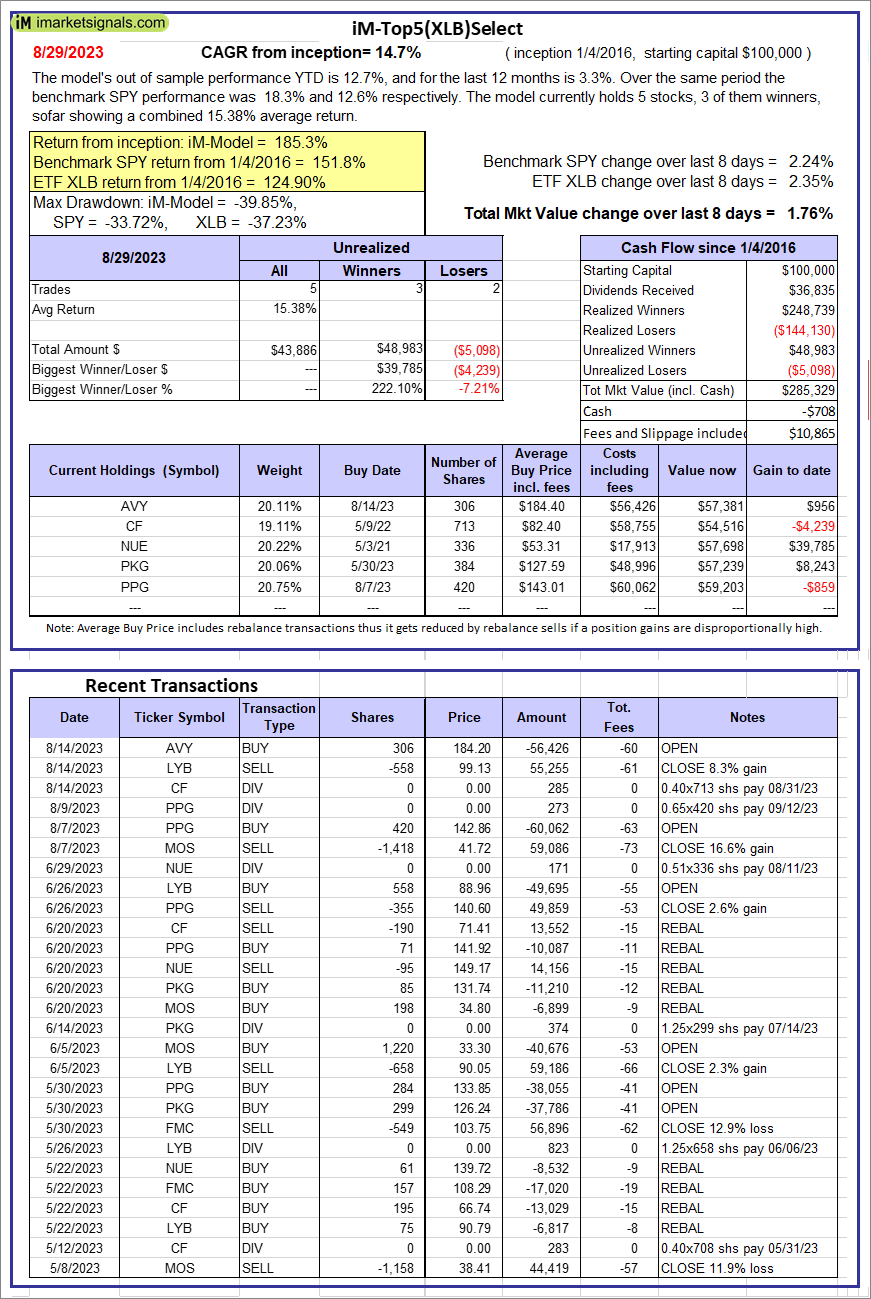 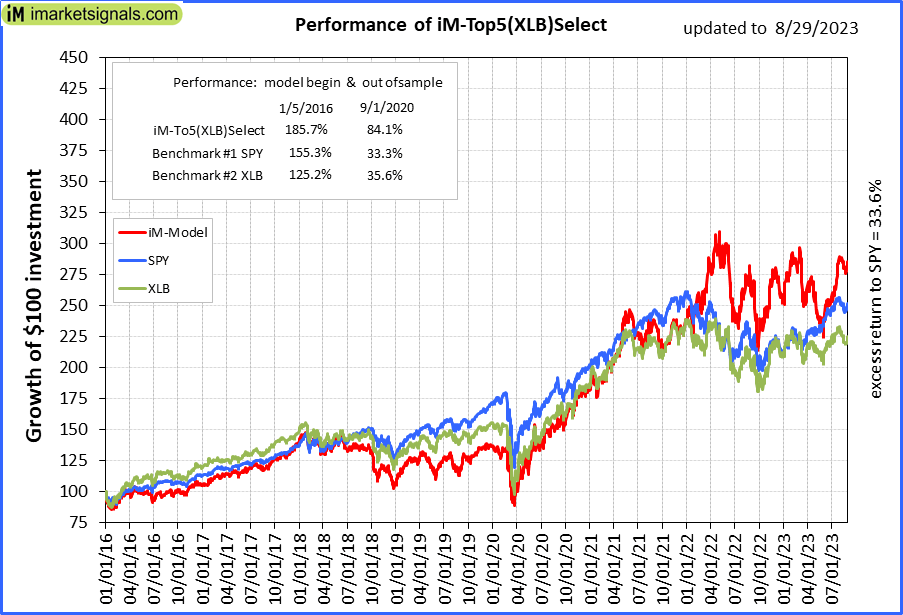 |
iM-Top5(XLB)Select: Since inception, on 1/5/2016, the model gained 185.33% while the benchmark SPY gained 151.77% over the same period. Over the previous week the market value of iM-Top5(XLB)Select gained 1.76% at a time when SPY gained 2.24%. A starting capital of $100,000 at inception on 1/5/2016 would have grown to $285,329 which includes -$708 cash and excludes $10,865 spent on fees and slippage. |
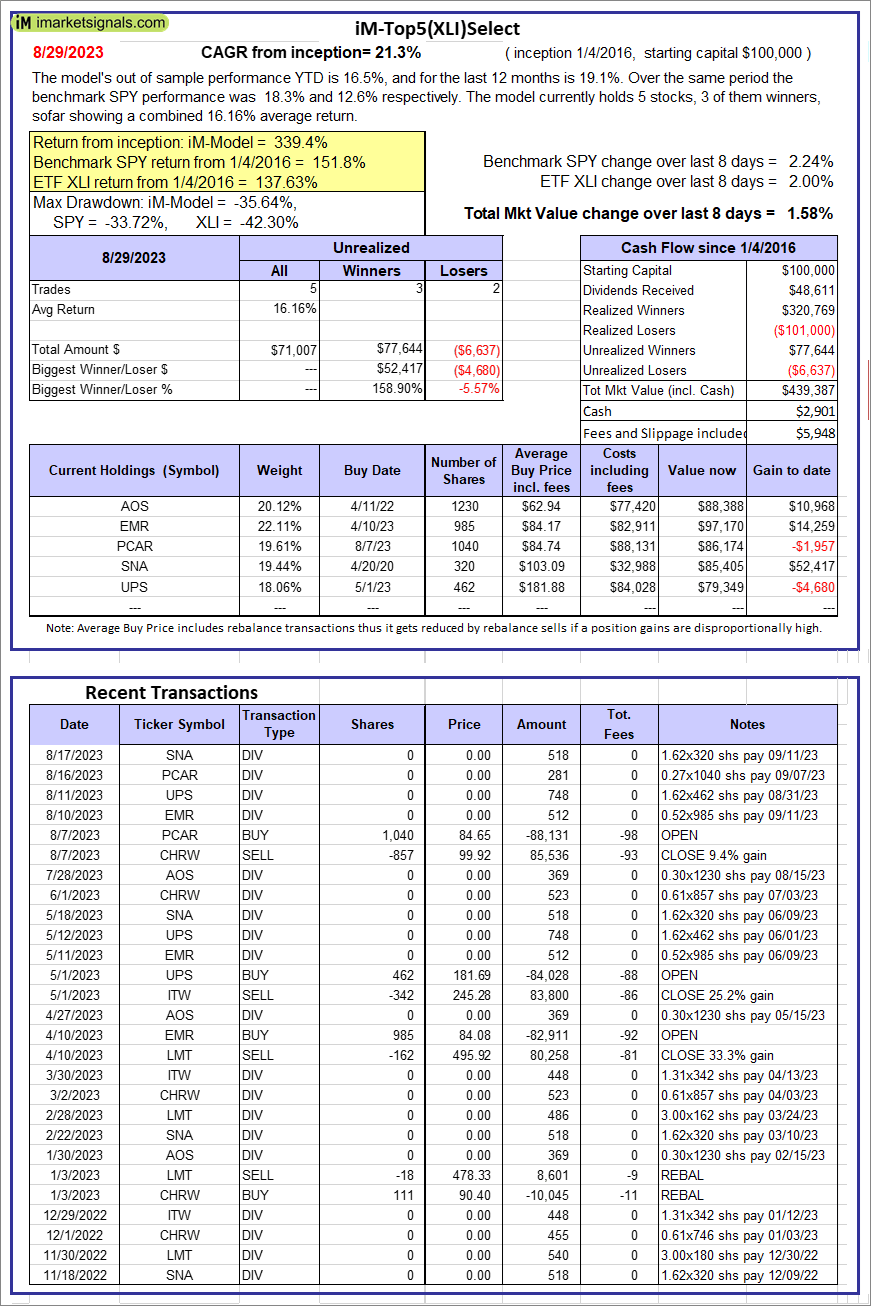 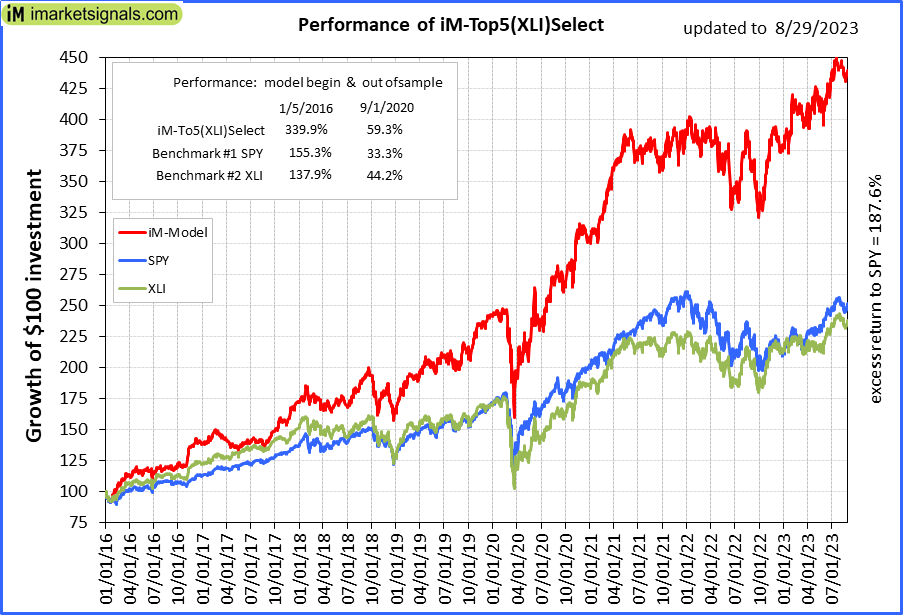 |
iM-Top5(XLI)Select: Since inception, on 1/5/2016, the model gained 339.39% while the benchmark SPY gained 151.77% over the same period. Over the previous week the market value of iM-Top5(XLI)Select gained 1.58% at a time when SPY gained 2.24%. A starting capital of $100,000 at inception on 1/5/2016 would have grown to $439,387 which includes $2,901 cash and excludes $5,948 spent on fees and slippage. |
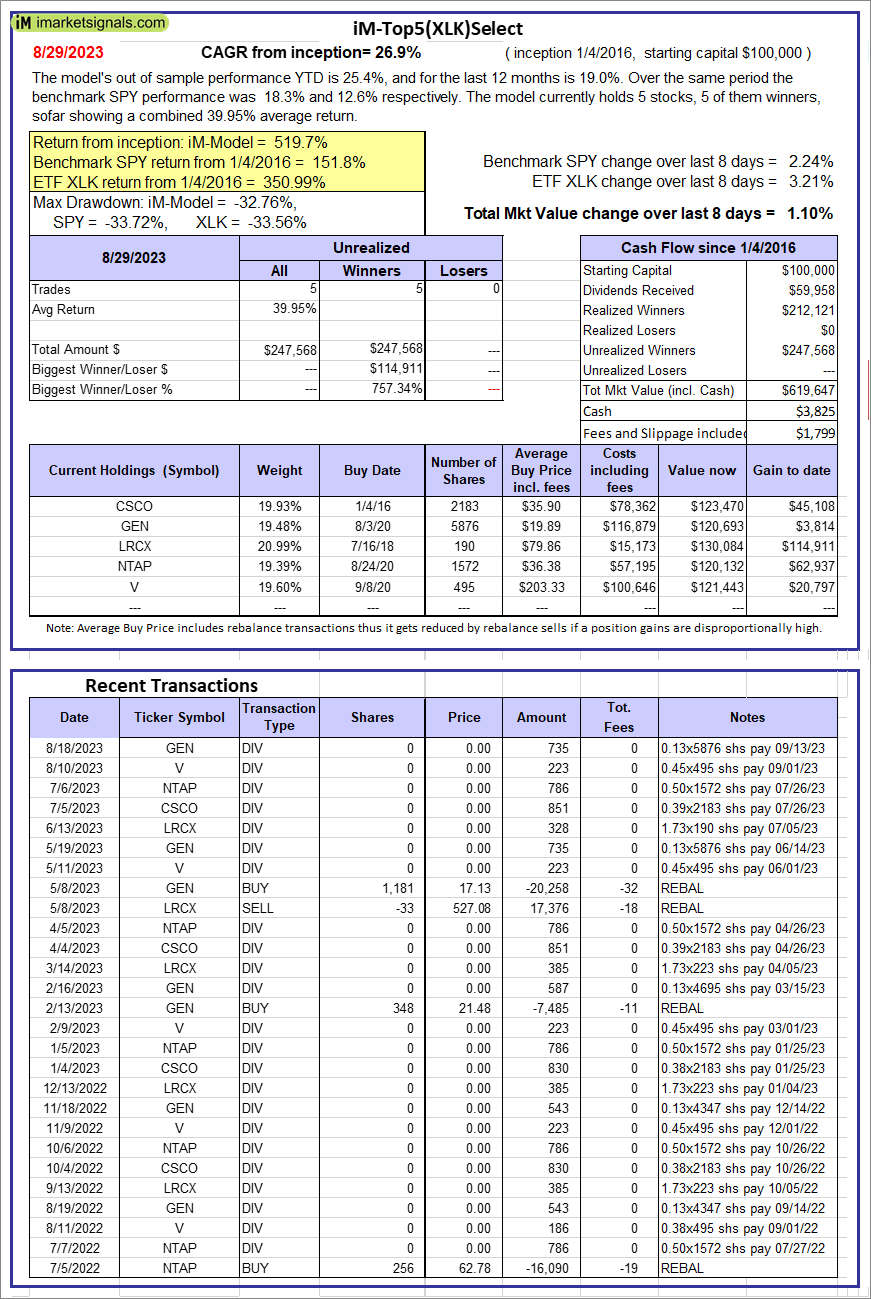 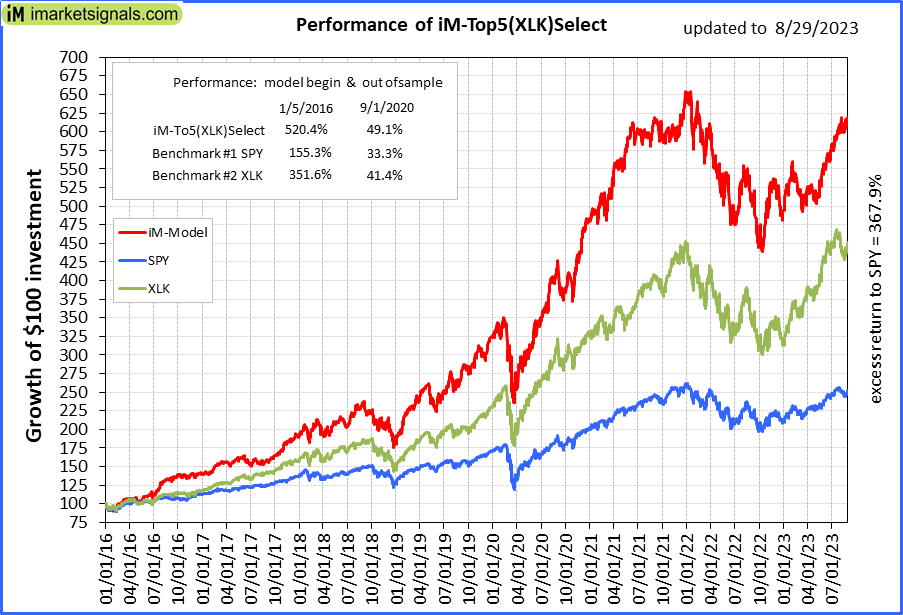 |
iM-Top5(XLK)Select: Since inception, on 1/5/2016, the model gained 519.65% while the benchmark SPY gained 151.77% over the same period. Over the previous week the market value of iM-Top5(XLK)Select gained 1.10% at a time when SPY gained 2.24%. A starting capital of $100,000 at inception on 1/5/2016 would have grown to $619,647 which includes $3,825 cash and excludes $1,799 spent on fees and slippage. |
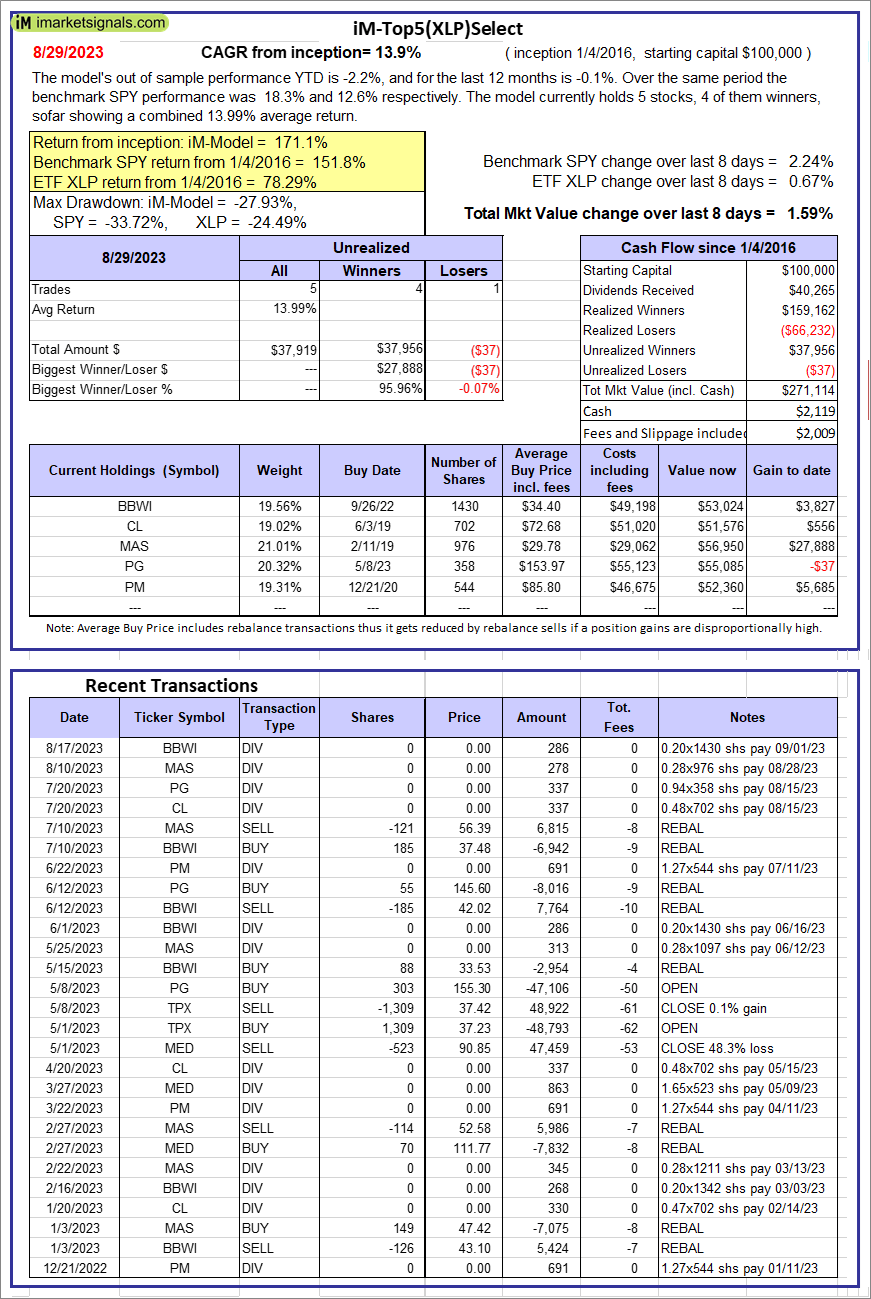 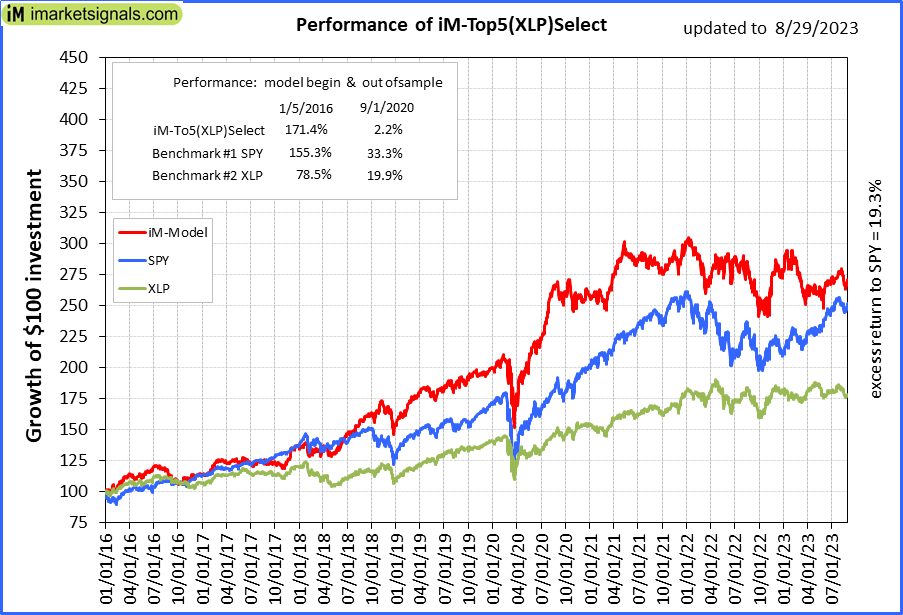 |
iM-Top5(XLP)Select: Since inception, on 1/5/2016, the model gained 171.11% while the benchmark SPY gained 151.77% over the same period. Over the previous week the market value of iM-Top5(XLP)Select gained 1.59% at a time when SPY gained 2.24%. A starting capital of $100,000 at inception on 1/5/2016 would have grown to $271,114 which includes $2,119 cash and excludes $2,009 spent on fees and slippage. |
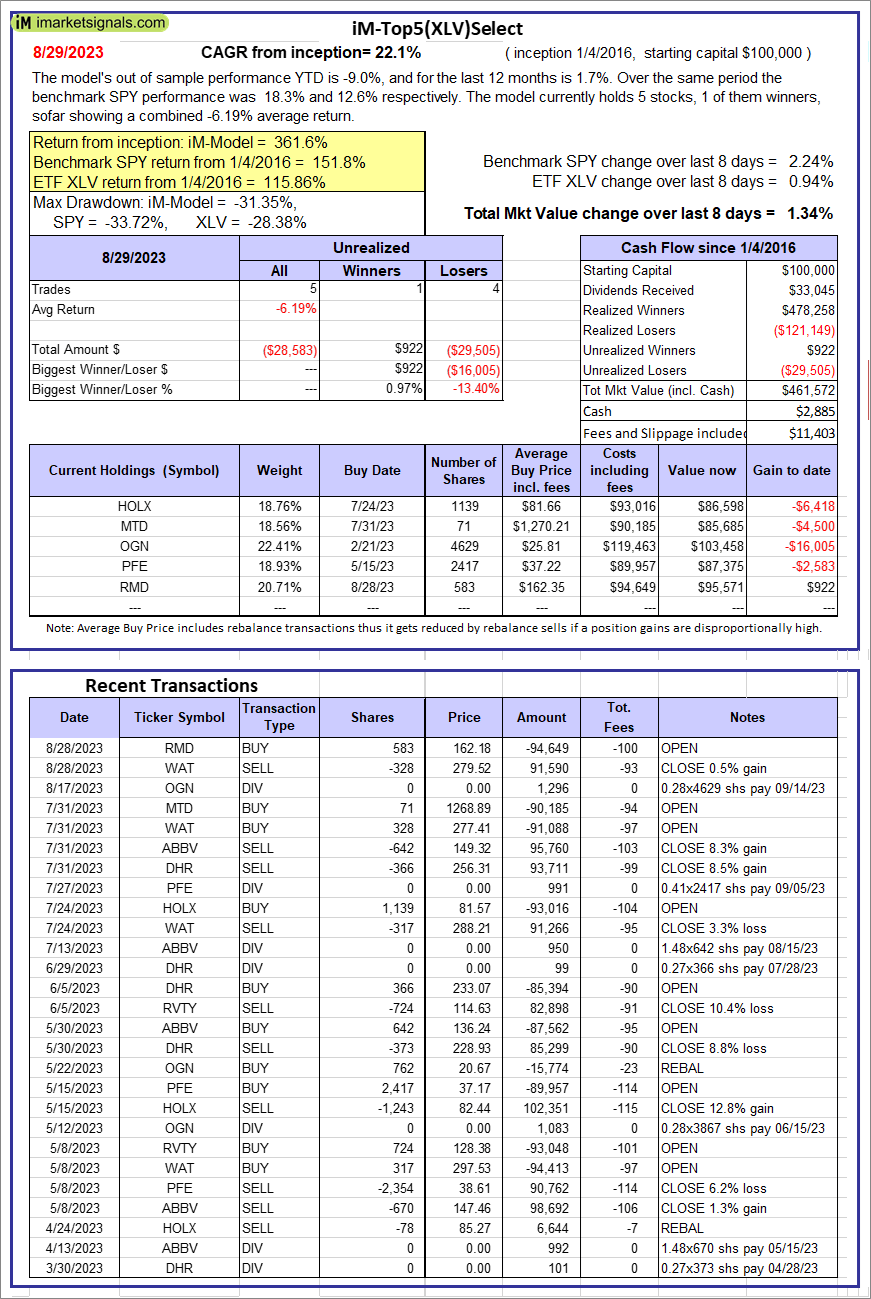 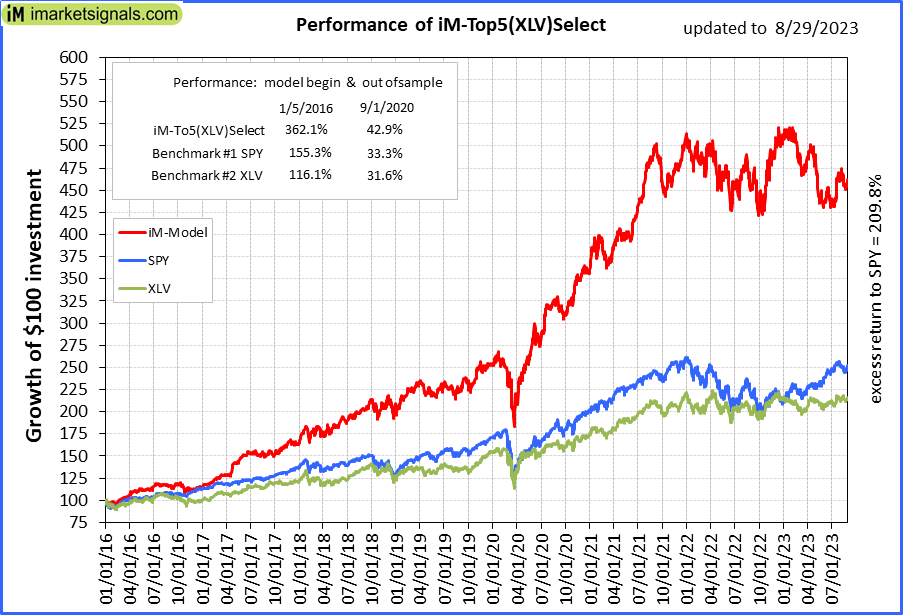 |
iM-Top5(XLV)Select: Since inception, on 1/5/2016, the model gained 361.57% while the benchmark SPY gained 151.77% over the same period. Over the previous week the market value of iM-Top5(XLV)Select gained 1.34% at a time when SPY gained 2.24%. A starting capital of $100,000 at inception on 1/5/2016 would have grown to $461,572 which includes $2,885 cash and excludes $11,403 spent on fees and slippage. |
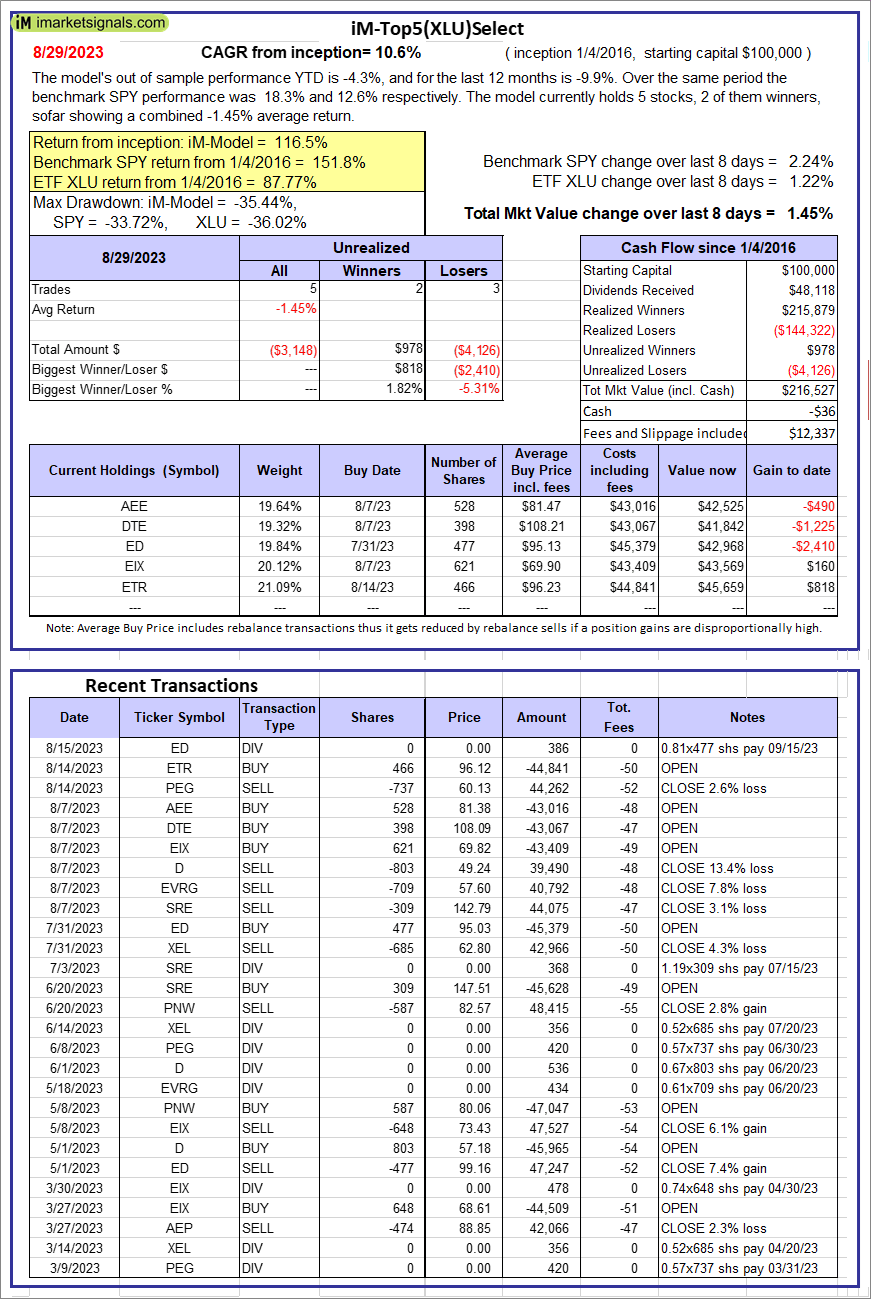 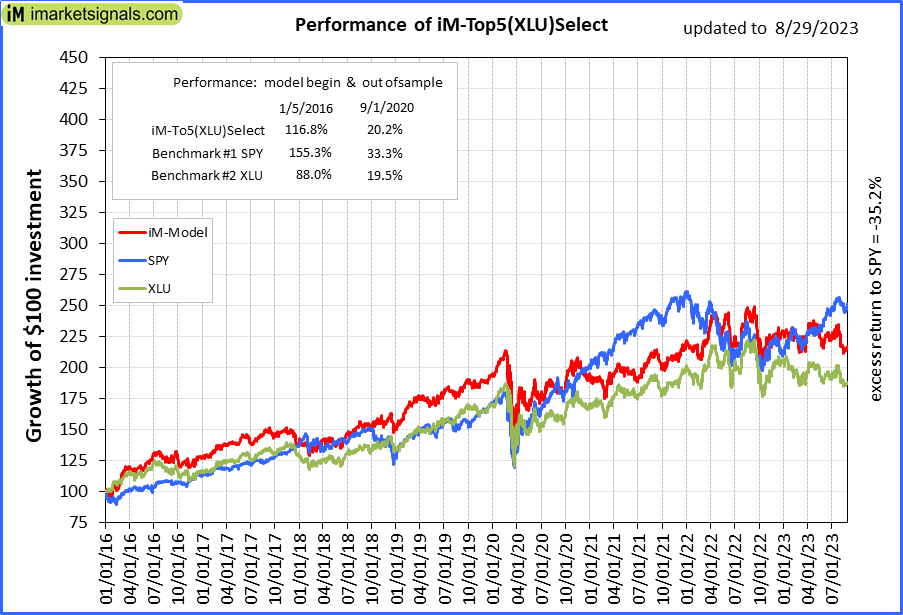 |
iM-Top5(XLU)Select: Since inception, on 1/5/2016, the model gained 116.53% while the benchmark SPY gained 151.77% over the same period. Over the previous week the market value of iM-Top5(XLU)Select gained 1.45% at a time when SPY gained 2.24%. A starting capital of $100,000 at inception on 1/5/2016 would have grown to $216,527 which includes -$36 cash and excludes $12,337 spent on fees and slippage. |
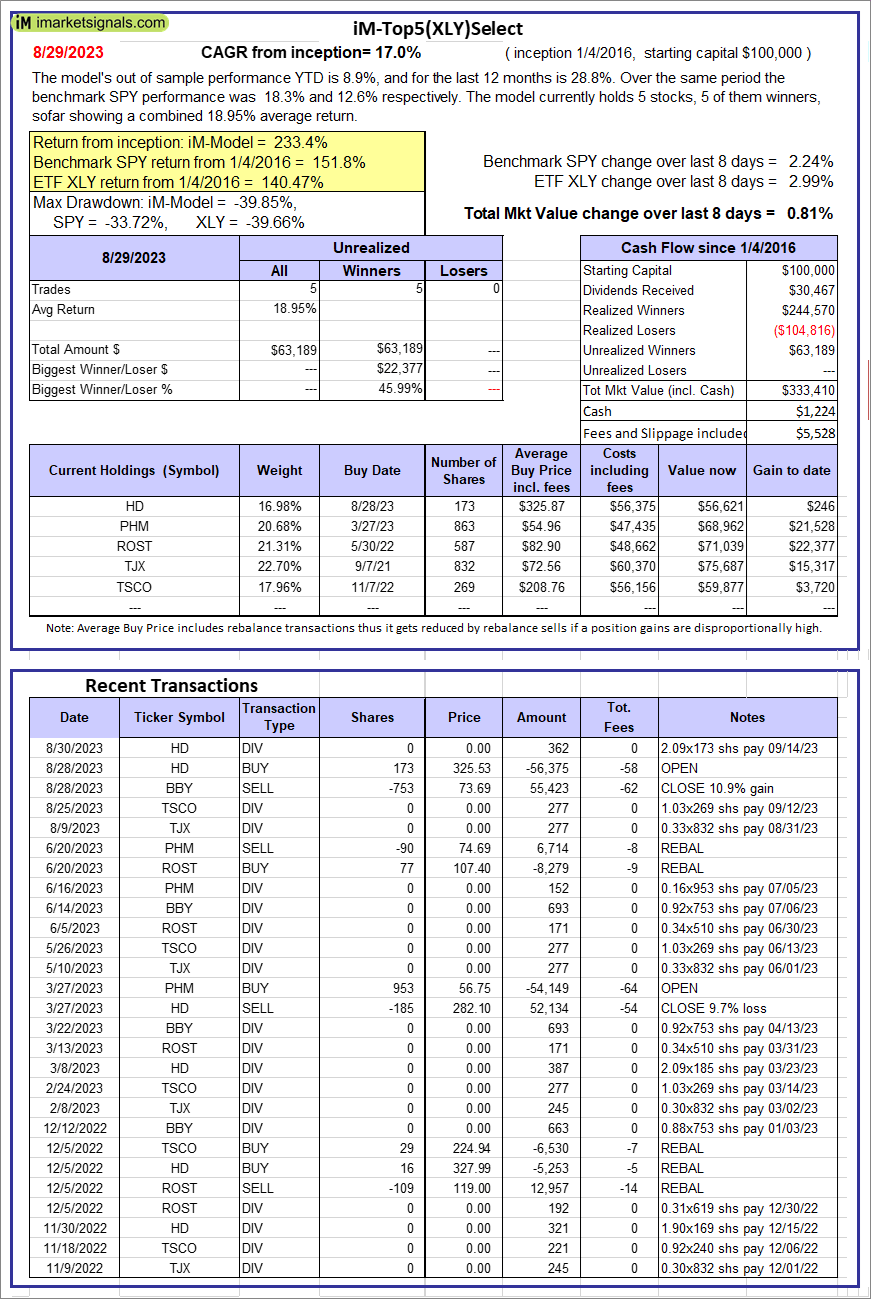 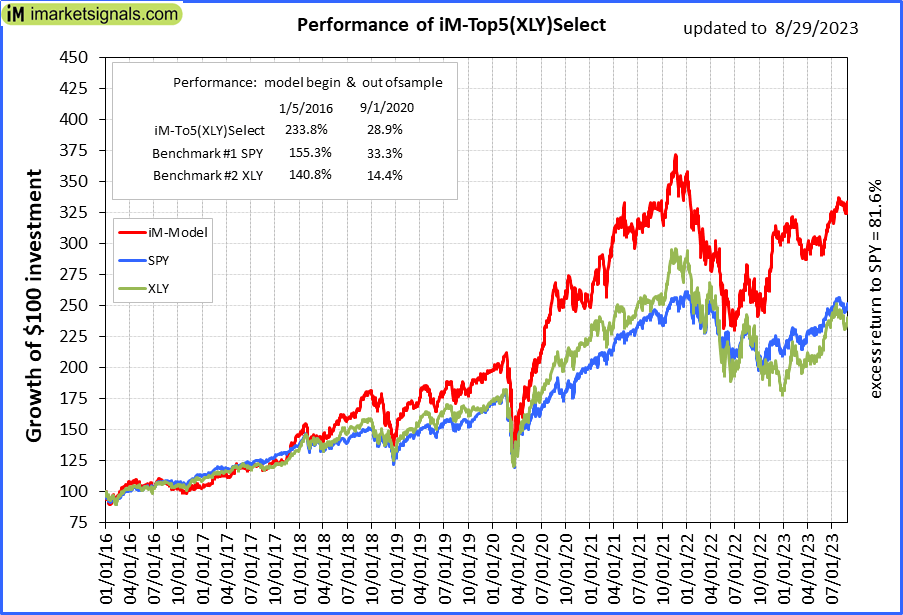 |
iM-Top5(XLY)Select: Since inception, on 1/5/2016, the model gained 233.41% while the benchmark SPY gained 151.77% over the same period. Over the previous week the market value of iM-Top5(XLY)Select gained 0.81% at a time when SPY gained 2.24%. A starting capital of $100,000 at inception on 1/5/2016 would have grown to $333,410 which includes $1,224 cash and excludes $5,528 spent on fees and slippage. |
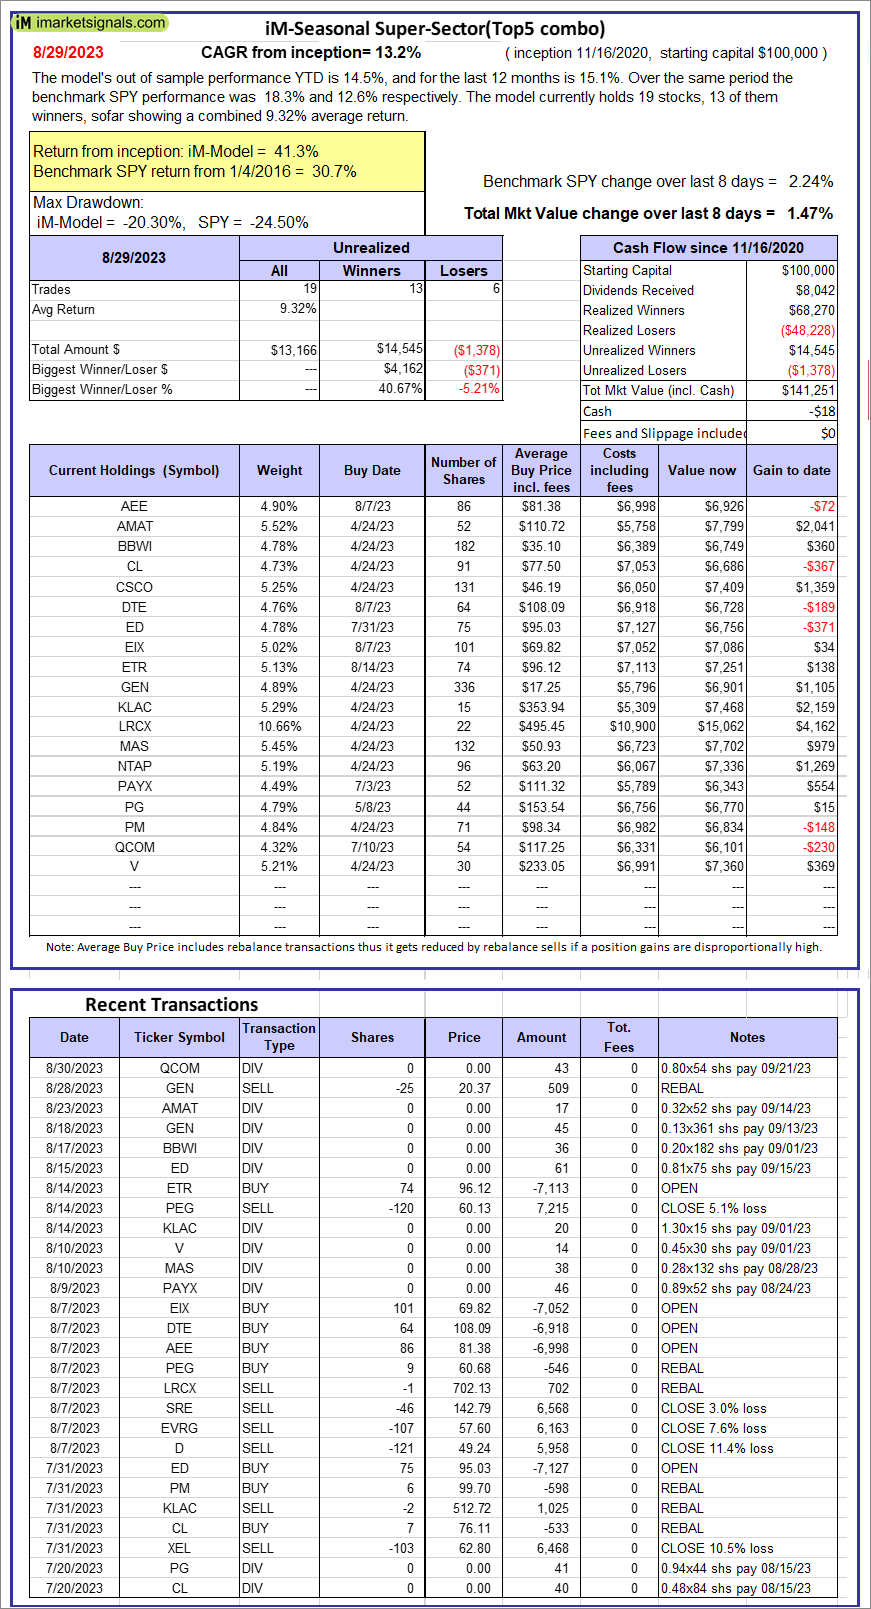 |
iM-Seasonal Super-Sectors (Top5 combo) : Since inception, on 11/17/2020, the model gained 41.25% while the benchmark SPY gained 30.69% over the same period. Over the previous week the market value of iM-Seasonal Super-Sectors (Top5 combo) gained 1.47% at a time when SPY gained 2.24%. A starting capital of $100,000 at inception on 11/17/2020 would have grown to $141,251 which includes -$18 cash and excludes $00 spent on fees and slippage. |
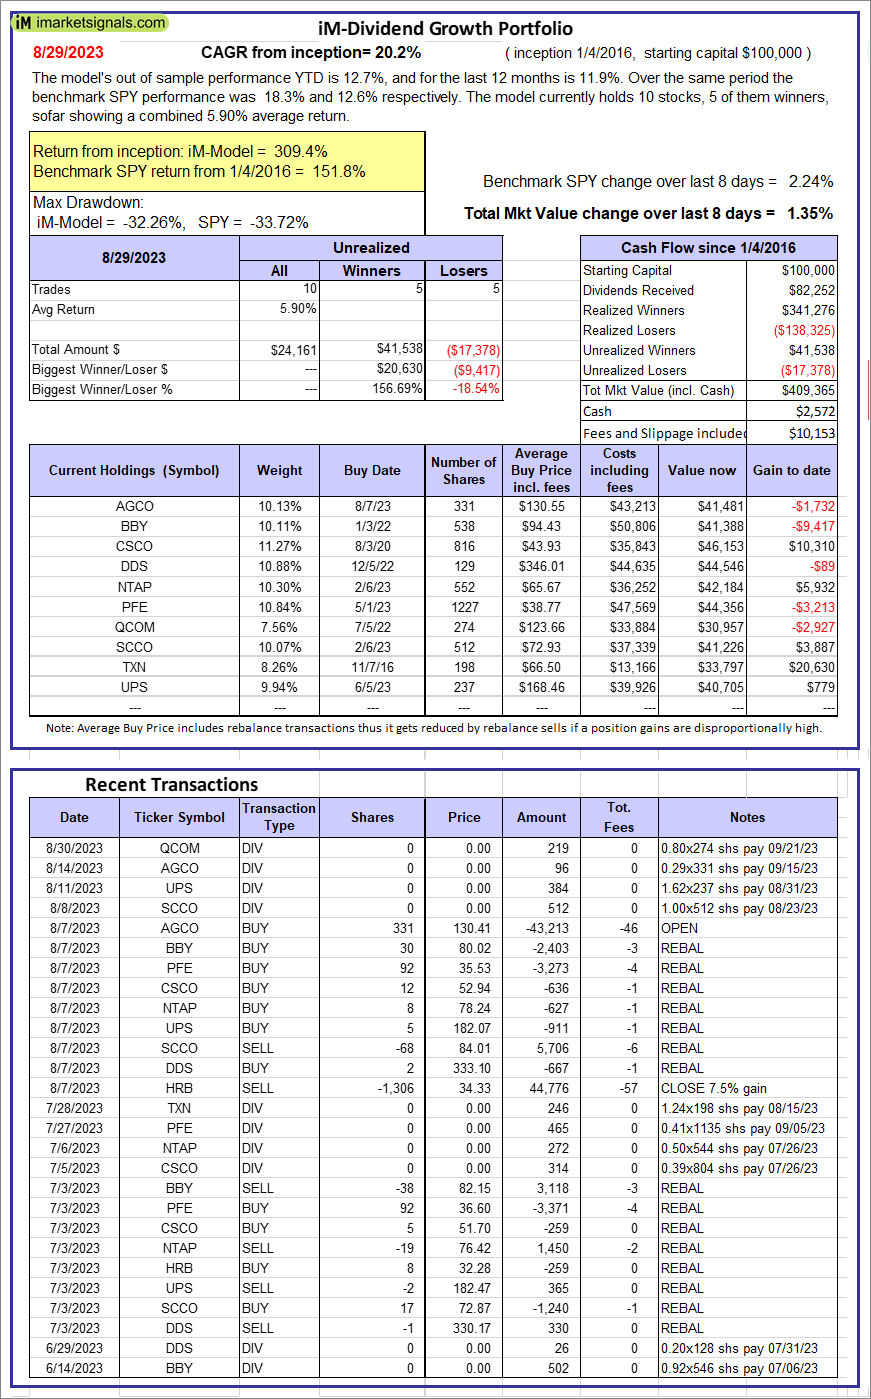 |
iM-Dividend Growth Portfolio: The model’s out of sample performance YTD is 12.7%, and for the last 12 months is 11.9%. Over the same period the benchmark SPY performance was 18.3% and 12.6% respectively. Over the previous week the market value of the iM-Dividend Growth Portfolio gained 1.35% at a time when SPY gained 2.24%. A starting capital of $100,000 at inception on 6/30/2016 would have grown to $409,365 which includes $2,572 cash and excludes $10,153 spent on fees and slippage. |
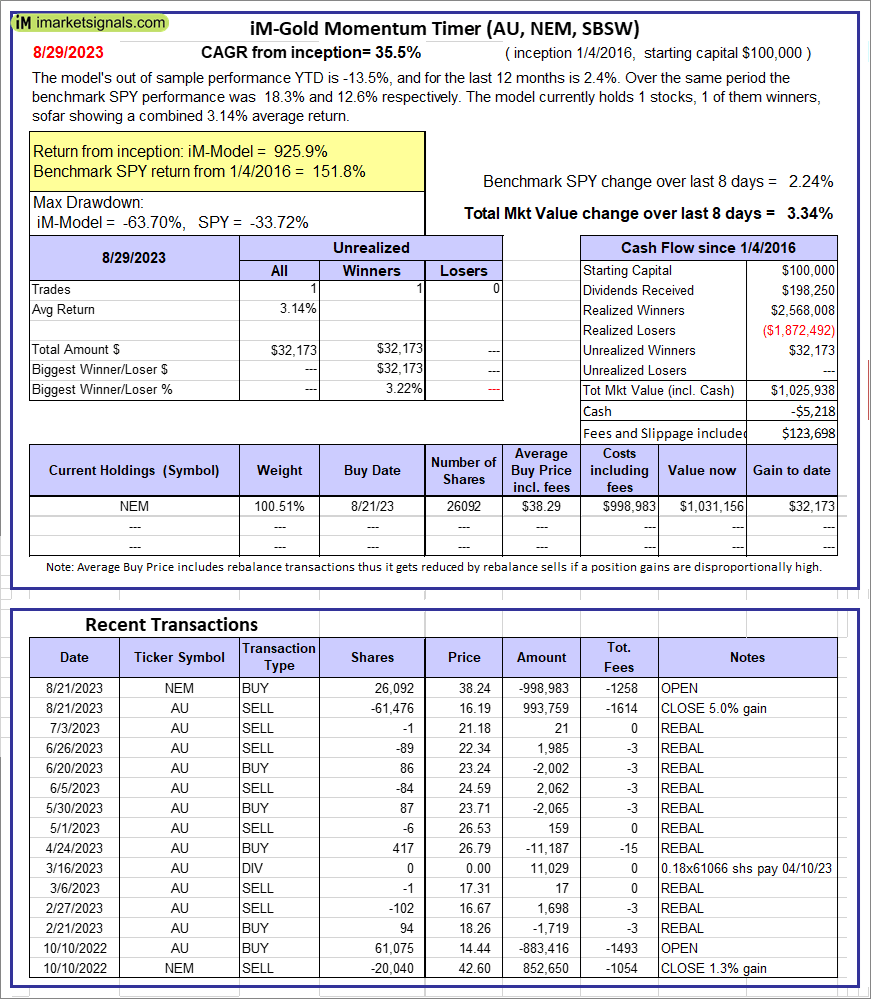 |
iM-Gold Momentum Timer (AU, NEM, SBSW): The model’s out of sample performance YTD is -13.5%, and for the last 12 months is 2.4%. Over the same period the benchmark SPY performance was 18.3% and 12.6% respectively. Over the previous week the market value of iM-Gold Momentum Timer (AU, NEM, SBSW) gained 3.34% at a time when SPY gained 2.24%. A starting capital of $100,000 at inception on 6/30/2016 would have grown to -$5,218 which includes $123,698 cash and excludes Gain to date spent on fees and slippage. |
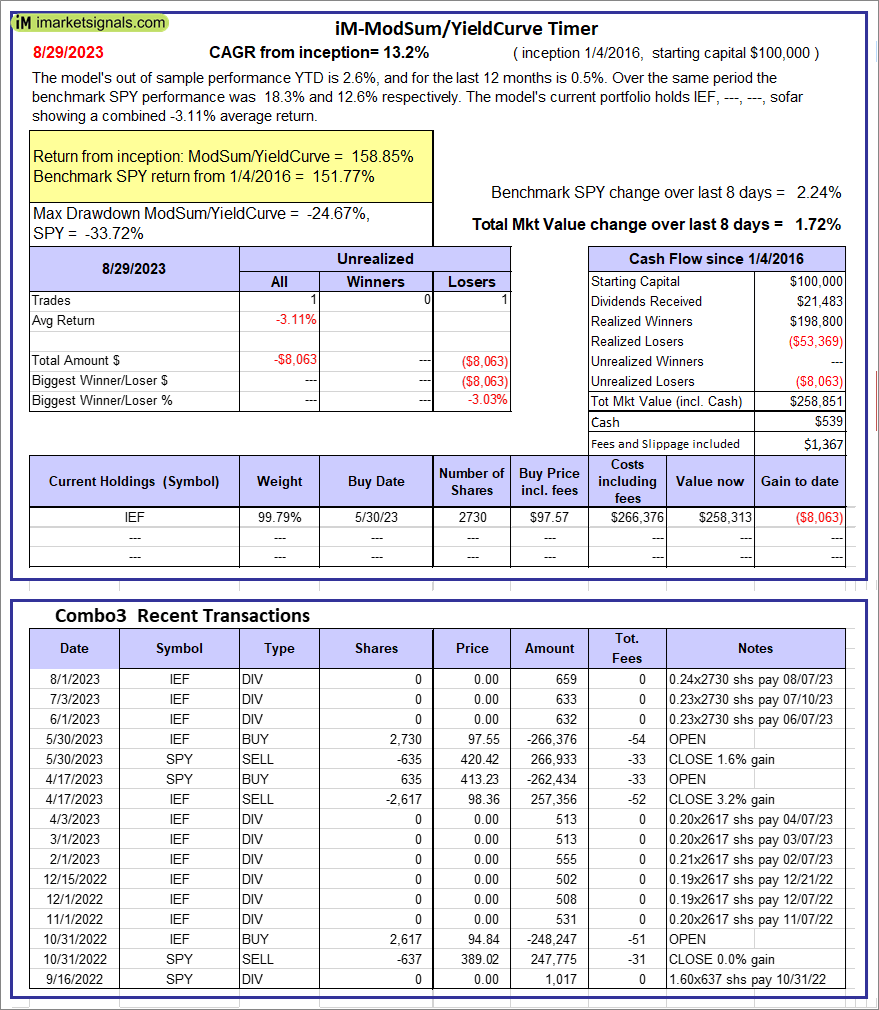 |
iM-ModSum/YieldCurve Timer: The model’s out of sample performance YTD is 2.6%, and for the last 12 months is 0.5%. Over the same period the benchmark SPY performance was 18.3% and 12.6% respectively. Over the previous week the market value of iM-PortSum/YieldCurve Timer gained 1.72% at a time when SPY gained 2.24%. A starting capital of $100,000 at inception on 1/1/2016 would have grown to $258,851 which includes $539 cash and excludes $1,367 spent on fees and slippage. |
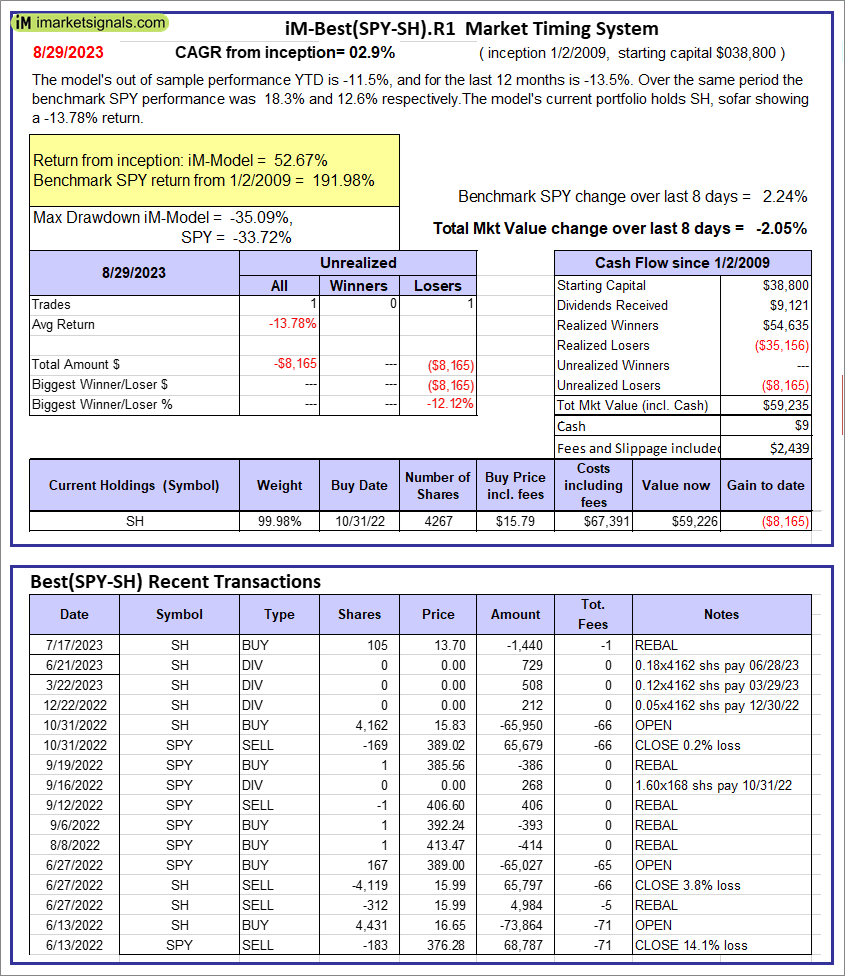 |
iM-Best(SPY-SH).R1: The model’s out of sample performance YTD is -11.5%, and for the last 12 months is -13.5%. Over the same period the benchmark SPY performance was 18.3% and 12.6% respectively. Over the previous week the market value of Best(SPY-SH) gained -2.05% at a time when SPY gained 2.24%. A starting capital of $100,000 at inception on 1/2/2009 would have grown to $59,235 which includes $9 cash and excludes $2,439 spent on fees and slippage. |
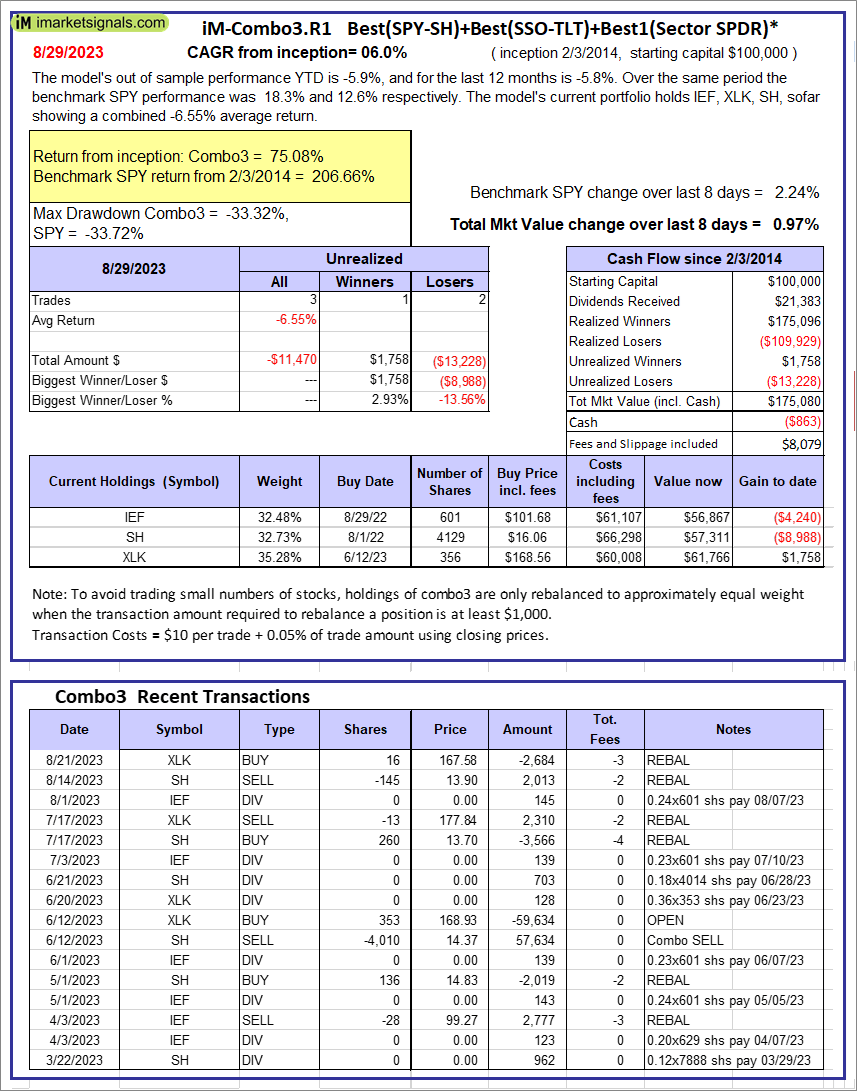 |
iM-Combo3.R1: The model’s out of sample performance YTD is -5.9%, and for the last 12 months is -5.8%. Over the same period the benchmark SPY performance was 18.3% and 12.6% respectively. Over the previous week the market value of iM-Combo3.R1 gained 0.97% at a time when SPY gained 2.24%. A starting capital of $100,000 at inception on 2/3/2014 would have grown to $175,080 which includes -$863 cash and excludes $8,079 spent on fees and slippage. |
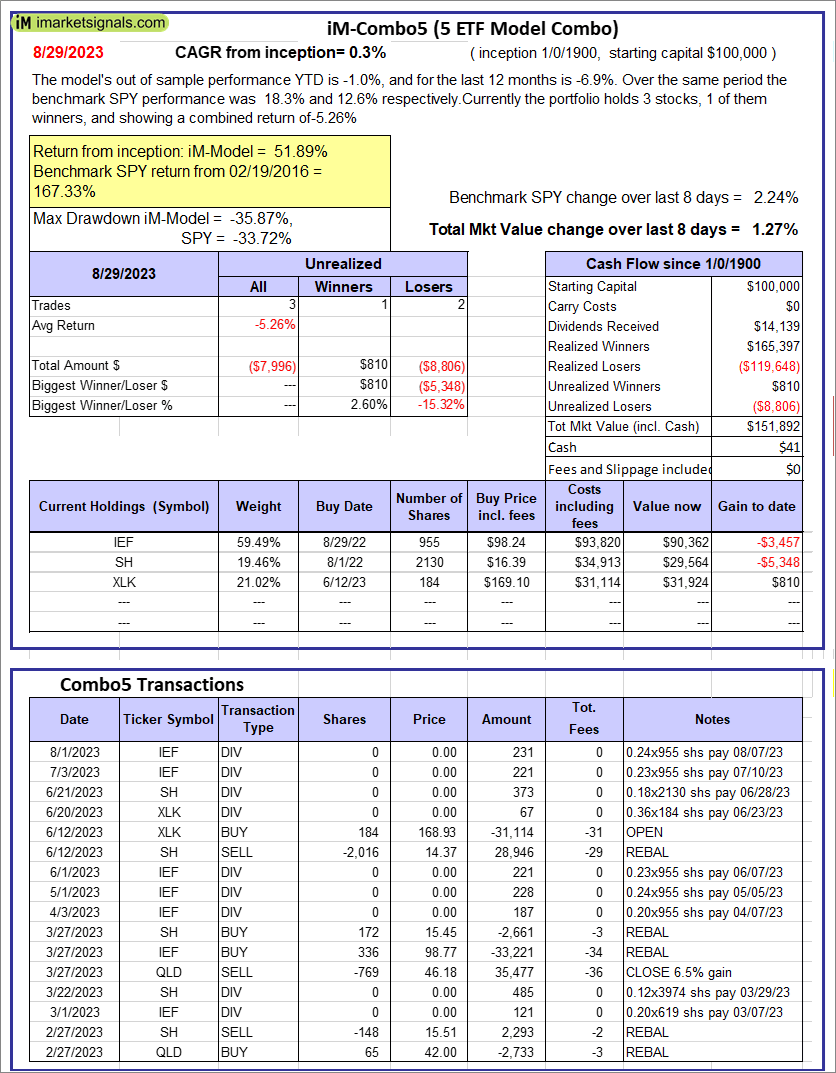 |
iM-Combo5: The model’s out of sample performance YTD is -1.0%, and for the last 12 months is -6.9%. Over the same period the benchmark SPY performance was 18.3% and 12.6% respectively. Over the previous week the market value of iM-Combo5 gained 1.27% at a time when SPY gained 2.24%. A starting capital of $100,000 at inception on 2/22/2016 would have grown to $151,892 which includes $41 cash and excludes $0 spent on fees and slippage. |
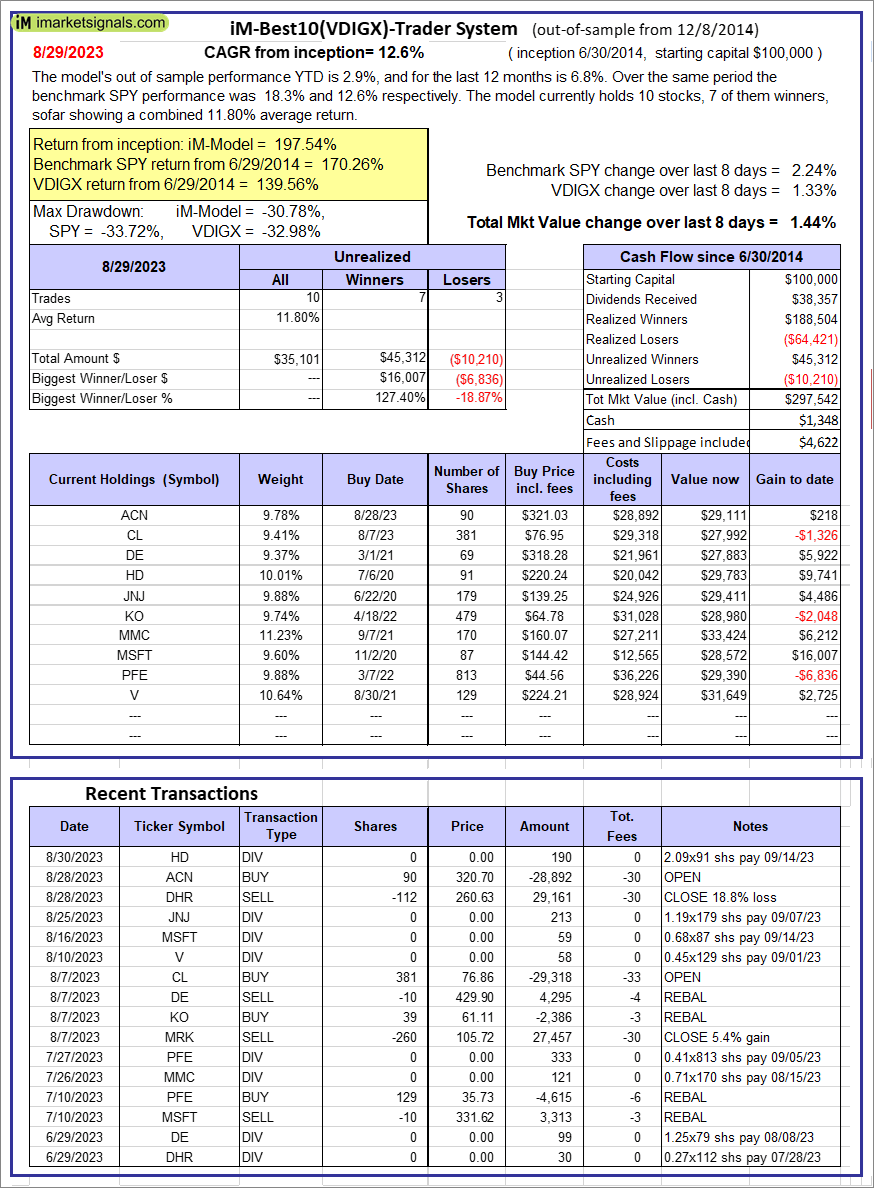 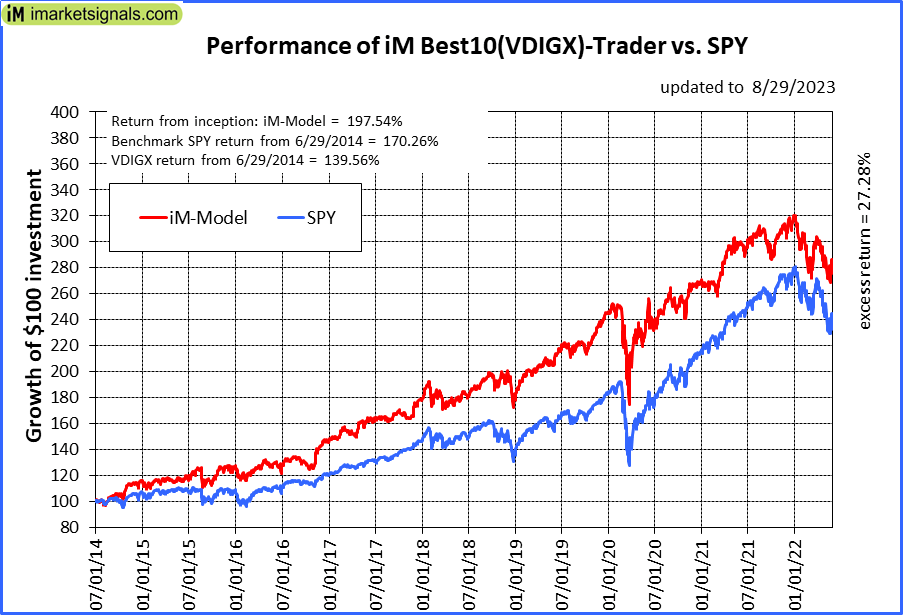 |
iM-Best10(VDIGX)-Trader: The model’s out of sample performance YTD is 2.9%, and for the last 12 months is 6.8%. Over the same period the benchmark SPY performance was 18.3% and 12.6% respectively. Since inception, on 7/1/2014, the model gained 197.54% while the benchmark SPY gained 170.26% and VDIGX gained 139.56% over the same period. Over the previous week the market value of iM-Best10(VDIGX) gained 1.44% at a time when SPY gained 2.24%. A starting capital of $100,000 at inception on 7/1/2014 would have grown to $297,542 which includes $1,348 cash and excludes $4,622 spent on fees and slippage. |
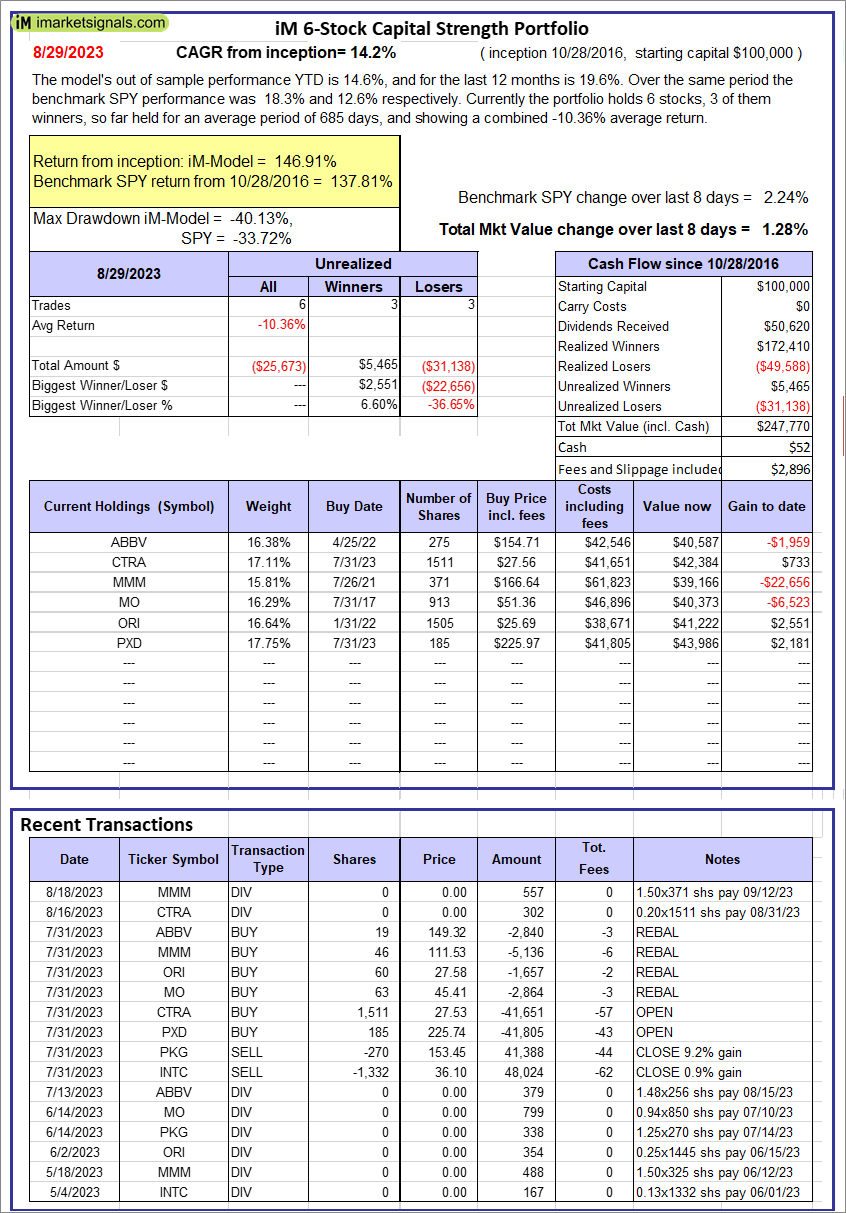 |
iM 6-Stock Capital Strength Portfolio: The model’s out of sample performance YTD is 14.6%, and for the last 12 months is 19.6%. Over the same period the benchmark SPY performance was 18.3% and 12.6% respectively. Over the previous week the market value of the iM 6-Stock Capital Strength Portfolio gained 1.28% at a time when SPY gained 2.24%. A starting capital of $100,000 at inception on 10/28/2016 would have grown to $247,770 which includes $52 cash and excludes $2,896 spent on fees and slippage. |
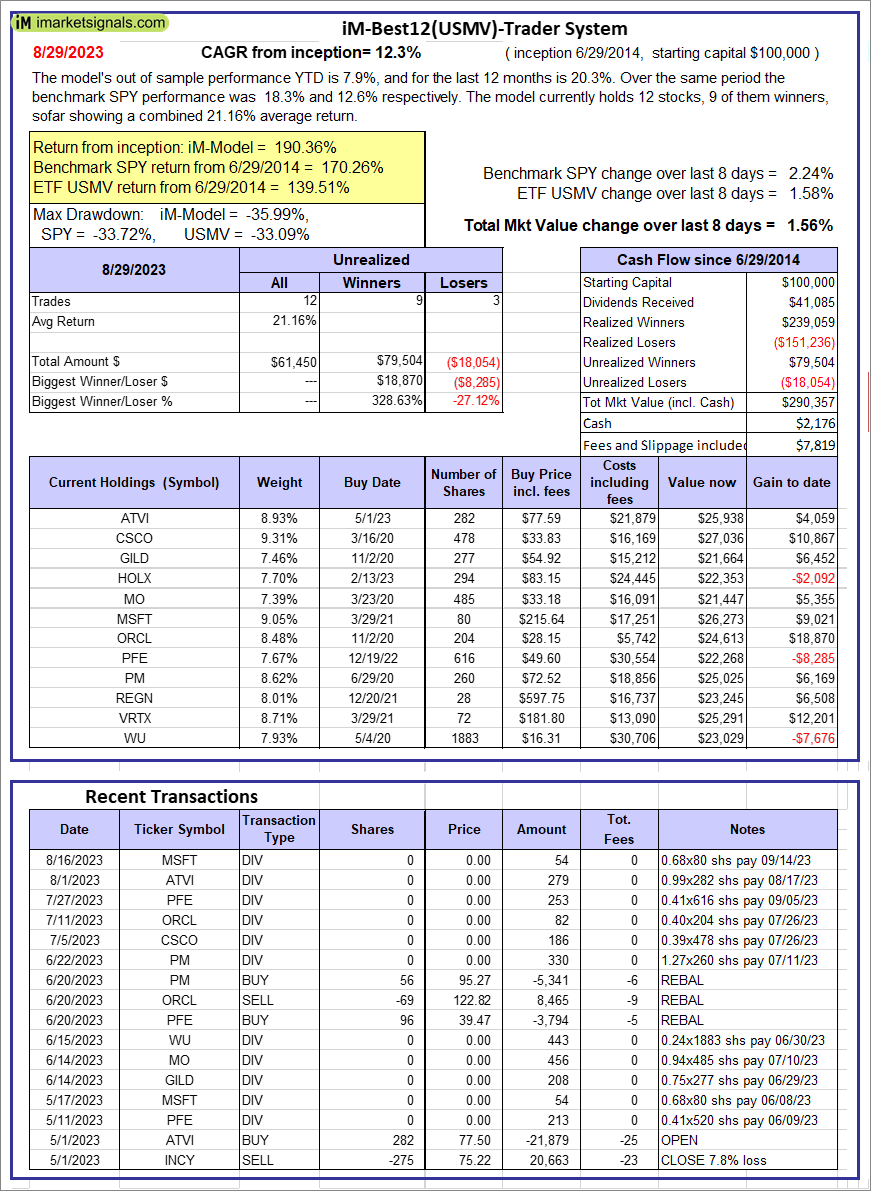 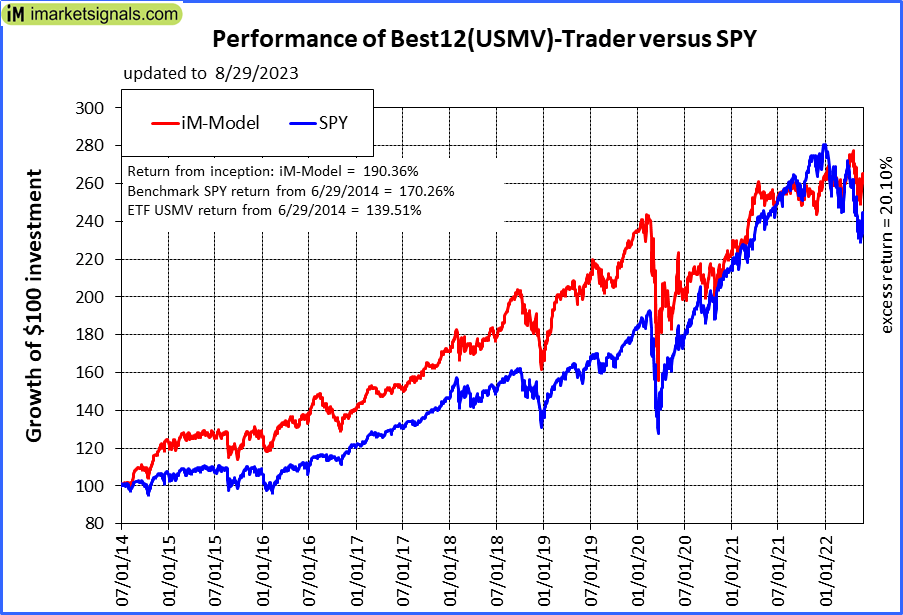 |
iM-Best12(USMV)-Trader: The model’s out of sample performance YTD is 7.9%, and for the last 12 months is 20.3%. Over the same period the benchmark SPY performance was 18.3% and 12.6% respectively. Since inception, on 6/30/2014, the model gained 190.36% while the benchmark SPY gained 170.26% and the ETF USMV gained 139.51% over the same period. Over the previous week the market value of iM-Best12(USMV)-Trader gained 1.56% at a time when SPY gained 2.24%. A starting capital of $100,000 at inception on 6/30/2014 would have grown to $290,357 which includes $2,176 cash and excludes $7,819 spent on fees and slippage. |
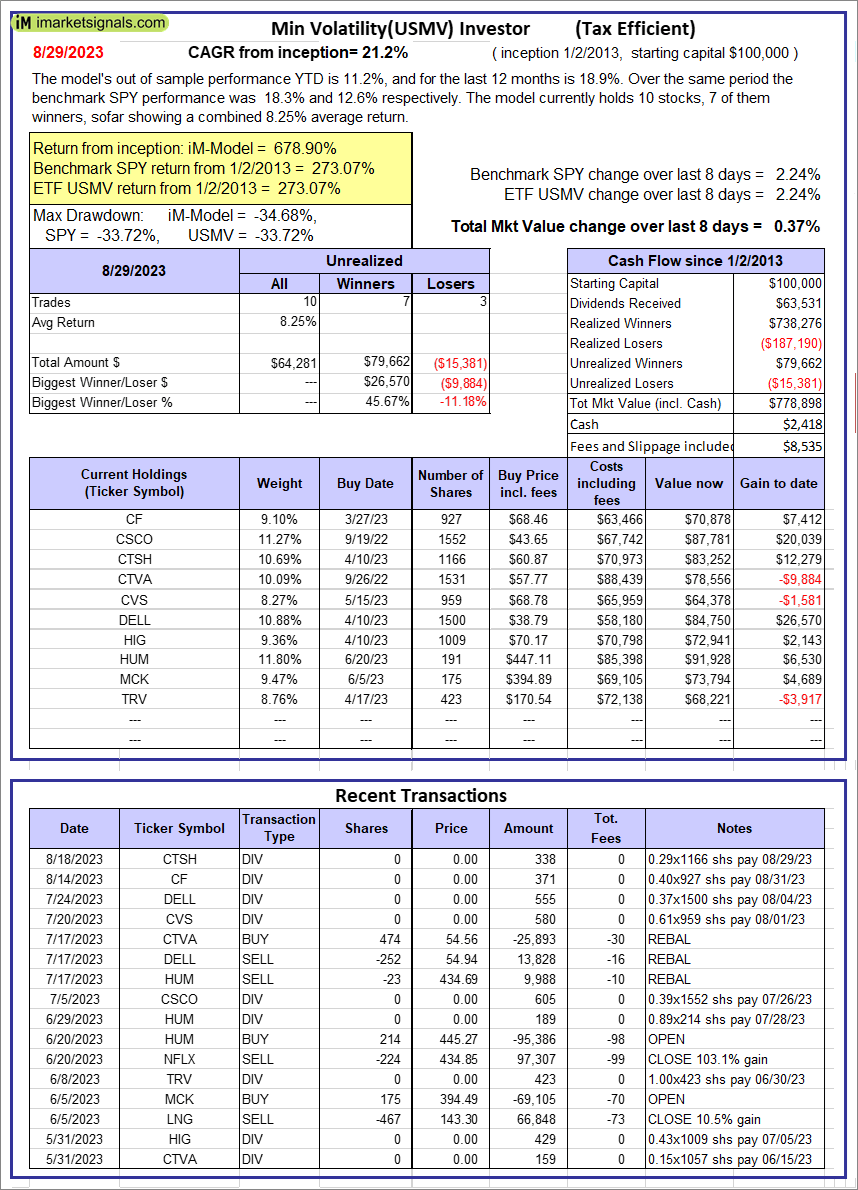 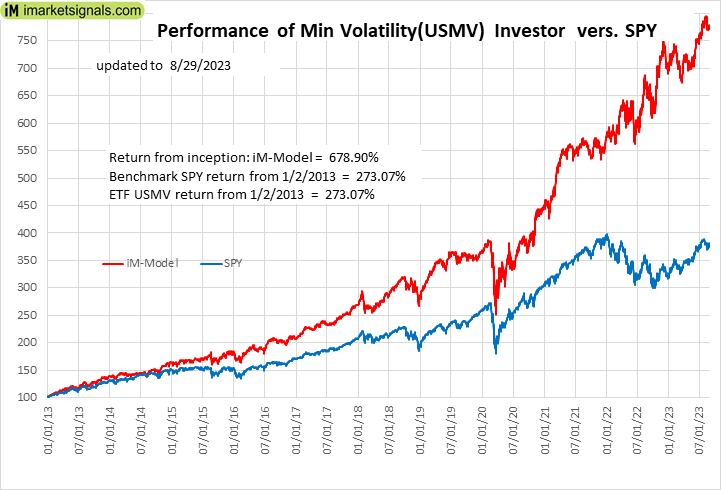 |
iM-Min Volatility(USMV) Investor (Tax Efficient): The model’s out of sample performance YTD is 11.2%, and for the last 12 months is 18.9%. Over the same period the benchmark SPY performance was 18.3% and 12.6% respectively. Since inception, on 1/3/2013, the model gained 678.90% while the benchmark SPY gained 273.07% and the ETF USMV gained 273.07% over the same period. Over the previous week the market value of iM-Best12(USMV)Q1 gained 0.37% at a time when SPY gained 2.24%. A starting capital of $100,000 at inception on 1/3/2013 would have grown to $778,898 which includes $2,418 cash and excludes $8,535 spent on fees and slippage. |
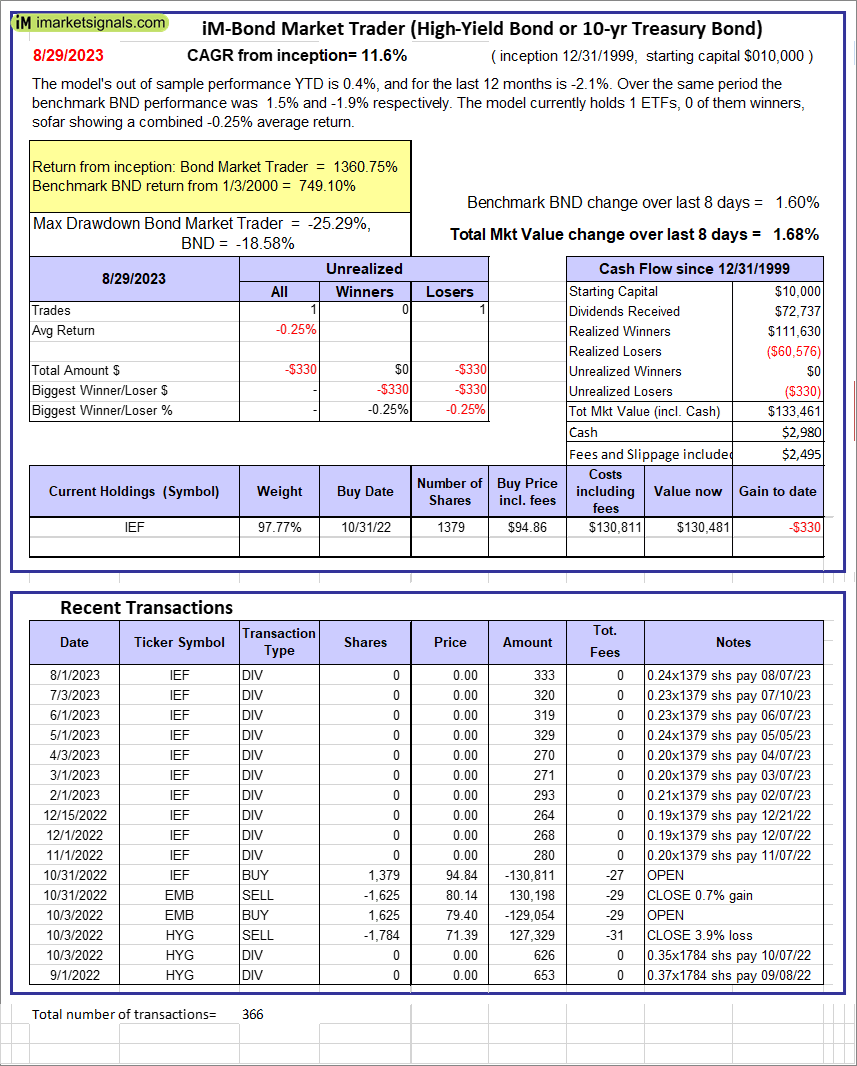 |
iM-Bond Market Trader (High-Yield Bond or 10-yr Treasury Bond): The model’s out of sample performance YTD is 0.4%, and for the last 12 months is -2.1%. Over the same period the benchmark BND performance was 1.5% and -1.9% respectively. Over the previous week the market value of the iM-Bond Market Trader (High-Yield Bond or 10-yr Treasury Bond) gained 1.68% at a time when BND gained 1.60%. A starting capital of $10,000 at inception on 1/3/2000 would have grown to $133,461 which includes $2,980 cash and excludes $2,495 spent on fees and slippage. |
|
|
iM-ModSum/YieldCurve Timer: The model’s out of sample performance YTD is 2.6%, and for the last 12 months is 0.5%. Over the same period the benchmark SPY performance was 18.3% and 12.6% respectively. Over the previous week the market value of iM-PortSum/YieldCurve Timer gained 1.72% at a time when SPY gained 2.24%. A starting capital of $100,000 at inception on 1/1/2016 would have grown to $258,851 which includes $539 cash and excludes $1,367 spent on fees and slippage. |
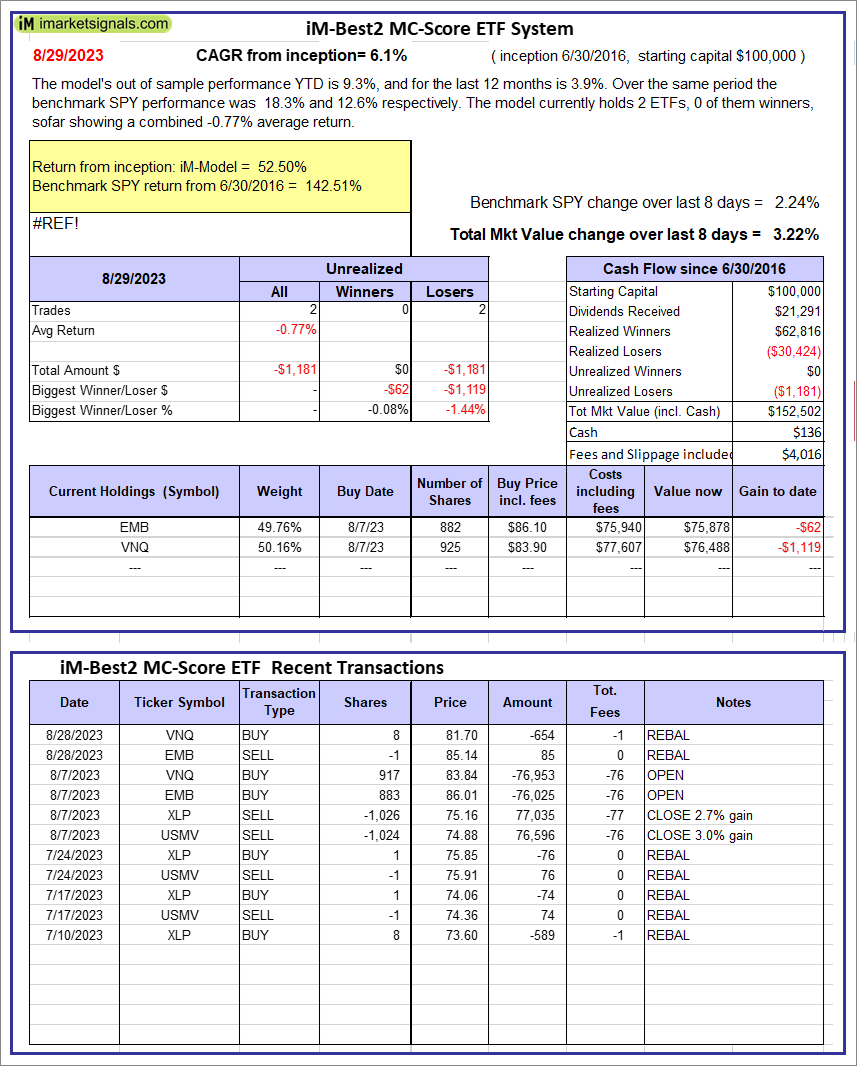 |
iM-Best2 MC-Score ETF System: The model’s out of sample performance YTD is 9.3%, and for the last 12 months is 3.9%. Over the same period the benchmark SPY performance was 18.3% and 12.6% respectively. Over the previous week the market value of the iM-Best2 MC-Score ETF System gained 3.22% at a time when SPY gained 2.24%. A starting capital of $100,000 at inception on 6/30/2016 would have grown to $152,502 which includes $136 cash and excludes $4,016 spent on fees and slippage. |
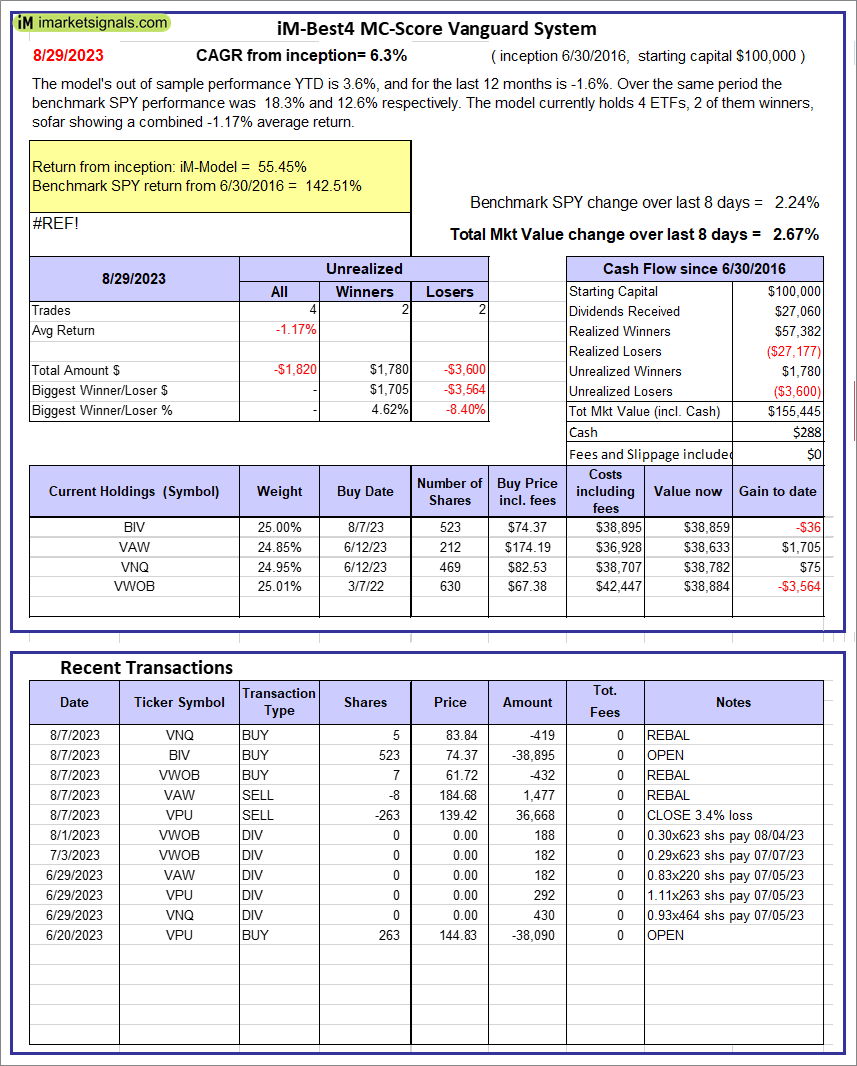 |
iM-Best4 MC-Score Vanguard System: The model’s out of sample performance YTD is 3.6%, and for the last 12 months is -1.6%. Over the same period the benchmark SPY performance was 18.3% and 12.6% respectively. Over the previous week the market value of the iM-Best4 MC-Score Vanguard System gained 2.67% at a time when SPY gained 2.24%. A starting capital of $100,000 at inception on 6/30/2016 would have grown to $155,445 which includes $288 cash and excludes $00 spent on fees and slippage. |
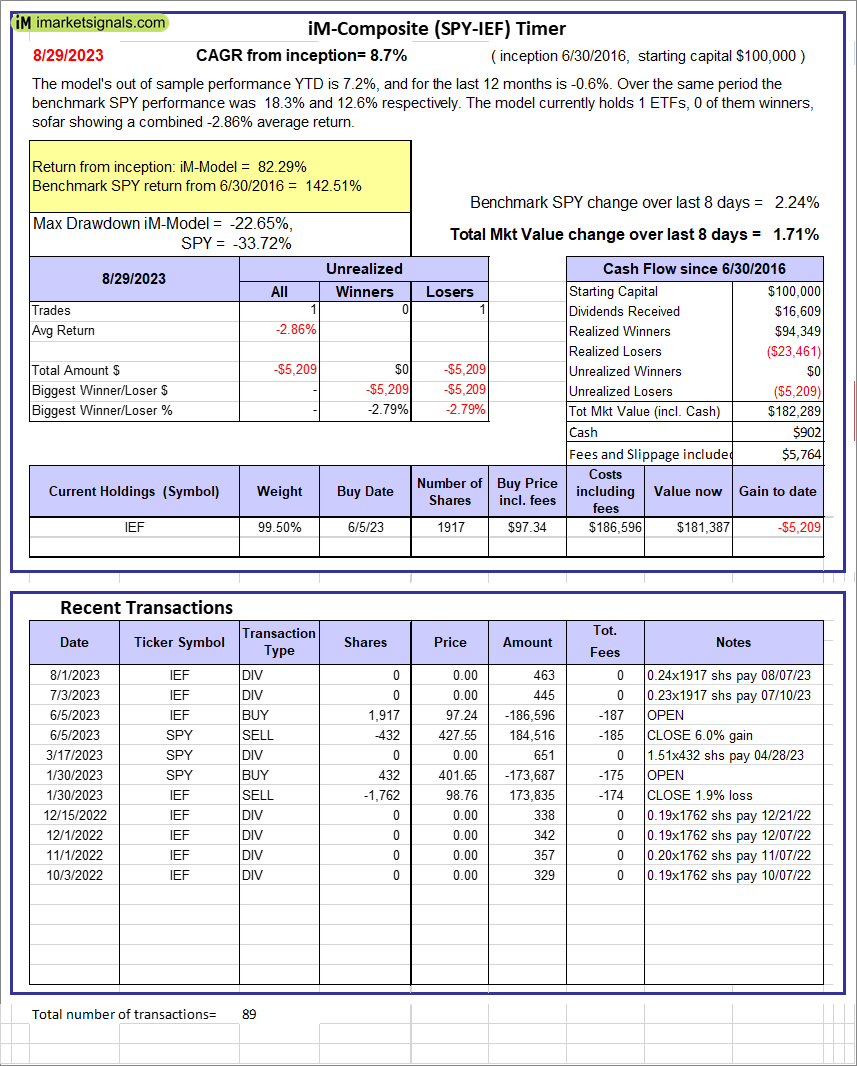 |
iM-Composite (SPY-IEF) Timer: The model’s out of sample performance YTD is 7.2%, and for the last 12 months is -0.6%. Over the same period the benchmark SPY performance was 18.3% and 12.6% respectively. Over the previous week the market value of the iM-Composite (SPY-IEF) Timer gained 1.71% at a time when SPY gained 2.24%. A starting capital of $100,000 at inception on 6/30/2016 would have grown to $182,289 which includes $902 cash and excludes $5,764 spent on fees and slippage. |
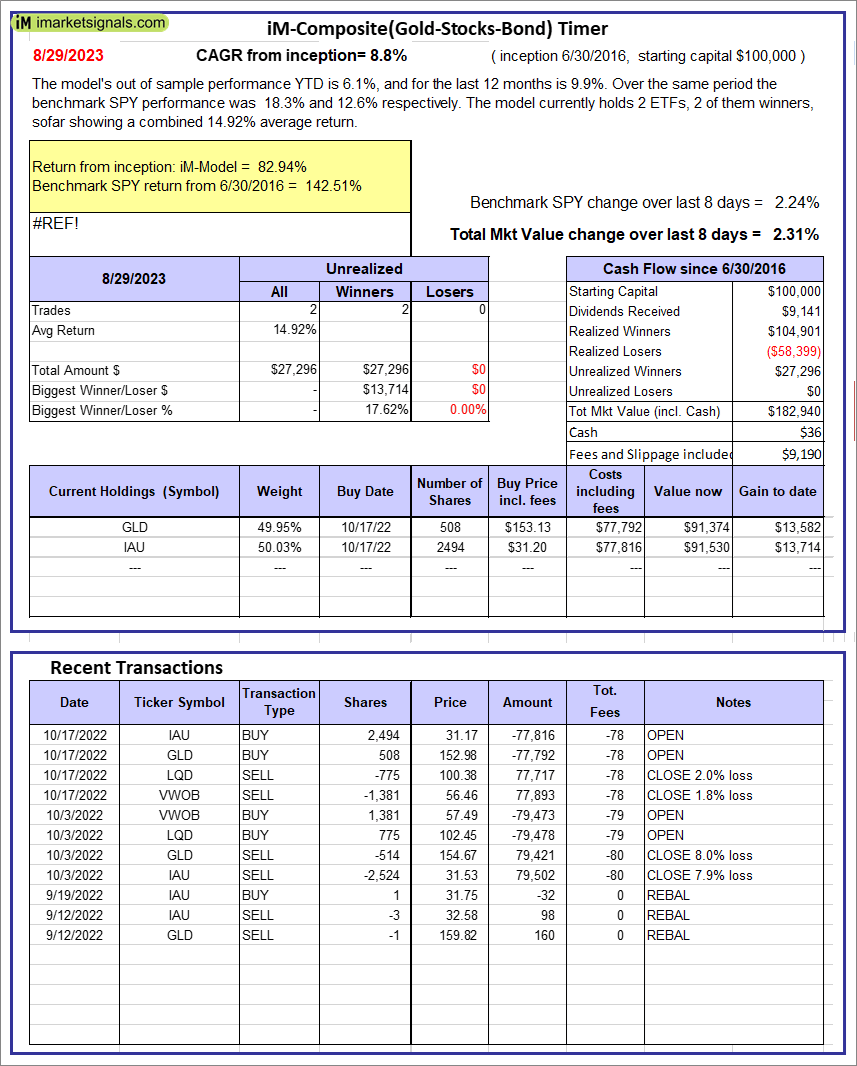 |
iM-Composite(Gold-Stocks-Bond) Timer: The model’s out of sample performance YTD is 6.1%, and for the last 12 months is 9.9%. Over the same period the benchmark SPY performance was 18.3% and 12.6% respectively. Over the previous week the market value of the iM-Composite(Gold-Stocks-Bond) Timer gained 2.31% at a time when SPY gained 2.24%. A starting capital of $100,000 at inception on 6/30/2016 would have grown to $182,940 which includes $36 cash and excludes $9,190 spent on fees and slippage. |
iM-Best Reports – 8/29/2023
Posted in pmp SPY-SH
Leave a Reply
You must be logged in to post a comment.