
  |
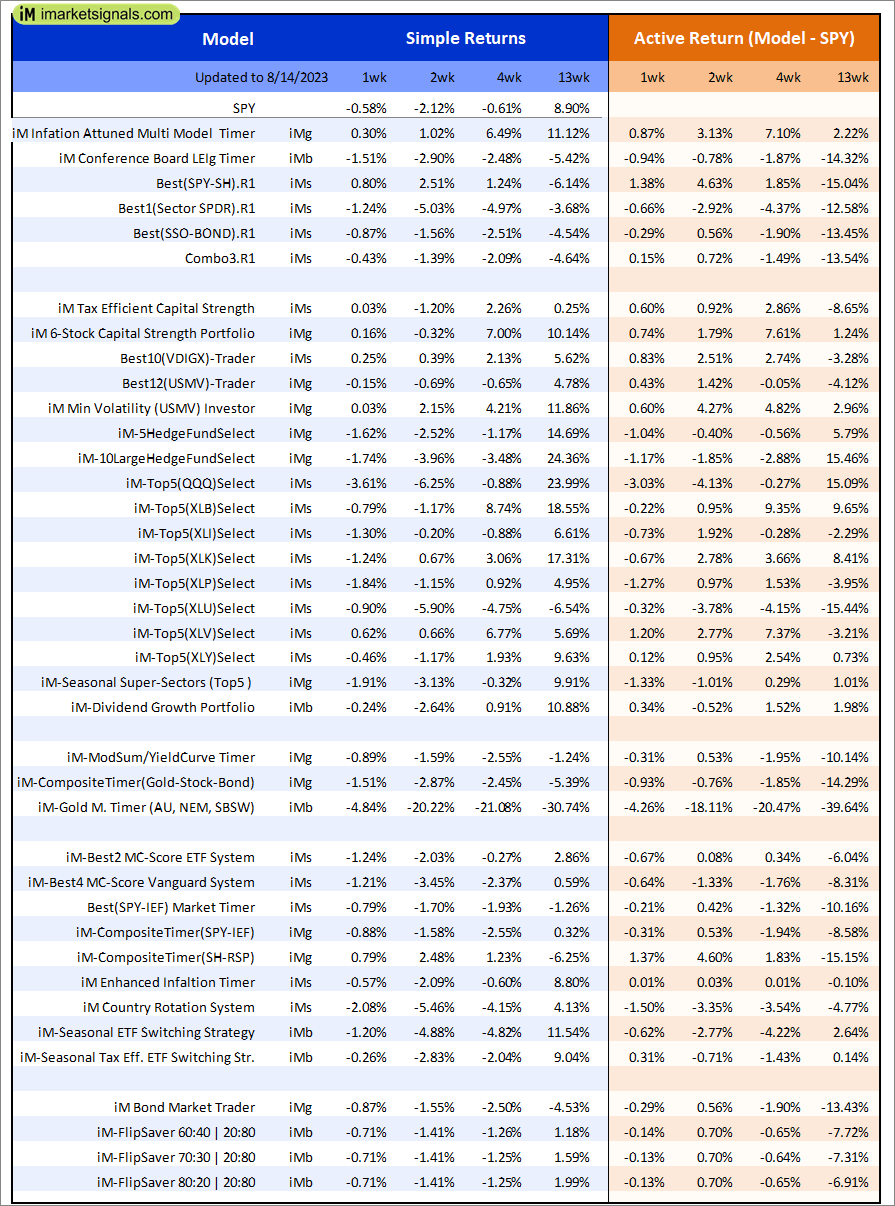
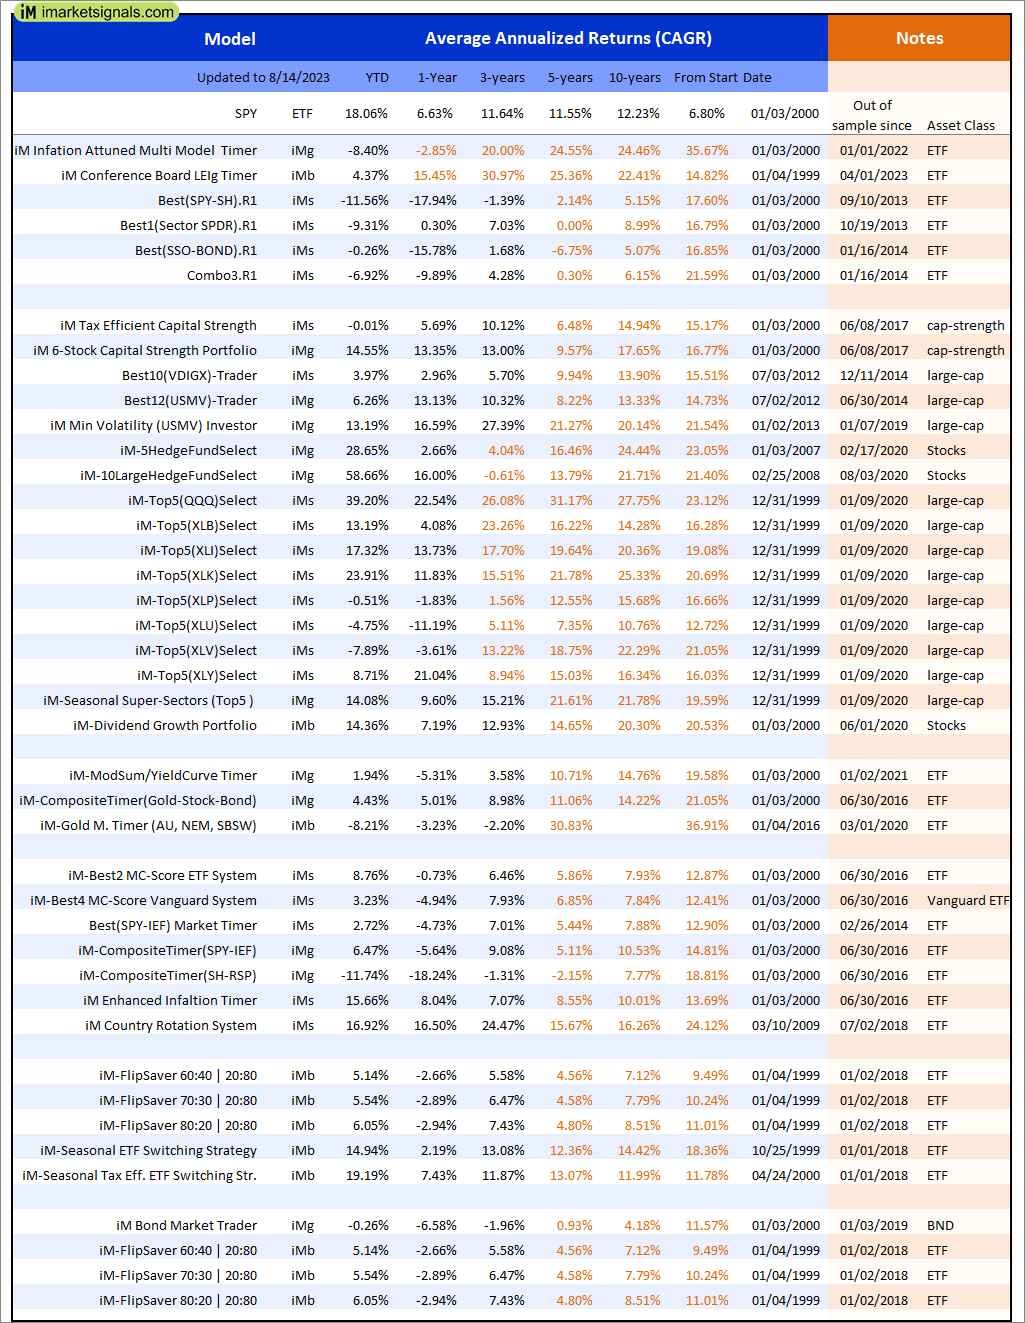
Out of sample performance summary of our models for the past 1, 2, 4 and 13 week periods. The active active return indicates how the models over- or underperformed the benchmark ETF SPY. Also the YTD, and the 1-, 3-, 5- and 10-year annualized returns are shown in the second table |
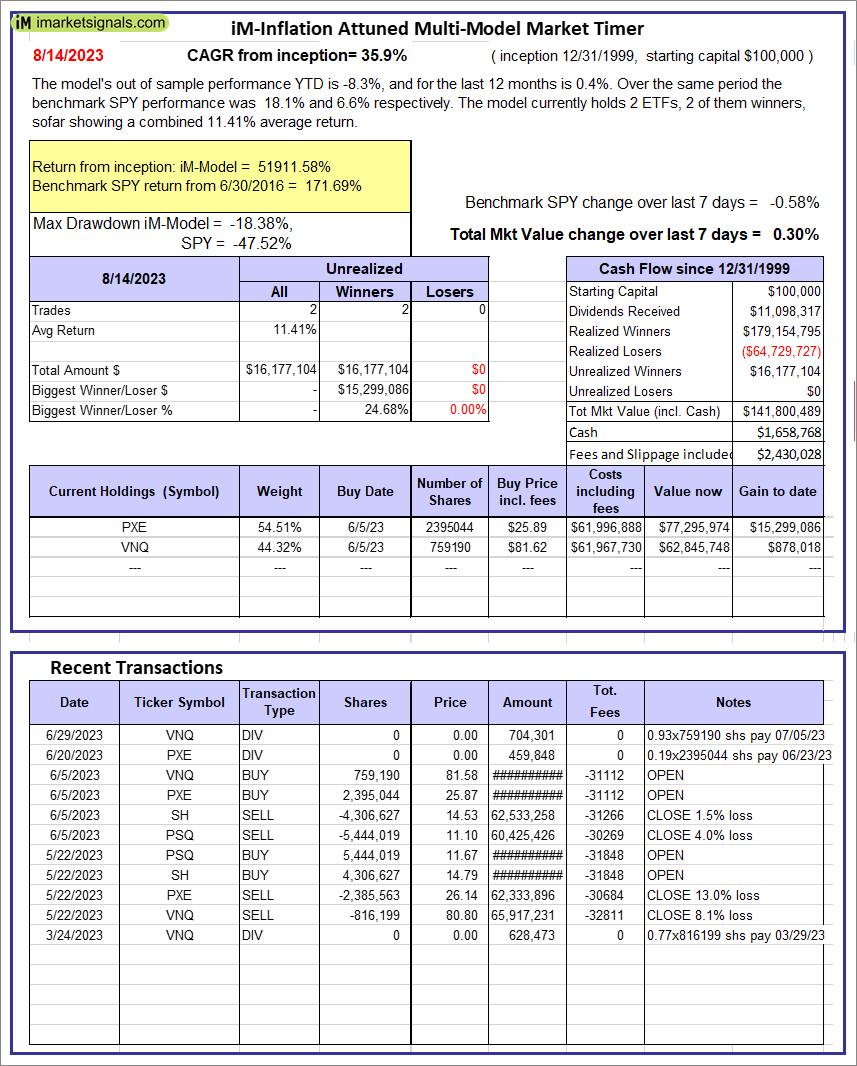 |
iM-Inflation Attuned Multi-Model Market Timer: The model’s out of sample performance YTD is -8.3%, and for the last 12 months is 0.4%. Over the same period the benchmark SPY performance was 18.1% and 6.6% respectively. Over the previous week the market value of the iM-Inflation Attuned Multi-Model Market Timer gained 0.30% at a time when SPY gained -0.58%. A starting capital of $100,000 at inception on 3/24/2017 would have grown to $141,800,489 which includes $1,658,768 cash and excludes $2,430,028 spent on fees and slippage. |
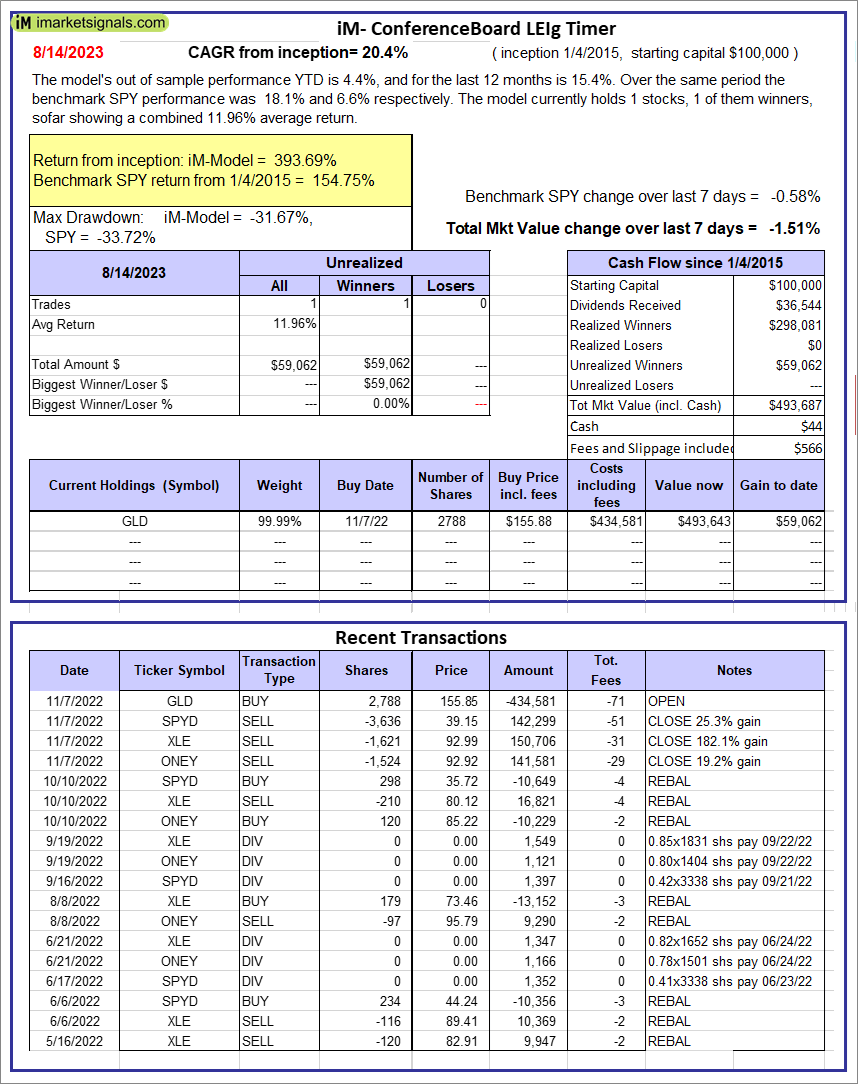 |
iM-Conference Board LEIg Timer: The model’s performance YTD is 14.3%, and for the last 12 months is 7.3%. Over the same period the benchmark SPY performance was 20.1% and 9.4% respectively. Over the previous week the market value of the iM-Conference Board LEIg Timer gained -1.51% at a time when SPY gained -0.58%. A starting capital of $100,000 at inception on 4/5/2017 would have grown to $493,687 which includes $44 cash and excludes $566 spent on fees and slippage. |
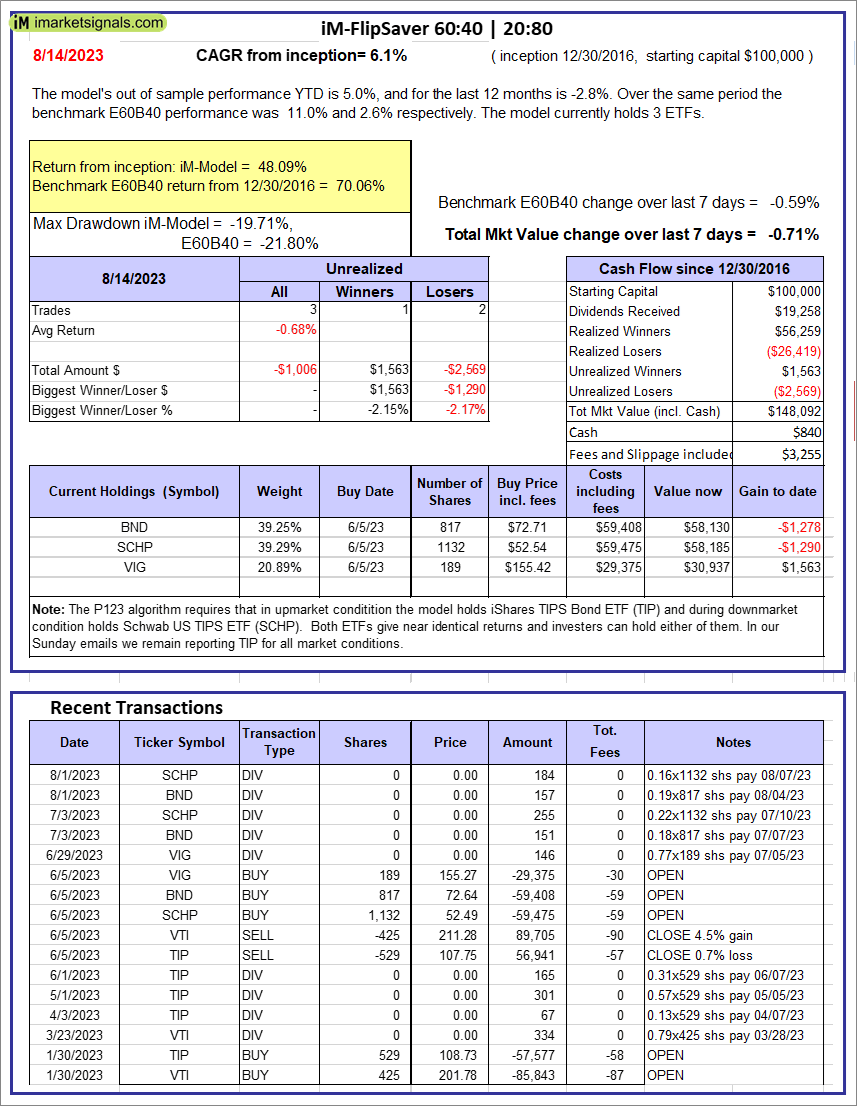 |
iM-FlipSaver 60:40 | 20:80 – 2017: The model’s out of sample performance YTD is 5.0%, and for the last 12 months is -2.8%. Over the same period the benchmark E60B40 performance was 11.0% and 2.6% respectively. Over the previous week the market value of iM-FlipSaver 80:20 | 20:80 gained -0.71% at a time when SPY gained -0.59%. A starting capital of $100,000 at inception on 7/16/2015 would have grown to $148,092 which includes $840 cash and excludes $3,255 spent on fees and slippage. |
 |
iM-FlipSaver 70:30 | 20:80 – 2017: The model’s out of sample performance YTD is 5.5%, and for the last 12 months is -2.9%. Over the same period the benchmark E60B40 performance was 11.0% and 2.6% respectively. Over the previous week the market value of iM-FlipSaver 70:30 | 20:80 gained -0.71% at a time when SPY gained -0.59%. A starting capital of $100,000 at inception on 7/15/2015 would have grown to $153,024 which includes $671 cash and excludes $3,432 spent on fees and slippage. |
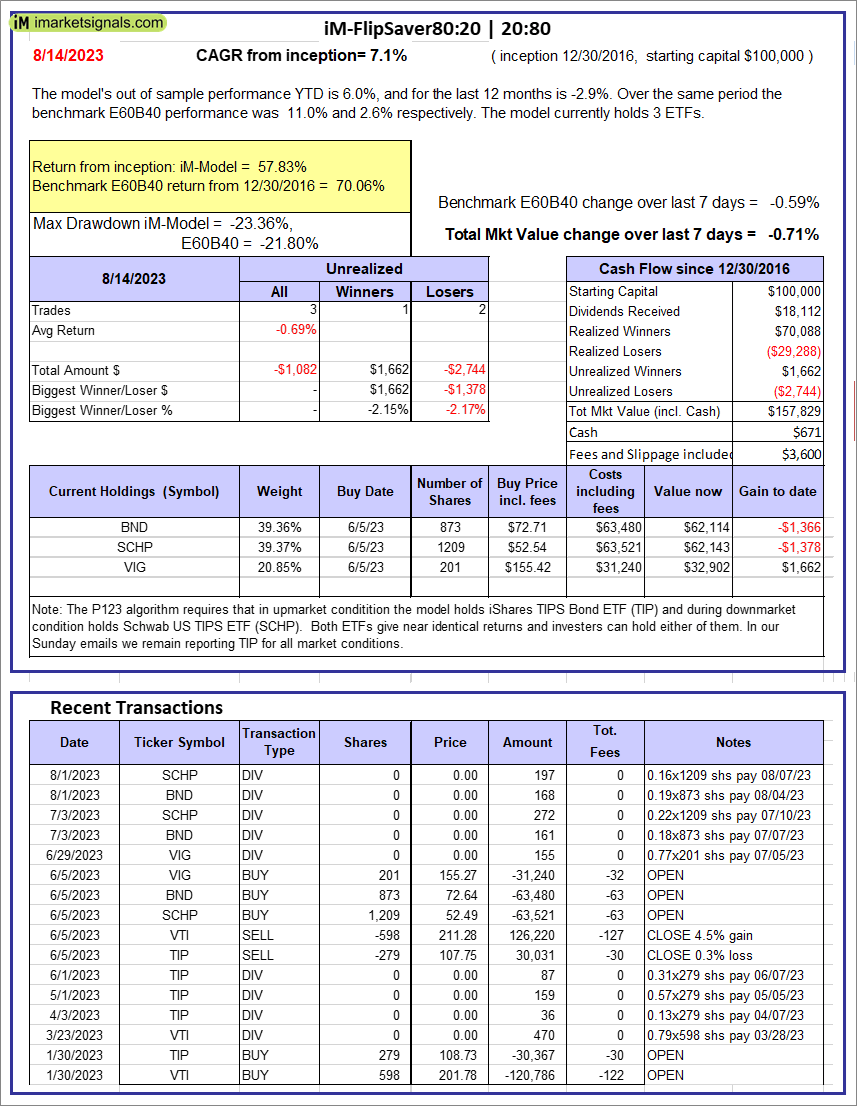 |
iM-FlipSaver 80:20 | 20:80 – 2017: The model’s out of sample performance YTD is 6.0%, and for the last 12 months is -2.9%. Over the same period the benchmark E60B40 performance was 11.0% and 2.6% respectively. Over the previous week the market value of iM-FlipSaver 80:20 | 20:80 gained -0.71% at a time when SPY gained -0.59%. A starting capital of $100,000 at inception on 1/2/2017 would have grown to $157,829 which includes $671 cash and excludes $3,600 spent on fees and slippage. |
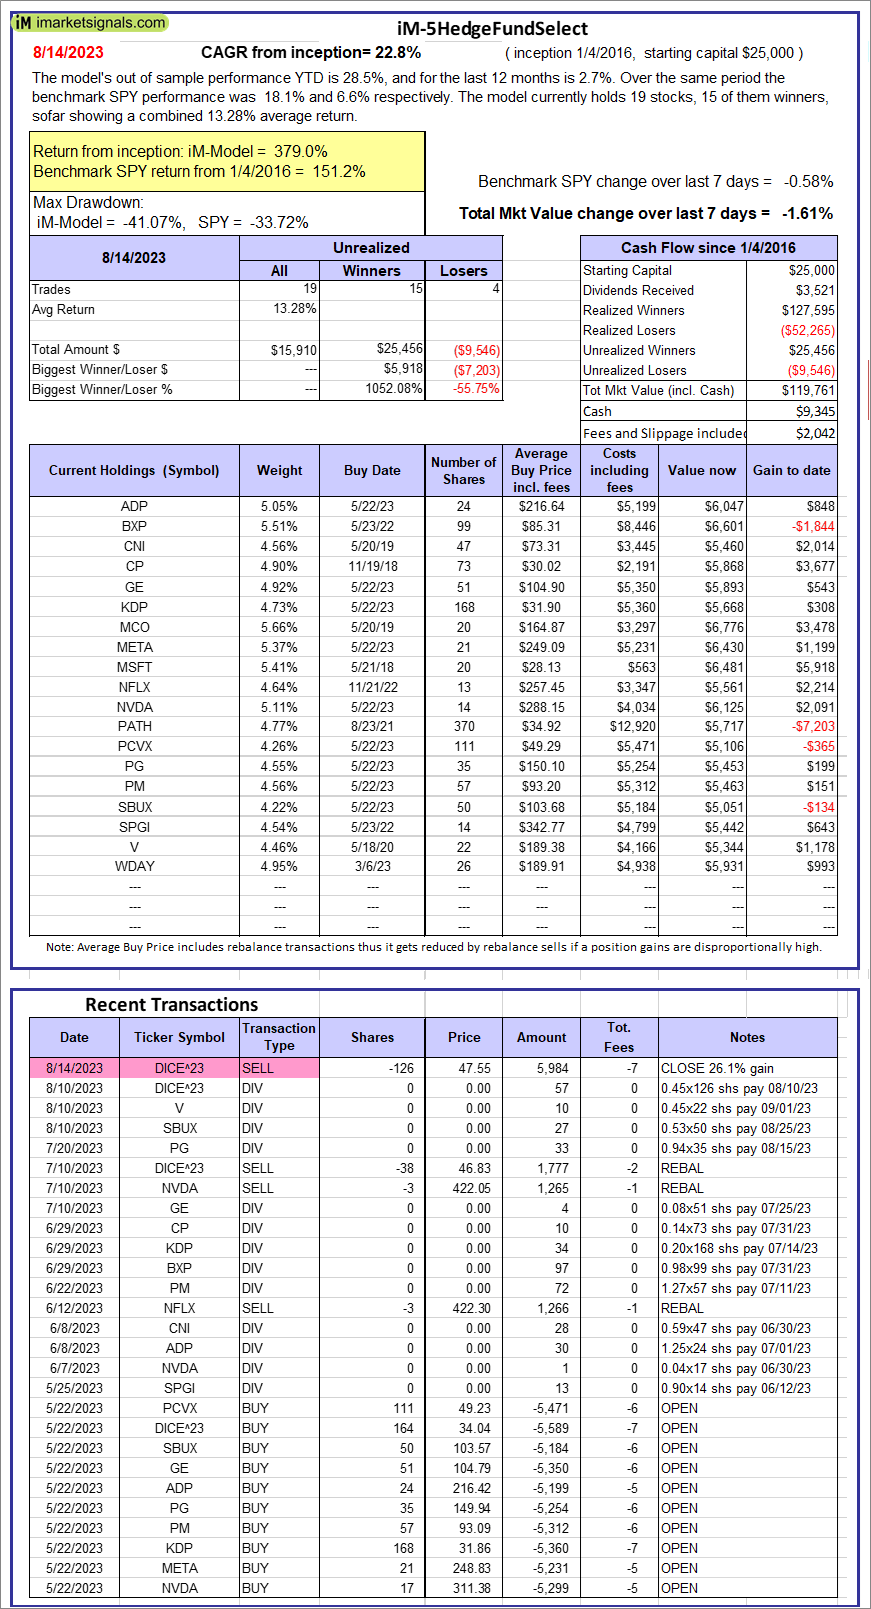 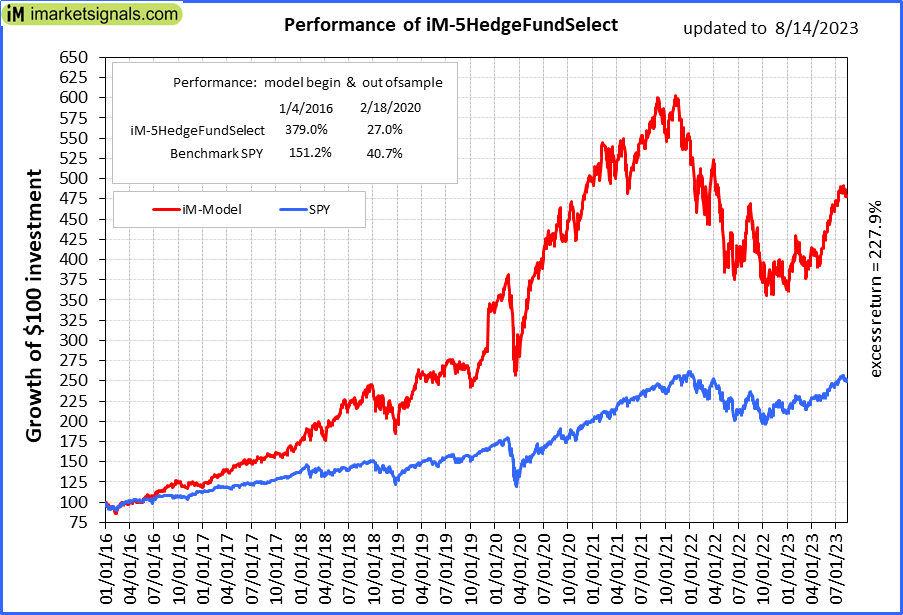 |
iM-5HedgeFundSelect: Since inception, on 1/5/2016, the model gained 379.04% while the benchmark SPY gained 151.18% over the same period. Over the previous week the market value of iM-5HedgeFundSelect gained -1.61% at a time when SPY gained -0.58%. A starting capital of $25,000 at inception on 1/5/2016 would have grown to $119,761 which includes $9,345 cash and excludes $2,042 spent on fees and slippage. |
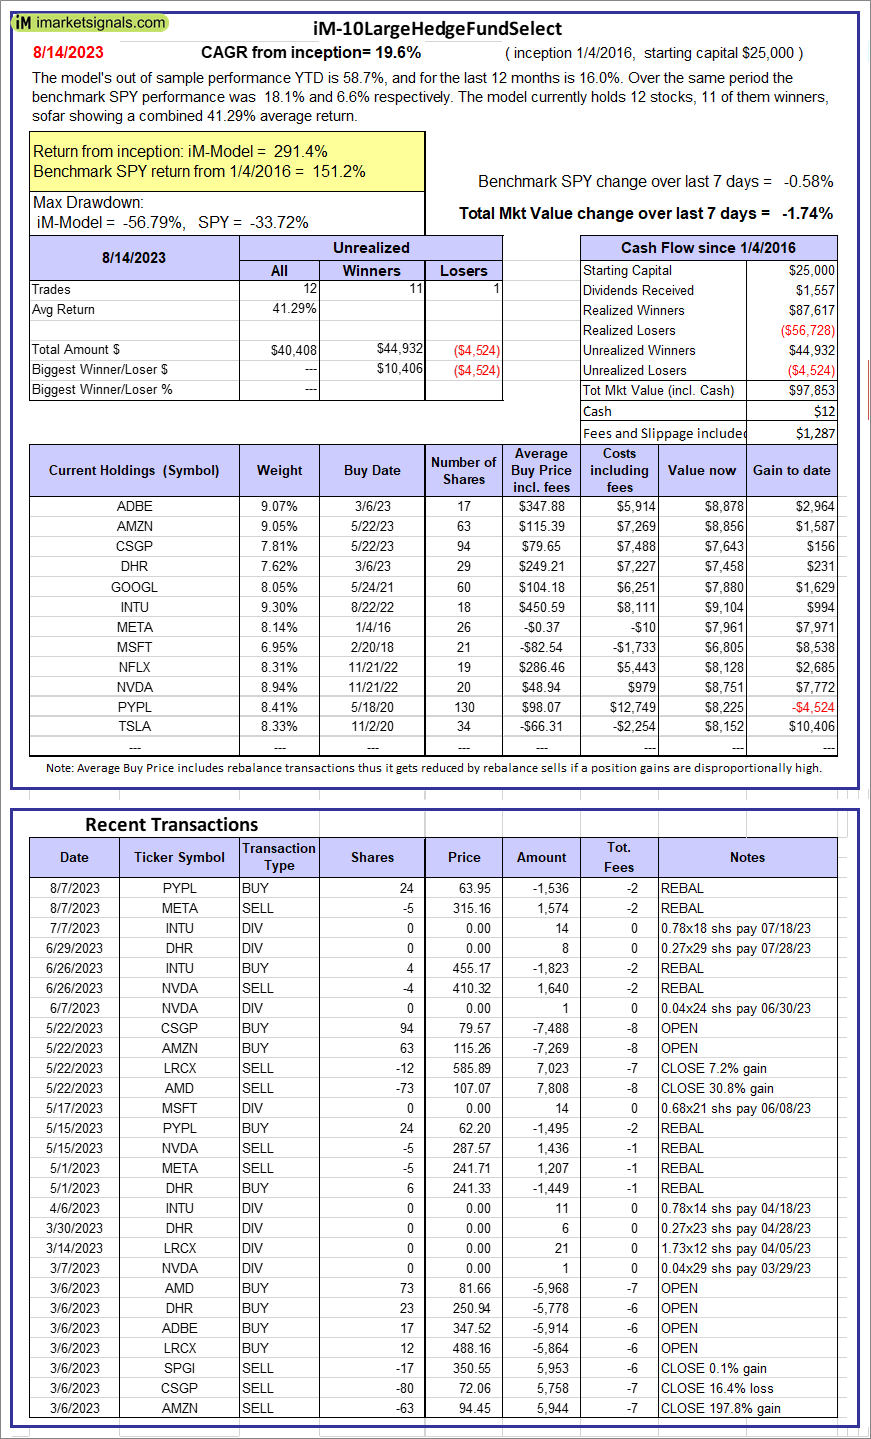 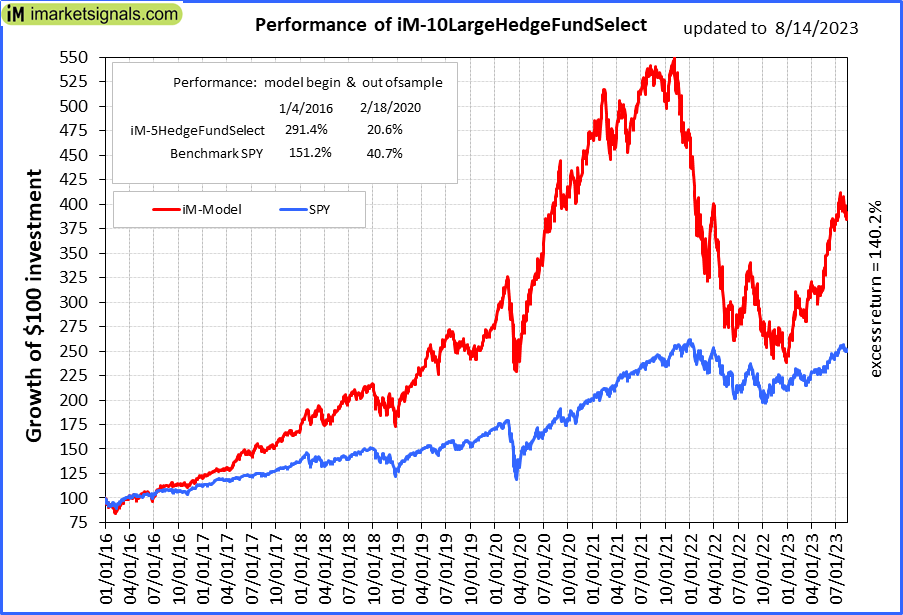 |
iM-10LargeHedgeFundSelect: Since inception, on 1/5/2016, the model gained 291.41% while the benchmark SPY gained 151.18% over the same period. Over the previous week the market value of iM-10LargeHedgeFundSelect gained -1.74% at a time when SPY gained -0.58%. A starting capital of $25,000 at inception on 1/5/2016 would have grown to $97,853 which includes $12 cash and excludes $1,287 spent on fees and slippage. |
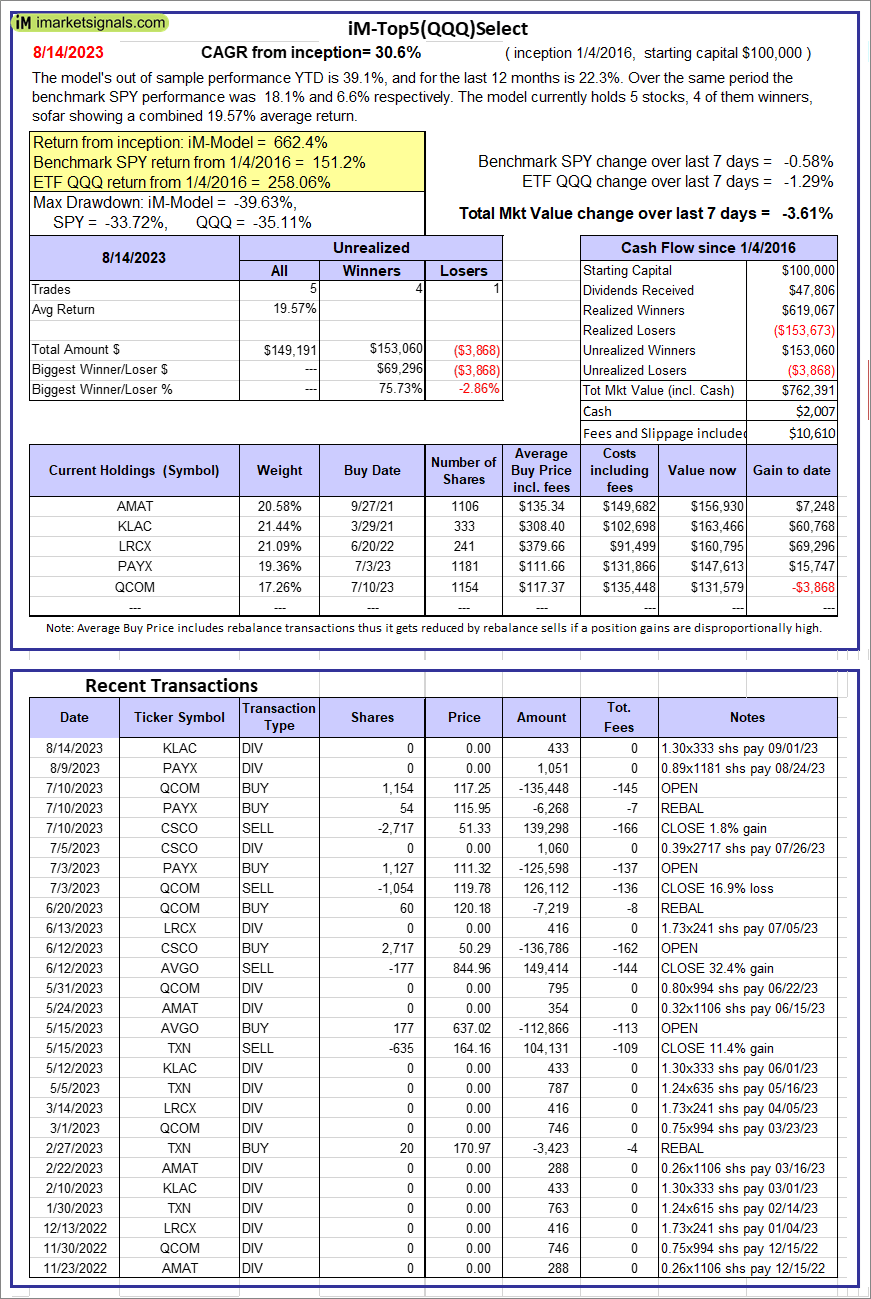 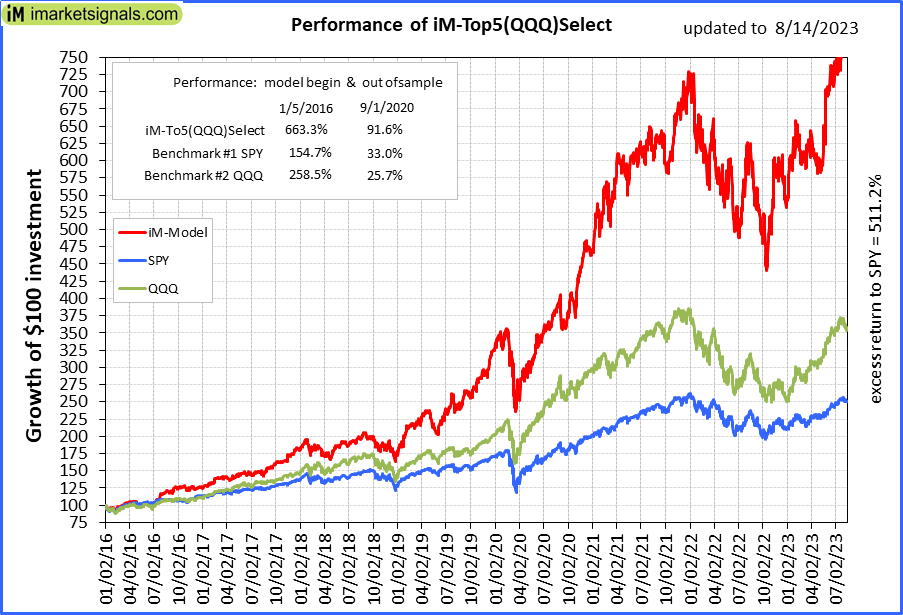 |
iM-Top5(QQQ)Select: Since inception, on 1/5/2016, the model gained 662.39% while the benchmark SPY gained 151.18% over the same period. Over the previous week the market value of iM-Top5(QQQ)Select gained -3.61% at a time when SPY gained -0.58%. A starting capital of $100,000 at inception on 1/5/2016 would have grown to $762,391 which includes $2,007 cash and excludes $10,610 spent on fees and slippage. |
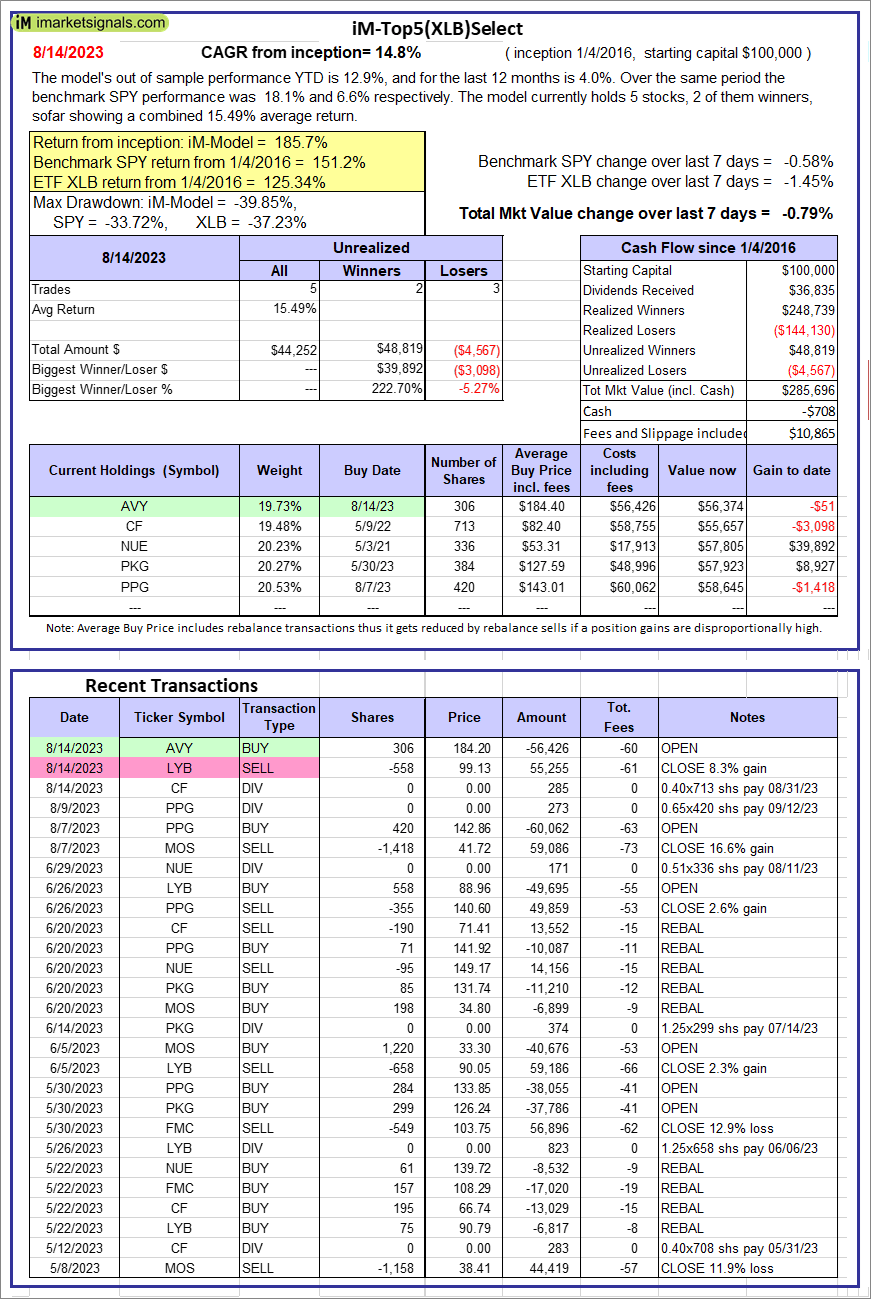 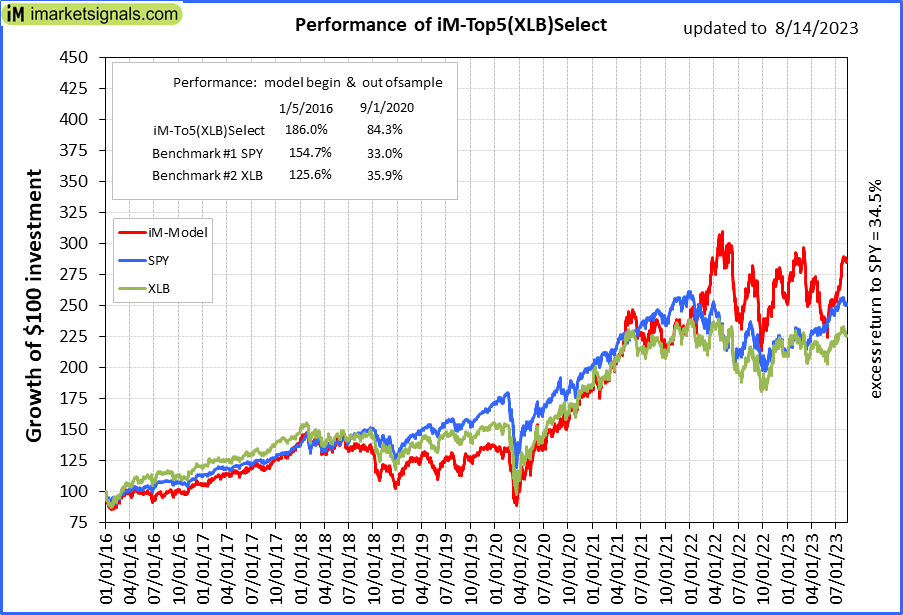 |
iM-Top5(XLB)Select: Since inception, on 1/5/2016, the model gained 185.70% while the benchmark SPY gained 151.18% over the same period. Over the previous week the market value of iM-Top5(XLB)Select gained -0.79% at a time when SPY gained -0.58%. A starting capital of $100,000 at inception on 1/5/2016 would have grown to $285,696 which includes -$708 cash and excludes $10,865 spent on fees and slippage. |
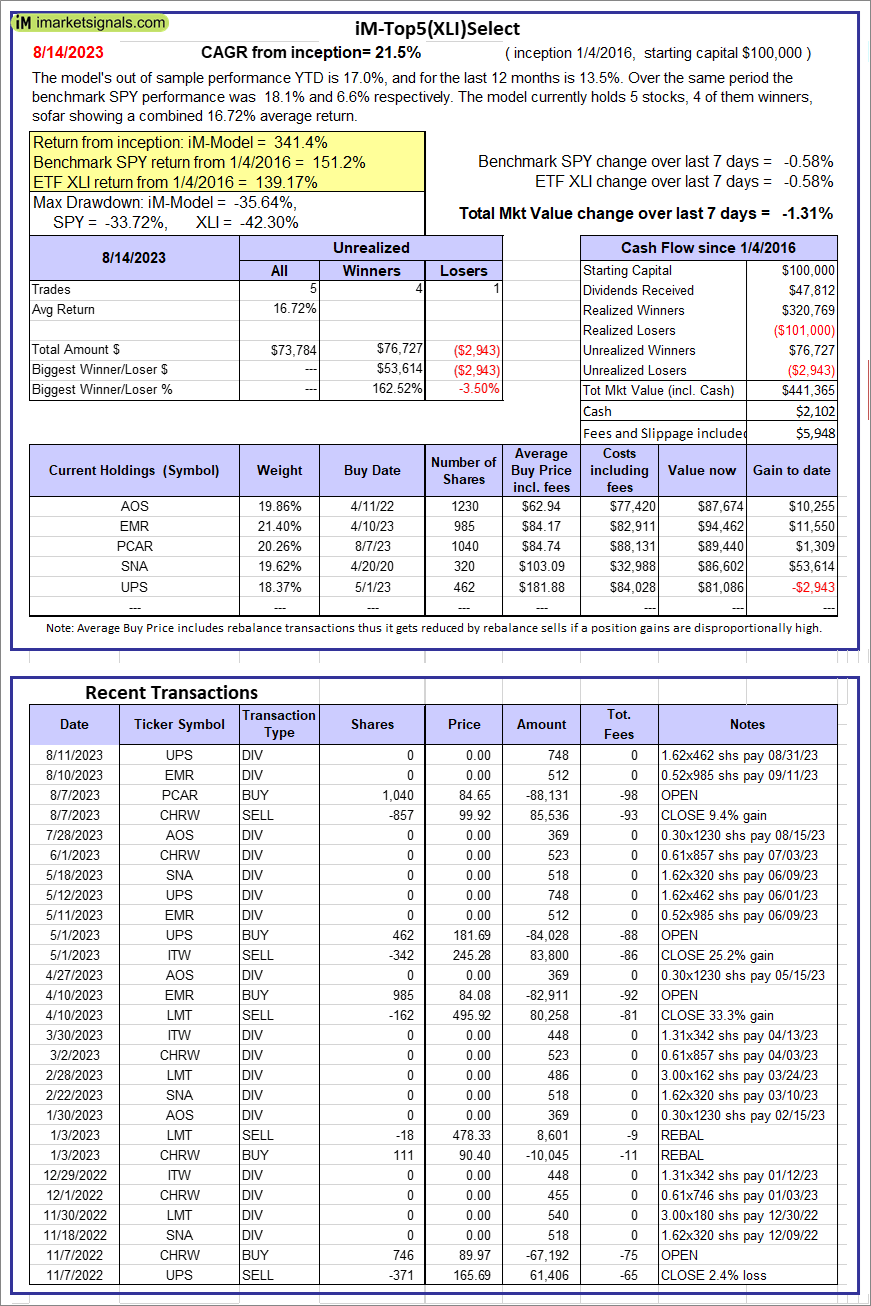 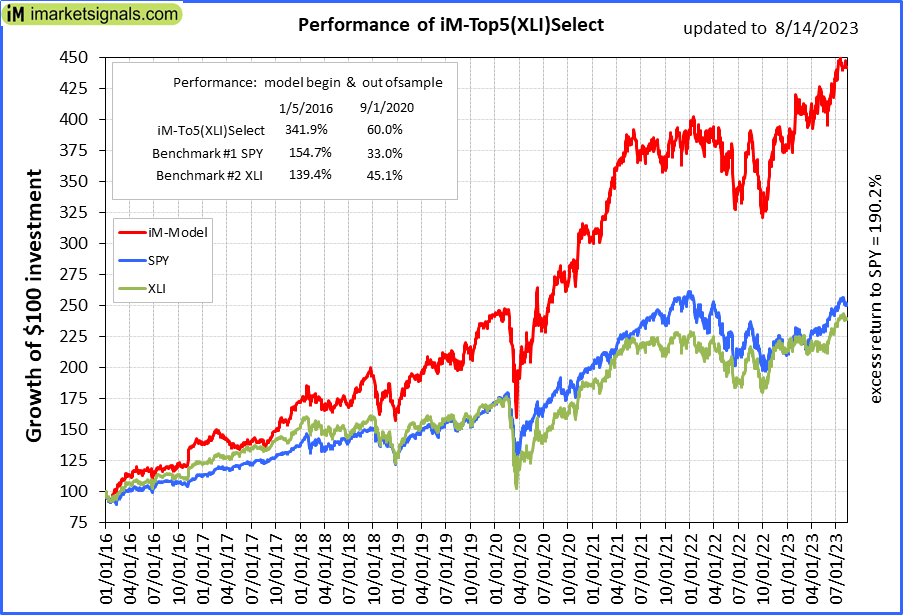 |
iM-Top5(XLI)Select: Since inception, on 1/5/2016, the model gained 341.37% while the benchmark SPY gained 151.18% over the same period. Over the previous week the market value of iM-Top5(XLI)Select gained -1.31% at a time when SPY gained -0.58%. A starting capital of $100,000 at inception on 1/5/2016 would have grown to $441,365 which includes $2,102 cash and excludes $5,948 spent on fees and slippage. |
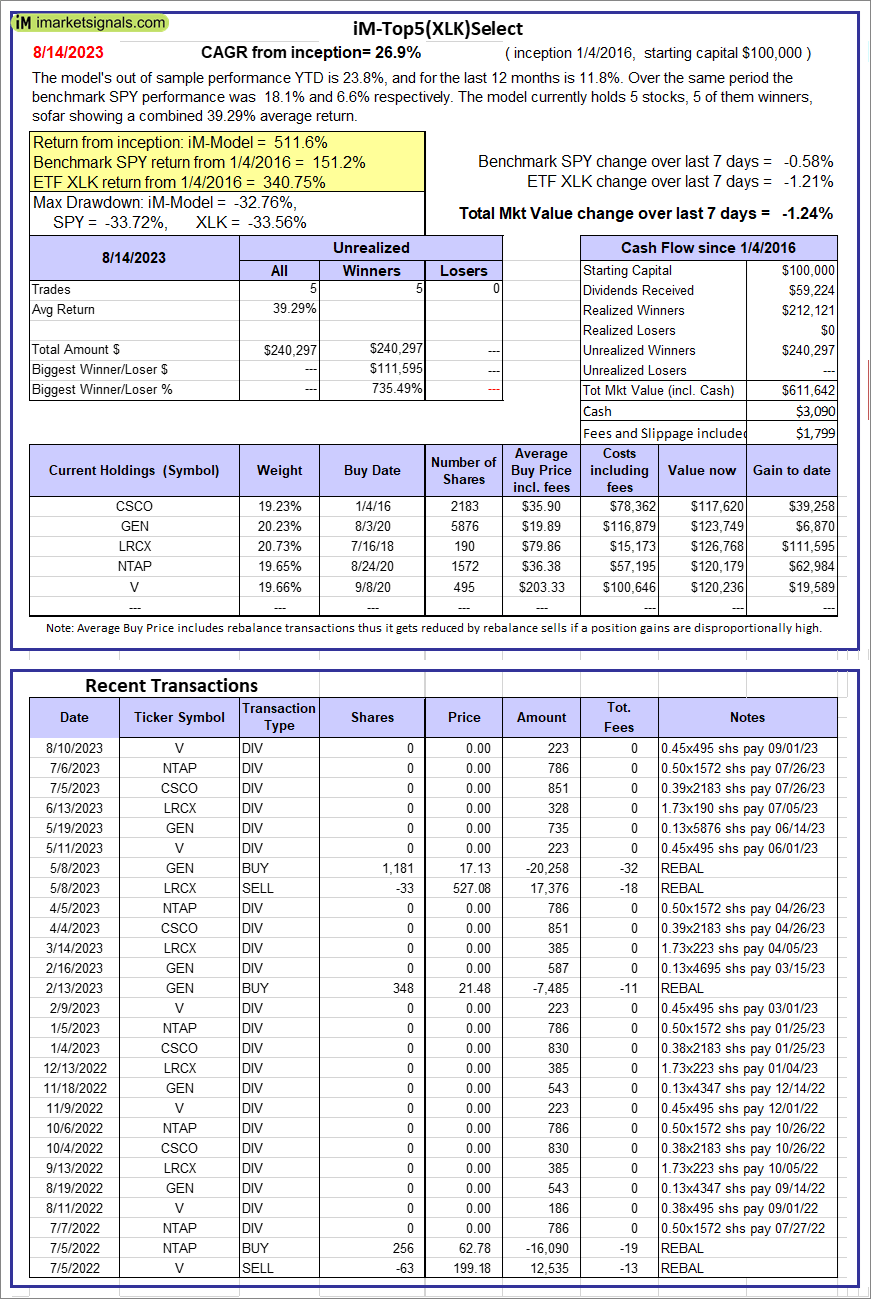 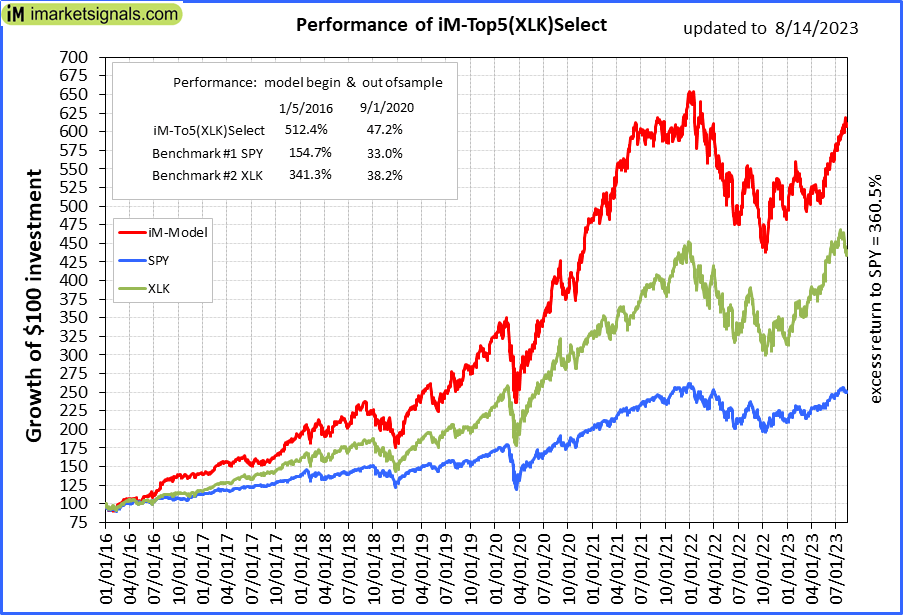 |
iM-Top5(XLK)Select: Since inception, on 1/5/2016, the model gained 511.64% while the benchmark SPY gained 151.18% over the same period. Over the previous week the market value of iM-Top5(XLK)Select gained -1.24% at a time when SPY gained -0.58%. A starting capital of $100,000 at inception on 1/5/2016 would have grown to $611,642 which includes $3,090 cash and excludes $1,799 spent on fees and slippage. |
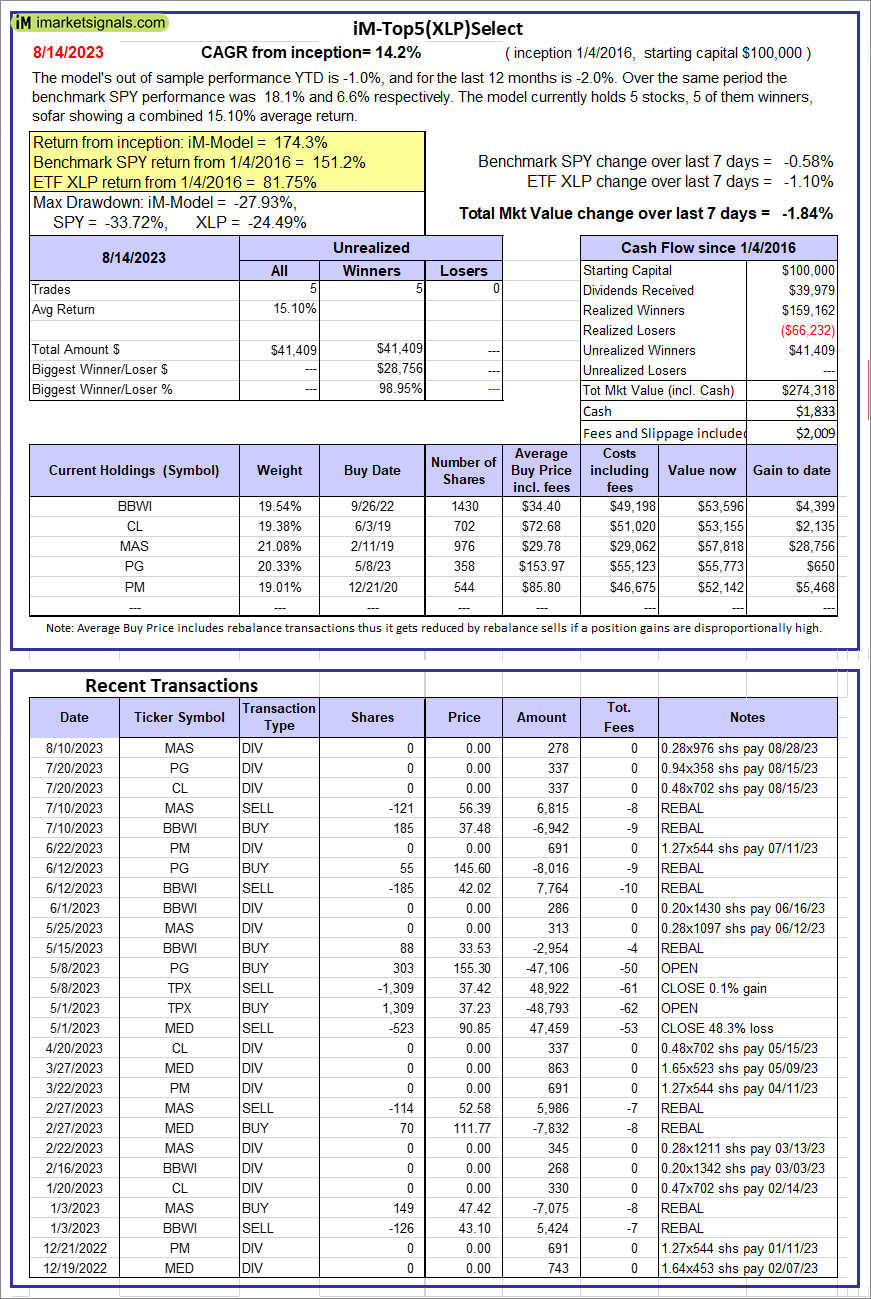 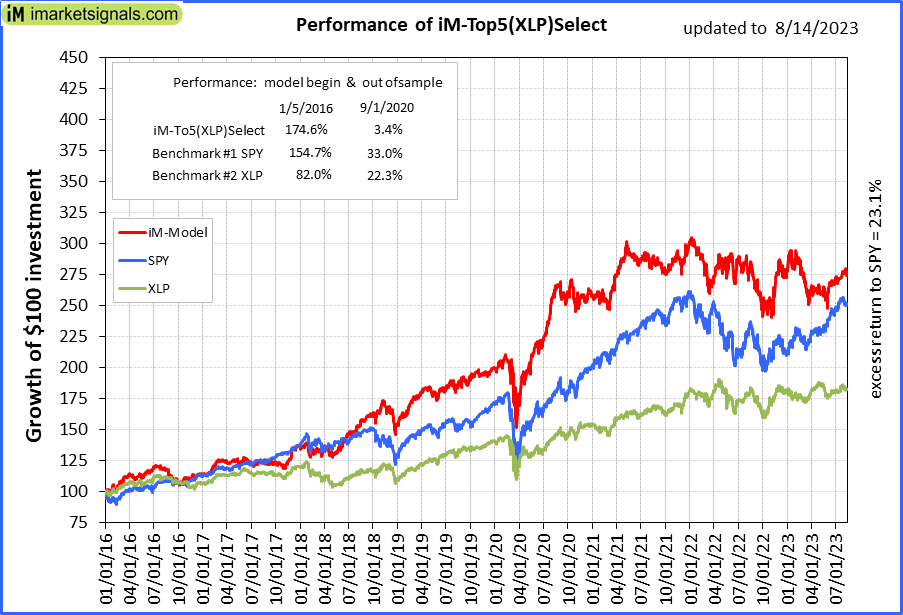 |
iM-Top5(XLP)Select: Since inception, on 1/5/2016, the model gained 174.32% while the benchmark SPY gained 151.18% over the same period. Over the previous week the market value of iM-Top5(XLP)Select gained -1.84% at a time when SPY gained -0.58%. A starting capital of $100,000 at inception on 1/5/2016 would have grown to $274,318 which includes $1,833 cash and excludes $2,009 spent on fees and slippage. |
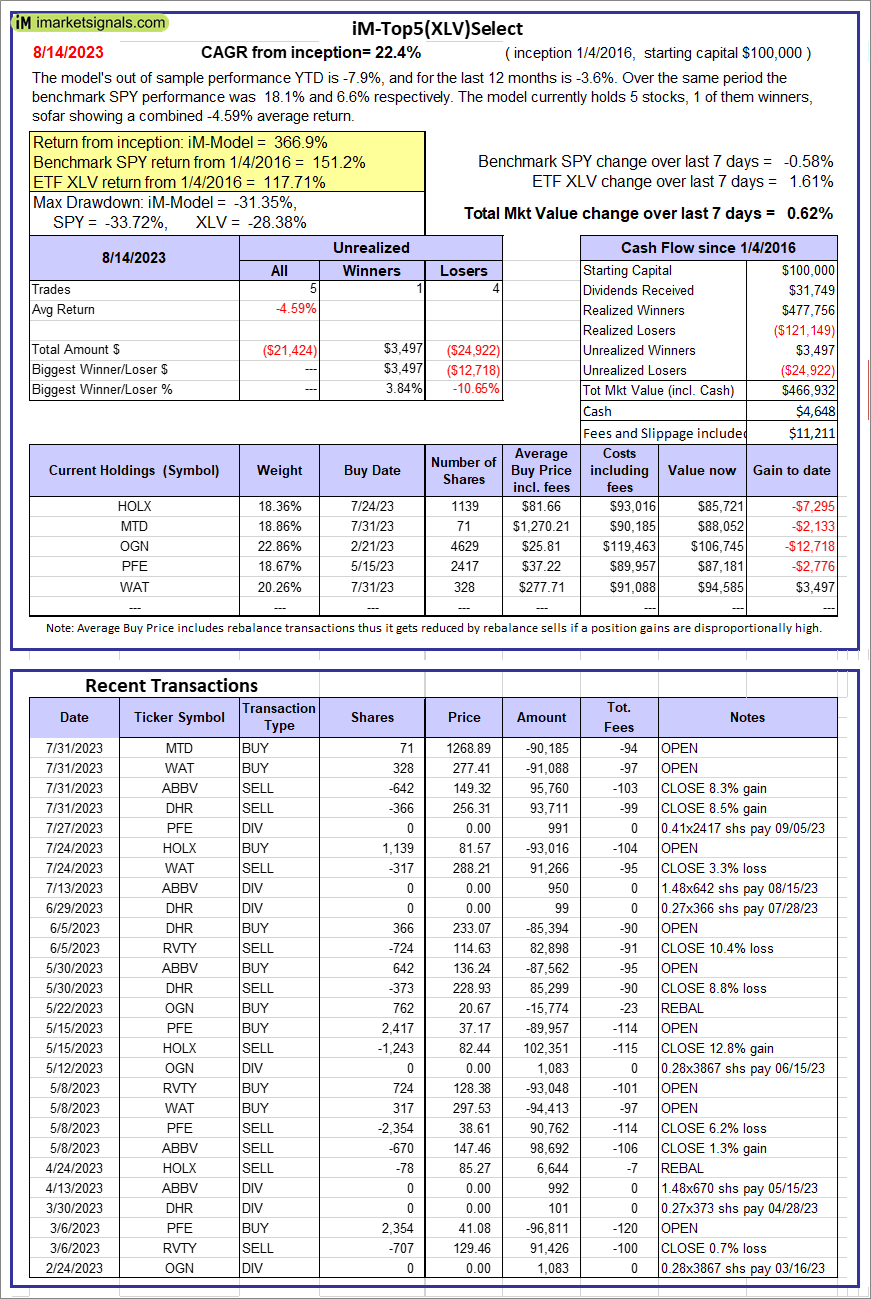 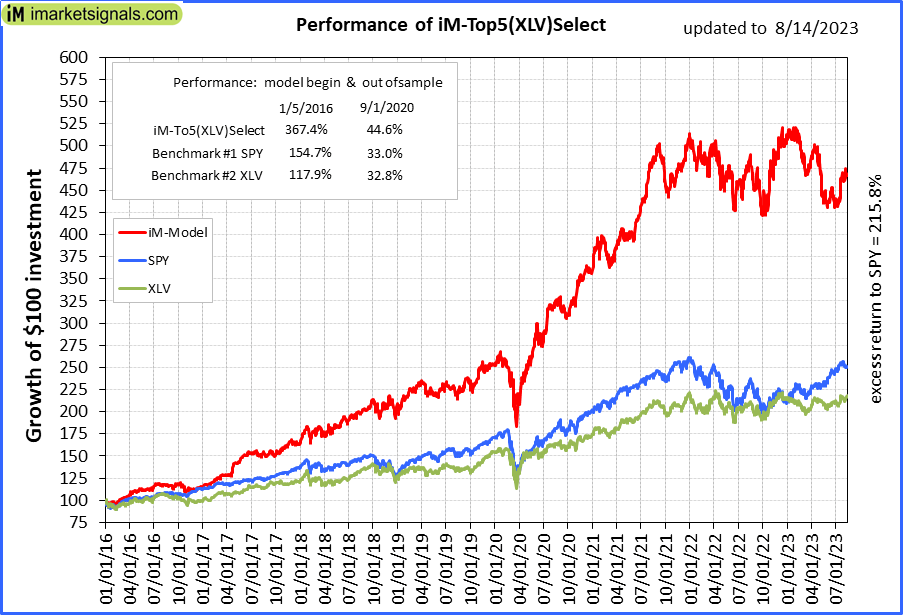 |
iM-Top5(XLV)Select: Since inception, on 1/5/2016, the model gained 366.93% while the benchmark SPY gained 151.18% over the same period. Over the previous week the market value of iM-Top5(XLV)Select gained 0.62% at a time when SPY gained -0.58%. A starting capital of $100,000 at inception on 1/5/2016 would have grown to $466,932 which includes $4,648 cash and excludes $11,211 spent on fees and slippage. |
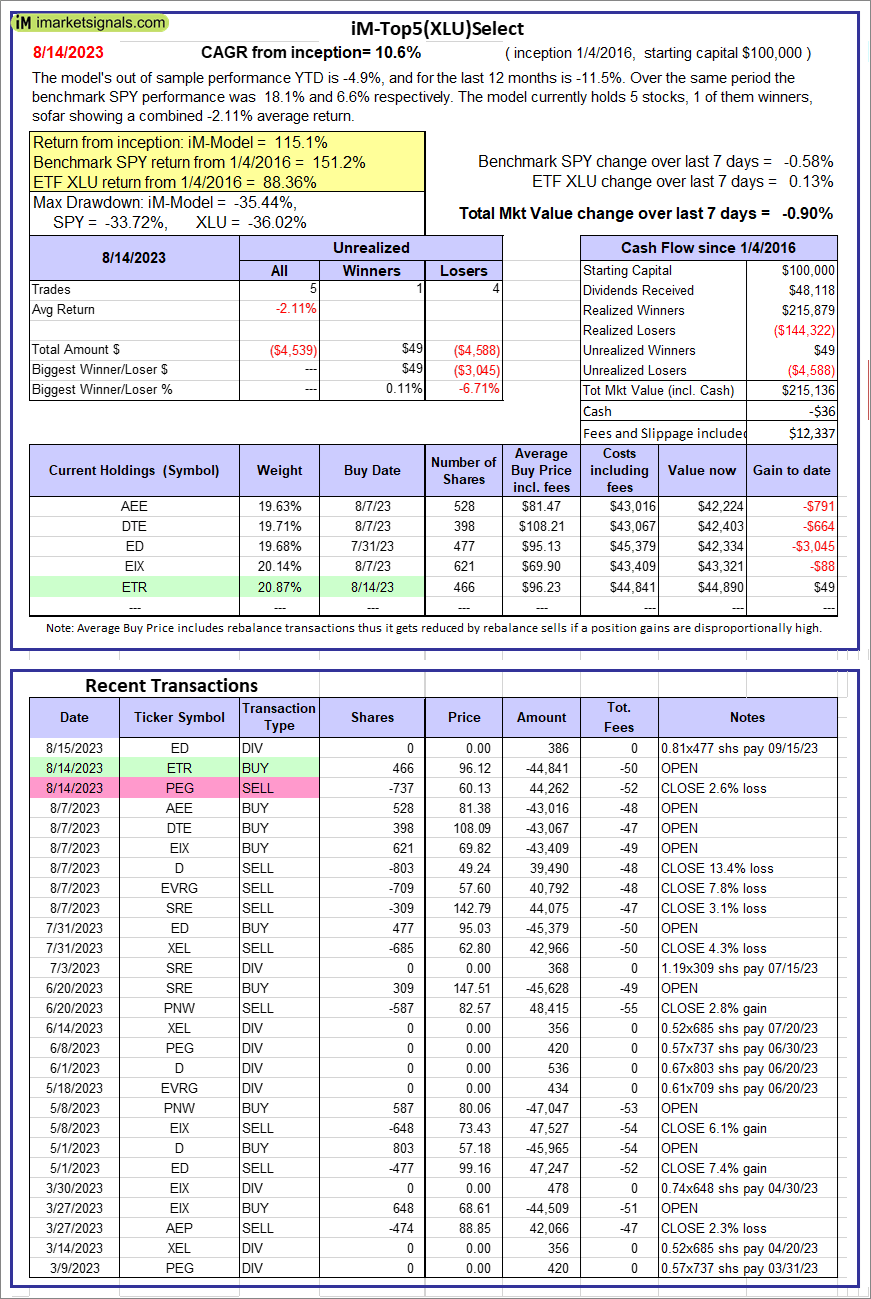 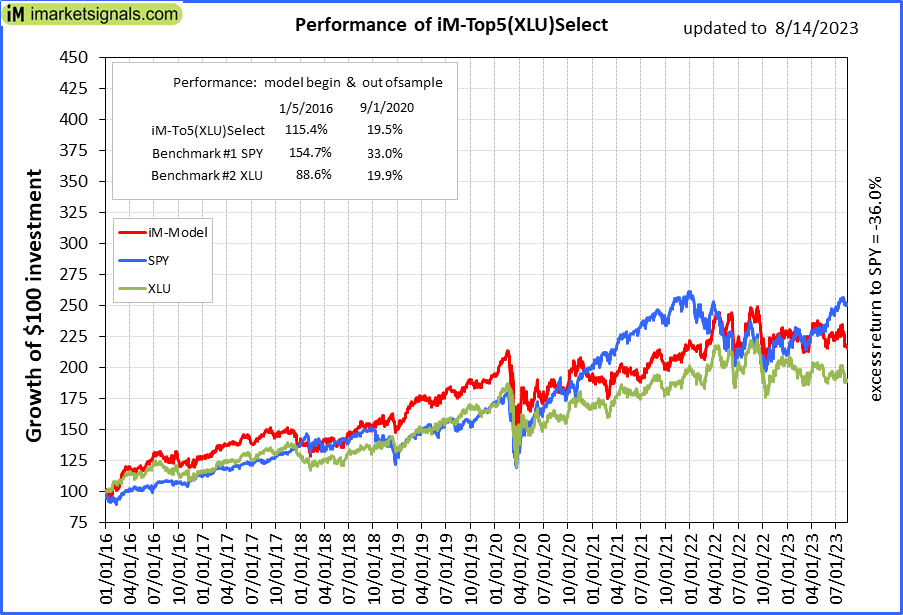 |
iM-Top5(XLU)Select: Since inception, on 1/5/2016, the model gained 115.14% while the benchmark SPY gained 151.18% over the same period. Over the previous week the market value of iM-Top5(XLU)Select gained -0.90% at a time when SPY gained -0.58%. A starting capital of $100,000 at inception on 1/5/2016 would have grown to $215,136 which includes -$36 cash and excludes $12,337 spent on fees and slippage. |
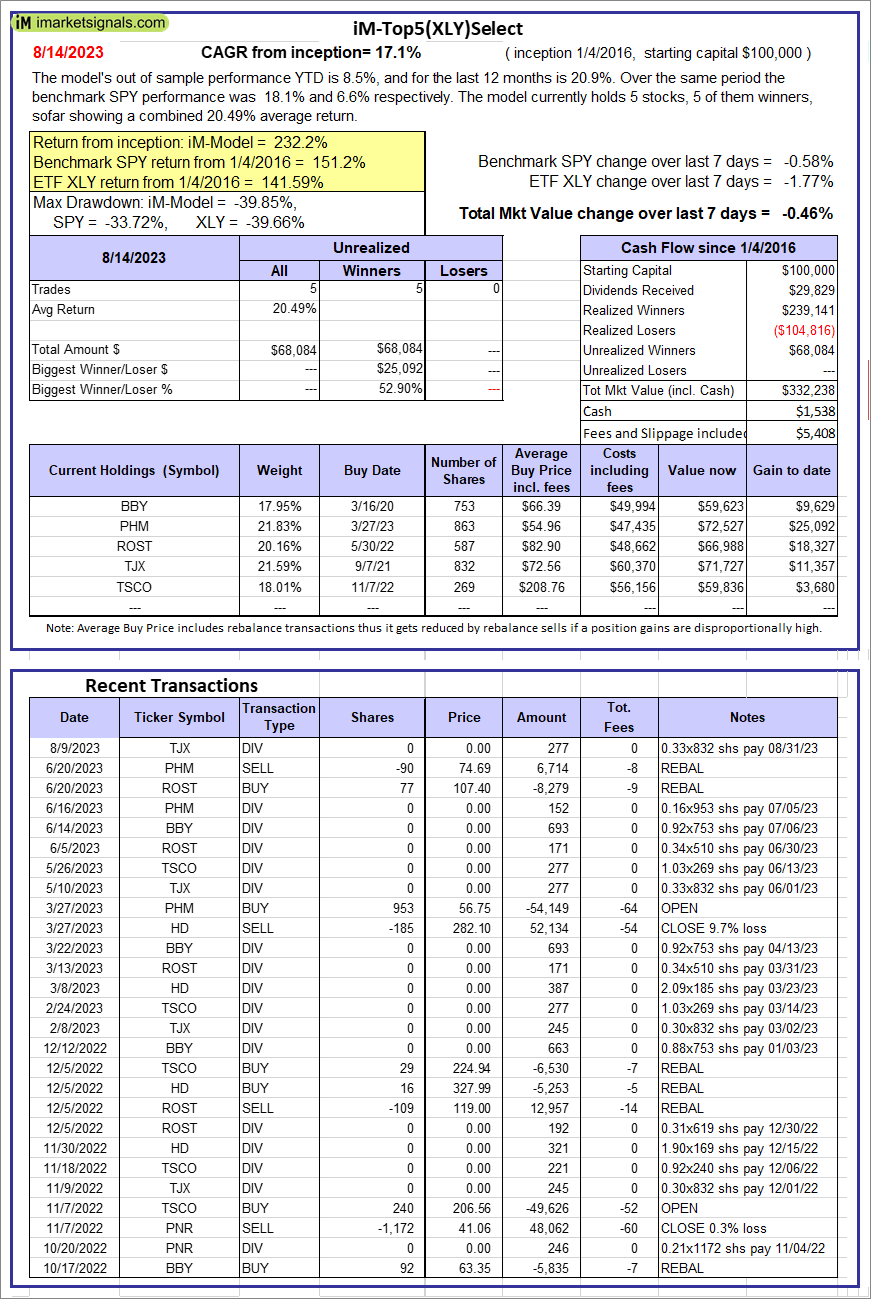 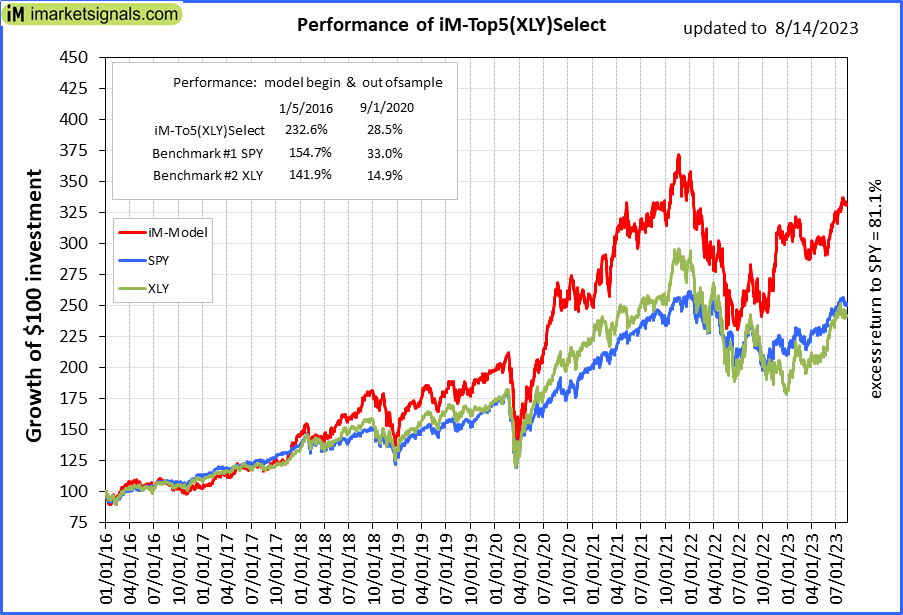 |
iM-Top5(XLY)Select: Since inception, on 1/5/2016, the model gained 232.24% while the benchmark SPY gained 151.18% over the same period. Over the previous week the market value of iM-Top5(XLY)Select gained -0.46% at a time when SPY gained -0.58%. A starting capital of $100,000 at inception on 1/5/2016 would have grown to $332,238 which includes $1,538 cash and excludes $5,408 spent on fees and slippage. |
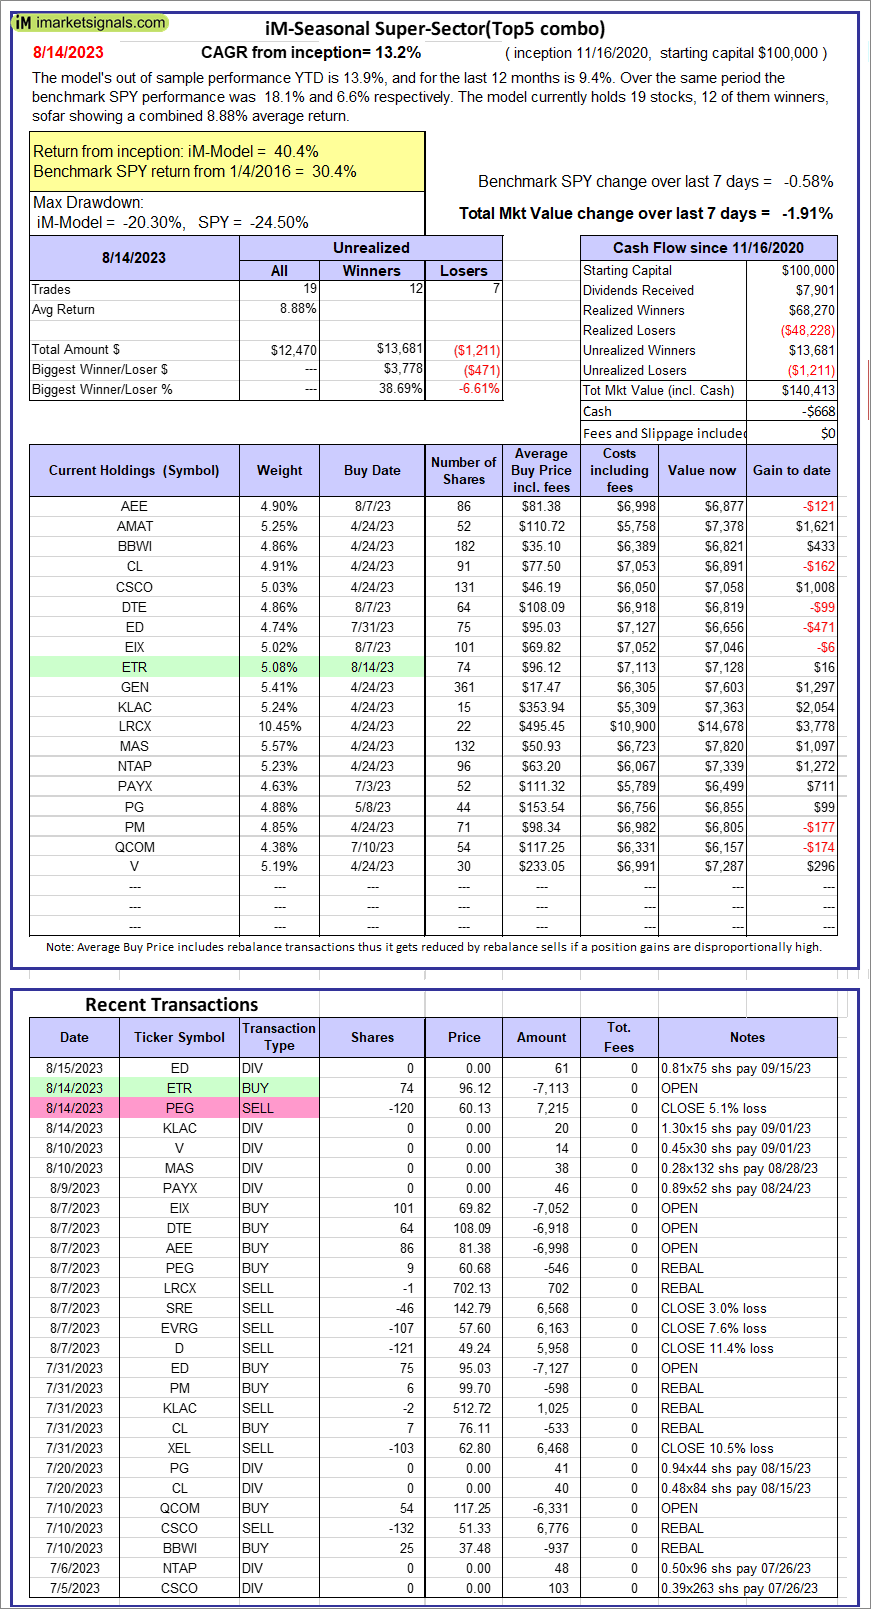 |
iM-Seasonal Super-Sectors (Top5 combo) : Since inception, on 11/17/2020, the model gained 40.41% while the benchmark SPY gained 30.39% over the same period. Over the previous week the market value of iM-Seasonal Super-Sectors (Top5 combo) gained -1.91% at a time when SPY gained -0.58%. A starting capital of $100,000 at inception on 11/17/2020 would have grown to $140,413 which includes -$668 cash and excludes $00 spent on fees and slippage. |
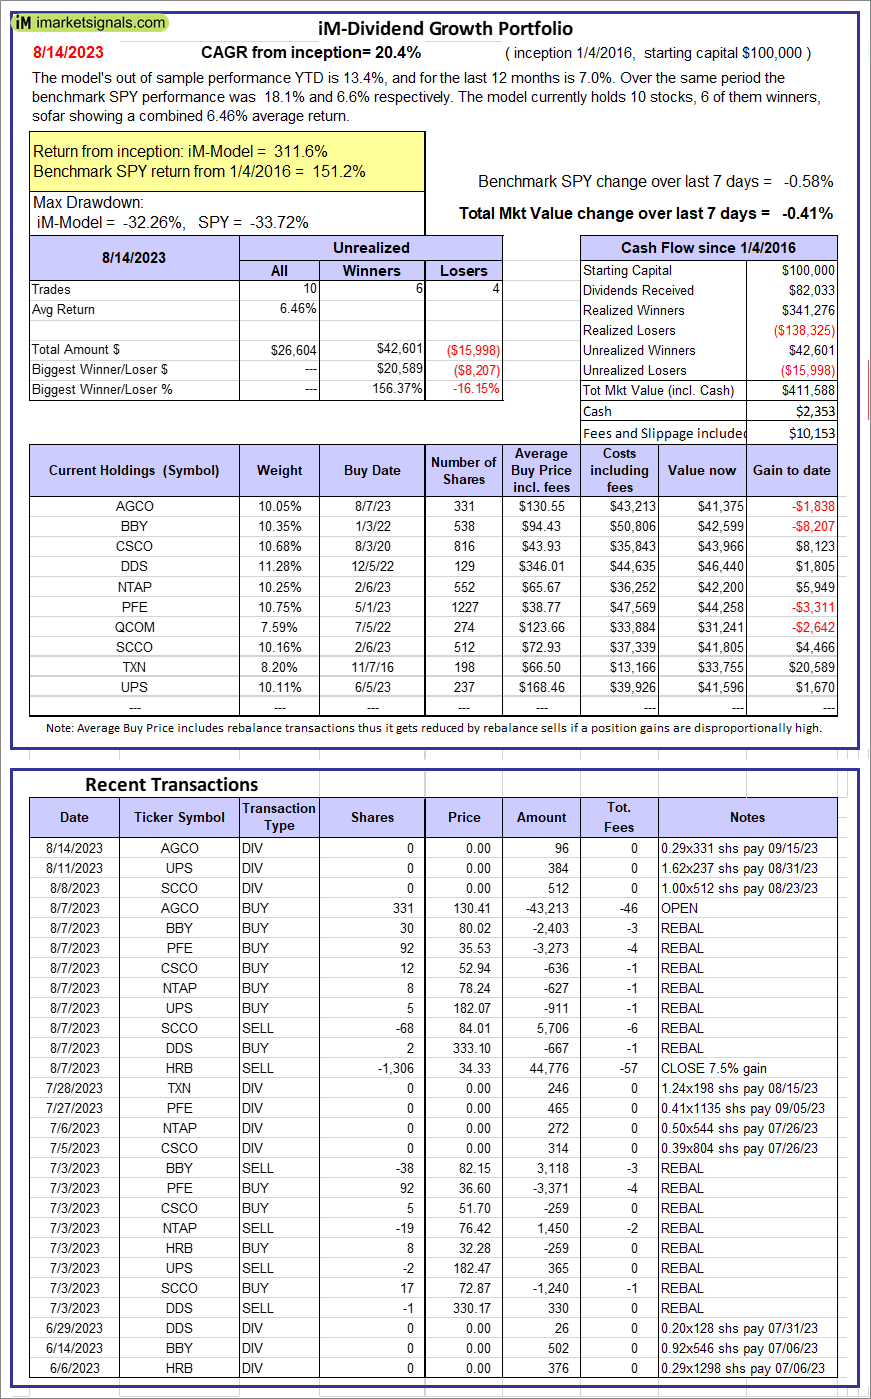 |
iM-Dividend Growth Portfolio: The model’s out of sample performance YTD is 13.4%, and for the last 12 months is 7.0%. Over the same period the benchmark SPY performance was 18.1% and 6.6% respectively. Over the previous week the market value of the iM-Dividend Growth Portfolio gained -0.41% at a time when SPY gained -0.58%. A starting capital of $100,000 at inception on 6/30/2016 would have grown to $411,588 which includes $2,353 cash and excludes $10,153 spent on fees and slippage. |
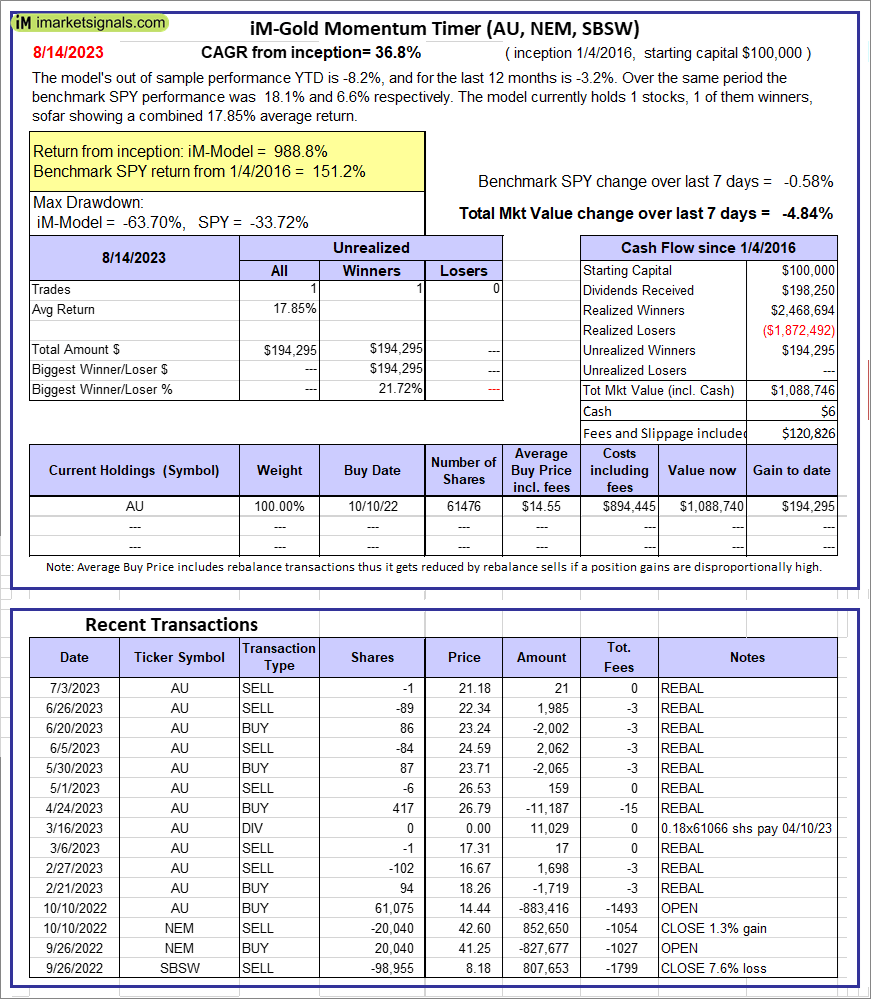 |
iM-Gold Momentum Timer (AU, NEM, SBSW): The model’s out of sample performance YTD is -8.2%, and for the last 12 months is -3.2%. Over the same period the benchmark SPY performance was 18.1% and 6.6% respectively. Over the previous week the market value of iM-Gold Momentum Timer (AU, NEM, SBSW) gained -4.84% at a time when SPY gained -0.58%. A starting capital of $100,000 at inception on 6/30/2016 would have grown to $06 which includes $120,826 cash and excludes Gain to date spent on fees and slippage. |
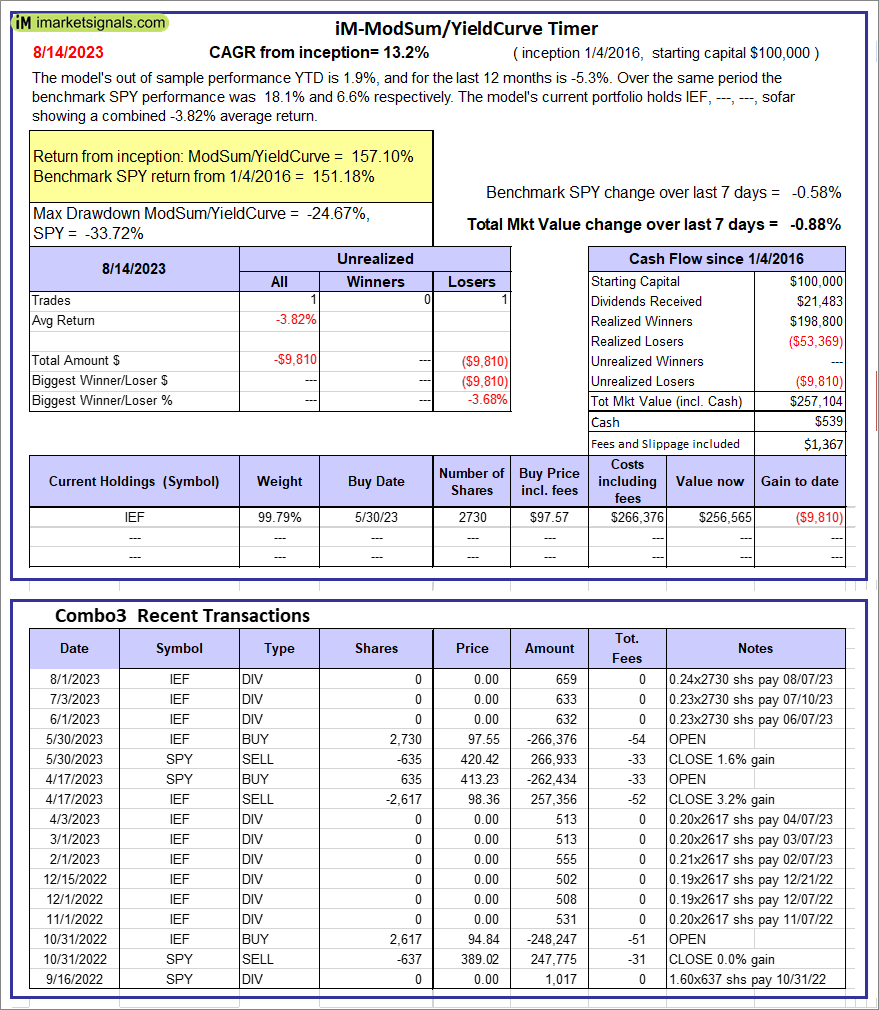 |
iM-ModSum/YieldCurve Timer: The model’s out of sample performance YTD is 1.9%, and for the last 12 months is -5.3%. Over the same period the benchmark SPY performance was 18.1% and 6.6% respectively. Over the previous week the market value of iM-PortSum/YieldCurve Timer gained -0.88% at a time when SPY gained -0.58%. A starting capital of $100,000 at inception on 1/1/2016 would have grown to $257,104 which includes $539 cash and excludes $1,367 spent on fees and slippage. |
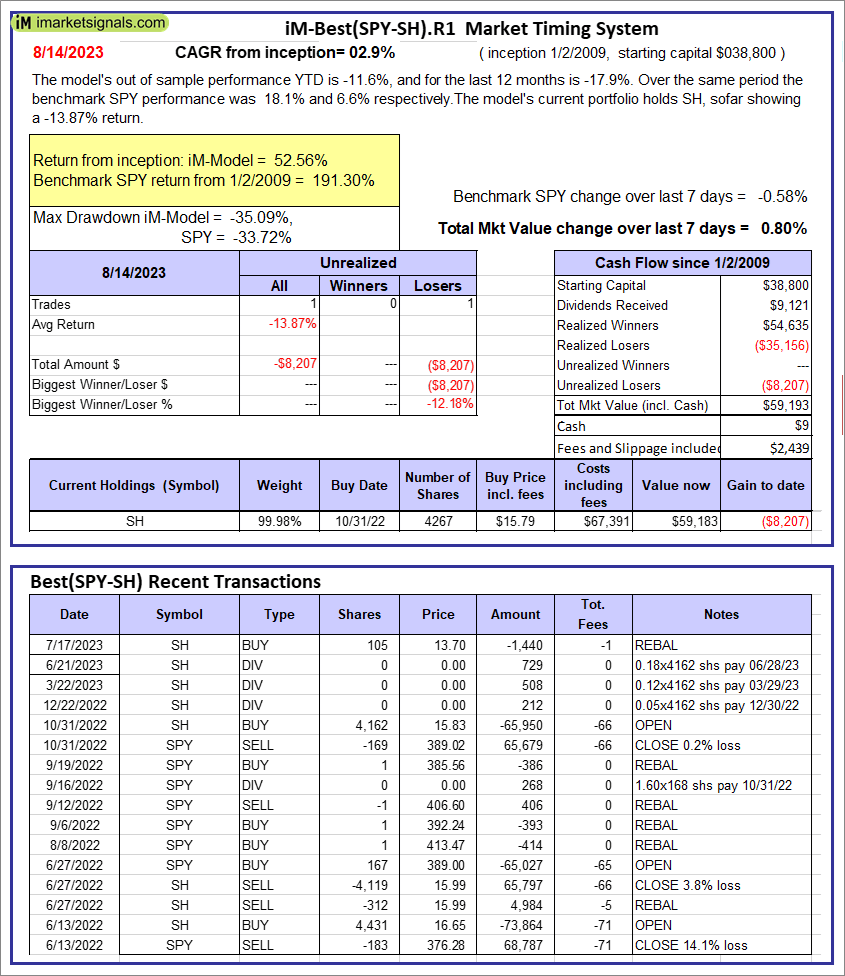 |
iM-Best(SPY-SH).R1: The model’s out of sample performance YTD is -11.6%, and for the last 12 months is -17.9%. Over the same period the benchmark SPY performance was 18.1% and 6.6% respectively. Over the previous week the market value of Best(SPY-SH) gained 0.80% at a time when SPY gained -0.58%. A starting capital of $100,000 at inception on 1/2/2009 would have grown to $59,193 which includes $9 cash and excludes $2,439 spent on fees and slippage. |
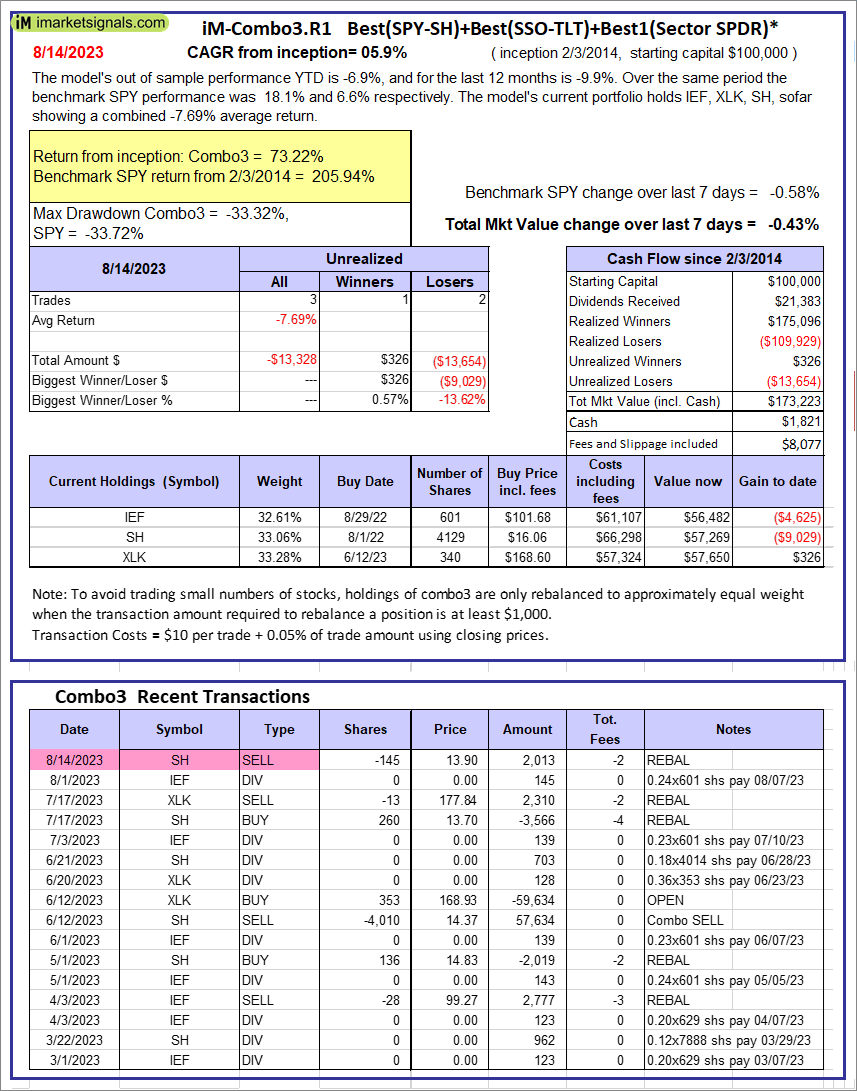 |
iM-Combo3.R1: The model’s out of sample performance YTD is -6.9%, and for the last 12 months is -9.9%. Over the same period the benchmark SPY performance was 18.1% and 6.6% respectively. Over the previous week the market value of iM-Combo3.R1 gained -0.43% at a time when SPY gained -0.58%. A starting capital of $100,000 at inception on 2/3/2014 would have grown to $173,223 which includes $1,821 cash and excludes $8,077 spent on fees and slippage. |
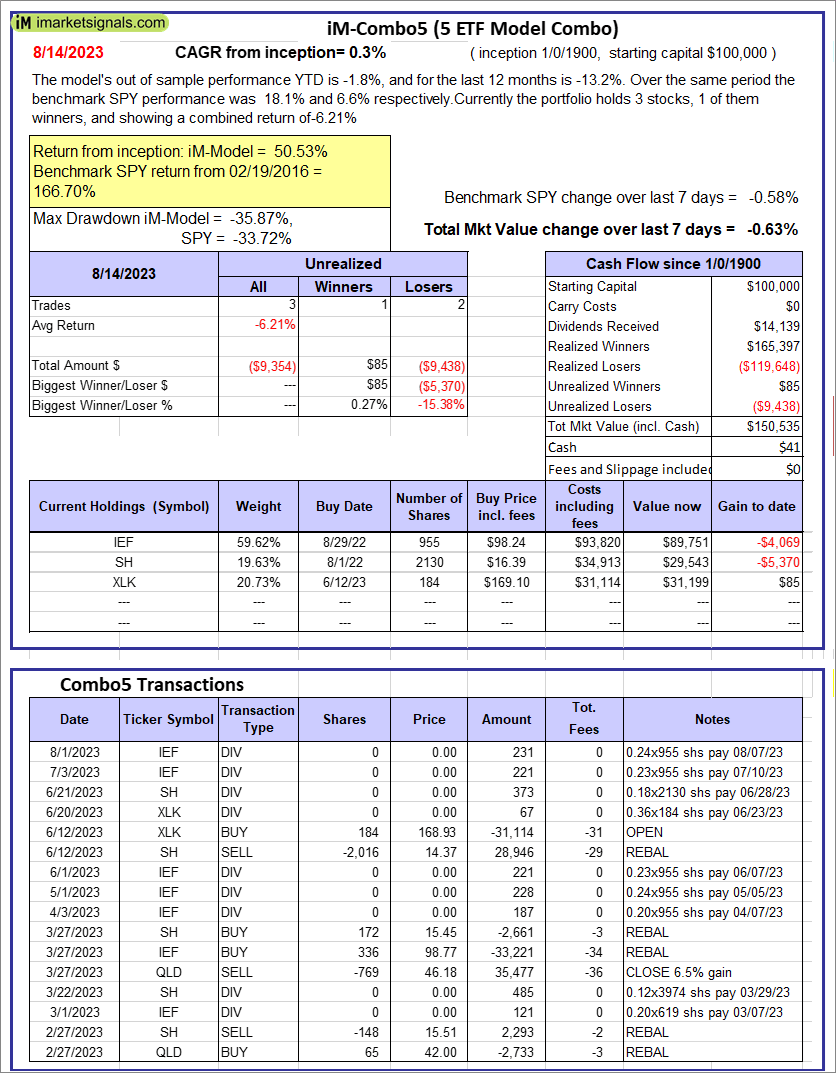 |
iM-Combo5: The model’s out of sample performance YTD is -1.8%, and for the last 12 months is -13.2%. Over the same period the benchmark SPY performance was 18.1% and 6.6% respectively. Over the previous week the market value of iM-Combo5 gained -0.63% at a time when SPY gained -0.58%. A starting capital of $100,000 at inception on 2/22/2016 would have grown to $150,535 which includes $41 cash and excludes $0 spent on fees and slippage. |
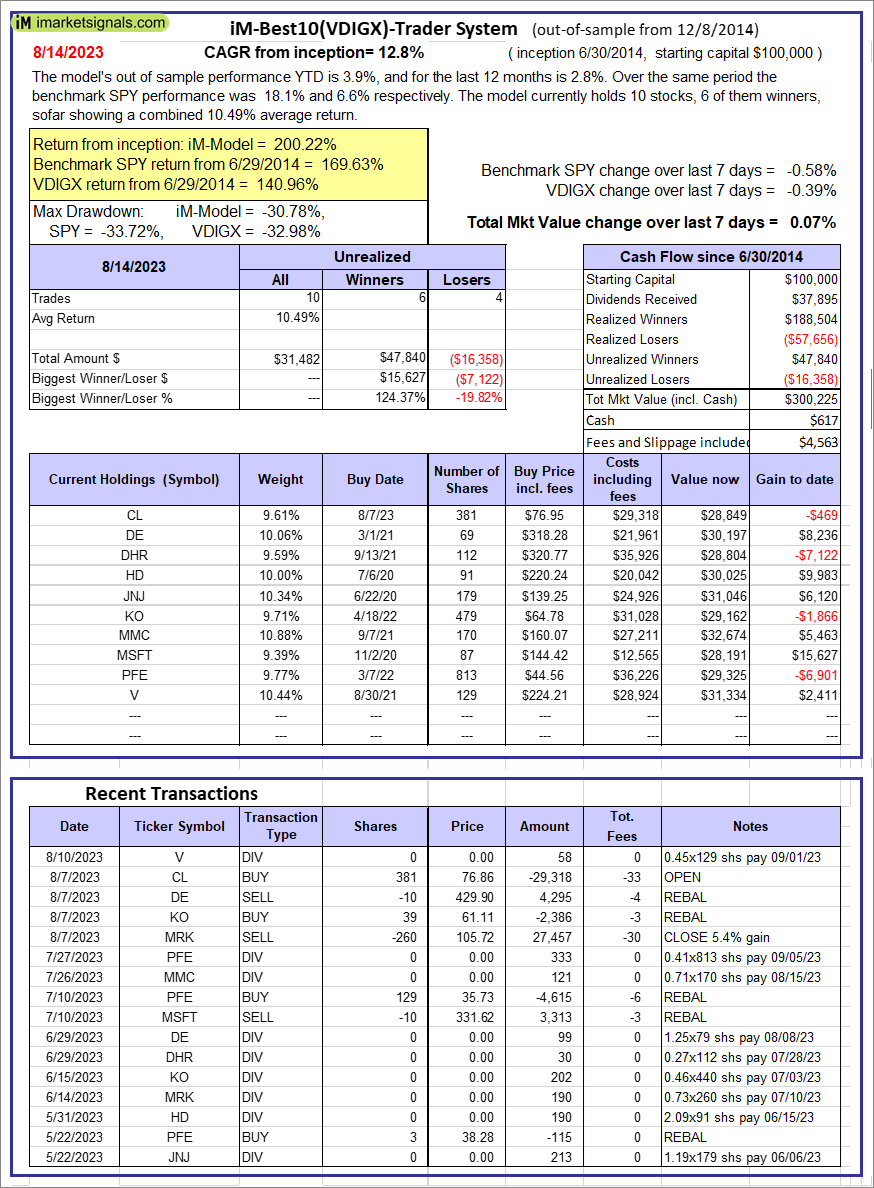 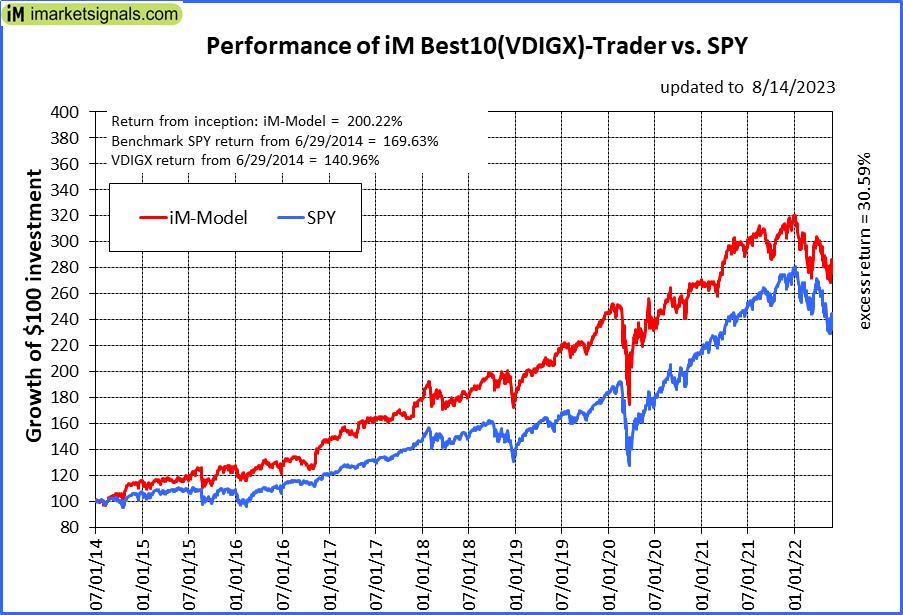 |
iM-Best10(VDIGX)-Trader: The model’s out of sample performance YTD is 3.9%, and for the last 12 months is 2.8%. Over the same period the benchmark SPY performance was 18.1% and 6.6% respectively. Since inception, on 7/1/2014, the model gained 200.22% while the benchmark SPY gained 169.63% and VDIGX gained 140.96% over the same period. Over the previous week the market value of iM-Best10(VDIGX) gained 0.07% at a time when SPY gained -0.58%. A starting capital of $100,000 at inception on 7/1/2014 would have grown to $300,225 which includes $617 cash and excludes $4,563 spent on fees and slippage. |
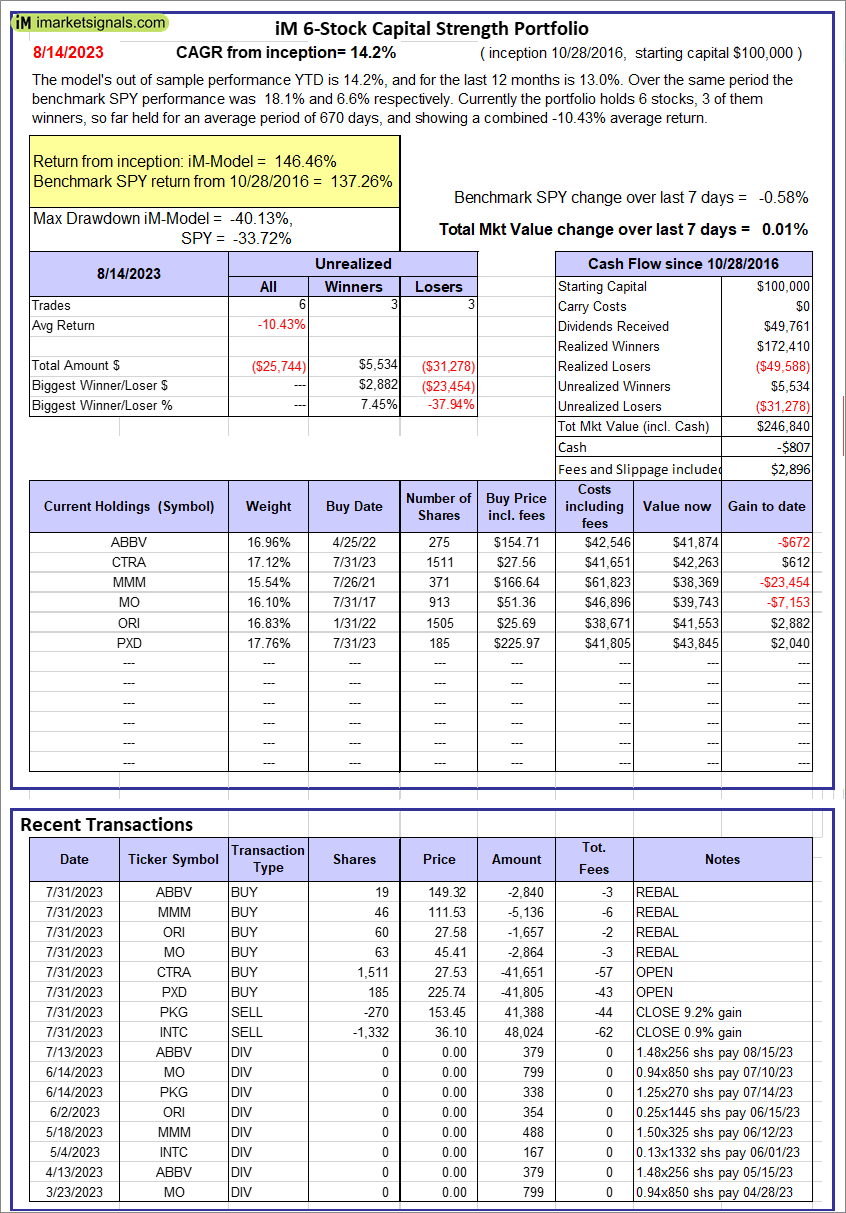 |
iM 6-Stock Capital Strength Portfolio: The model’s out of sample performance YTD is 14.2%, and for the last 12 months is 13.0%. Over the same period the benchmark SPY performance was 18.1% and 6.6% respectively. Over the previous week the market value of the iM 6-Stock Capital Strength Portfolio gained 0.01% at a time when SPY gained -0.58%. A starting capital of $100,000 at inception on 10/28/2016 would have grown to $246,840 which includes -$807 cash and excludes $2,896 spent on fees and slippage. |
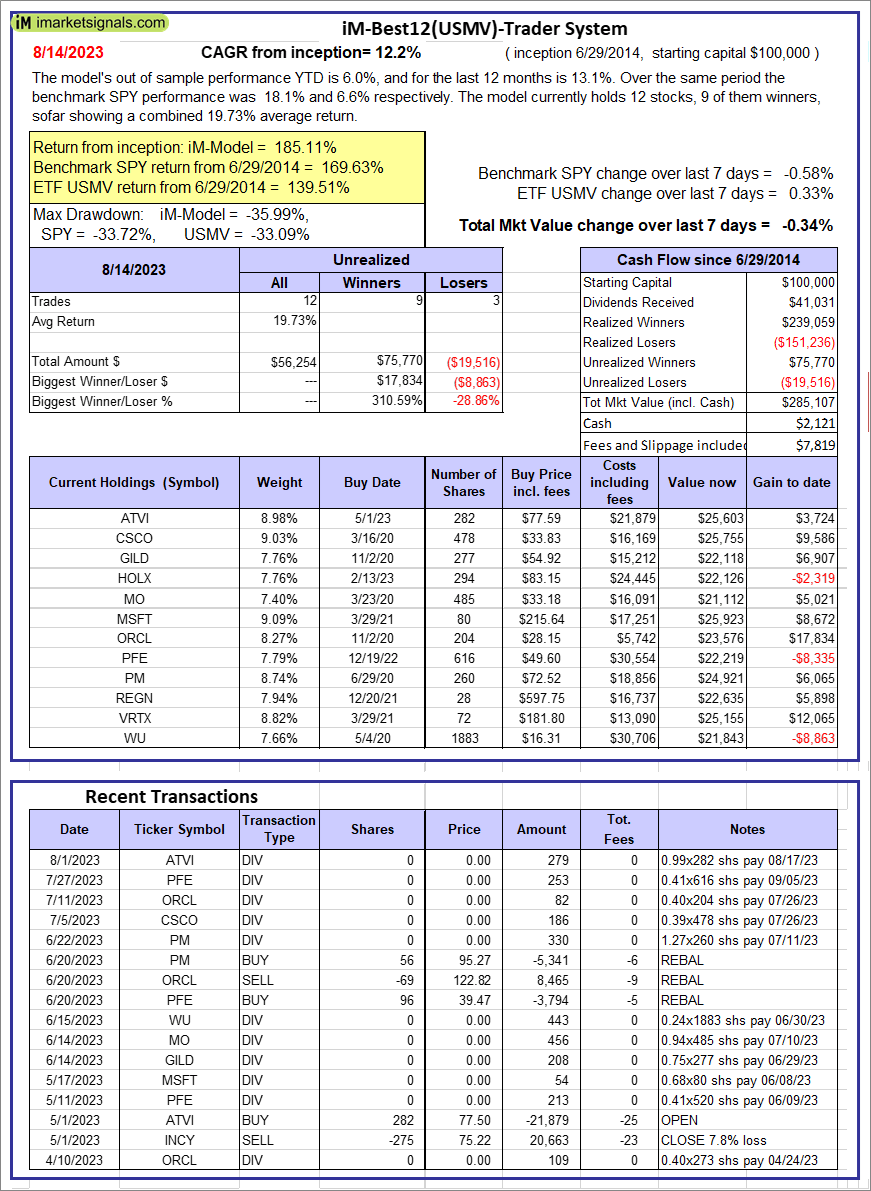 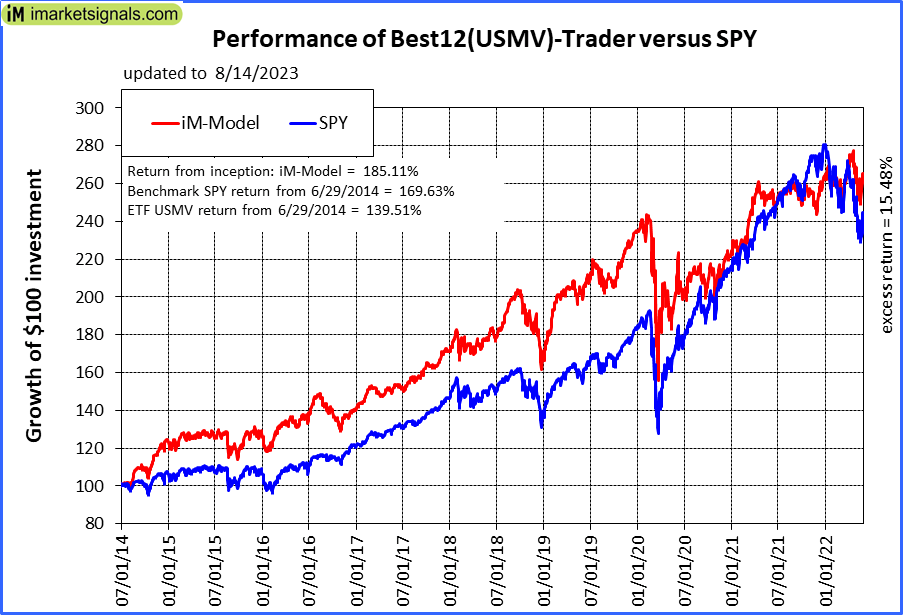 |
iM-Best12(USMV)-Trader: The model’s out of sample performance YTD is 6.0%, and for the last 12 months is 13.1%. Over the same period the benchmark SPY performance was 18.1% and 6.6% respectively. Since inception, on 6/30/2014, the model gained 185.11% while the benchmark SPY gained 169.63% and the ETF USMV gained 139.51% over the same period. Over the previous week the market value of iM-Best12(USMV)-Trader gained -0.34% at a time when SPY gained -0.58%. A starting capital of $100,000 at inception on 6/30/2014 would have grown to $285,107 which includes $2,121 cash and excludes $7,819 spent on fees and slippage. |
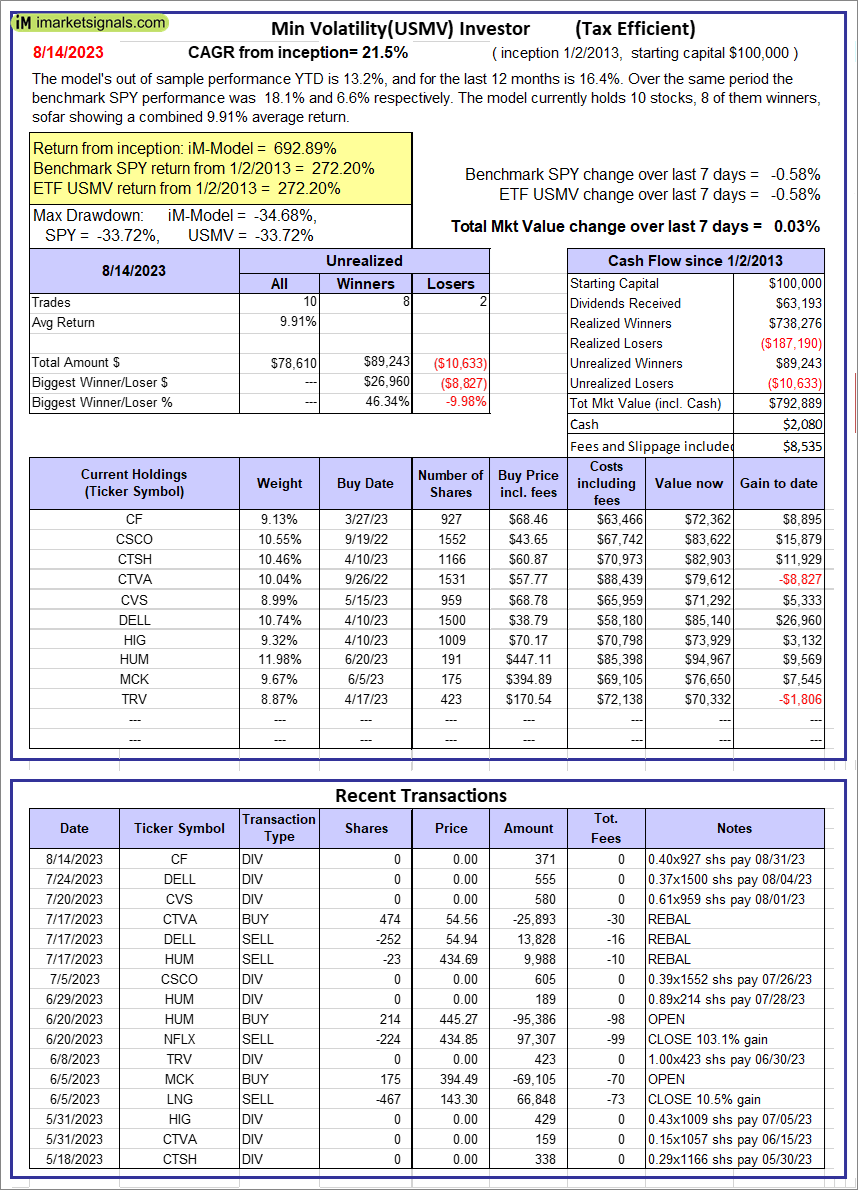 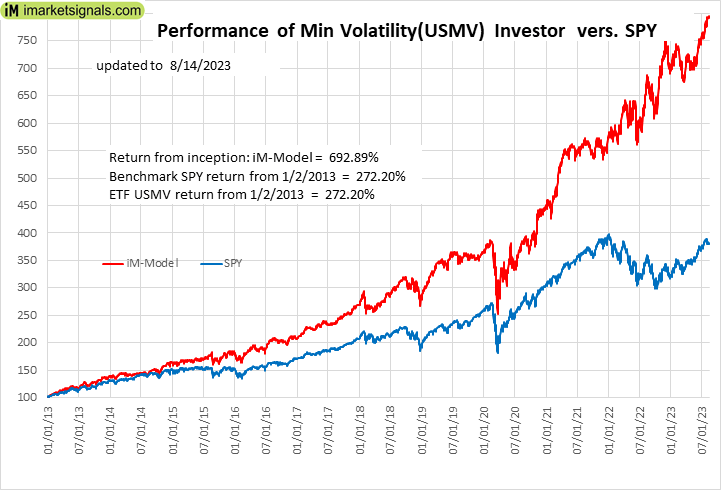 |
iM-Min Volatility(USMV) Investor (Tax Efficient): The model’s out of sample performance YTD is 13.2%, and for the last 12 months is 16.4%. Over the same period the benchmark SPY performance was 18.1% and 6.6% respectively. Since inception, on 1/3/2013, the model gained 692.89% while the benchmark SPY gained 272.20% and the ETF USMV gained 272.20% over the same period. Over the previous week the market value of iM-Best12(USMV)Q1 gained 0.03% at a time when SPY gained -0.58%. A starting capital of $100,000 at inception on 1/3/2013 would have grown to $792,889 which includes $2,080 cash and excludes $8,535 spent on fees and slippage. |
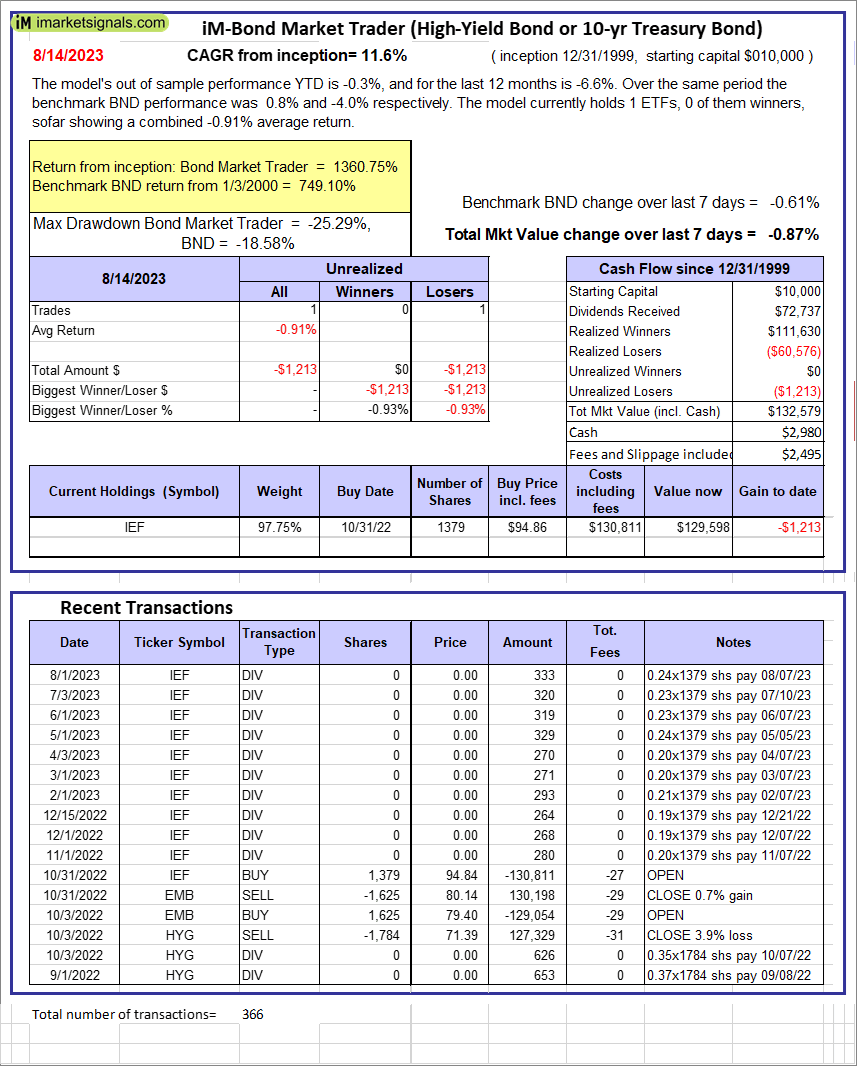 |
iM-Bond Market Trader (High-Yield Bond or 10-yr Treasury Bond): The model’s out of sample performance YTD is -0.3%, and for the last 12 months is -6.6%. Over the same period the benchmark BND performance was 0.8% and -4.0% respectively. Over the previous week the market value of the iM-Bond Market Trader (High-Yield Bond or 10-yr Treasury Bond) gained -0.87% at a time when BND gained -0.61%. A starting capital of $10,000 at inception on 1/3/2000 would have grown to $132,579 which includes $2,980 cash and excludes $2,495 spent on fees and slippage. |
|
|
iM-ModSum/YieldCurve Timer: The model’s out of sample performance YTD is 1.9%, and for the last 12 months is -5.3%. Over the same period the benchmark SPY performance was 18.1% and 6.6% respectively. Over the previous week the market value of iM-PortSum/YieldCurve Timer gained -0.88% at a time when SPY gained -0.58%. A starting capital of $100,000 at inception on 1/1/2016 would have grown to $257,104 which includes $539 cash and excludes $1,367 spent on fees and slippage. |
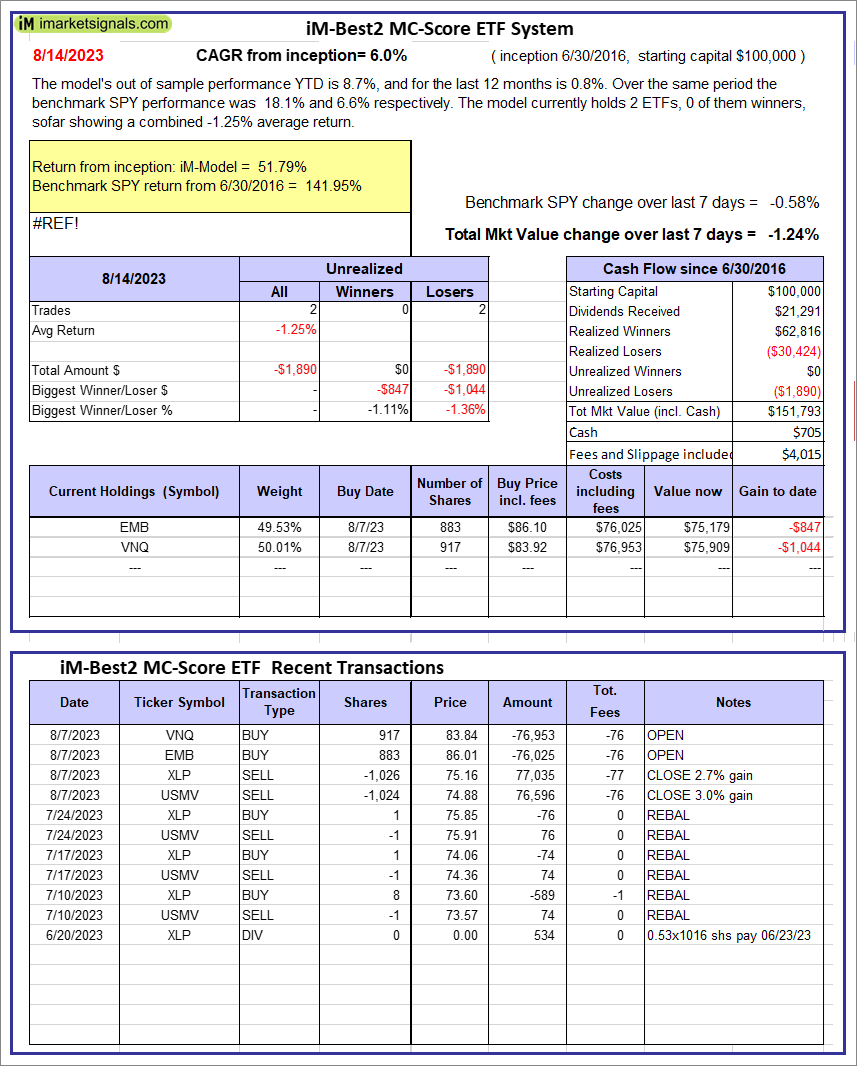 |
iM-Best2 MC-Score ETF System: The model’s out of sample performance YTD is 8.7%, and for the last 12 months is 0.8%. Over the same period the benchmark SPY performance was 18.1% and 6.6% respectively. Over the previous week the market value of the iM-Best2 MC-Score ETF System gained -1.24% at a time when SPY gained -0.58%. A starting capital of $100,000 at inception on 6/30/2016 would have grown to $151,793 which includes $705 cash and excludes $4,015 spent on fees and slippage. |
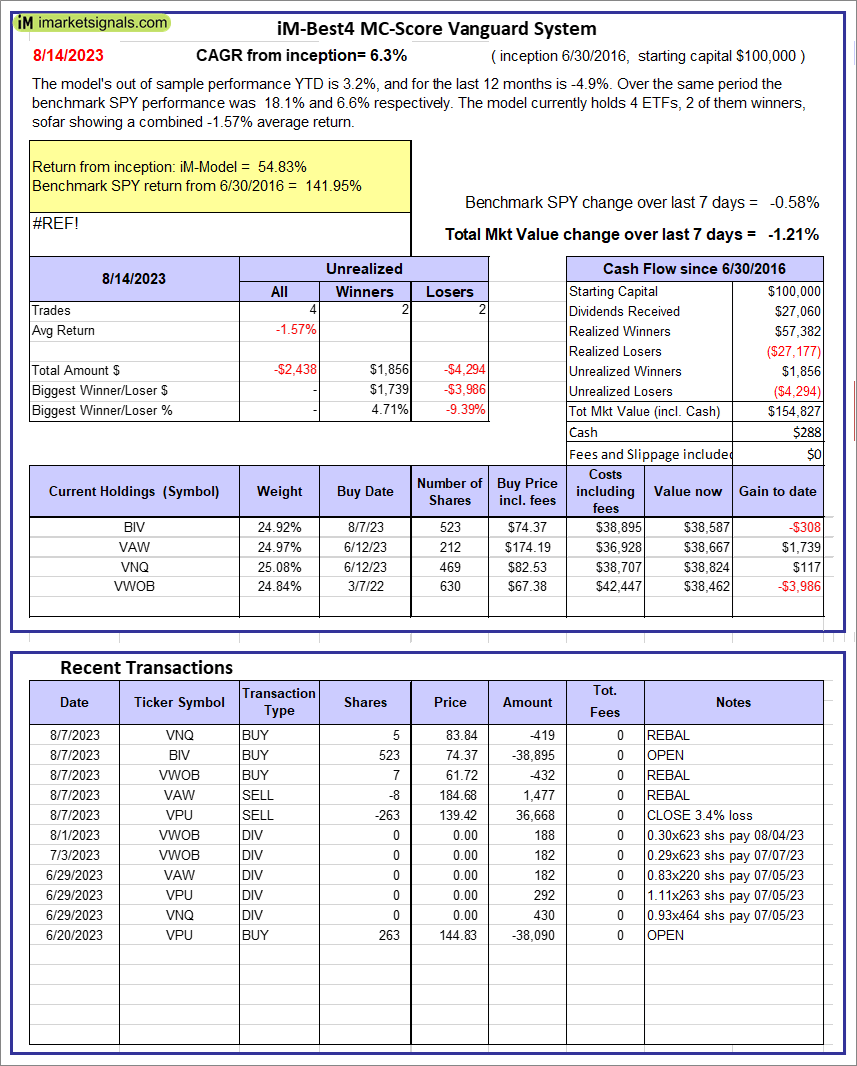 |
iM-Best4 MC-Score Vanguard System: The model’s out of sample performance YTD is 3.2%, and for the last 12 months is -4.9%. Over the same period the benchmark SPY performance was 18.1% and 6.6% respectively. Over the previous week the market value of the iM-Best4 MC-Score Vanguard System gained -1.21% at a time when SPY gained -0.58%. A starting capital of $100,000 at inception on 6/30/2016 would have grown to $154,827 which includes $288 cash and excludes $00 spent on fees and slippage. |
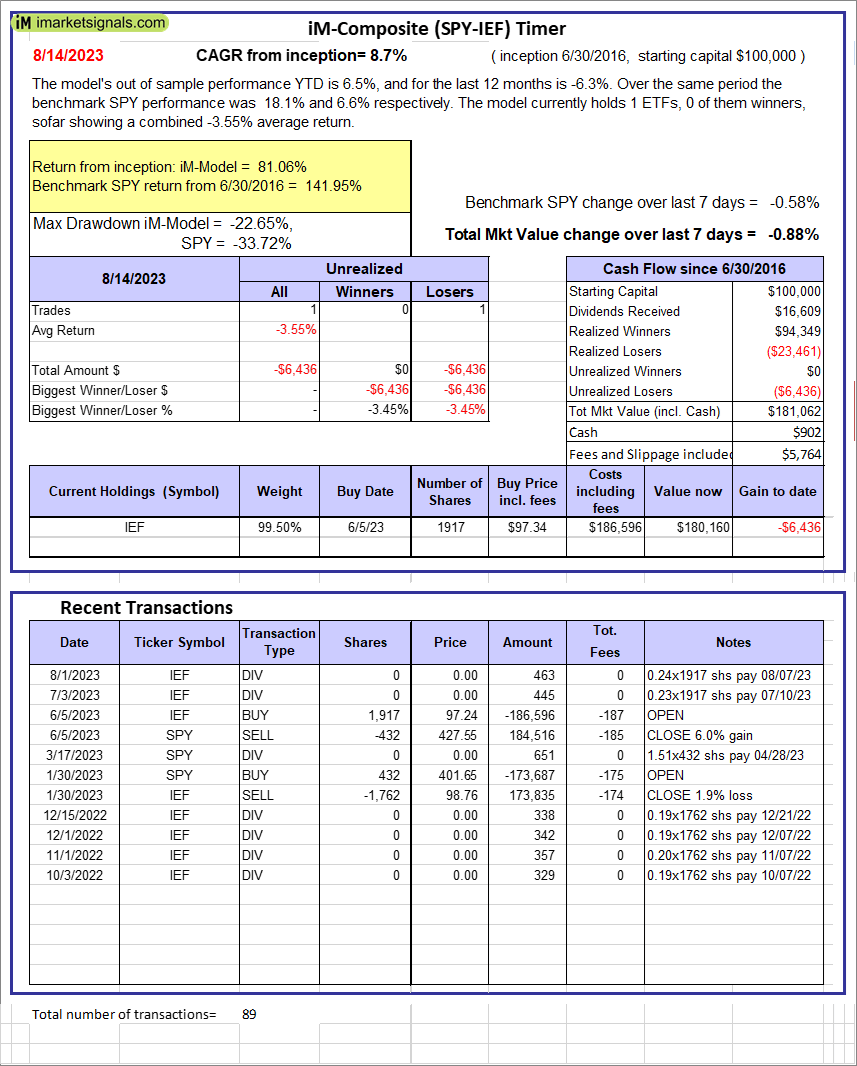 |
iM-Composite (SPY-IEF) Timer: The model’s out of sample performance YTD is 6.5%, and for the last 12 months is -6.3%. Over the same period the benchmark SPY performance was 18.1% and 6.6% respectively. Over the previous week the market value of the iM-Composite (SPY-IEF) Timer gained -0.88% at a time when SPY gained -0.58%. A starting capital of $100,000 at inception on 6/30/2016 would have grown to $181,062 which includes $902 cash and excludes $5,764 spent on fees and slippage. |
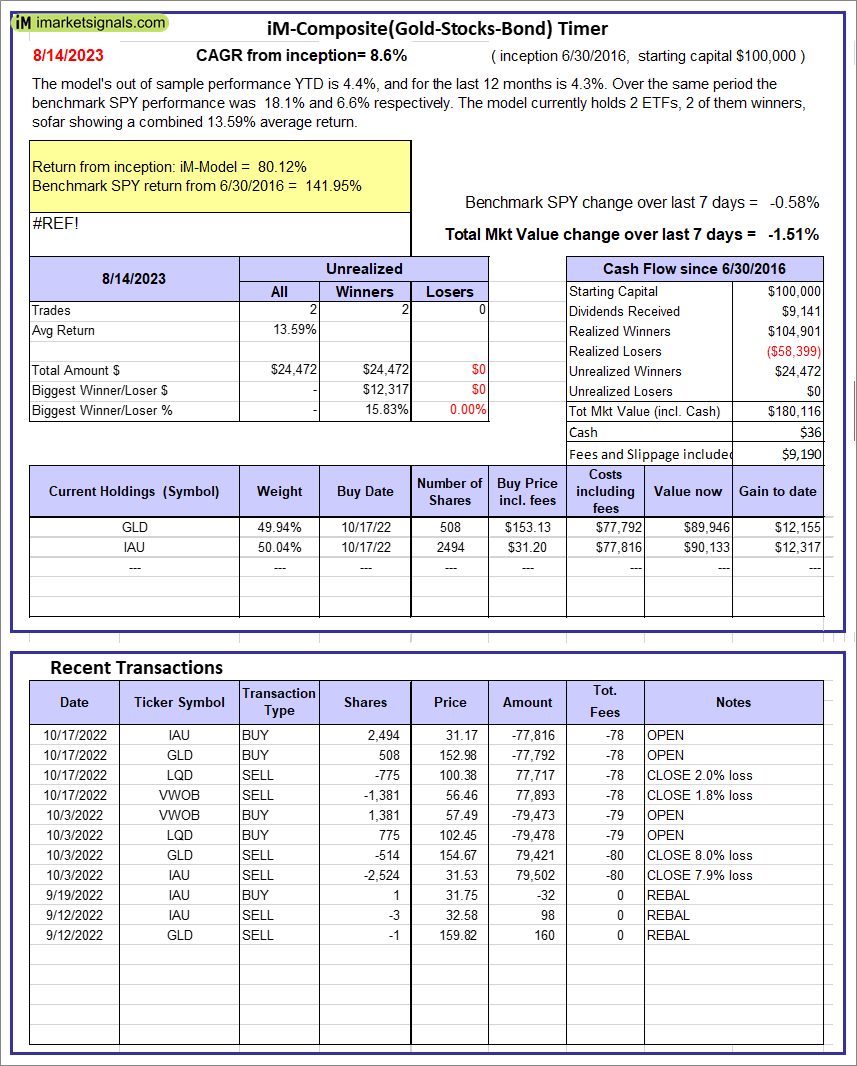 |
iM-Composite(Gold-Stocks-Bond) Timer: The model’s out of sample performance YTD is 4.4%, and for the last 12 months is 4.3%. Over the same period the benchmark SPY performance was 18.1% and 6.6% respectively. Over the previous week the market value of the iM-Composite(Gold-Stocks-Bond) Timer gained -1.51% at a time when SPY gained -0.58%. A starting capital of $100,000 at inception on 6/30/2016 would have grown to $180,116 which includes $36 cash and excludes $9,190 spent on fees and slippage. |
iM-Best Reports – 8/15/2023
Posted in pmp SPY-SH
Leave a Reply
You must be logged in to post a comment.