
  |
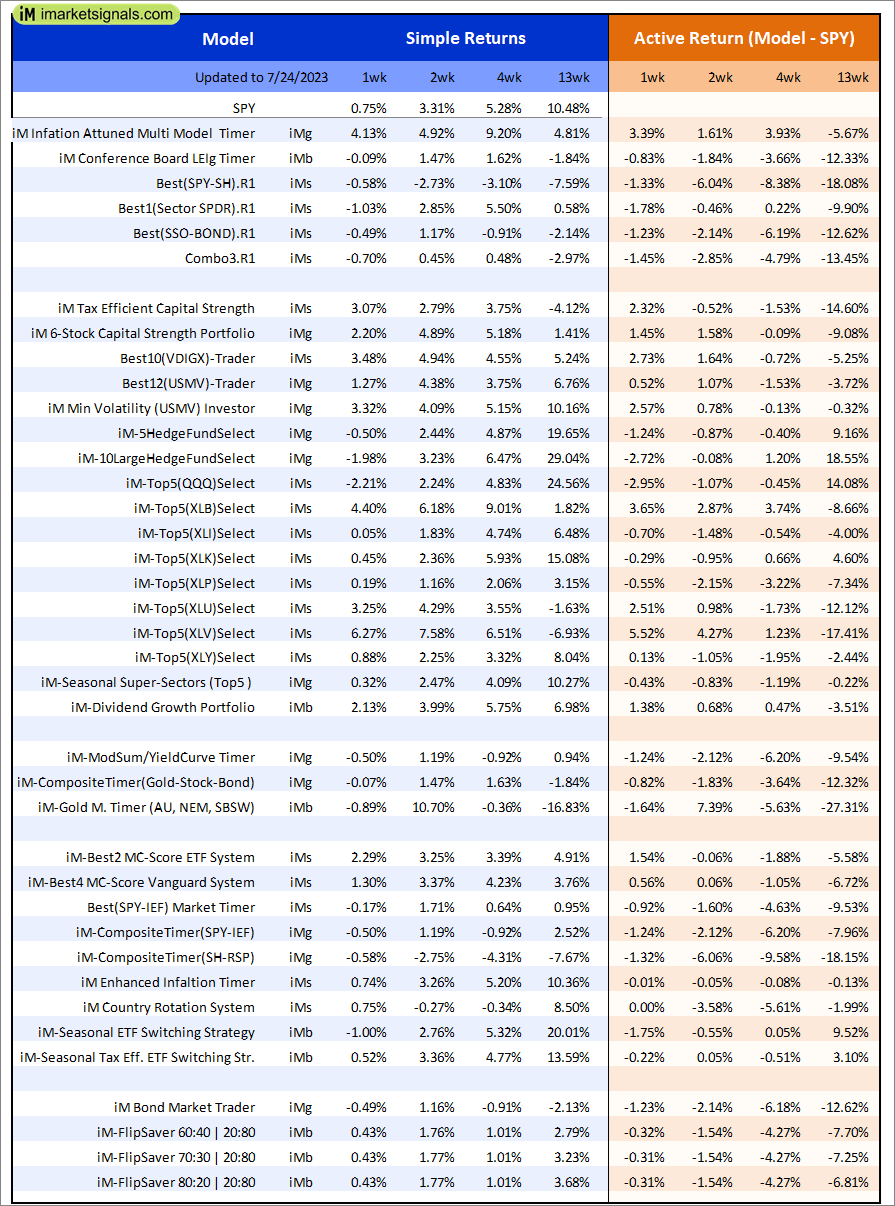
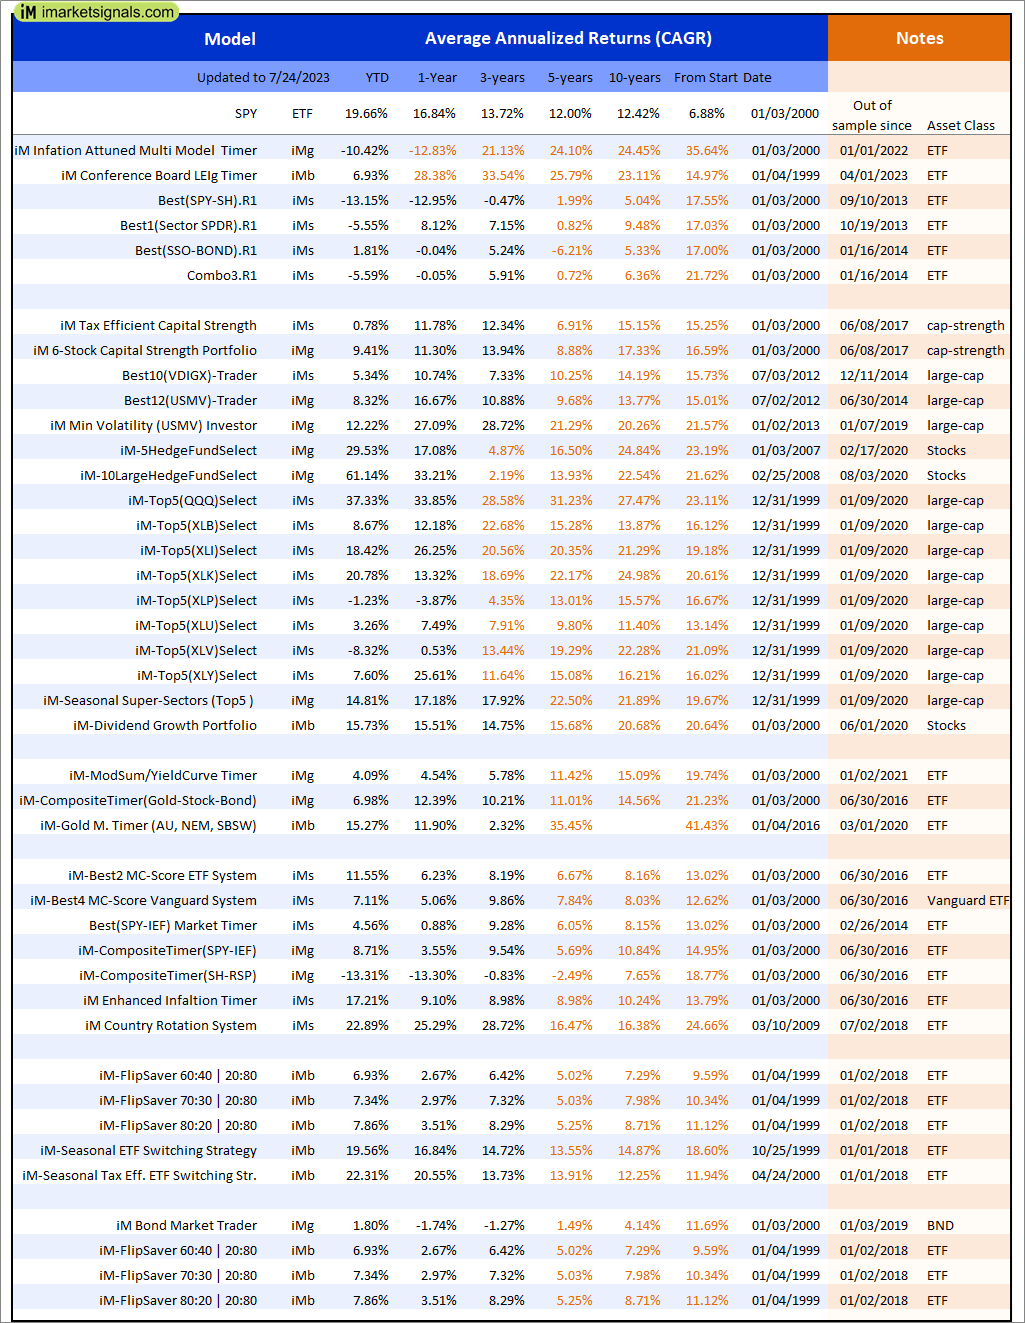
Out of sample performance summary of our models for the past 1, 2, 4 and 13 week periods. The active active return indicates how the models over- or underperformed the benchmark ETF SPY. Also the YTD, and the 1-, 3-, 5- and 10-year annualized returns are shown in the second table |
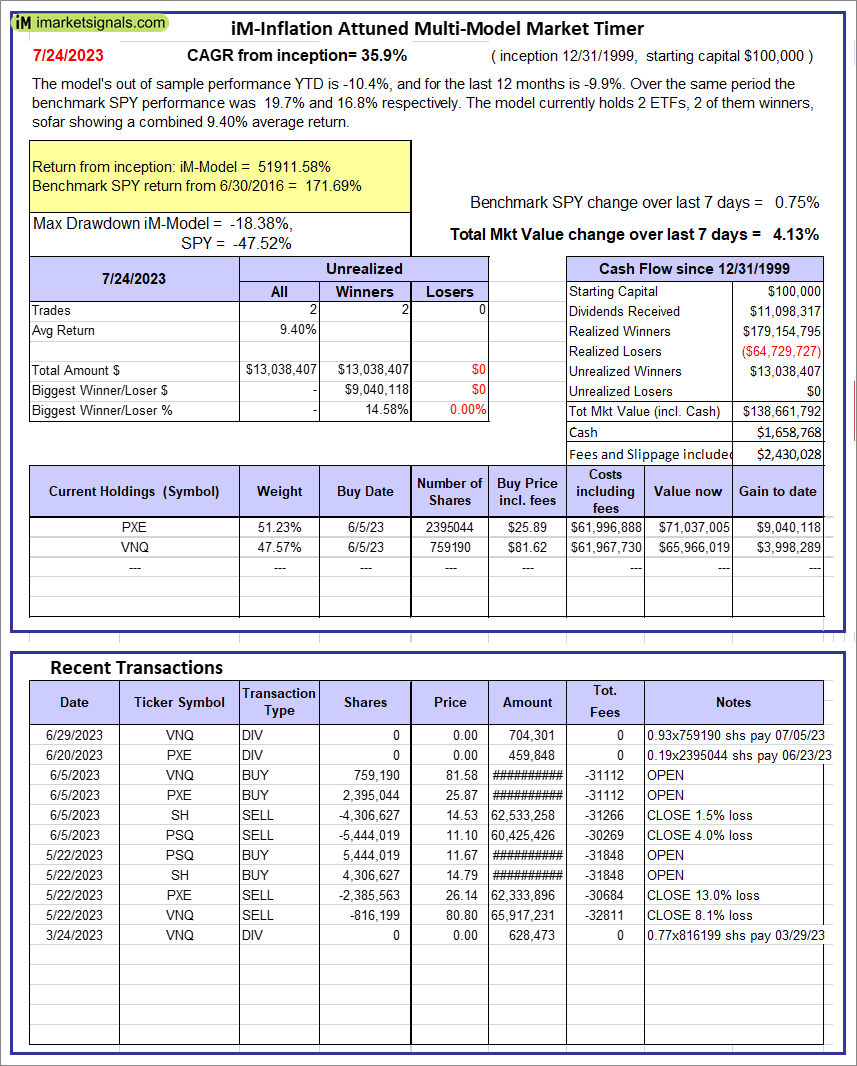 |
iM-Inflation Attuned Multi-Model Market Timer: The model’s out of sample performance YTD is -10.4%, and for the last 12 months is -9.9%. Over the same period the benchmark SPY performance was 19.7% and 16.8% respectively. Over the previous week the market value of the iM-Inflation Attuned Multi-Model Market Timer gained 4.13% at a time when SPY gained 0.75%. A starting capital of $100,000 at inception on 3/24/2017 would have grown to $138,661,792 which includes $1,658,768 cash and excludes $2,430,028 spent on fees and slippage. |
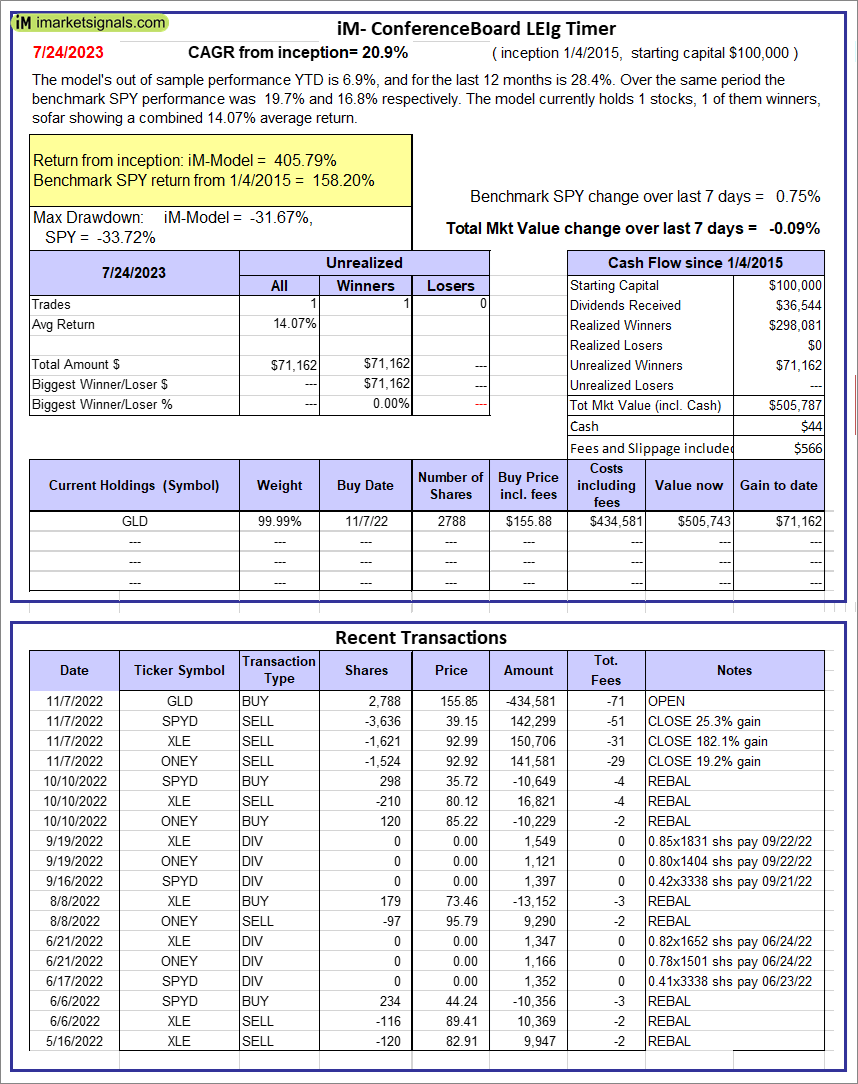 |
iM-Conference Board LEIg Timer: The model’s performance YTD is 14.3%, and for the last 12 months is 7.3%. Over the same period the benchmark SPY performance was 20.1% and 9.4% respectively. Over the previous week the market value of the iM-Conference Board LEIg Timer gained -0.09% at a time when SPY gained 0.75%. A starting capital of $100,000 at inception on 4/5/2017 would have grown to $505,787 which includes $44 cash and excludes $566 spent on fees and slippage. |
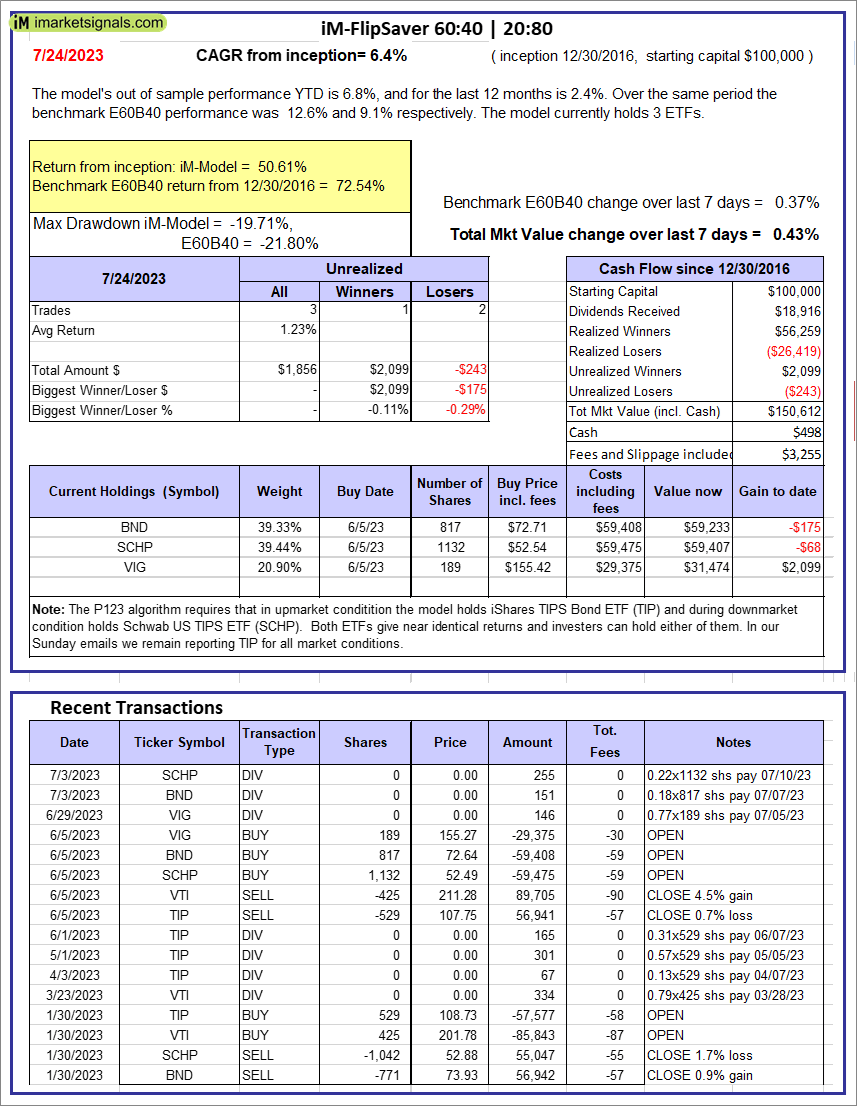 |
iM-FlipSaver 60:40 | 20:80 – 2017: The model’s out of sample performance YTD is 6.8%, and for the last 12 months is 2.4%. Over the same period the benchmark E60B40 performance was 12.6% and 9.1% respectively. Over the previous week the market value of iM-FlipSaver 80:20 | 20:80 gained 0.43% at a time when SPY gained 0.37%. A starting capital of $100,000 at inception on 7/16/2015 would have grown to $150,612 which includes $498 cash and excludes $3,255 spent on fees and slippage. |
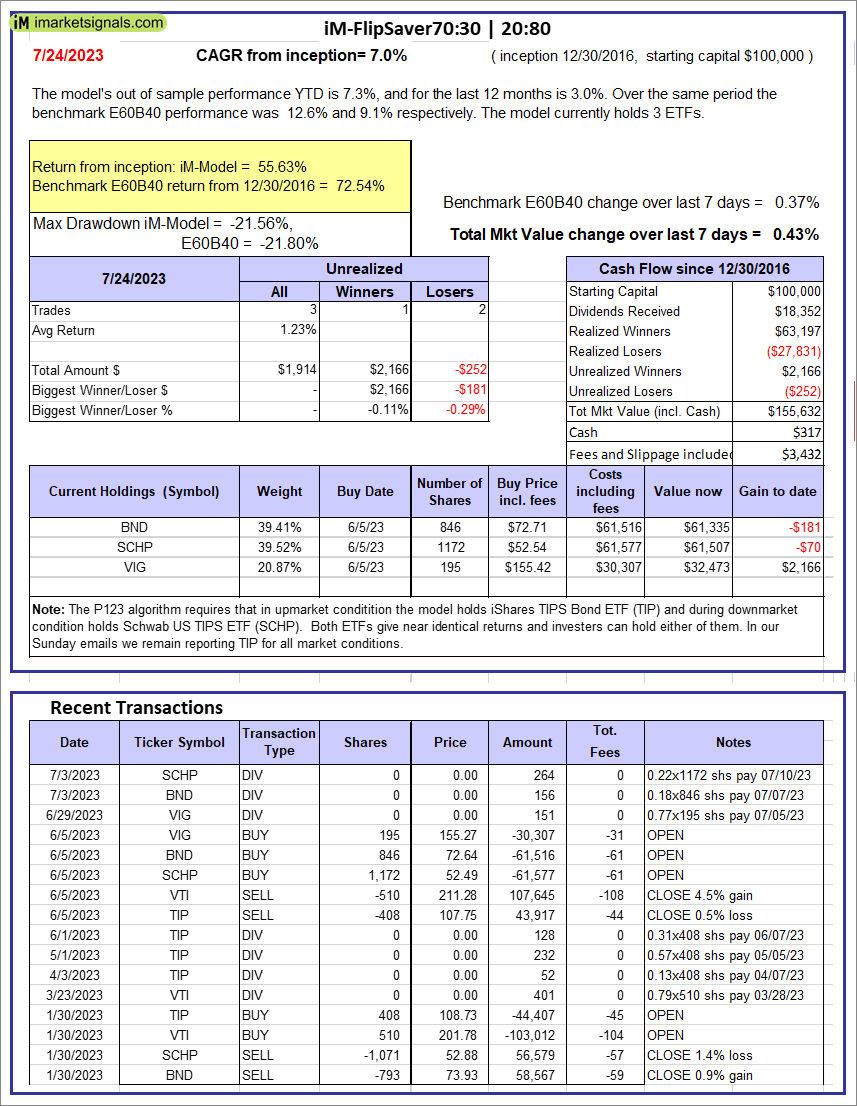 |
iM-FlipSaver 70:30 | 20:80 – 2017: The model’s out of sample performance YTD is 7.3%, and for the last 12 months is 3.0%. Over the same period the benchmark E60B40 performance was 12.6% and 9.1% respectively. Over the previous week the market value of iM-FlipSaver 70:30 | 20:80 gained 0.43% at a time when SPY gained 0.37%. A starting capital of $100,000 at inception on 7/15/2015 would have grown to $155,632 which includes $317 cash and excludes $3,432 spent on fees and slippage. |
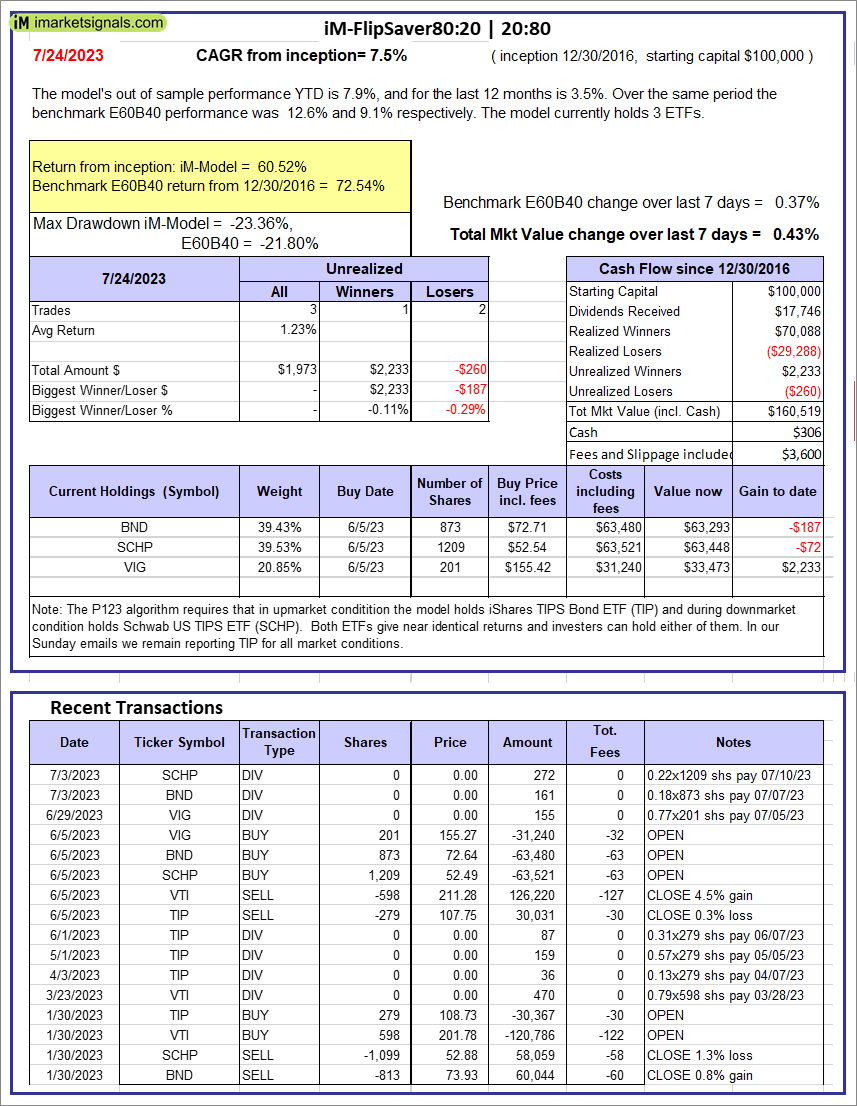 |
iM-FlipSaver 80:20 | 20:80 – 2017: The model’s out of sample performance YTD is 7.9%, and for the last 12 months is 3.5%. Over the same period the benchmark E60B40 performance was 12.6% and 9.1% respectively. Over the previous week the market value of iM-FlipSaver 80:20 | 20:80 gained 0.43% at a time when SPY gained 0.37%. A starting capital of $100,000 at inception on 1/2/2017 would have grown to $160,519 which includes $306 cash and excludes $3,600 spent on fees and slippage. |
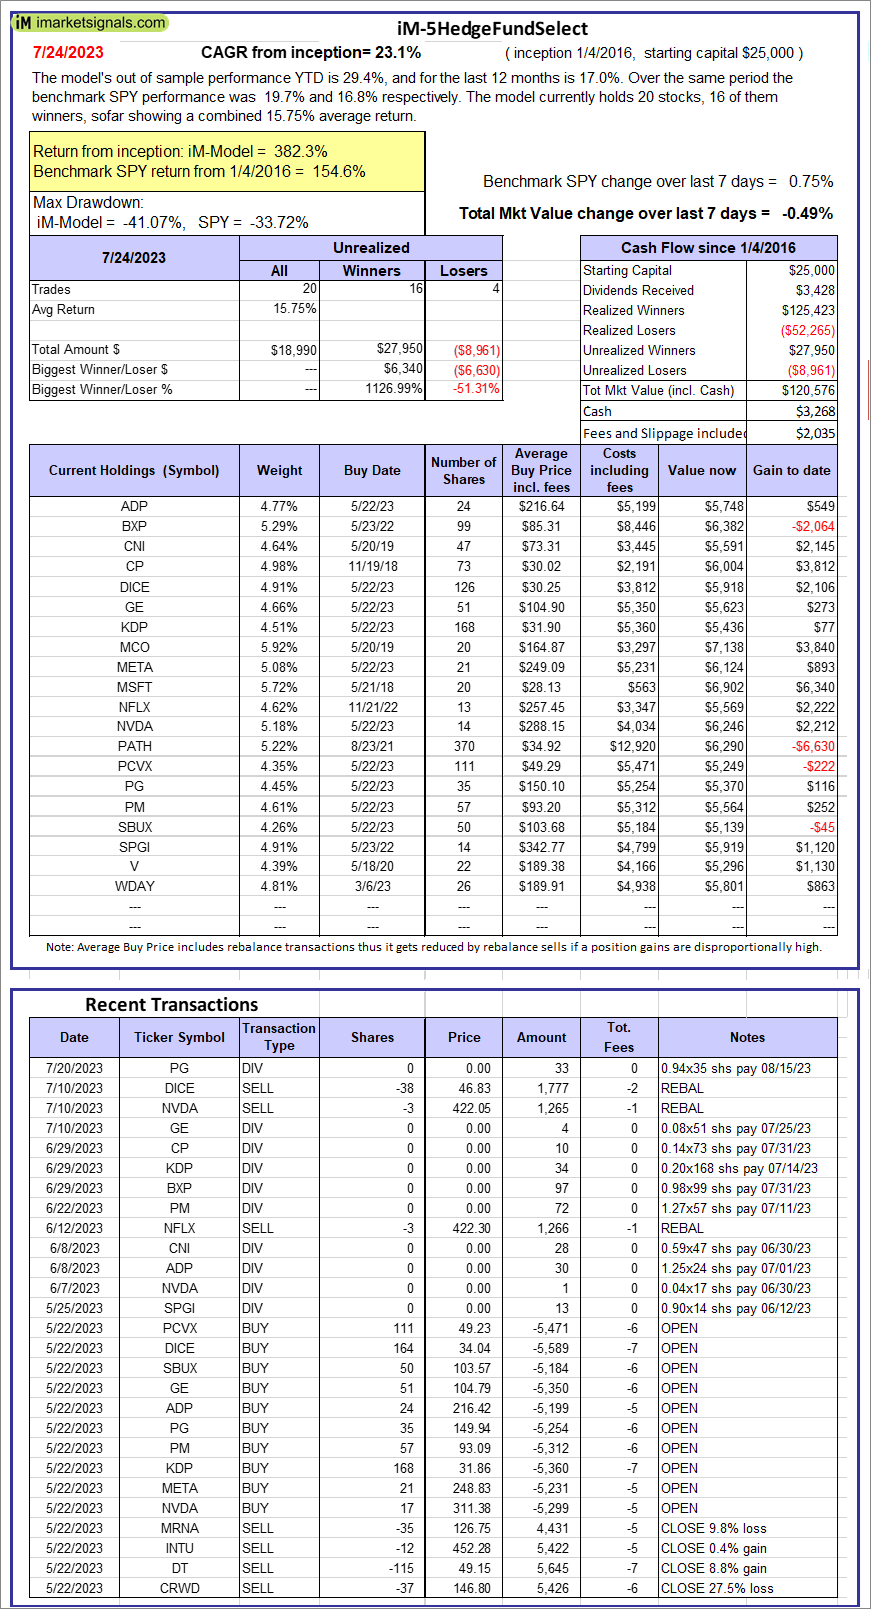 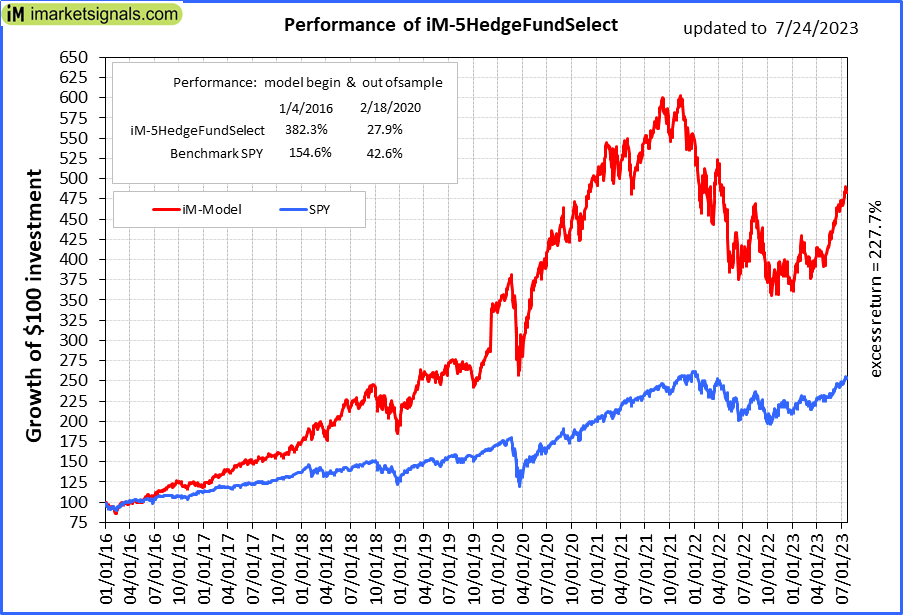 |
iM-5HedgeFundSelect: Since inception, on 1/5/2016, the model gained 382.30% while the benchmark SPY gained 154.59% over the same period. Over the previous week the market value of iM-5HedgeFundSelect gained -0.49% at a time when SPY gained 0.75%. A starting capital of $25,000 at inception on 1/5/2016 would have grown to $120,576 which includes $3,268 cash and excludes $2,035 spent on fees and slippage. |
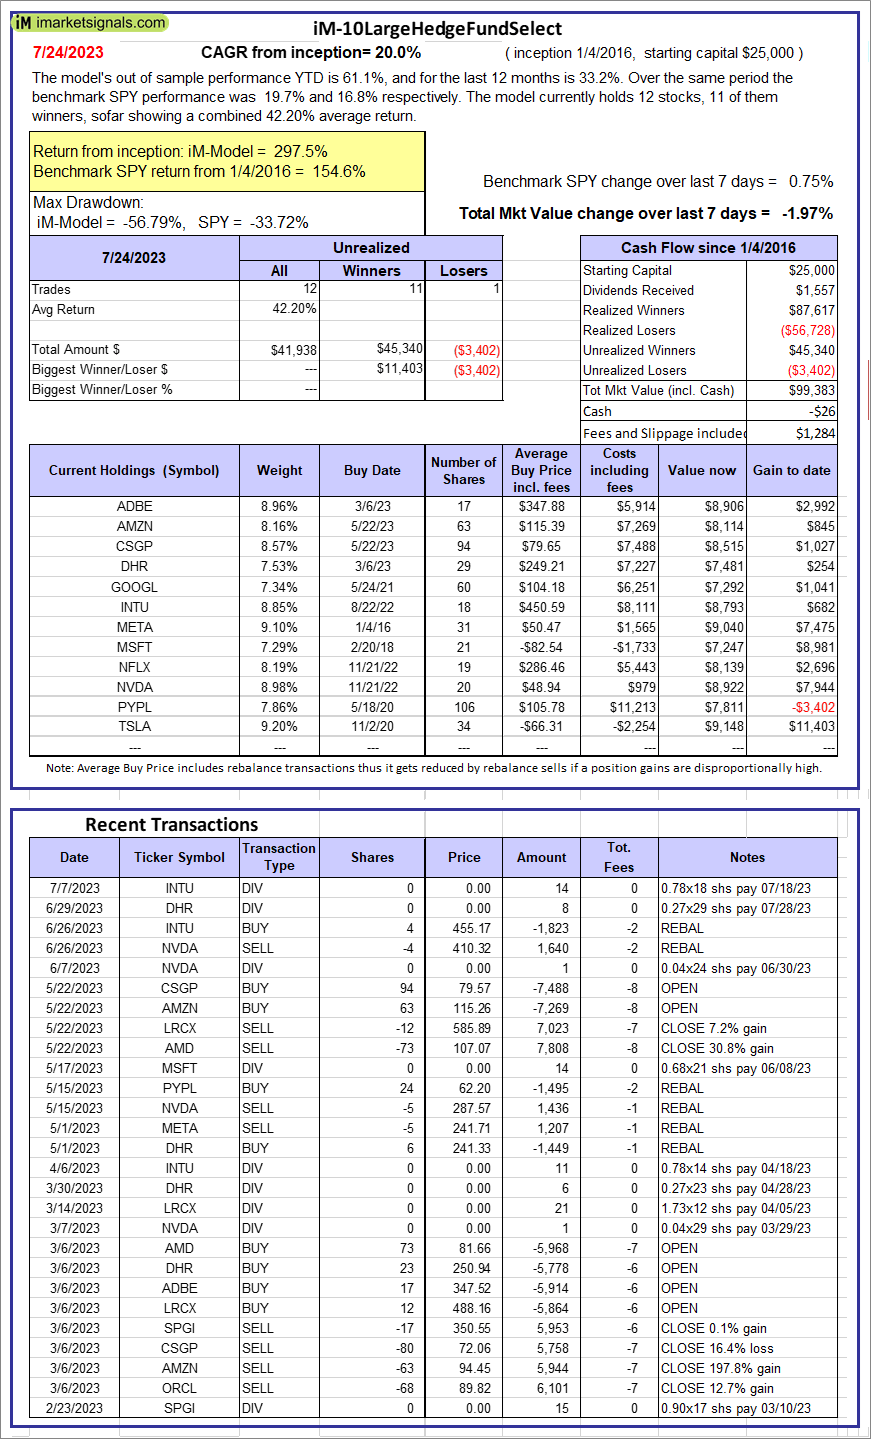 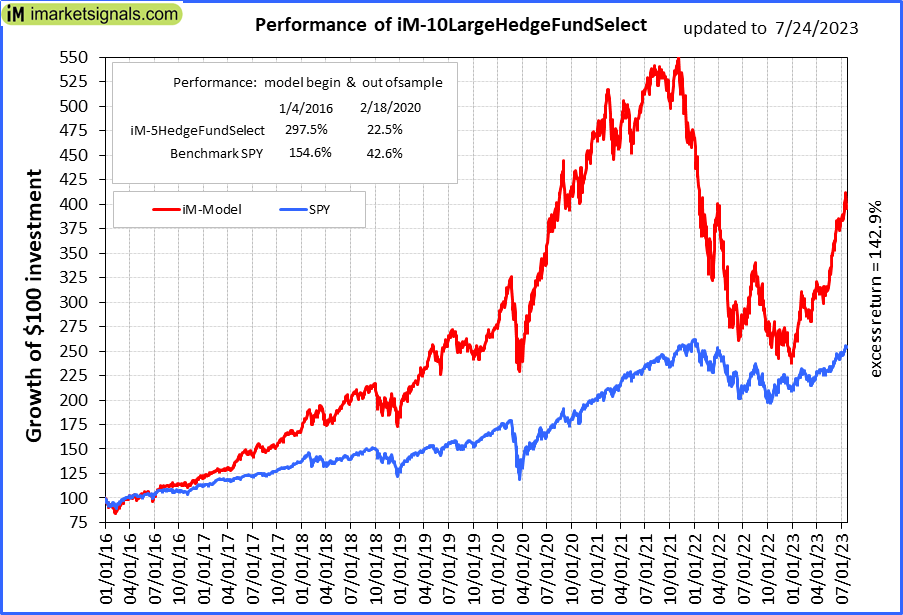 |
iM-10LargeHedgeFundSelect: Since inception, on 1/5/2016, the model gained 297.53% while the benchmark SPY gained 154.59% over the same period. Over the previous week the market value of iM-10LargeHedgeFundSelect gained -1.97% at a time when SPY gained 0.75%. A starting capital of $25,000 at inception on 1/5/2016 would have grown to $99,383 which includes -$26 cash and excludes $1,284 spent on fees and slippage. |
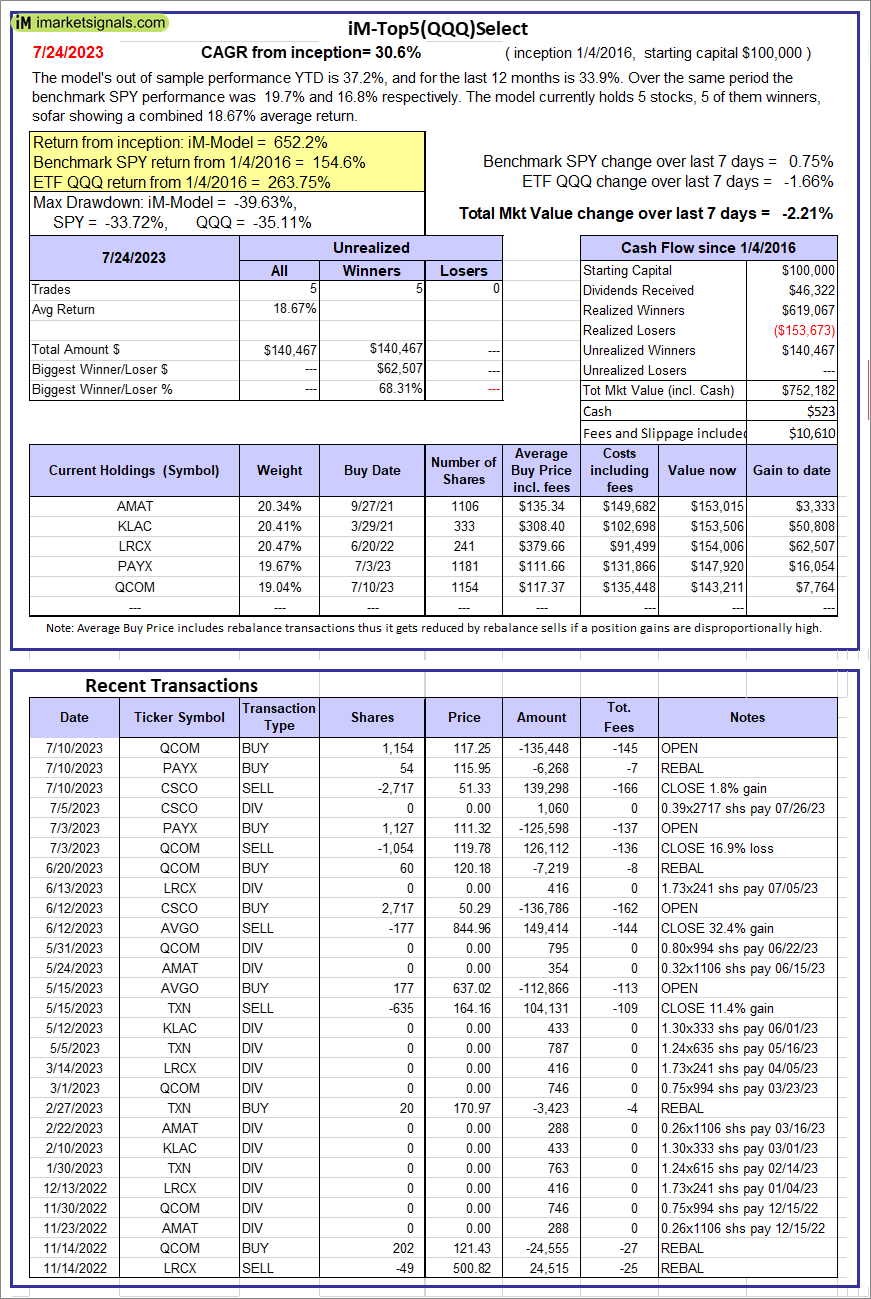 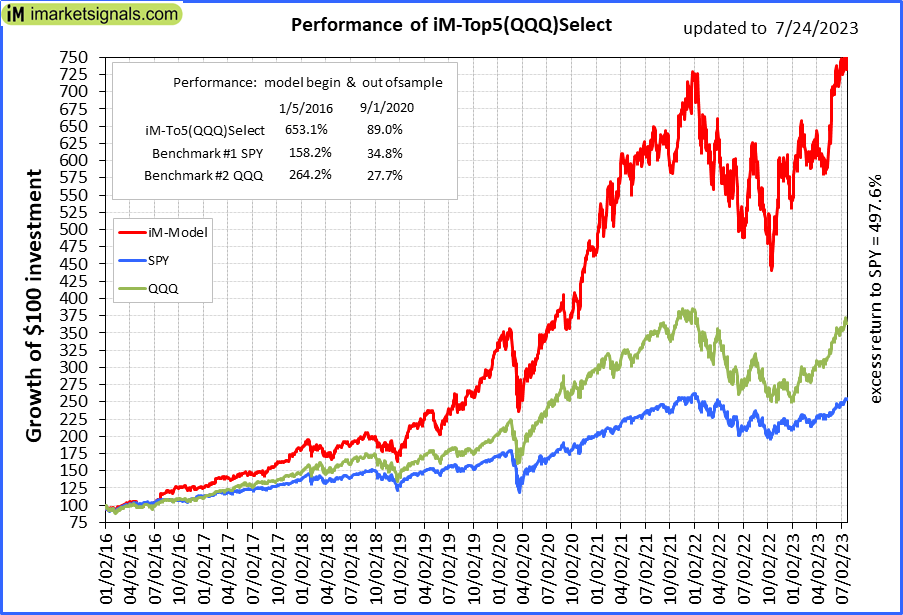 |
iM-Top5(QQQ)Select: Since inception, on 1/5/2016, the model gained 652.18% while the benchmark SPY gained 154.59% over the same period. Over the previous week the market value of iM-Top5(QQQ)Select gained -2.21% at a time when SPY gained 0.75%. A starting capital of $100,000 at inception on 1/5/2016 would have grown to $752,182 which includes $523 cash and excludes $10,610 spent on fees and slippage. |
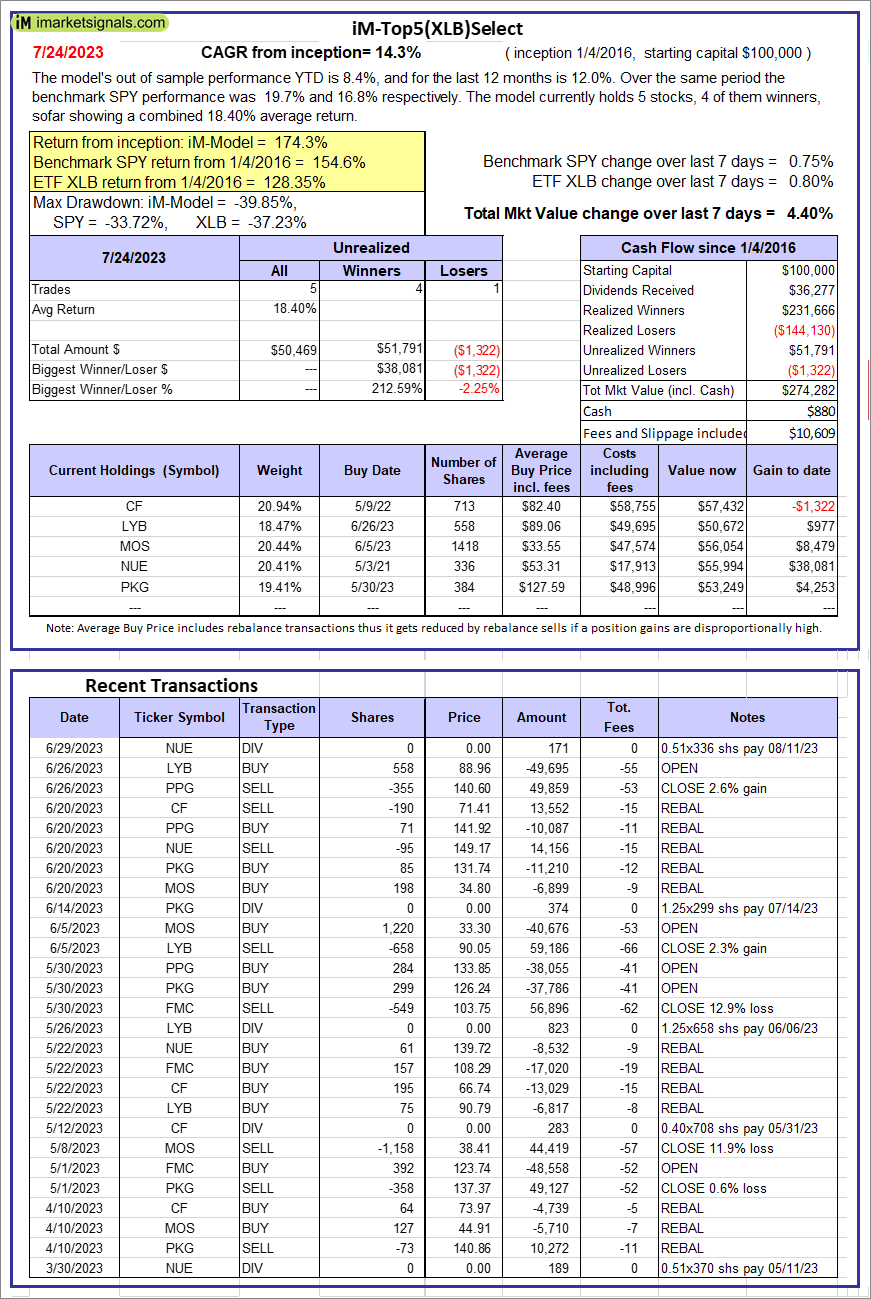 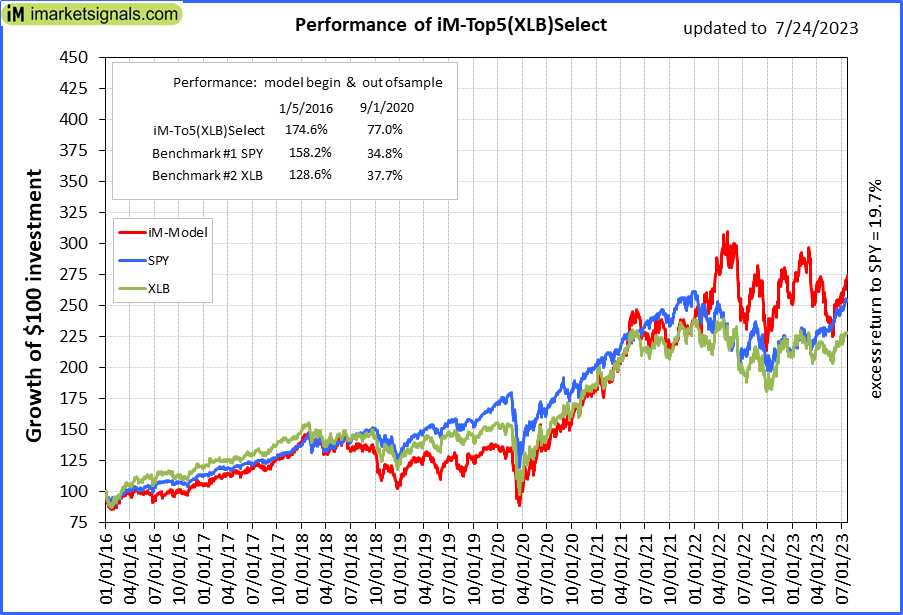 |
iM-Top5(XLB)Select: Since inception, on 1/5/2016, the model gained 174.28% while the benchmark SPY gained 154.59% over the same period. Over the previous week the market value of iM-Top5(XLB)Select gained 4.40% at a time when SPY gained 0.75%. A starting capital of $100,000 at inception on 1/5/2016 would have grown to $274,282 which includes $880 cash and excludes $10,609 spent on fees and slippage. |
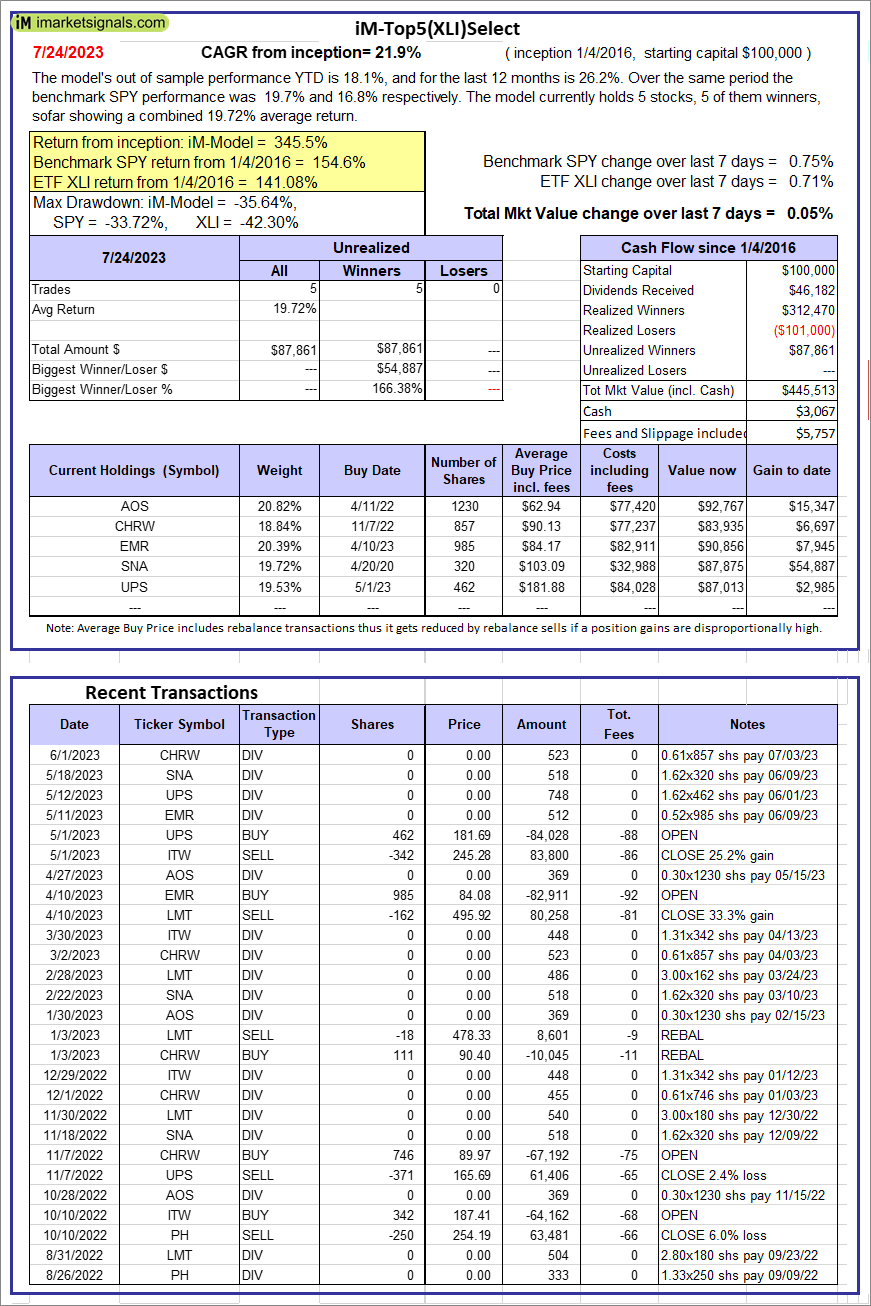 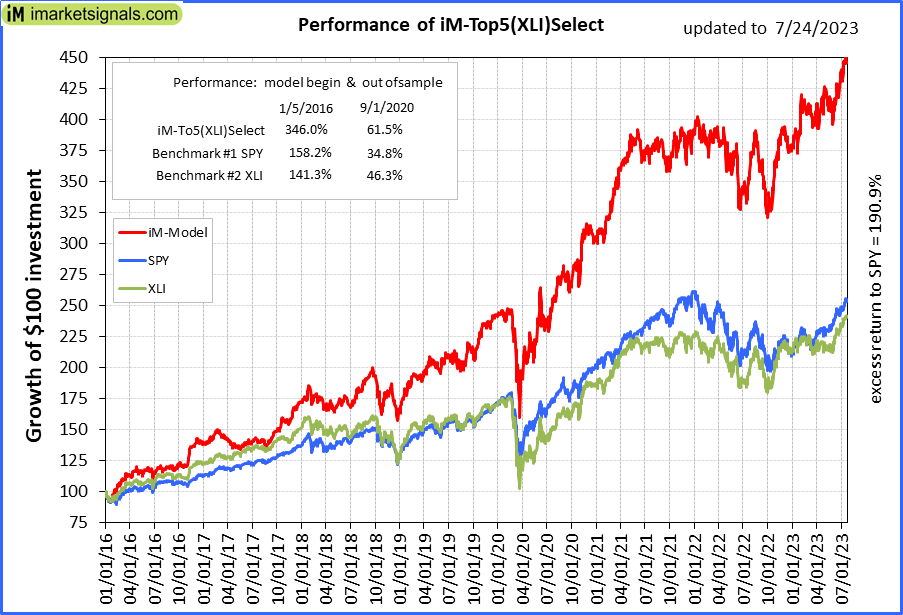 |
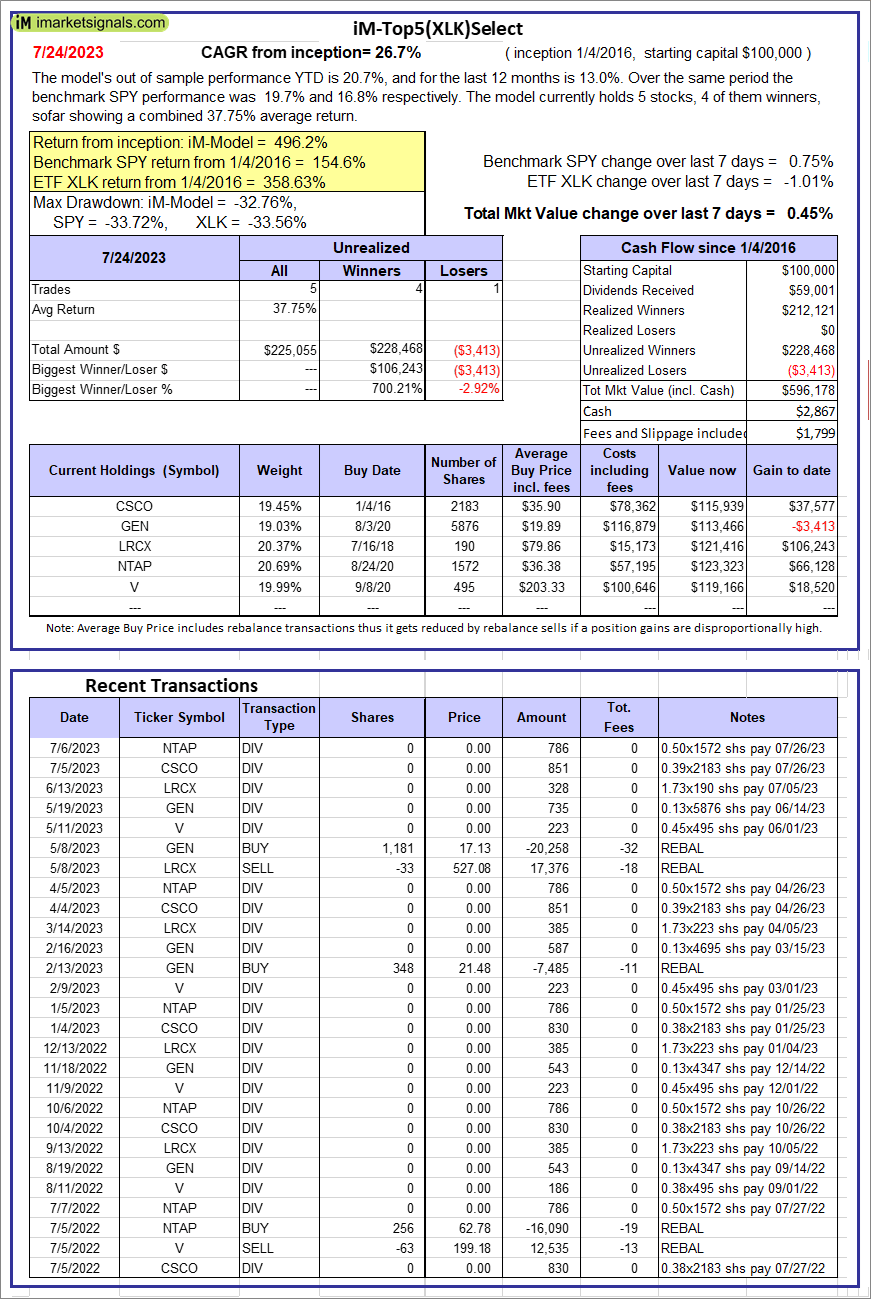
iM-Top5(XLI)Select: Since inception, on 1/5/2016, the model gained 345.51% while the benchmark SPY gained 154.59% over the same period. Over the previous week the market value of iM-Top5(XLI)Select gained 0.05% at a time when SPY gained 0.75%. A starting capital of $100,000 at inception on 1/5/2016 would have grown to $445,513 which includes $3,067 cash and excludes $5,757 spent on fees and slippage. |
 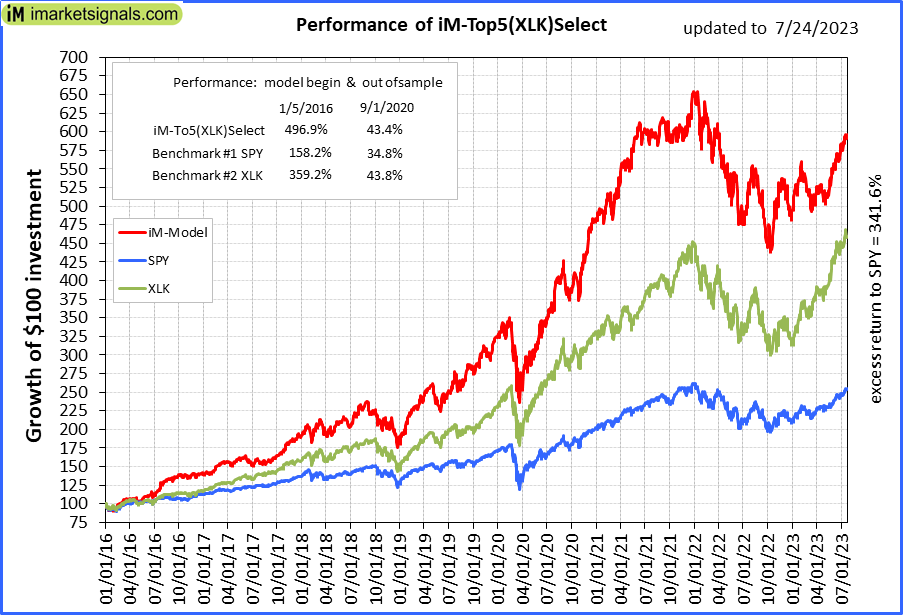 |
iM-Top5(XLK)Select: Since inception, on 1/5/2016, the model gained 496.18% while the benchmark SPY gained 154.59% over the same period. Over the previous week the market value of iM-Top5(XLK)Select gained 0.45% at a time when SPY gained 0.75%. A starting capital of $100,000 at inception on 1/5/2016 would have grown to $596,178 which includes $2,867 cash and excludes $1,799 spent on fees and slippage. |
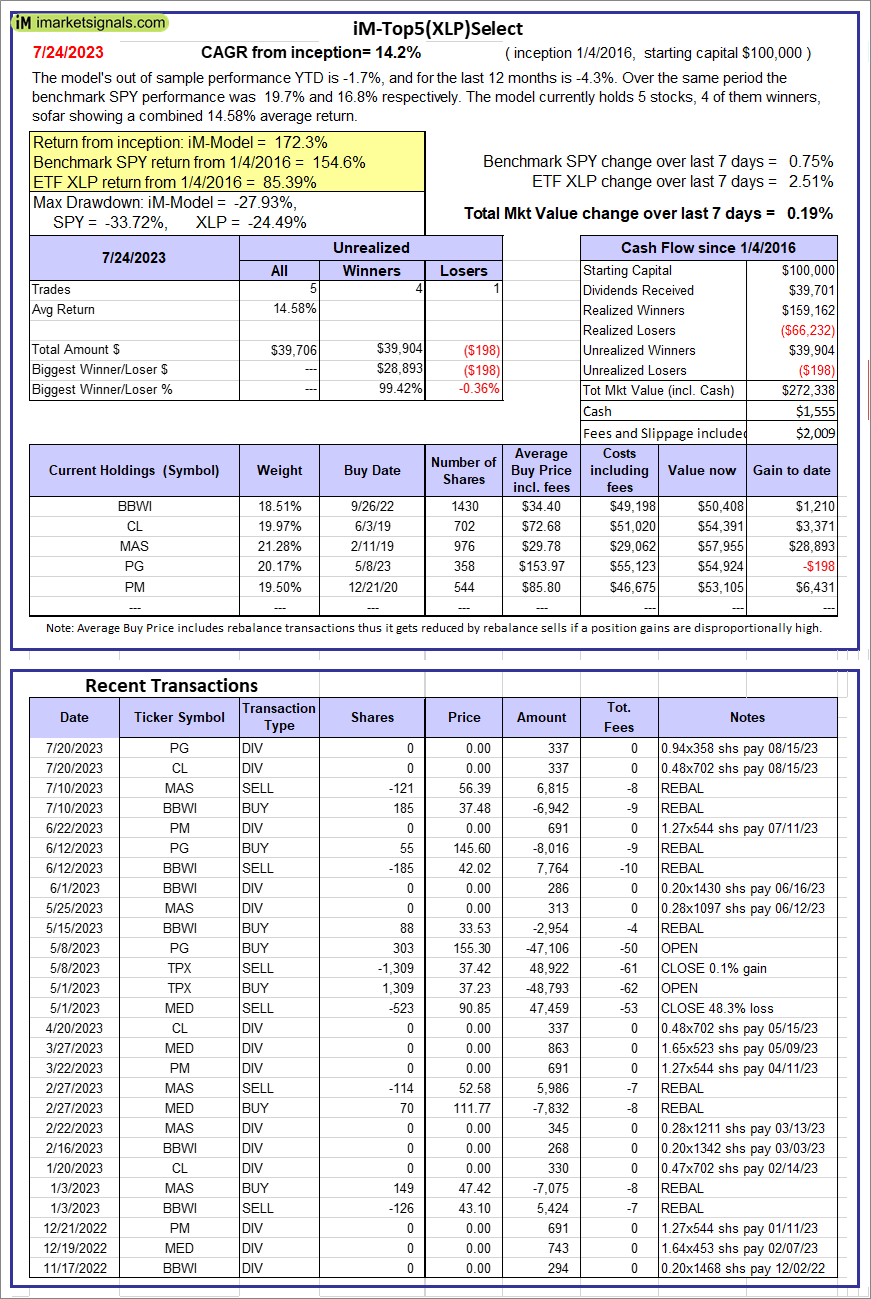 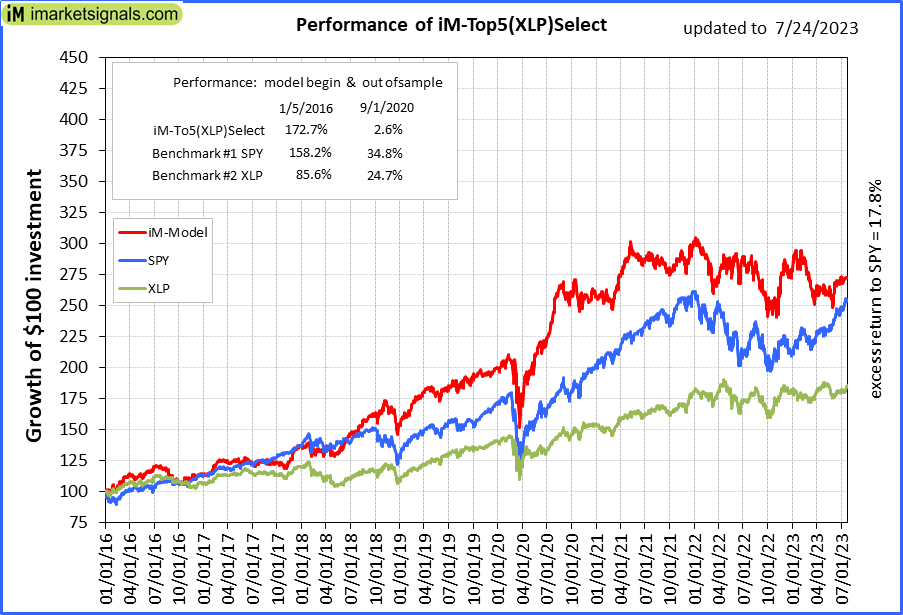 |
iM-Top5(XLP)Select: Since inception, on 1/5/2016, the model gained 172.34% while the benchmark SPY gained 154.59% over the same period. Over the previous week the market value of iM-Top5(XLP)Select gained 0.19% at a time when SPY gained 0.75%. A starting capital of $100,000 at inception on 1/5/2016 would have grown to $272,338 which includes $1,555 cash and excludes $2,009 spent on fees and slippage. |
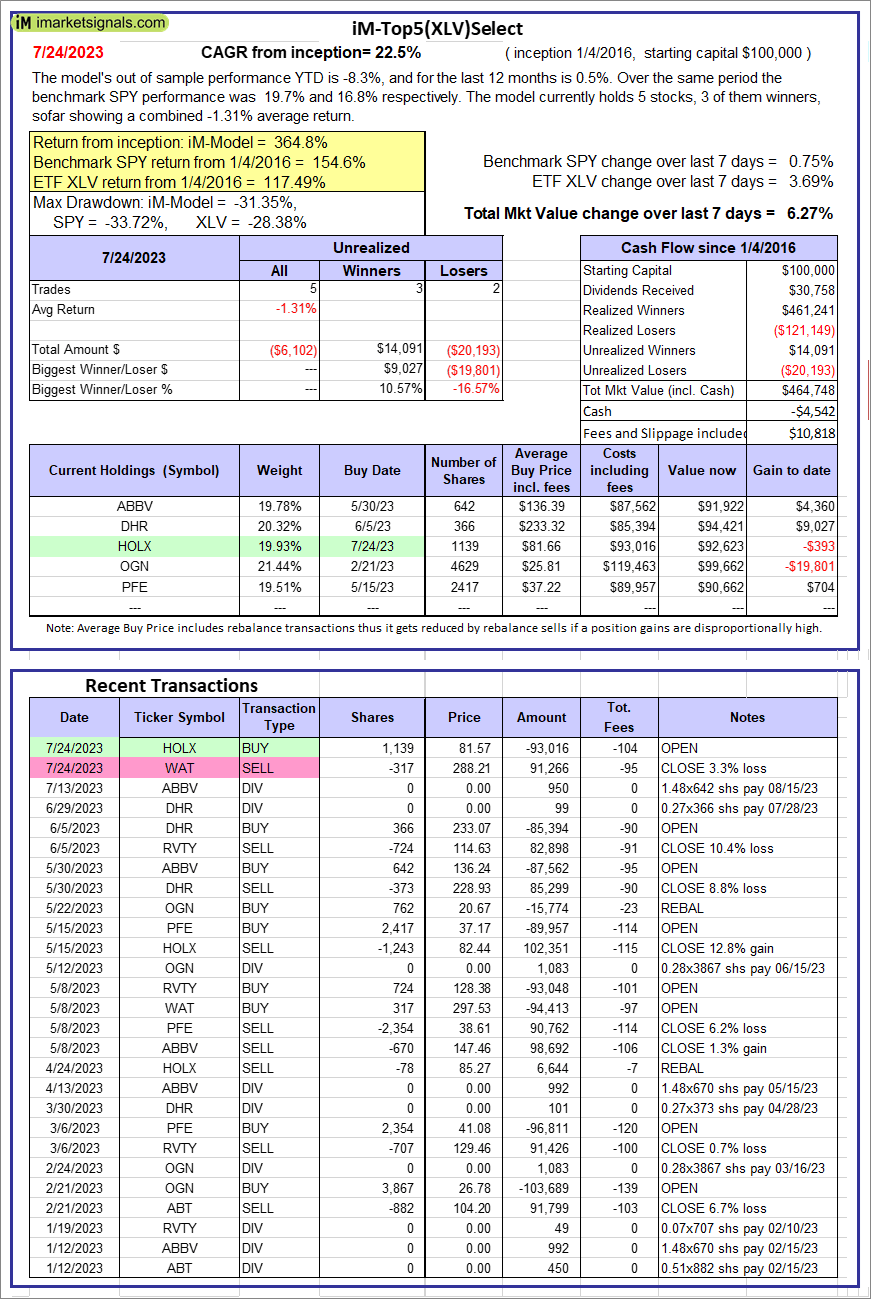 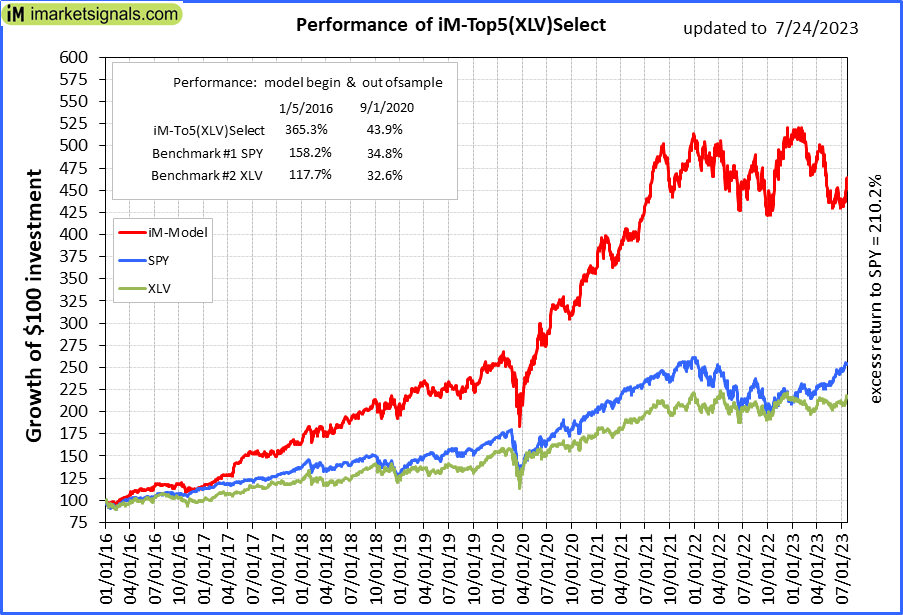 |
iM-Top5(XLV)Select: Since inception, on 1/5/2016, the model gained 364.75% while the benchmark SPY gained 154.59% over the same period. Over the previous week the market value of iM-Top5(XLV)Select gained 6.27% at a time when SPY gained 0.75%. A starting capital of $100,000 at inception on 1/5/2016 would have grown to $464,748 which includes -$4,542 cash and excludes $10,818 spent on fees and slippage. |
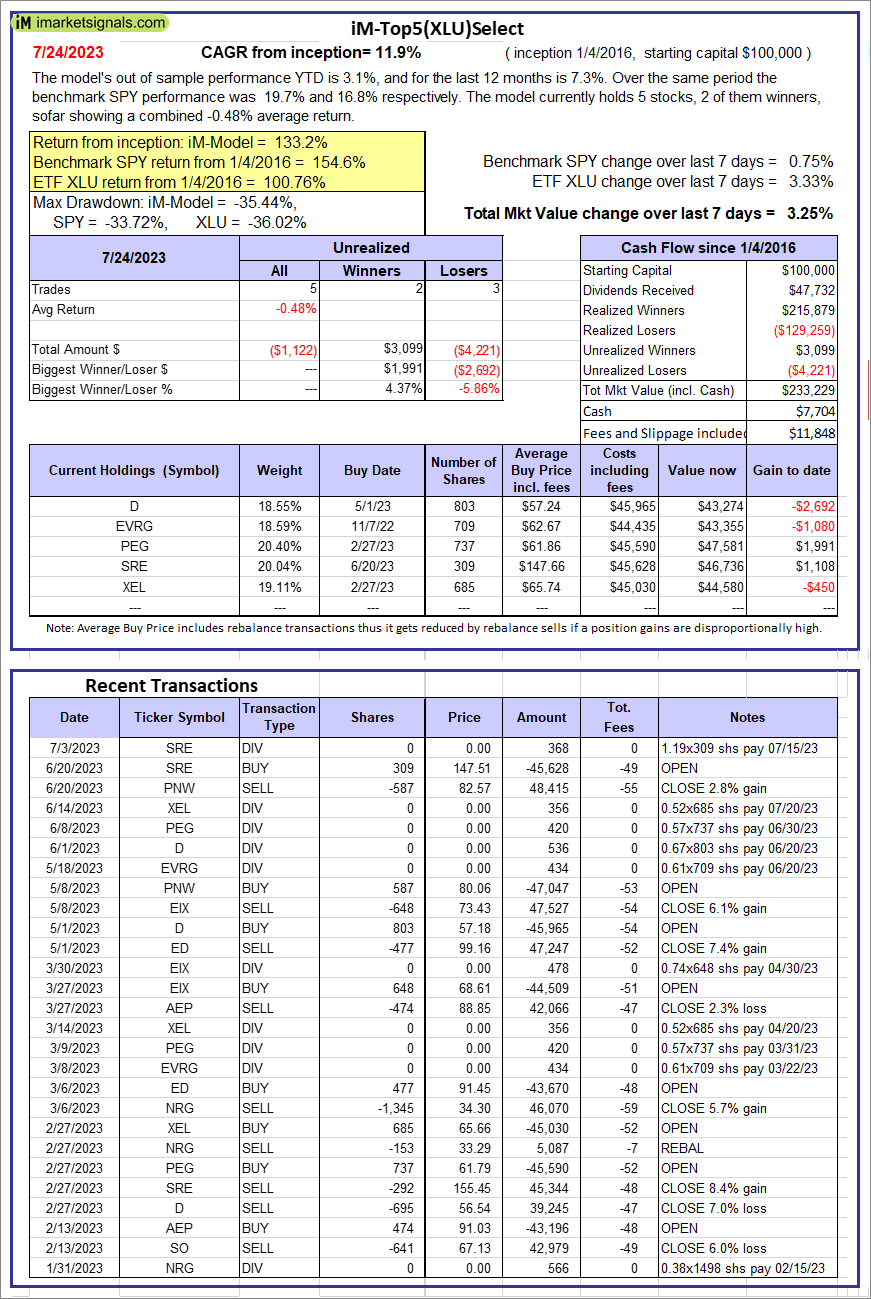 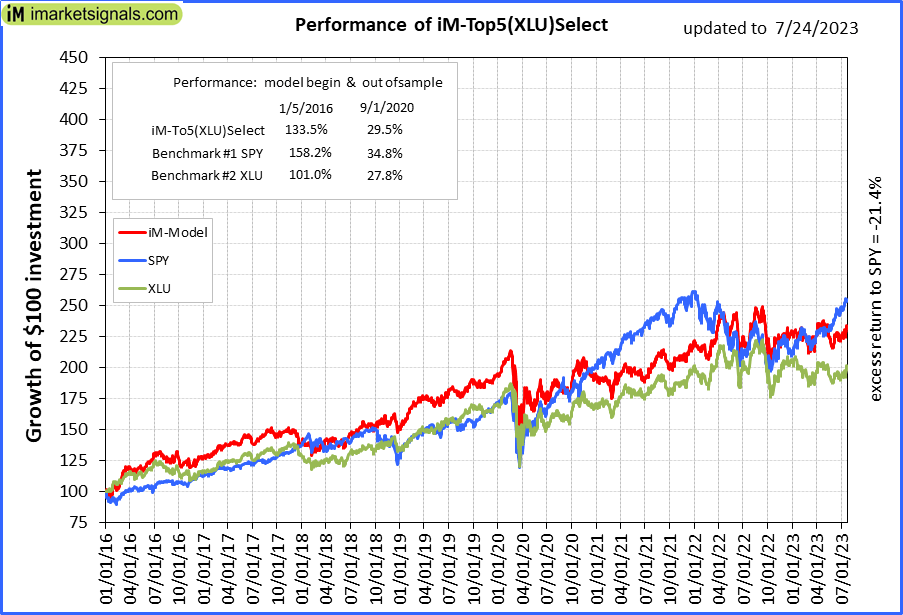 |
iM-Top5(XLU)Select: Since inception, on 1/5/2016, the model gained 133.23% while the benchmark SPY gained 154.59% over the same period. Over the previous week the market value of iM-Top5(XLU)Select gained 3.25% at a time when SPY gained 0.75%. A starting capital of $100,000 at inception on 1/5/2016 would have grown to $233,229 which includes $7,704 cash and excludes $11,848 spent on fees and slippage. |
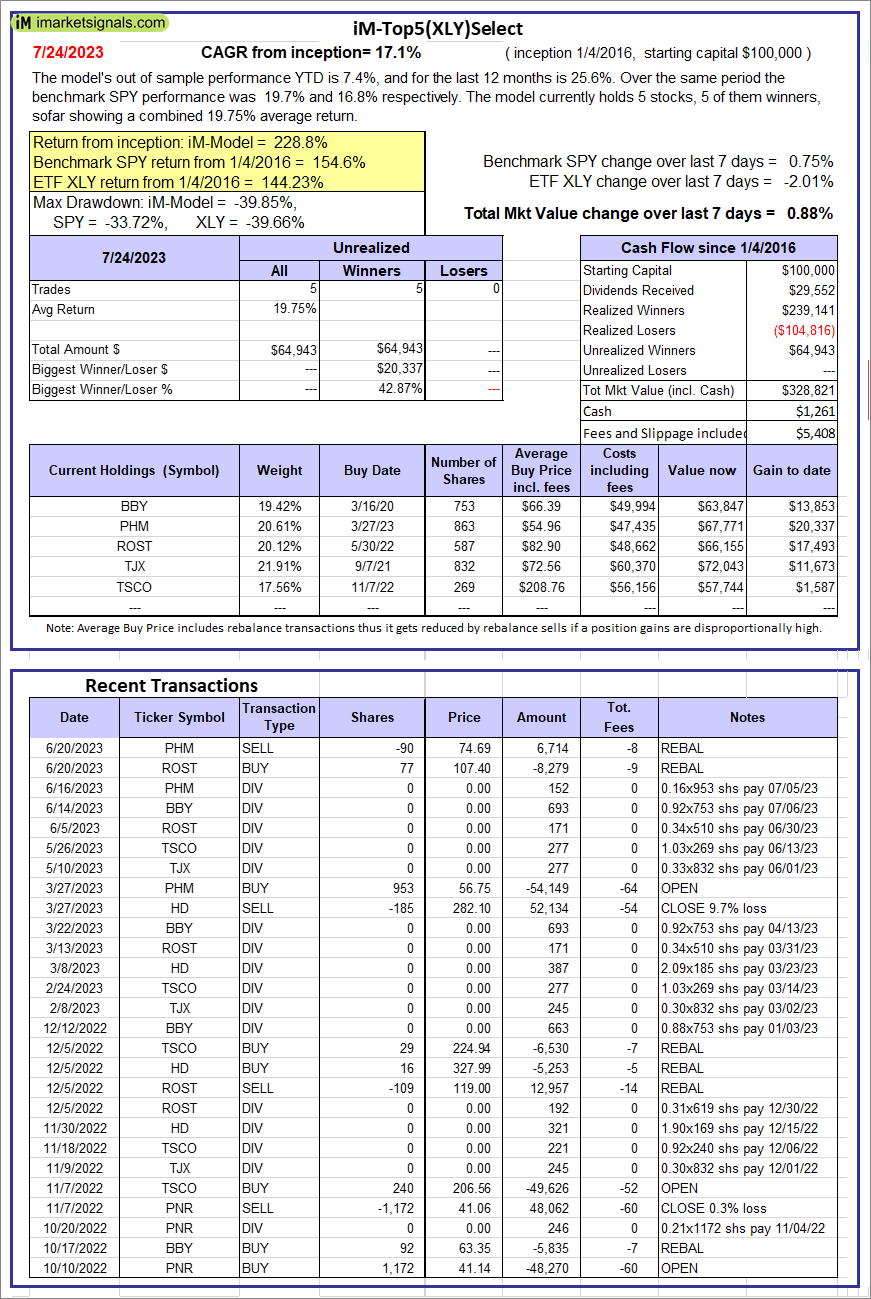 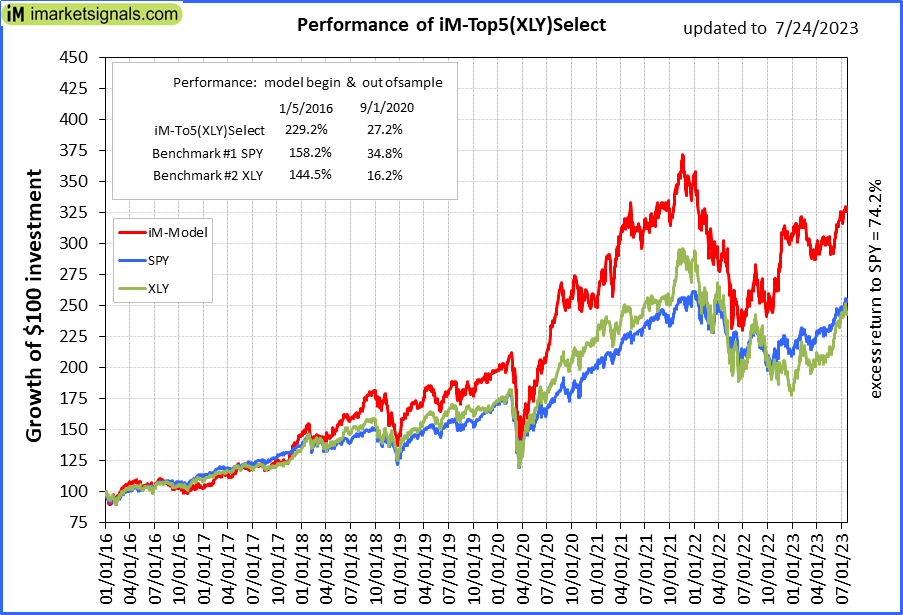 |
iM-Top5(XLY)Select: Since inception, on 1/5/2016, the model gained 228.82% while the benchmark SPY gained 154.59% over the same period. Over the previous week the market value of iM-Top5(XLY)Select gained 0.88% at a time when SPY gained 0.75%. A starting capital of $100,000 at inception on 1/5/2016 would have grown to $328,821 which includes $1,261 cash and excludes $5,408 spent on fees and slippage. |
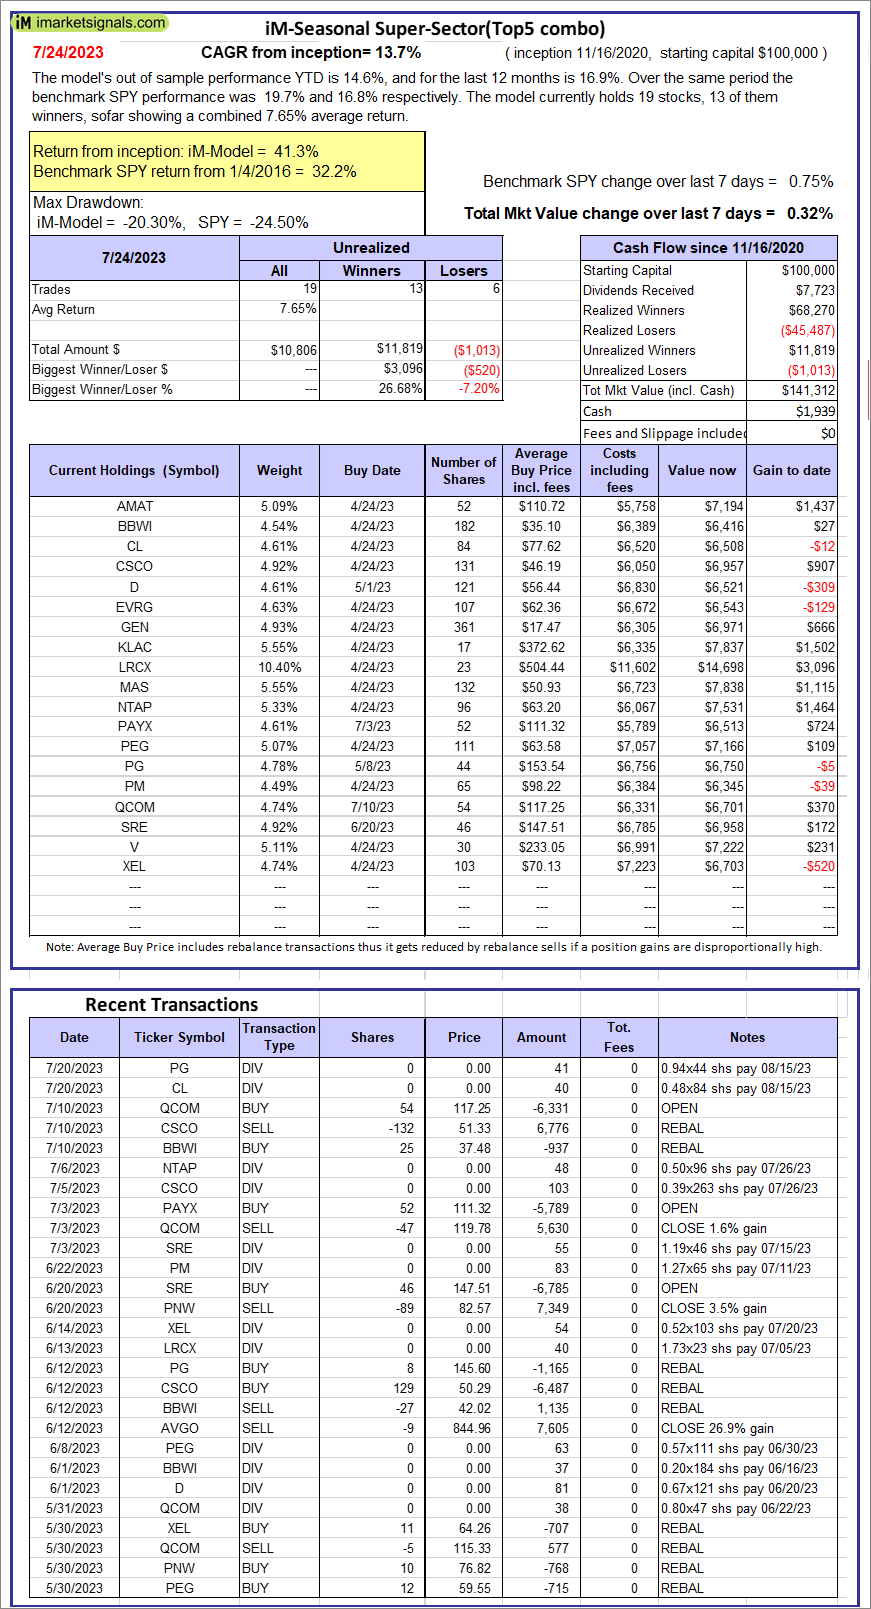 |
iM-Seasonal Super-Sectors (Top5 combo) : Since inception, on 11/17/2020, the model gained 41.31% while the benchmark SPY gained 32.16% over the same period. Over the previous week the market value of iM-Seasonal Super-Sectors (Top5 combo) gained 0.32% at a time when SPY gained 0.75%. A starting capital of $100,000 at inception on 11/17/2020 would have grown to $141,312 which includes $1,939 cash and excludes $00 spent on fees and slippage. |
 |
iM-Dividend Growth Portfolio: The model’s out of sample performance YTD is 14.7%, and for the last 12 months is 15.3%. Over the same period the benchmark SPY performance was 19.7% and 16.8% respectively. Over the previous week the market value of the iM-Dividend Growth Portfolio gained 1.98% at a time when SPY gained 0.75%. A starting capital of $100,000 at inception on 6/30/2016 would have grown to $416,536 which includes $1,897 cash and excludes $10,034 spent on fees and slippage. |
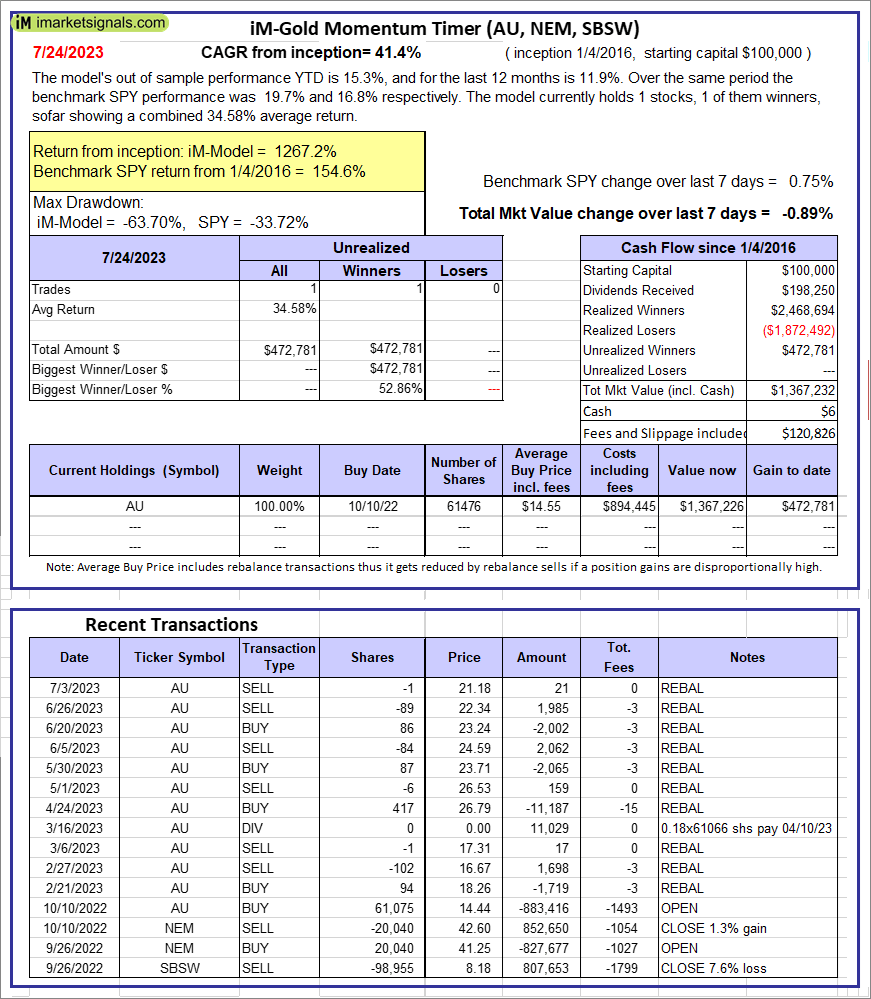 |
iM-Gold Momentum Timer (AU, NEM, SBSW): The model’s out of sample performance YTD is 15.3%, and for the last 12 months is 11.9%. Over the same period the benchmark SPY performance was 19.7% and 16.8% respectively. Over the previous week the market value of iM-Gold Momentum Timer (AU, NEM, SBSW) gained -0.89% at a time when SPY gained 0.75%. A starting capital of $100,000 at inception on 6/30/2016 would have grown to $06 which includes $120,826 cash and excludes Gain to date spent on fees and slippage. |
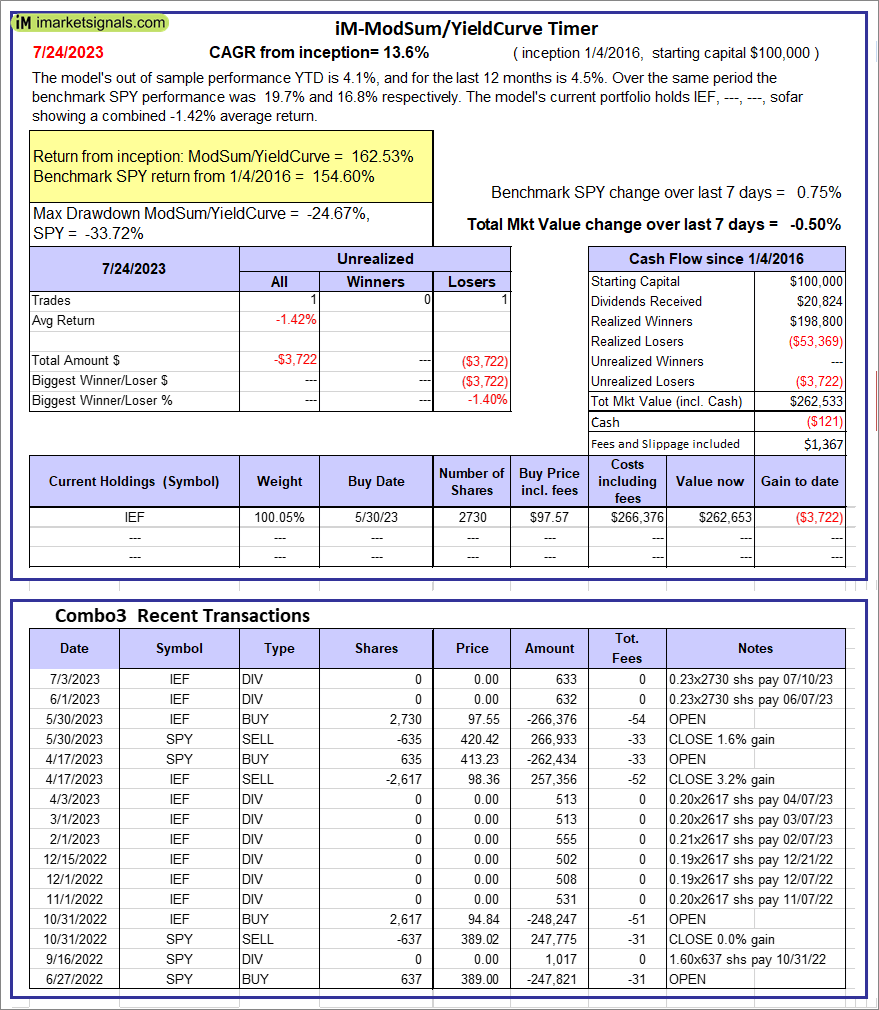 |
iM-ModSum/YieldCurve Timer: The model’s out of sample performance YTD is 4.1%, and for the last 12 months is 4.5%. Over the same period the benchmark SPY performance was 19.7% and 16.8% respectively. Over the previous week the market value of iM-PortSum/YieldCurve Timer gained -0.50% at a time when SPY gained 0.75%. A starting capital of $100,000 at inception on 1/1/2016 would have grown to $262,533 which includes -$121 cash and excludes $1,367 spent on fees and slippage. |
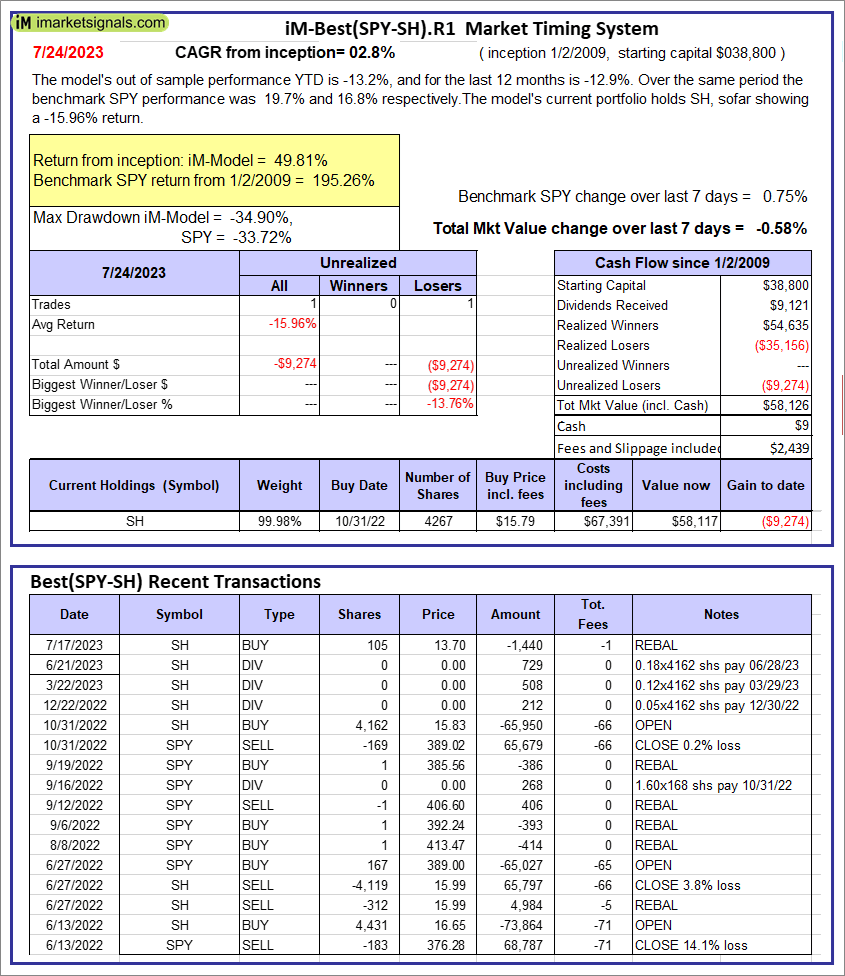 |
iM-Best(SPY-SH).R1: The model’s out of sample performance YTD is -13.2%, and for the last 12 months is -12.9%. Over the same period the benchmark SPY performance was 19.7% and 16.8% respectively. Over the previous week the market value of Best(SPY-SH) gained -0.58% at a time when SPY gained 0.75%. A starting capital of $100,000 at inception on 1/2/2009 would have grown to $58,126 which includes $9 cash and excludes $2,439 spent on fees and slippage. |
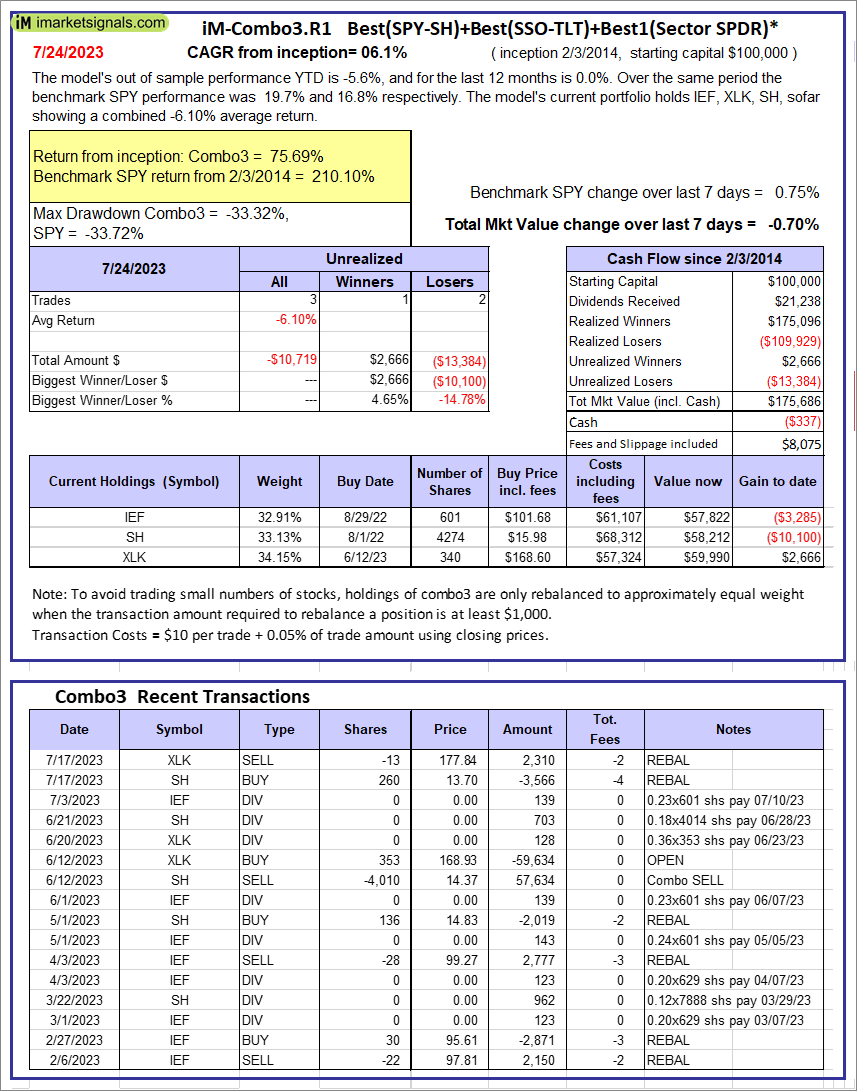 |
iM-Combo3.R1: The model’s out of sample performance YTD is -5.6%, and for the last 12 months is 0.0%. Over the same period the benchmark SPY performance was 19.7% and 16.8% respectively. Over the previous week the market value of iM-Combo3.R1 gained -0.70% at a time when SPY gained 0.75%. A starting capital of $100,000 at inception on 2/3/2014 would have grown to $175,686 which includes -$337 cash and excludes $8,075 spent on fees and slippage. |
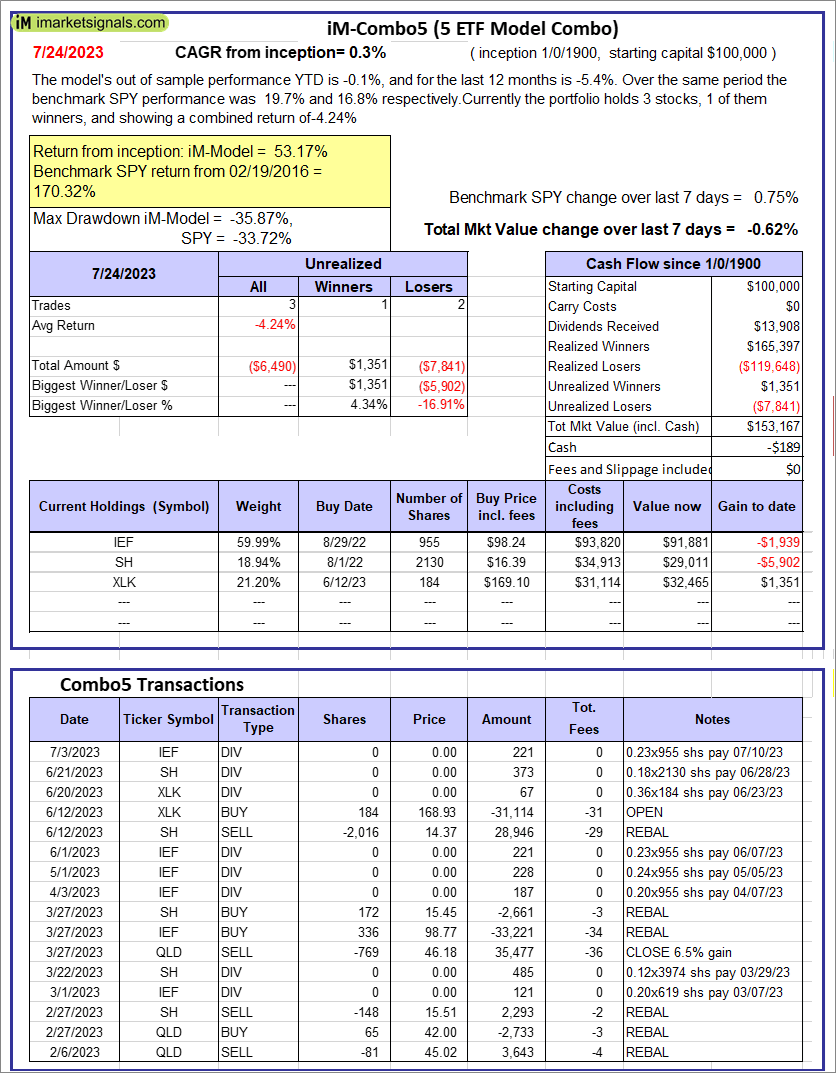 |
iM-Combo5: The model’s out of sample performance YTD is -0.1%, and for the last 12 months is -5.4%. Over the same period the benchmark SPY performance was 19.7% and 16.8% respectively. Over the previous week the market value of iM-Combo5 gained -0.62% at a time when SPY gained 0.75%. A starting capital of $100,000 at inception on 2/22/2016 would have grown to $153,167 which includes -$189 cash and excludes $0 spent on fees and slippage. |
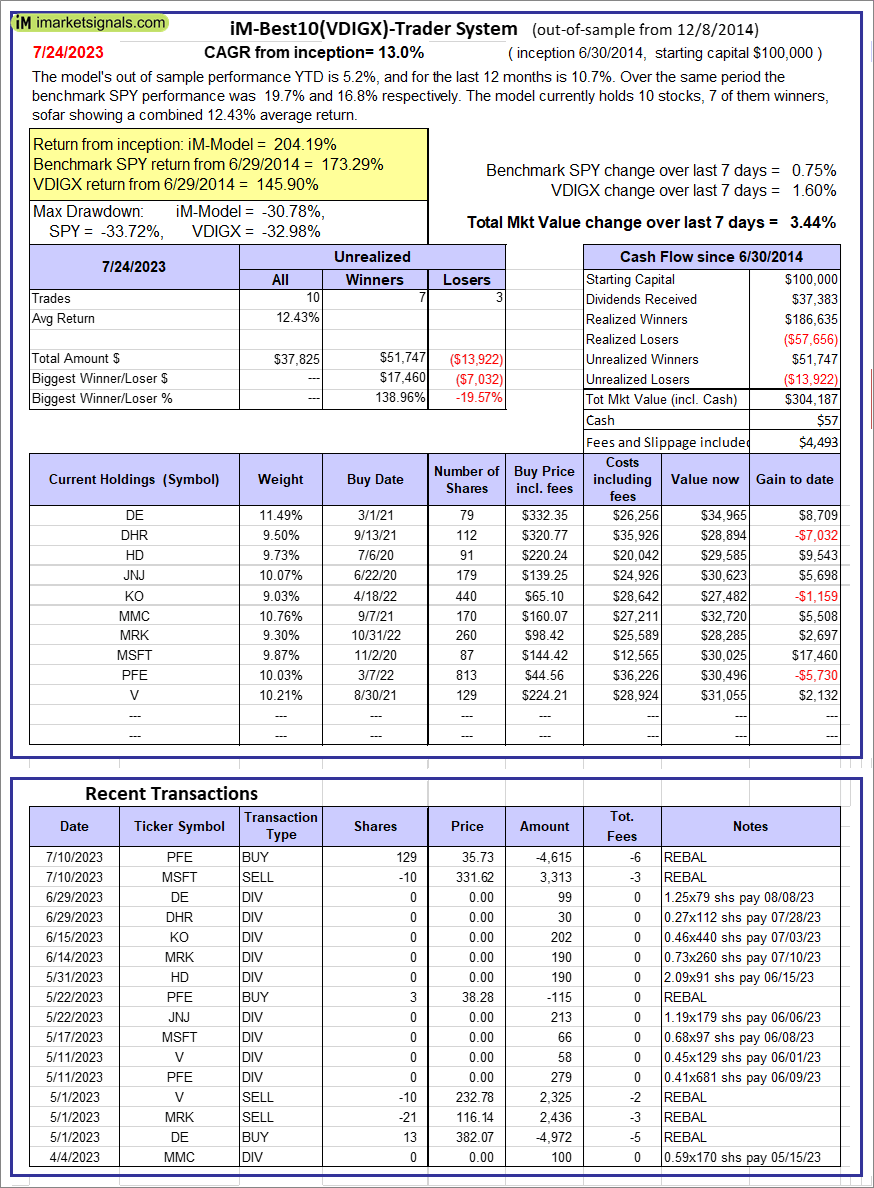 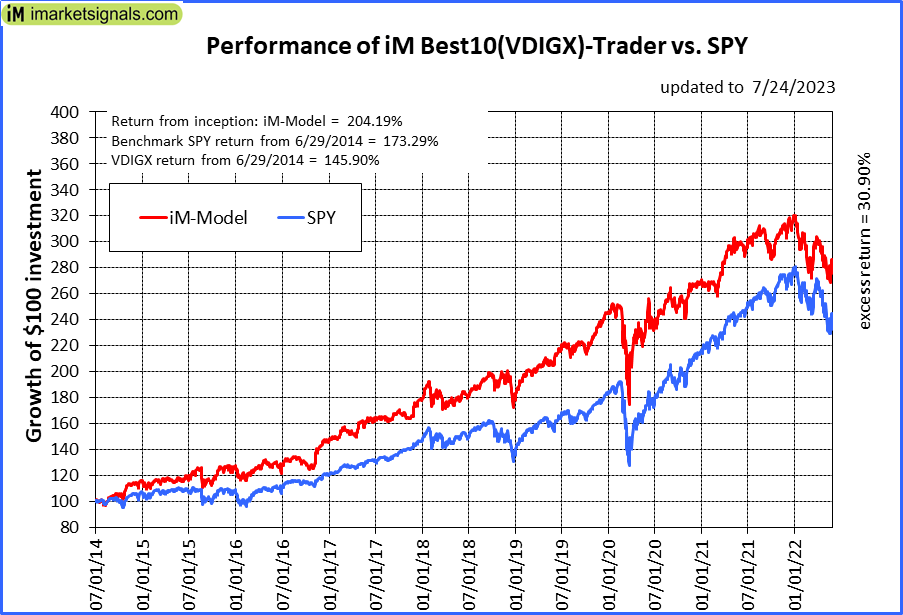 |
iM-Best10(VDIGX)-Trader: The model’s out of sample performance YTD is 5.2%, and for the last 12 months is 10.7%. Over the same period the benchmark SPY performance was 19.7% and 16.8% respectively. Since inception, on 7/1/2014, the model gained 204.19% while the benchmark SPY gained 173.29% and VDIGX gained 145.90% over the same period. Over the previous week the market value of iM-Best10(VDIGX) gained 3.44% at a time when SPY gained 0.75%. A starting capital of $100,000 at inception on 7/1/2014 would have grown to $304,187 which includes $57 cash and excludes $4,493 spent on fees and slippage. |
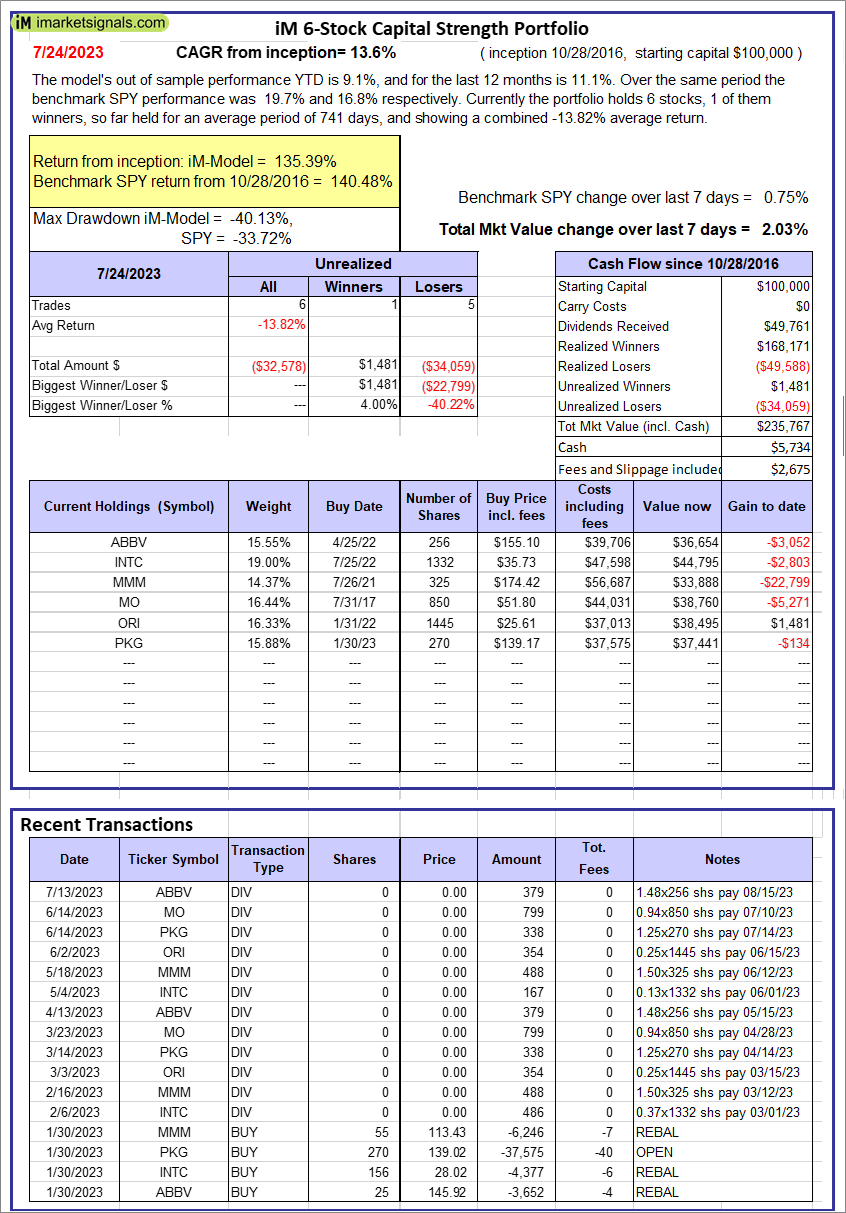 |
iM 6-Stock Capital Strength Portfolio: The model’s out of sample performance YTD is 9.1%, and for the last 12 months is 11.1%. Over the same period the benchmark SPY performance was 19.7% and 16.8% respectively. Over the previous week the market value of the iM 6-Stock Capital Strength Portfolio gained 2.03% at a time when SPY gained 0.75%. A starting capital of $100,000 at inception on 10/28/2016 would have grown to $235,767 which includes $5,734 cash and excludes $2,675 spent on fees and slippage. |
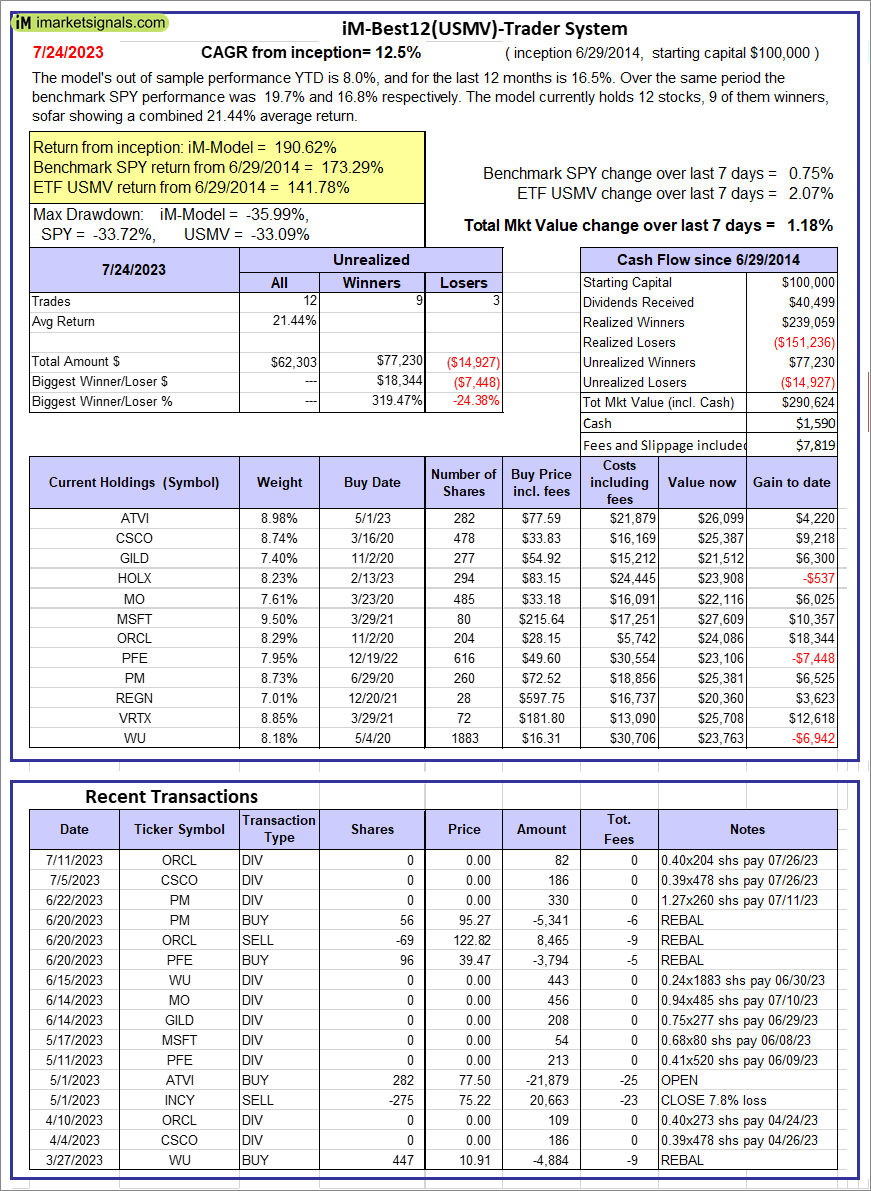 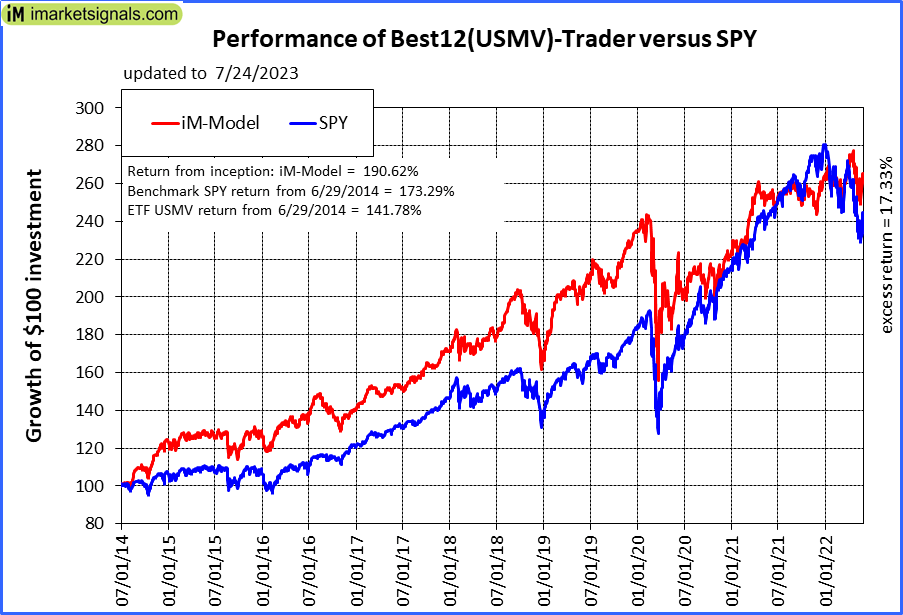 |
iM-Best12(USMV)-Trader: The model’s out of sample performance YTD is 8.0%, and for the last 12 months is 16.5%. Over the same period the benchmark SPY performance was 19.7% and 16.8% respectively. Since inception, on 6/30/2014, the model gained 190.62% while the benchmark SPY gained 173.29% and the ETF USMV gained 141.78% over the same period. Over the previous week the market value of iM-Best12(USMV)-Trader gained 1.18% at a time when SPY gained 0.75%. A starting capital of $100,000 at inception on 6/30/2014 would have grown to $290,624 which includes $1,590 cash and excludes $7,819 spent on fees and slippage. |
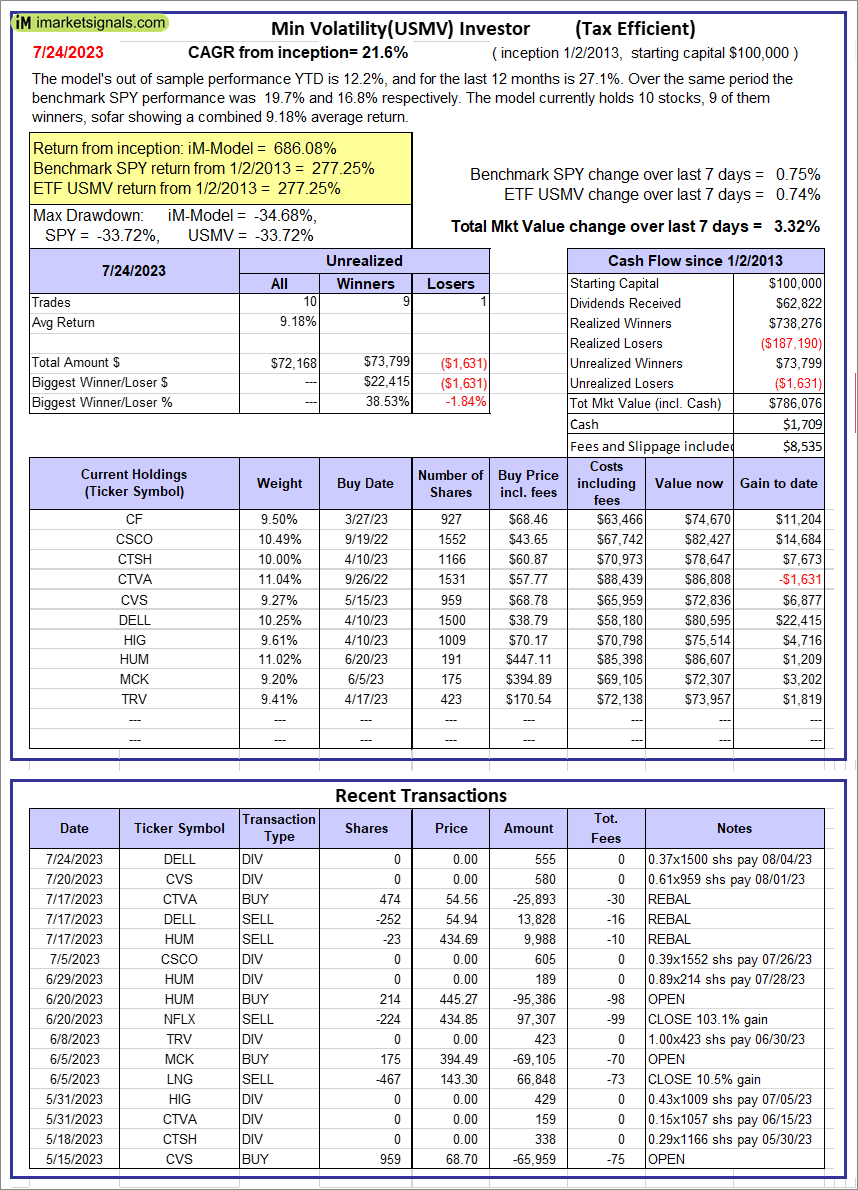 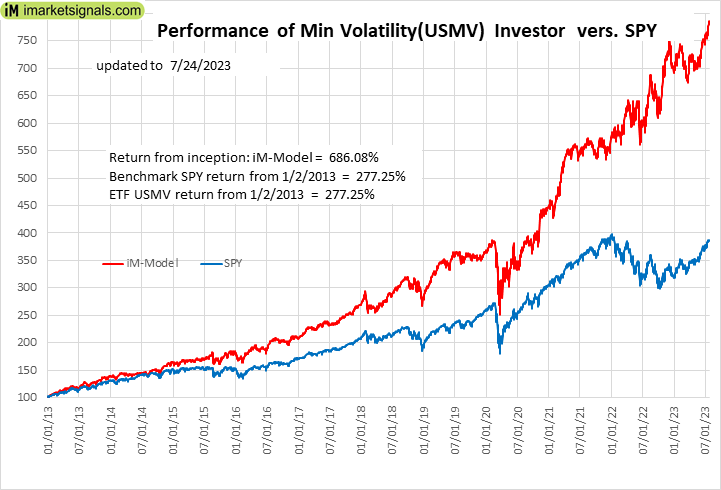 |
iM-Min Volatility(USMV) Investor (Tax Efficient): The model’s out of sample performance YTD is 12.2%, and for the last 12 months is 27.1%. Over the same period the benchmark SPY performance was 19.7% and 16.8% respectively. Since inception, on 1/3/2013, the model gained 686.08% while the benchmark SPY gained 277.25% and the ETF USMV gained 277.25% over the same period. Over the previous week the market value of iM-Best12(USMV)Q1 gained 3.32% at a time when SPY gained 0.75%. A starting capital of $100,000 at inception on 1/3/2013 would have grown to $786,076 which includes $1,709 cash and excludes $8,535 spent on fees and slippage. |
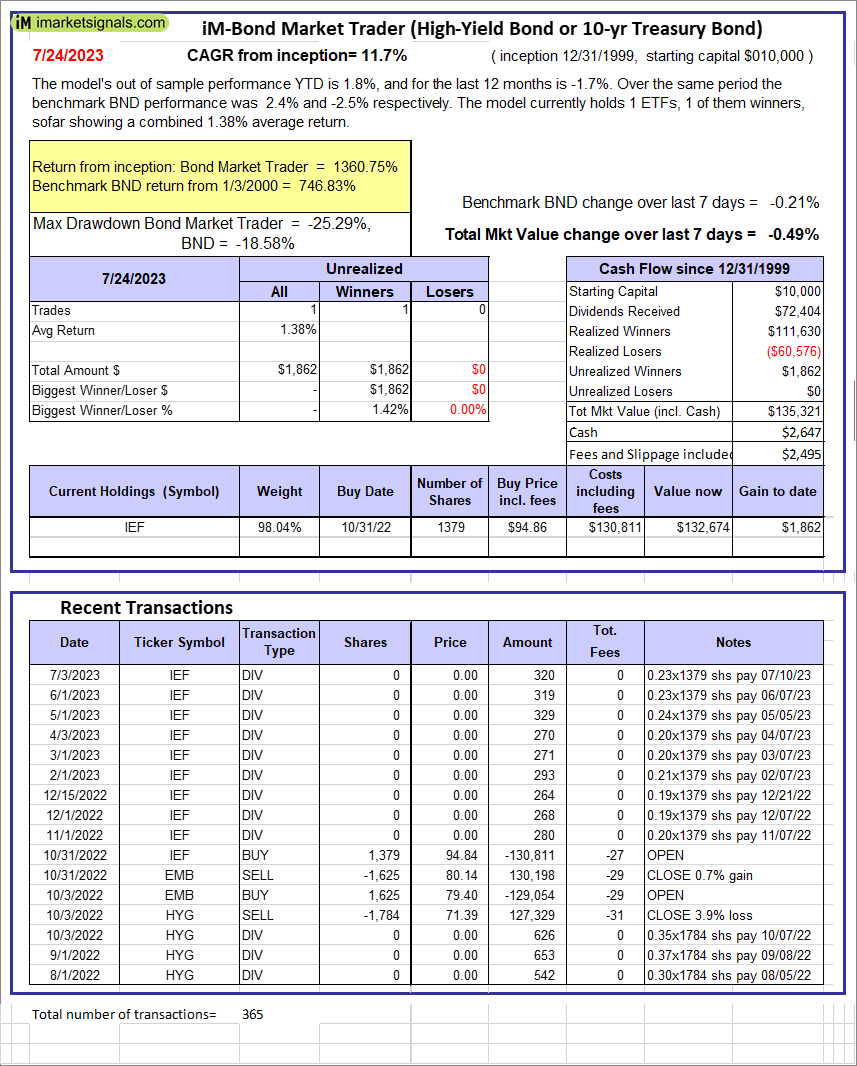 |
iM-Bond Market Trader (High-Yield Bond or 10-yr Treasury Bond): The model’s out of sample performance YTD is 1.8%, and for the last 12 months is -1.7%. Over the same period the benchmark BND performance was 2.4% and -2.5% respectively. Over the previous week the market value of the iM-Bond Market Trader (High-Yield Bond or 10-yr Treasury Bond) gained -0.49% at a time when BND gained -0.21%. A starting capital of $10,000 at inception on 1/3/2000 would have grown to $135,321 which includes $2,647 cash and excludes $2,495 spent on fees and slippage. |
|
|
iM-ModSum/YieldCurve Timer: The model’s out of sample performance YTD is 4.1%, and for the last 12 months is 4.5%. Over the same period the benchmark SPY performance was 19.7% and 16.8% respectively. Over the previous week the market value of iM-PortSum/YieldCurve Timer gained -0.50% at a time when SPY gained 0.75%. A starting capital of $100,000 at inception on 1/1/2016 would have grown to $262,533 which includes -$121 cash and excludes $1,367 spent on fees and slippage. |
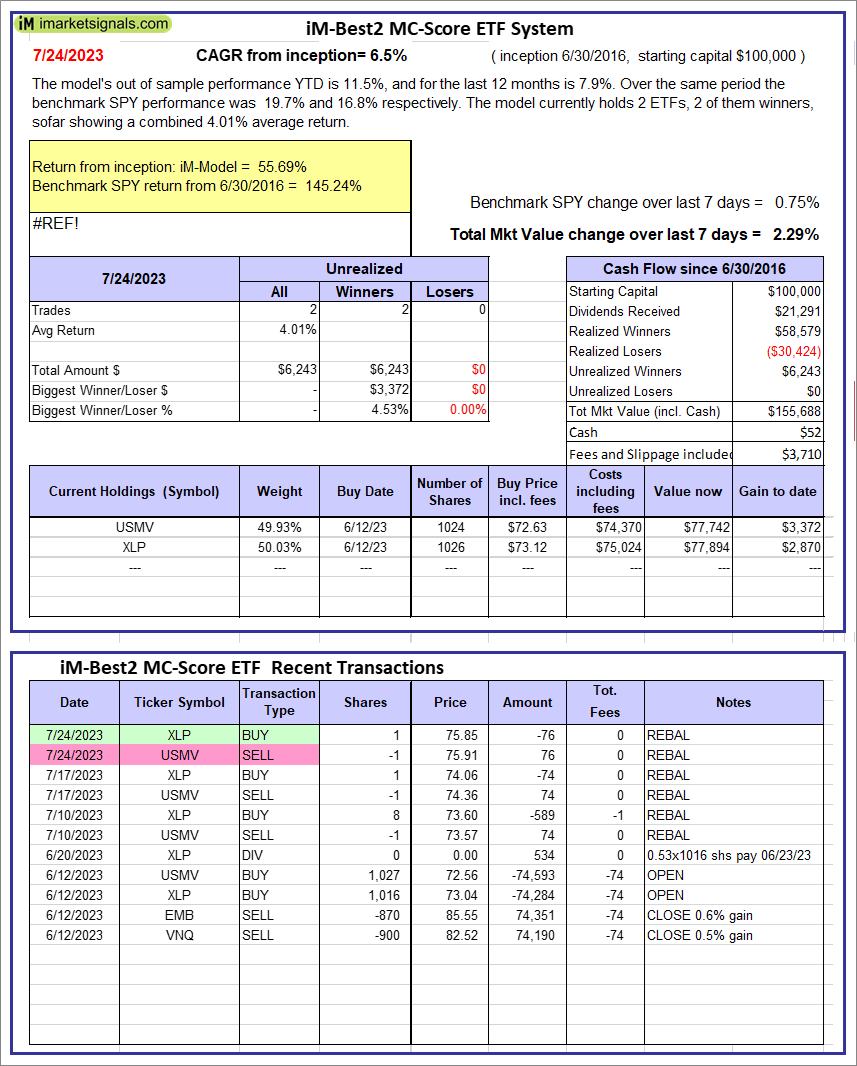 |
iM-Best2 MC-Score ETF System: The model’s out of sample performance YTD is 11.5%, and for the last 12 months is 7.9%. Over the same period the benchmark SPY performance was 19.7% and 16.8% respectively. Over the previous week the market value of the iM-Best2 MC-Score ETF System gained 2.29% at a time when SPY gained 0.75%. A starting capital of $100,000 at inception on 6/30/2016 would have grown to $155,688 which includes $52 cash and excludes $3,710 spent on fees and slippage. |
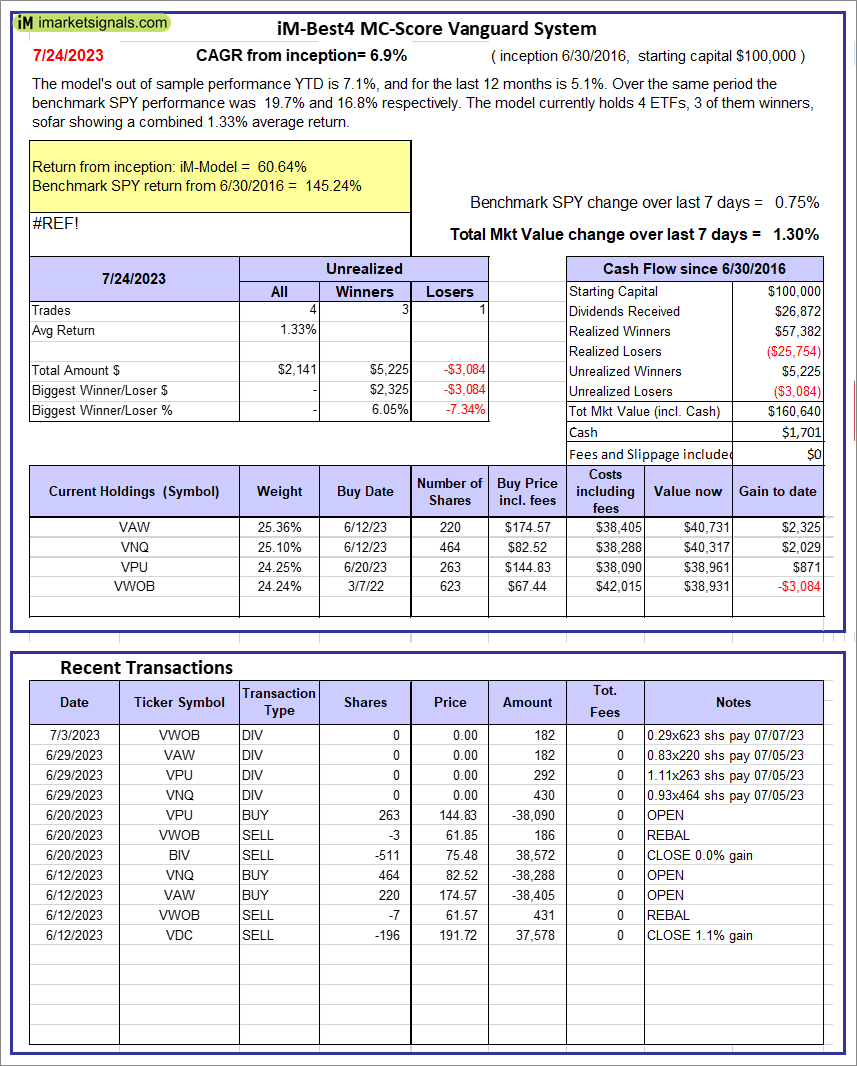 |
iM-Best4 MC-Score Vanguard System: The model’s out of sample performance YTD is 7.1%, and for the last 12 months is 5.1%. Over the same period the benchmark SPY performance was 19.7% and 16.8% respectively. Over the previous week the market value of the iM-Best4 MC-Score Vanguard System gained 1.30% at a time when SPY gained 0.75%. A starting capital of $100,000 at inception on 6/30/2016 would have grown to $160,640 which includes $1,701 cash and excludes $00 spent on fees and slippage. |
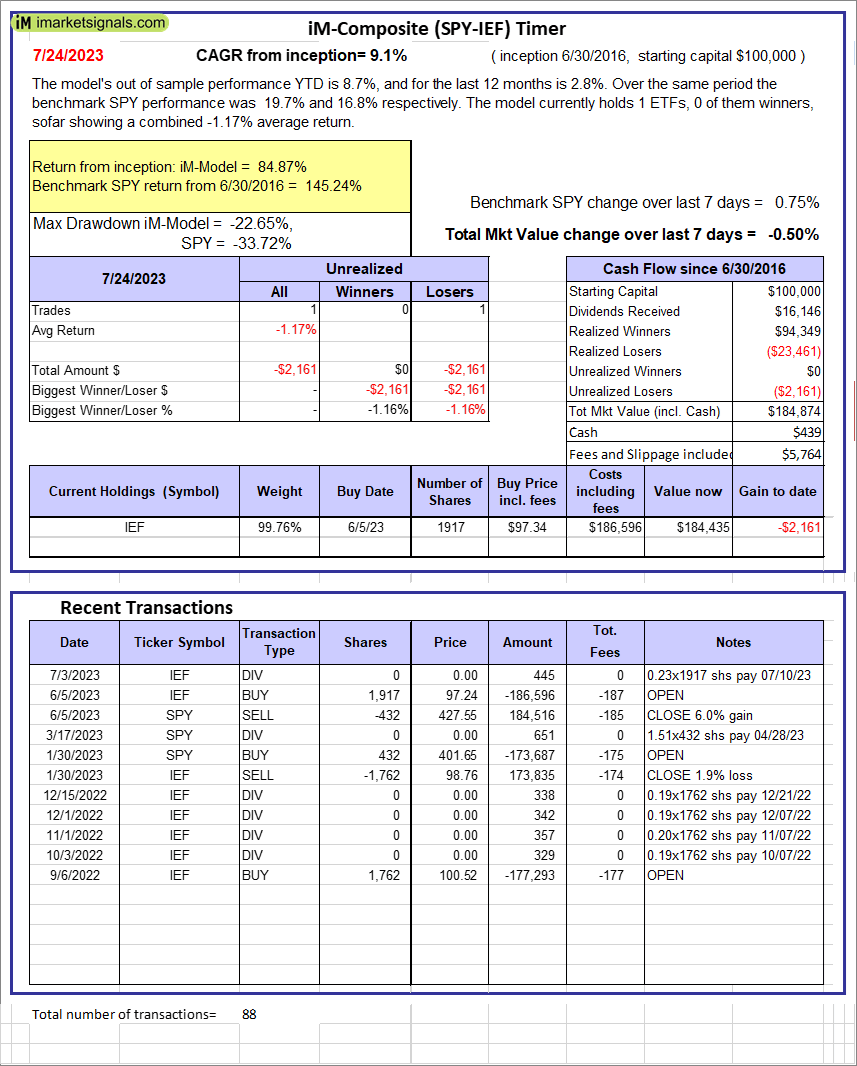 |
iM-Composite (SPY-IEF) Timer: The model’s out of sample performance YTD is 8.7%, and for the last 12 months is 2.8%. Over the same period the benchmark SPY performance was 19.7% and 16.8% respectively. Over the previous week the market value of the iM-Composite (SPY-IEF) Timer gained -0.50% at a time when SPY gained 0.75%. A starting capital of $100,000 at inception on 6/30/2016 would have grown to $184,874 which includes $439 cash and excludes $5,764 spent on fees and slippage. |
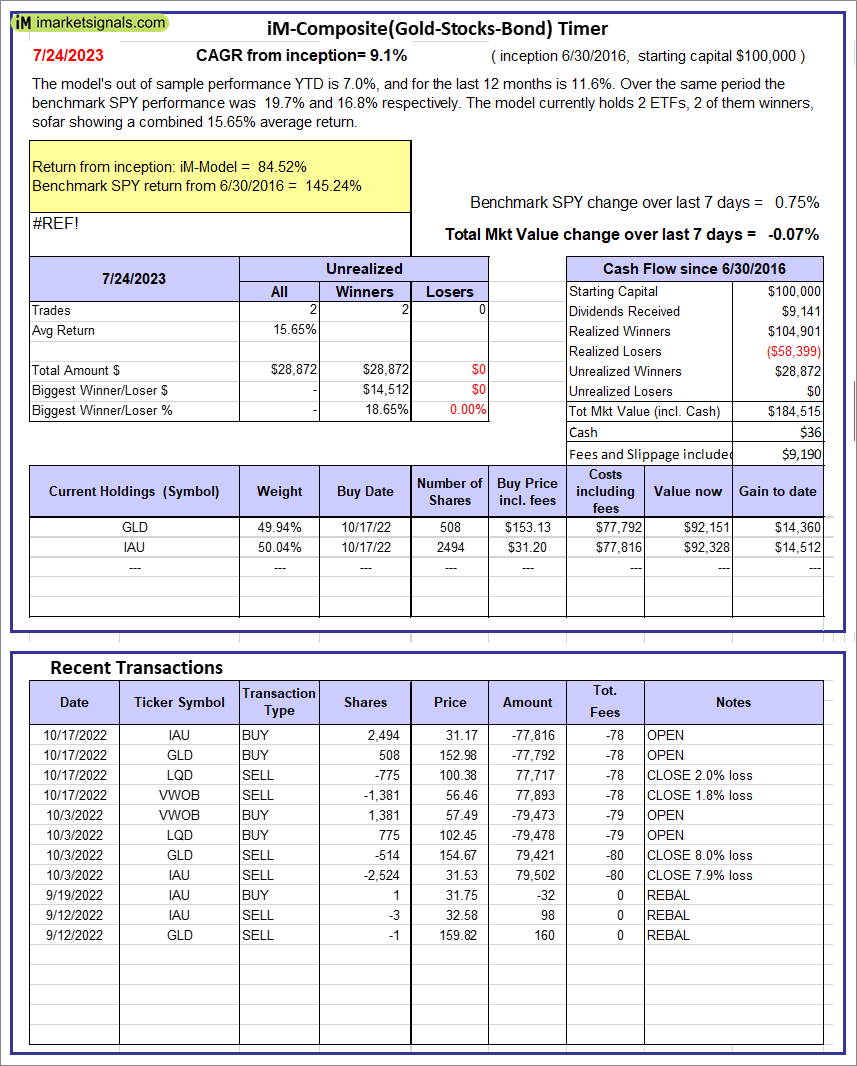 |
iM-Composite(Gold-Stocks-Bond) Timer: The model’s out of sample performance YTD is 7.0%, and for the last 12 months is 11.6%. Over the same period the benchmark SPY performance was 19.7% and 16.8% respectively. Over the previous week the market value of the iM-Composite(Gold-Stocks-Bond) Timer gained -0.07% at a time when SPY gained 0.75%. A starting capital of $100,000 at inception on 6/30/2016 would have grown to $184,515 which includes $36 cash and excludes $9,190 spent on fees and slippage. |
iM-Best Reports – 7/24/2023
Posted in pmp SPY-SH
Leave a Reply
You must be logged in to post a comment.