
  |
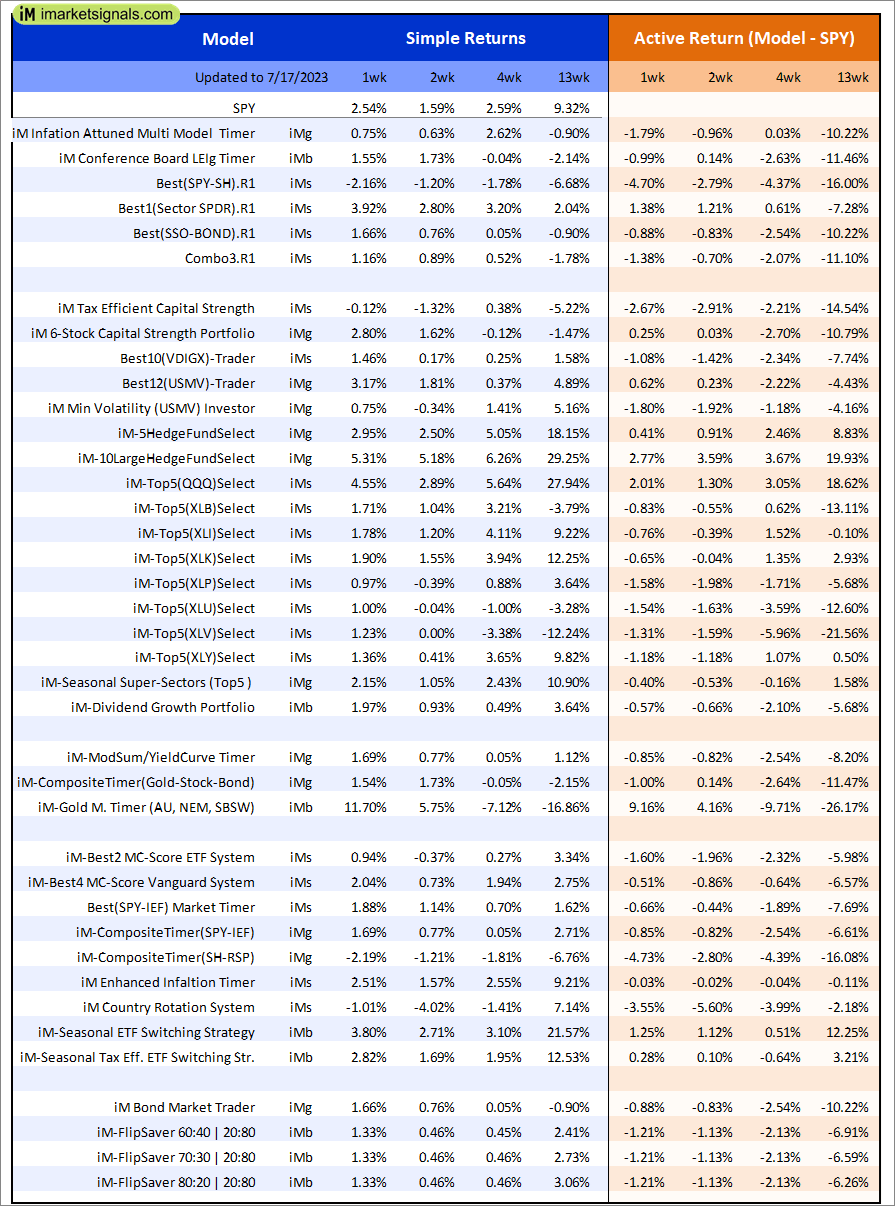
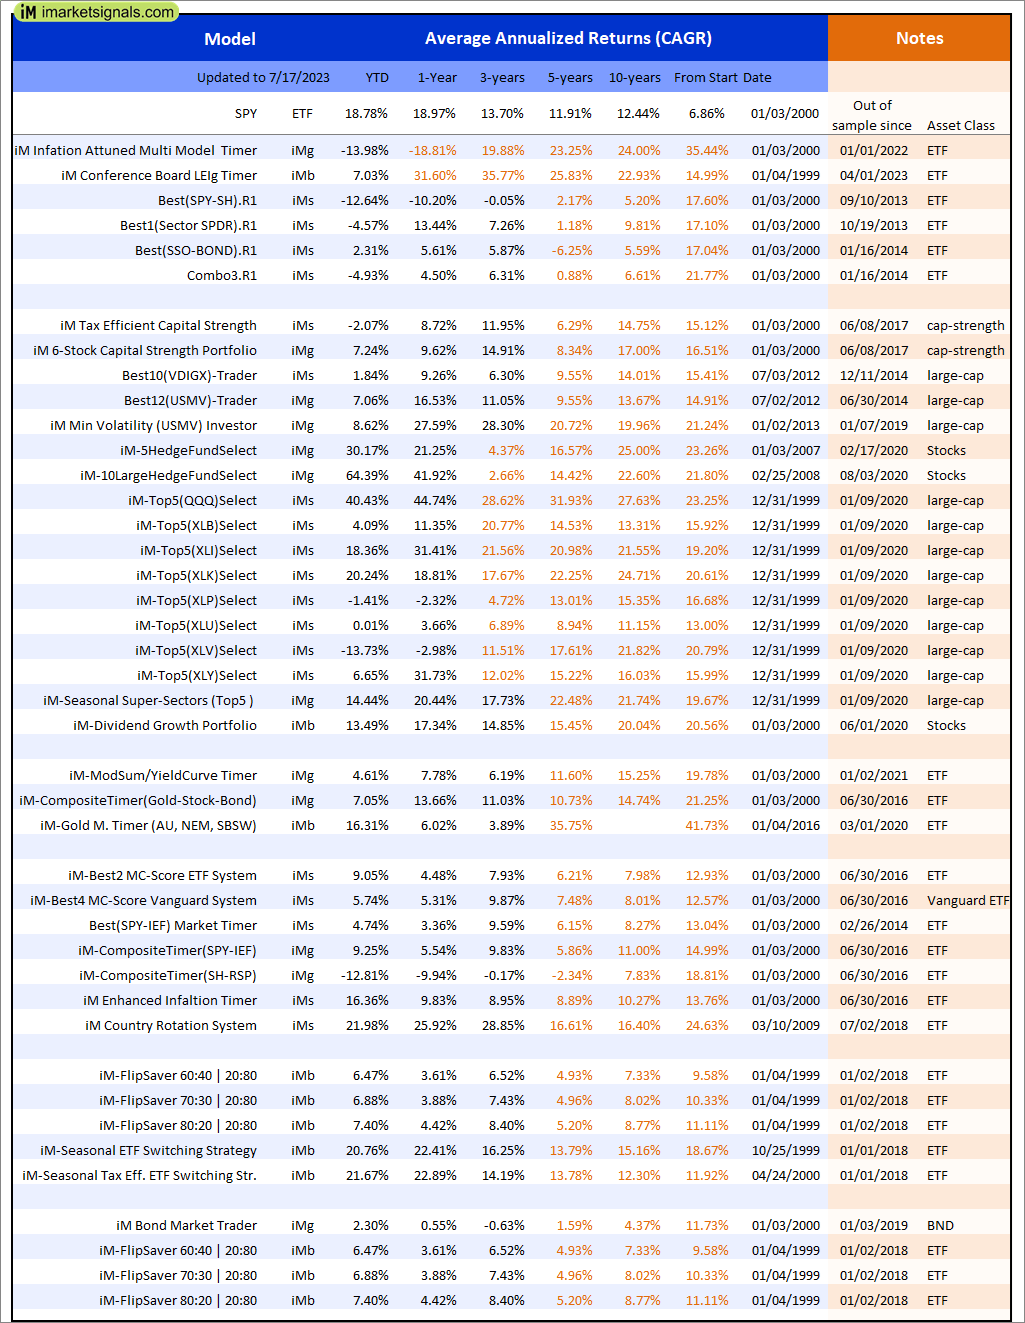
Out of sample performance summary of our models for the past 1, 2, 4 and 13 week periods. The active active return indicates how the models over- or underperformed the benchmark ETF SPY. Also the YTD, and the 1-, 3-, 5- and 10-year annualized returns are shown in the second table |
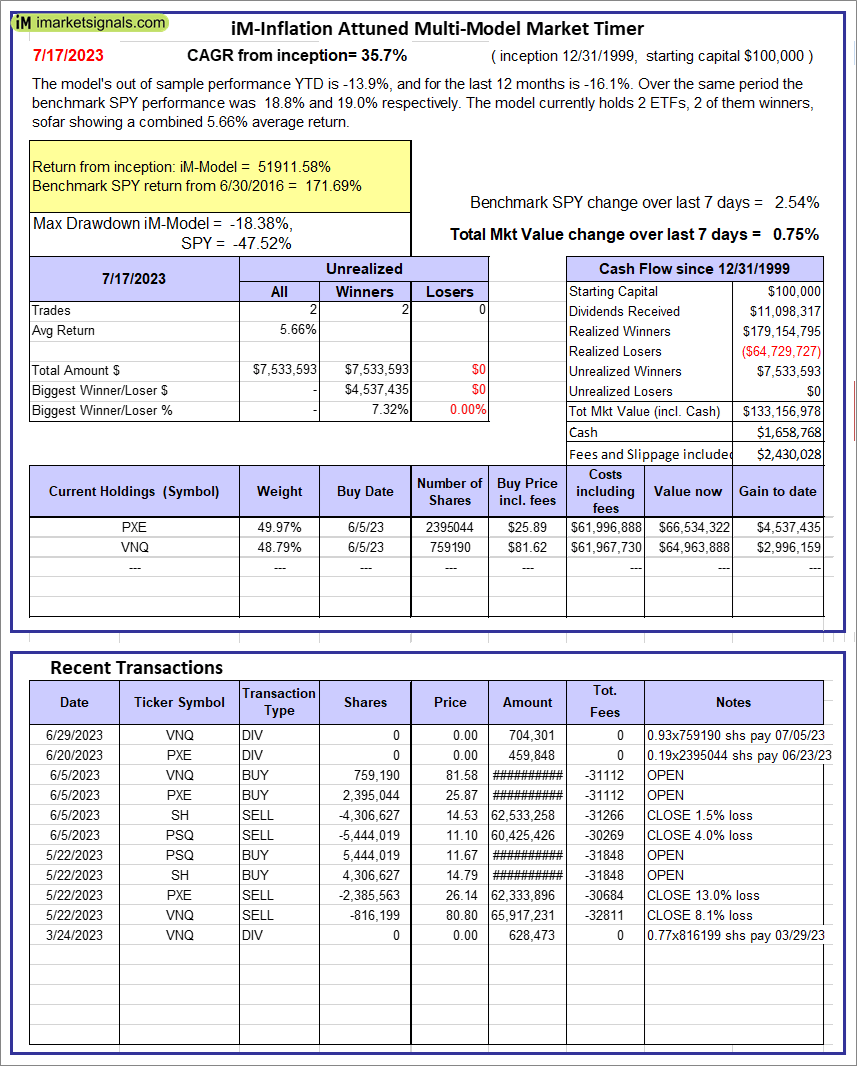 |
iM-Inflation Attuned Multi-Model Market Timer: The model’s out of sample performance YTD is -13.9%, and for the last 12 months is -16.1%. Over the same period the benchmark SPY performance was 18.8% and 19.0% respectively. Over the previous week the market value of the iM-Inflation Attuned Multi-Model Market Timer gained 0.75% at a time when SPY gained 2.54%. A starting capital of $100,000 at inception on 3/24/2017 would have grown to $133,156,978 which includes $1,658,768 cash and excludes $2,430,028 spent on fees and slippage. |
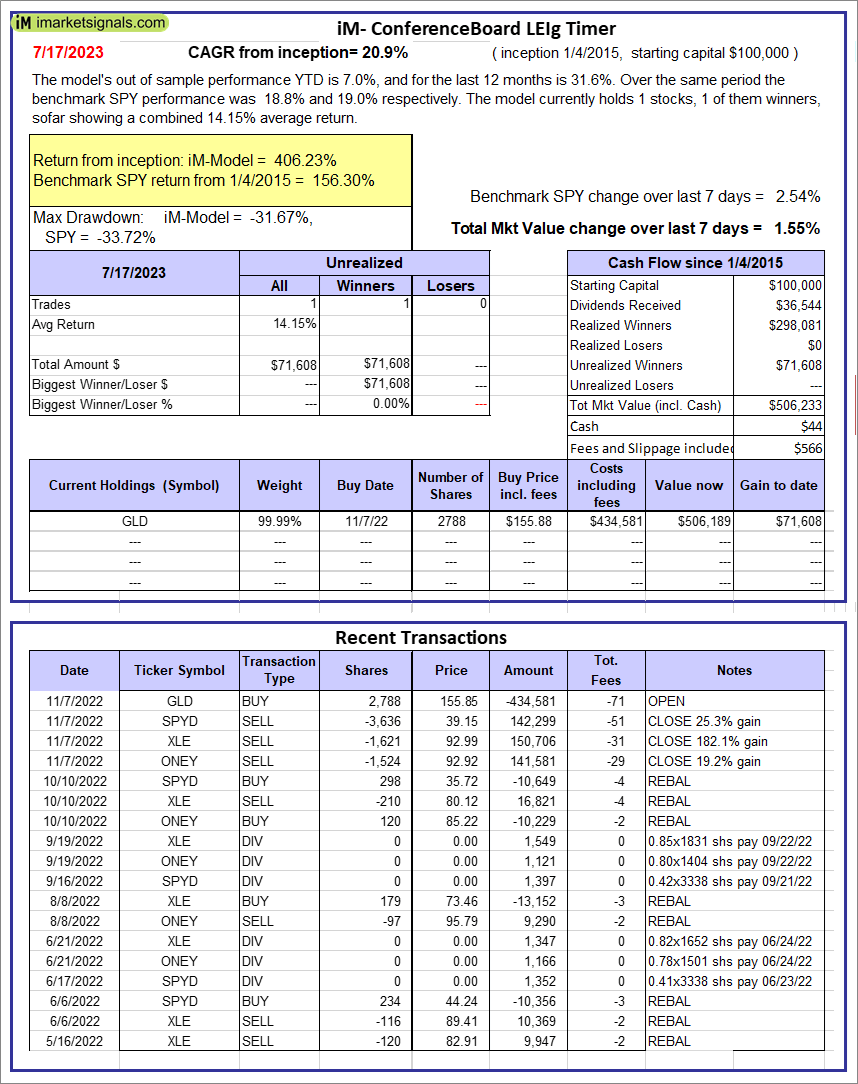 |
iM-Conference Board LEIg Timer: The model’s performance YTD is 14.3%, and for the last 12 months is 7.3%. Over the same period the benchmark SPY performance was 20.1% and 9.4% respectively. Over the previous week the market value of the iM-Conference Board LEIg Timer gained 1.55% at a time when SPY gained 2.54%. A starting capital of $100,000 at inception on 4/5/2017 would have grown to $506,233 which includes $44 cash and excludes $566 spent on fees and slippage. |
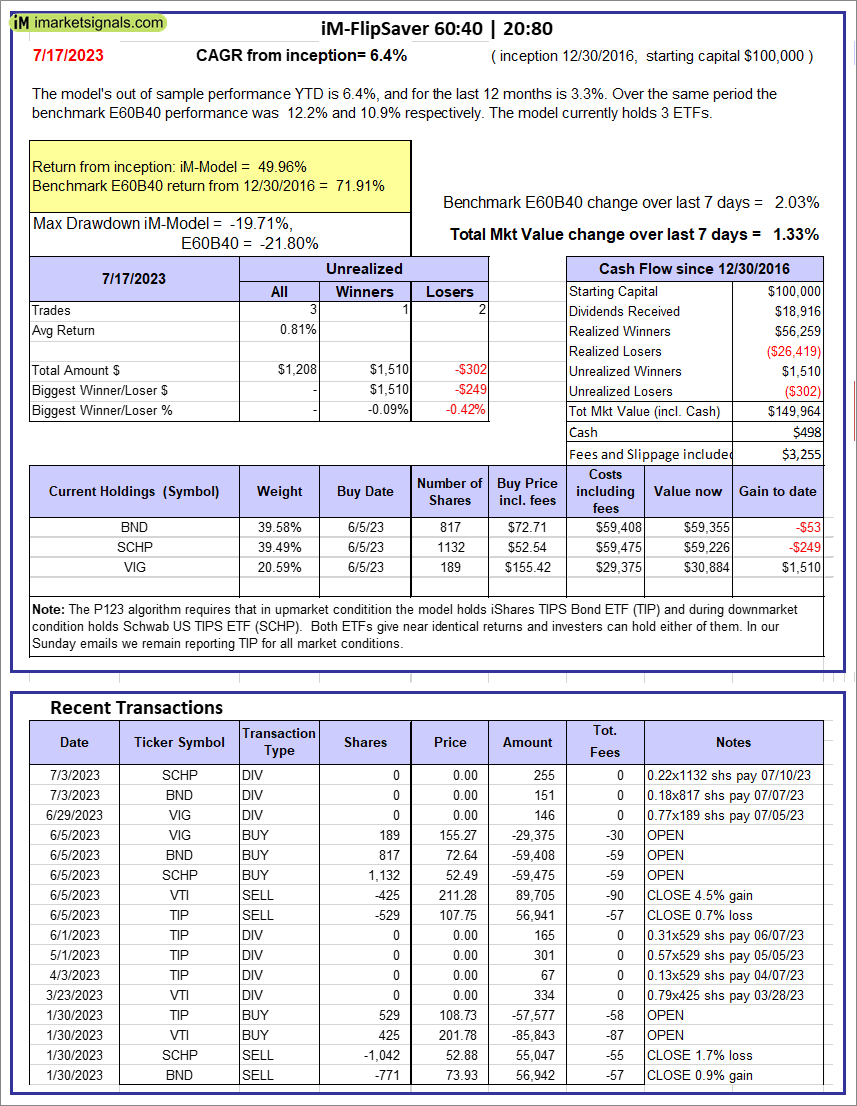 |
iM-FlipSaver 60:40 | 20:80 – 2017: The model’s out of sample performance YTD is 6.4%, and for the last 12 months is 3.3%. Over the same period the benchmark E60B40 performance was 12.2% and 10.9% respectively. Over the previous week the market value of iM-FlipSaver 80:20 | 20:80 gained 1.33% at a time when SPY gained 2.03%. A starting capital of $100,000 at inception on 7/16/2015 would have grown to $149,964 which includes $498 cash and excludes $3,255 spent on fees and slippage. |
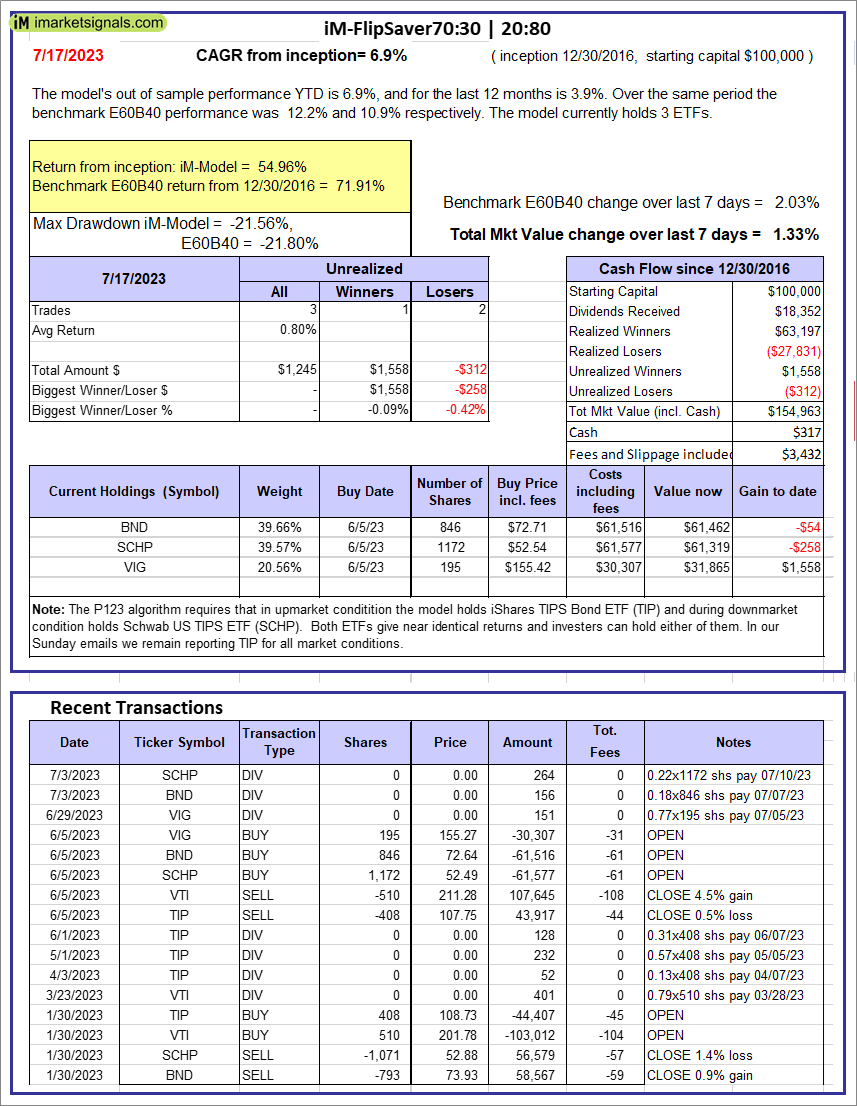 |
iM-FlipSaver 70:30 | 20:80 – 2017: The model’s out of sample performance YTD is 6.9%, and for the last 12 months is 3.9%. Over the same period the benchmark E60B40 performance was 12.2% and 10.9% respectively. Over the previous week the market value of iM-FlipSaver 70:30 | 20:80 gained 1.33% at a time when SPY gained 2.03%. A starting capital of $100,000 at inception on 7/15/2015 would have grown to $154,963 which includes $317 cash and excludes $3,432 spent on fees and slippage. |
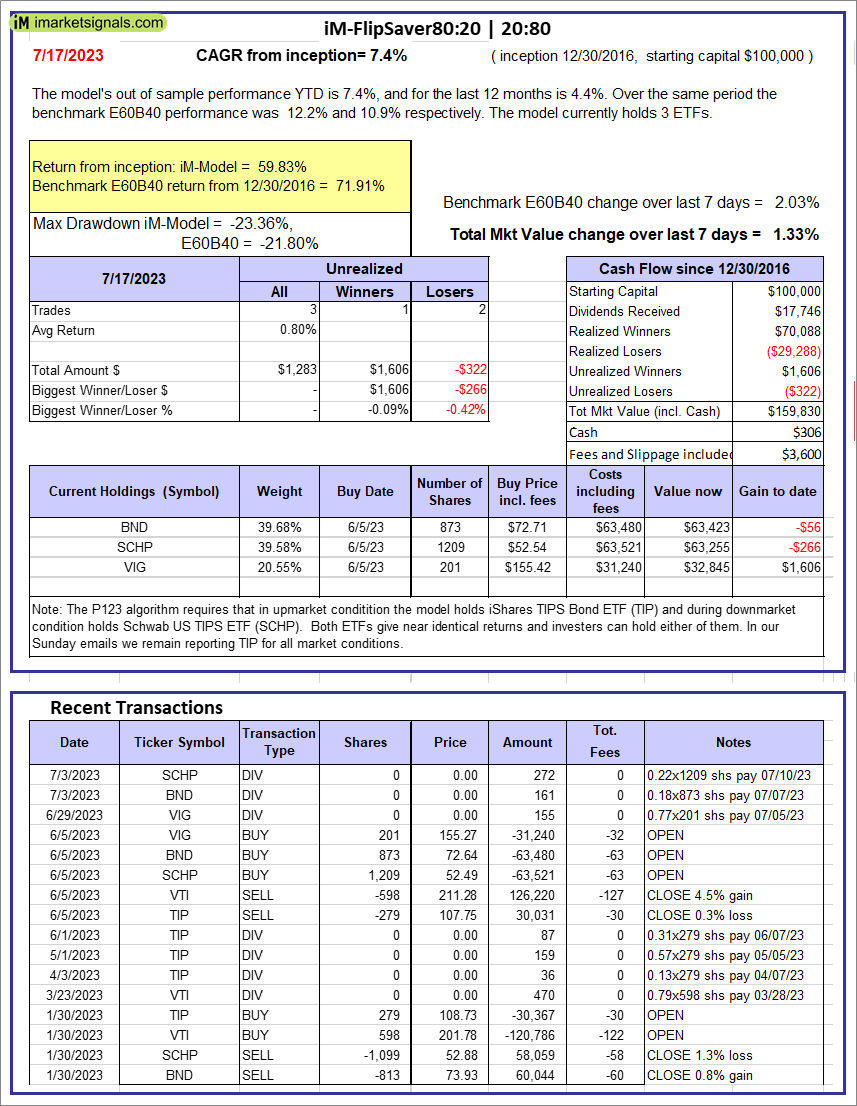 |
iM-FlipSaver 80:20 | 20:80 – 2017: The model’s out of sample performance YTD is 7.4%, and for the last 12 months is 4.4%. Over the same period the benchmark E60B40 performance was 12.2% and 10.9% respectively. Over the previous week the market value of iM-FlipSaver 80:20 | 20:80 gained 1.33% at a time when SPY gained 2.03%. A starting capital of $100,000 at inception on 1/2/2017 would have grown to $159,830 which includes $306 cash and excludes $3,600 spent on fees and slippage. |
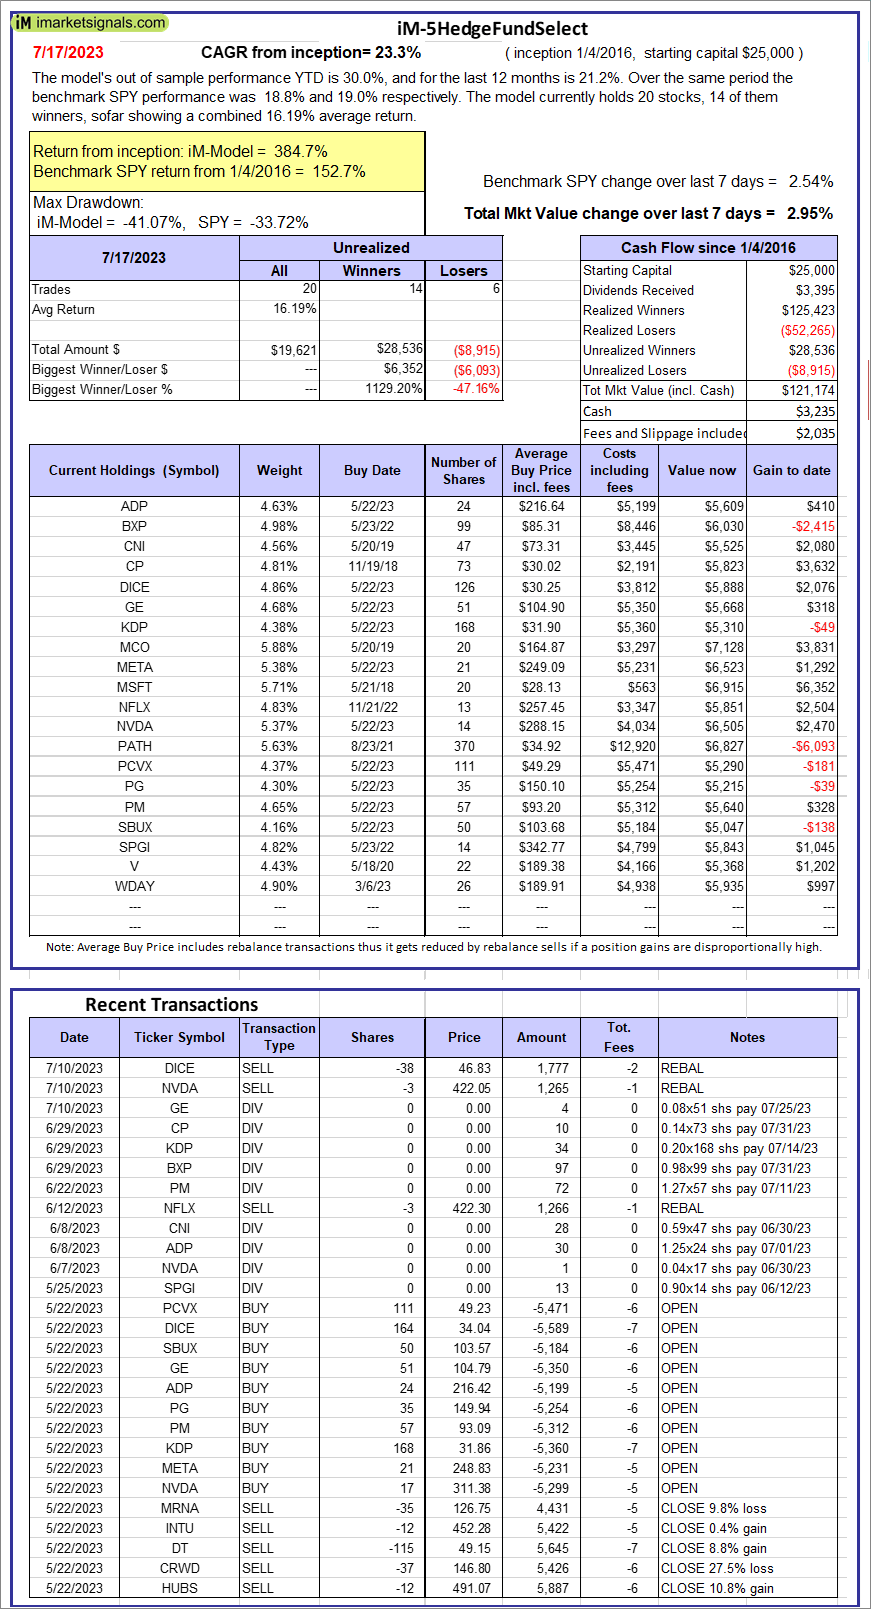 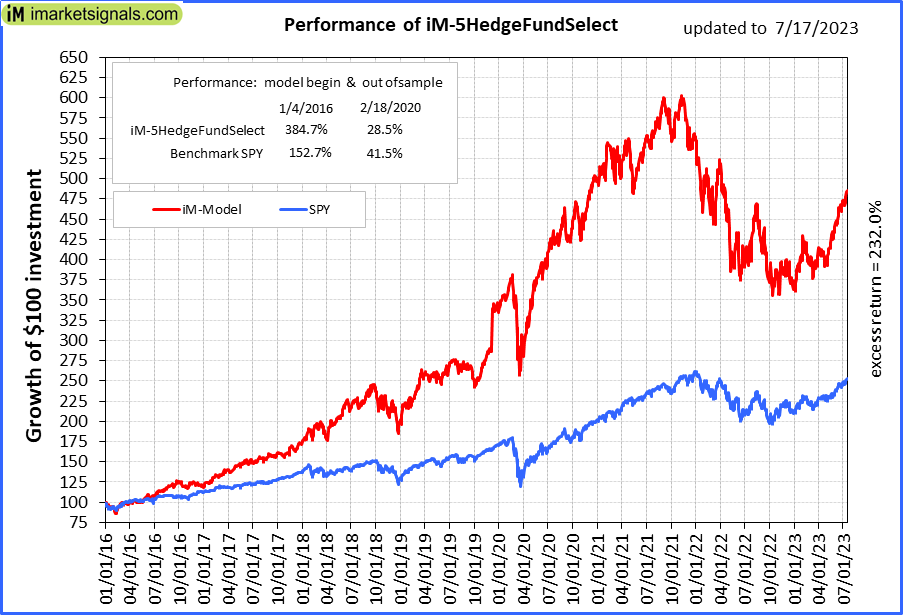 |
iM-5HedgeFundSelect: Since inception, on 1/5/2016, the model gained 384.70% while the benchmark SPY gained 152.71% over the same period. Over the previous week the market value of iM-5HedgeFundSelect gained 2.95% at a time when SPY gained 2.54%. A starting capital of $25,000 at inception on 1/5/2016 would have grown to $121,174 which includes $3,235 cash and excludes $2,035 spent on fees and slippage. |
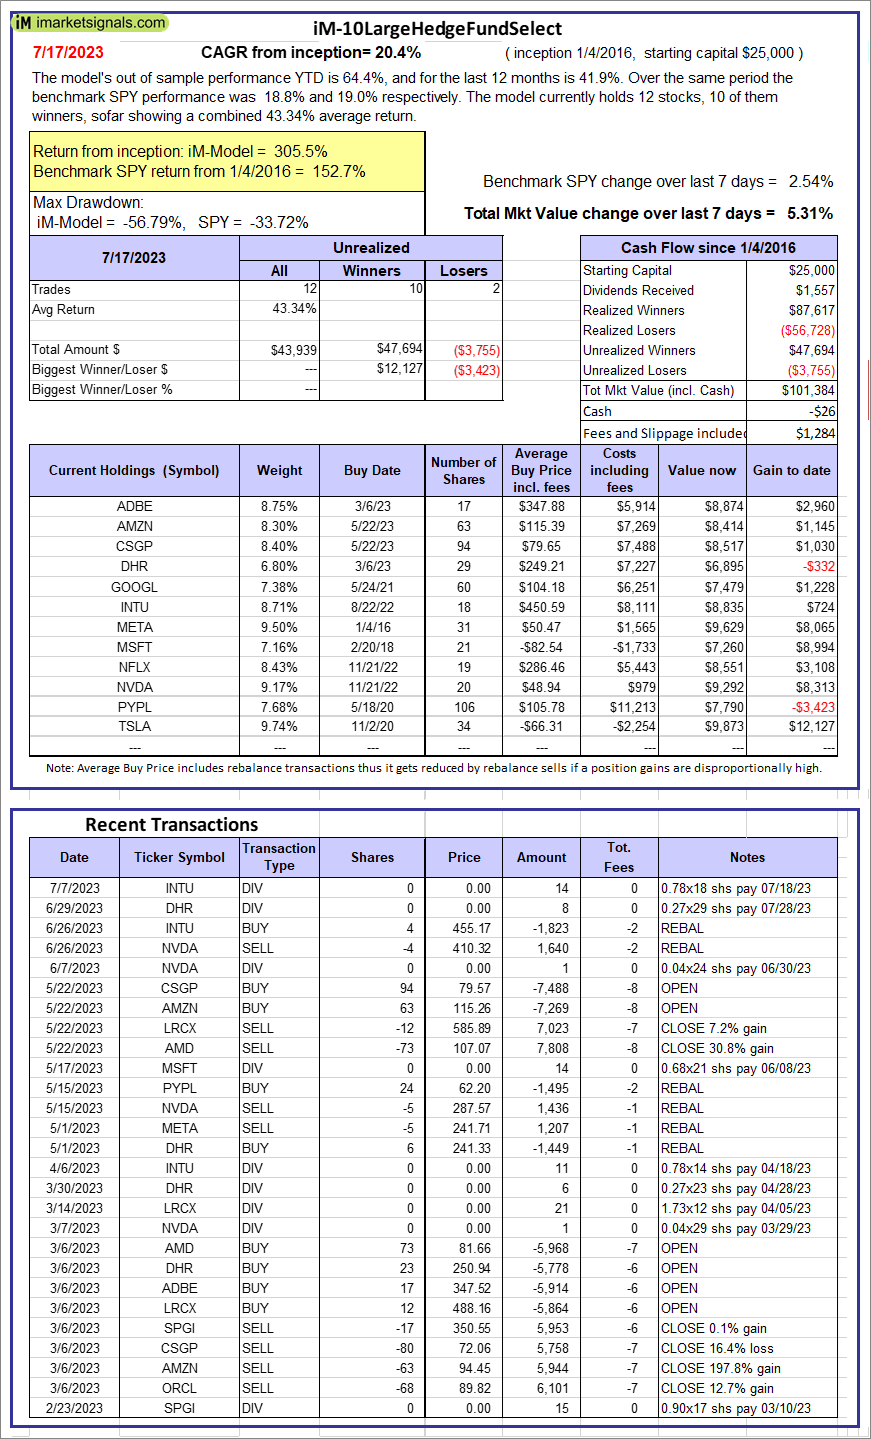 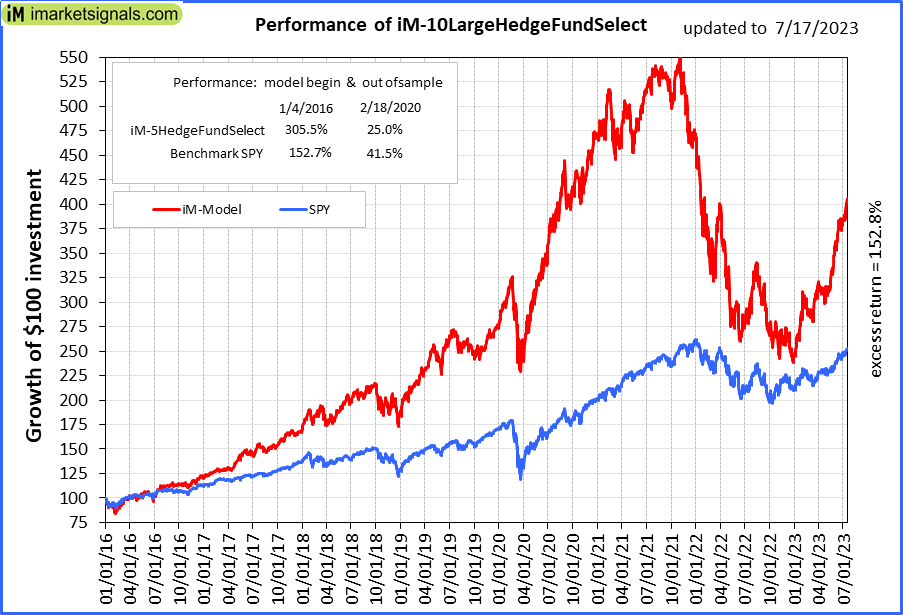 |
iM-10LargeHedgeFundSelect: Since inception, on 1/5/2016, the model gained 305.54% while the benchmark SPY gained 152.71% over the same period. Over the previous week the market value of iM-10LargeHedgeFundSelect gained 5.31% at a time when SPY gained 2.54%. A starting capital of $25,000 at inception on 1/5/2016 would have grown to $101,384 which includes -$26 cash and excludes $1,284 spent on fees and slippage. |
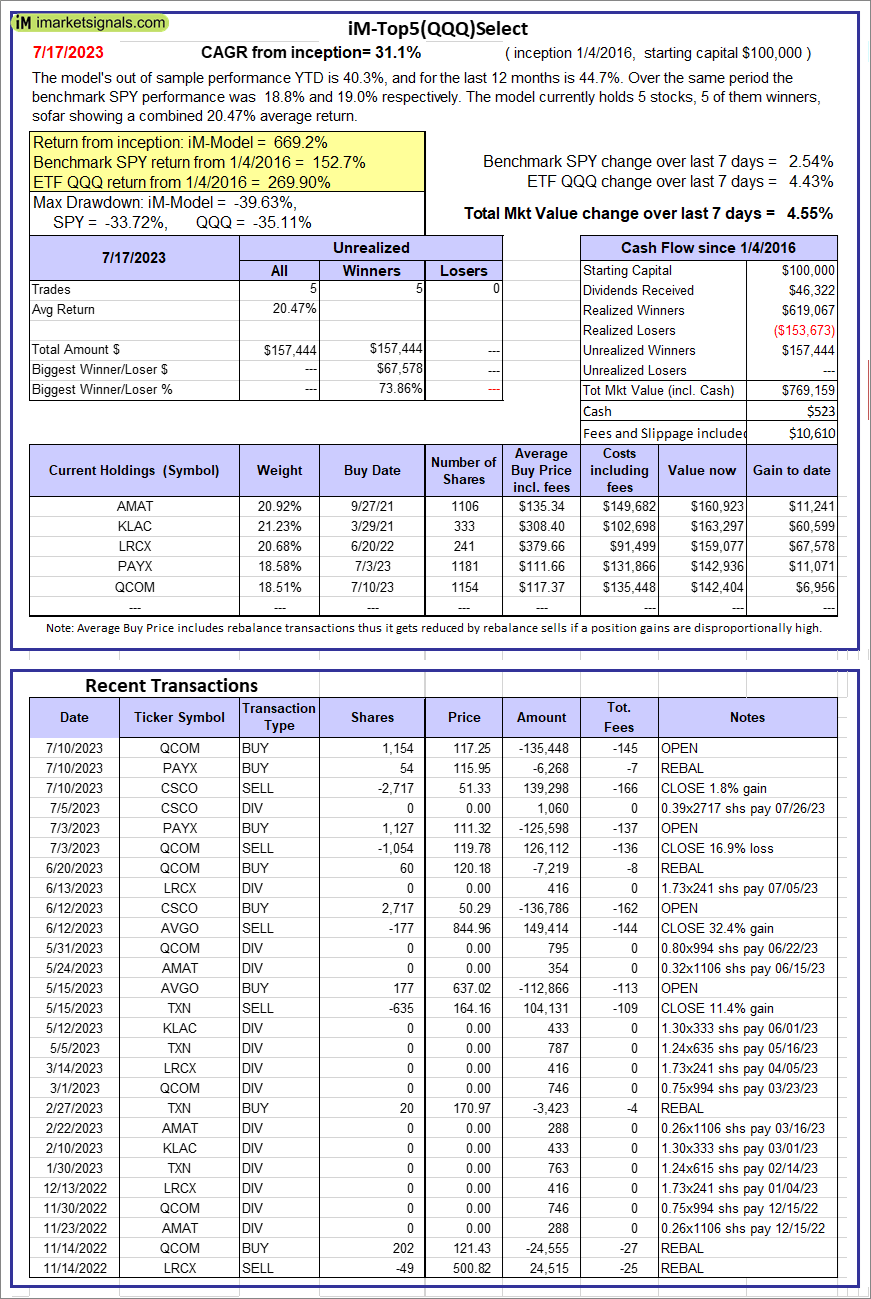 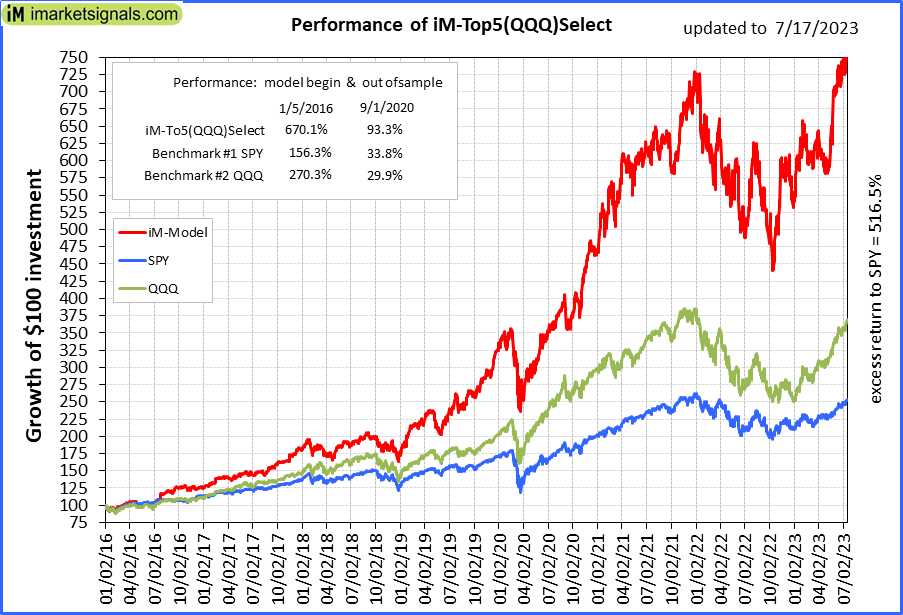 |
iM-Top5(QQQ)Select: Since inception, on 1/5/2016, the model gained 669.16% while the benchmark SPY gained 152.71% over the same period. Over the previous week the market value of iM-Top5(QQQ)Select gained 4.55% at a time when SPY gained 2.54%. A starting capital of $100,000 at inception on 1/5/2016 would have grown to $769,159 which includes $523 cash and excludes $10,610 spent on fees and slippage. |
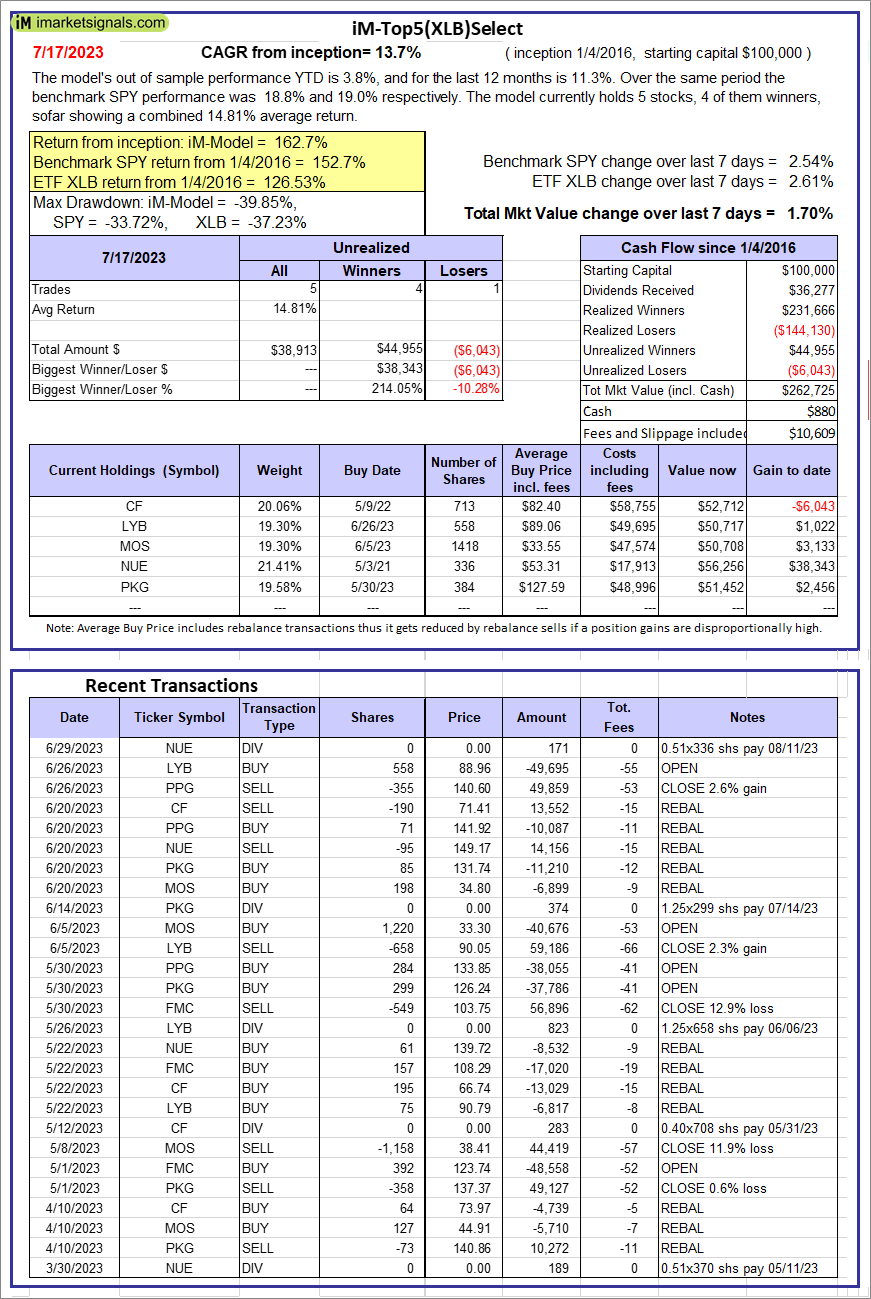 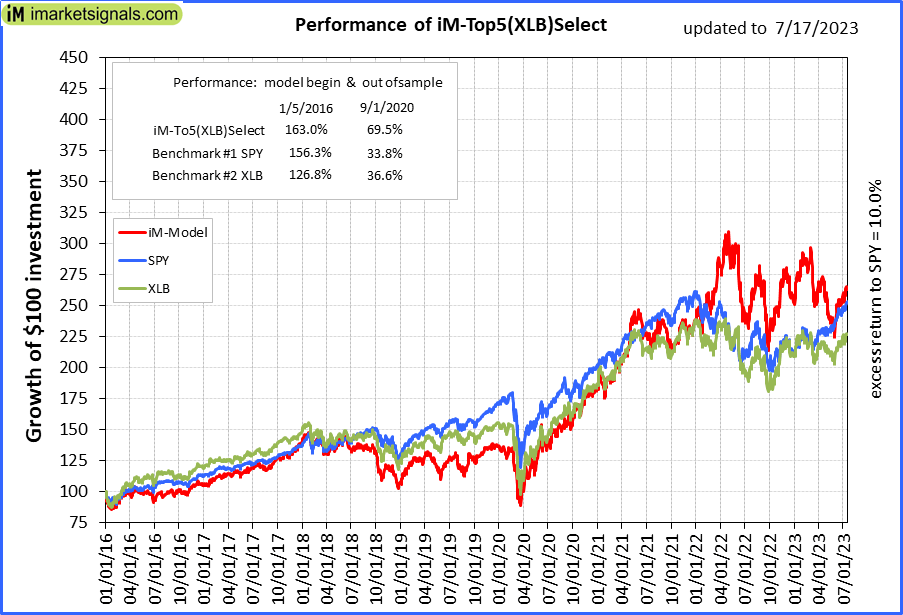 |
iM-Top5(XLB)Select: Since inception, on 1/5/2016, the model gained 162.73% while the benchmark SPY gained 152.71% over the same period. Over the previous week the market value of iM-Top5(XLB)Select gained 1.70% at a time when SPY gained 2.54%. A starting capital of $100,000 at inception on 1/5/2016 would have grown to $262,725 which includes $880 cash and excludes $10,609 spent on fees and slippage. |
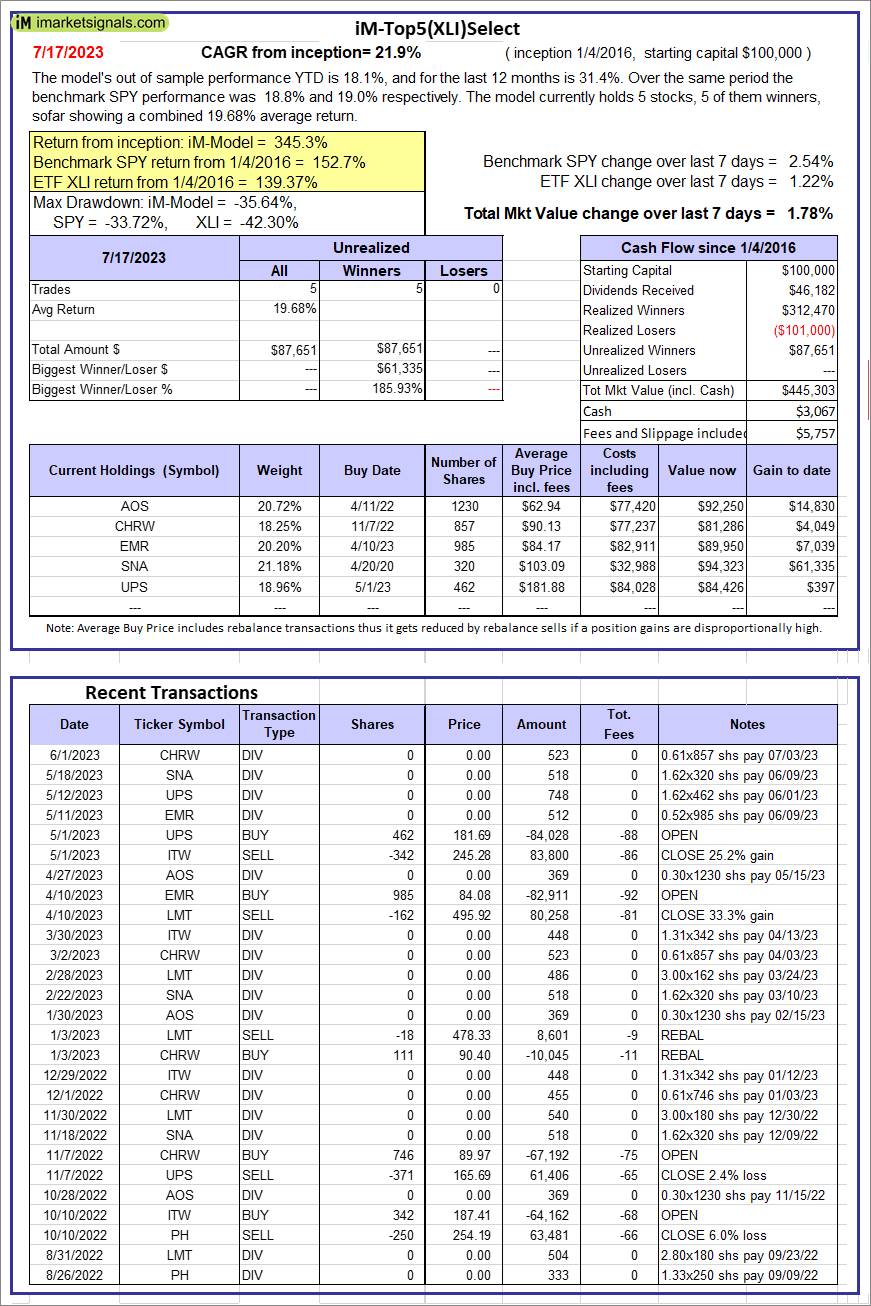 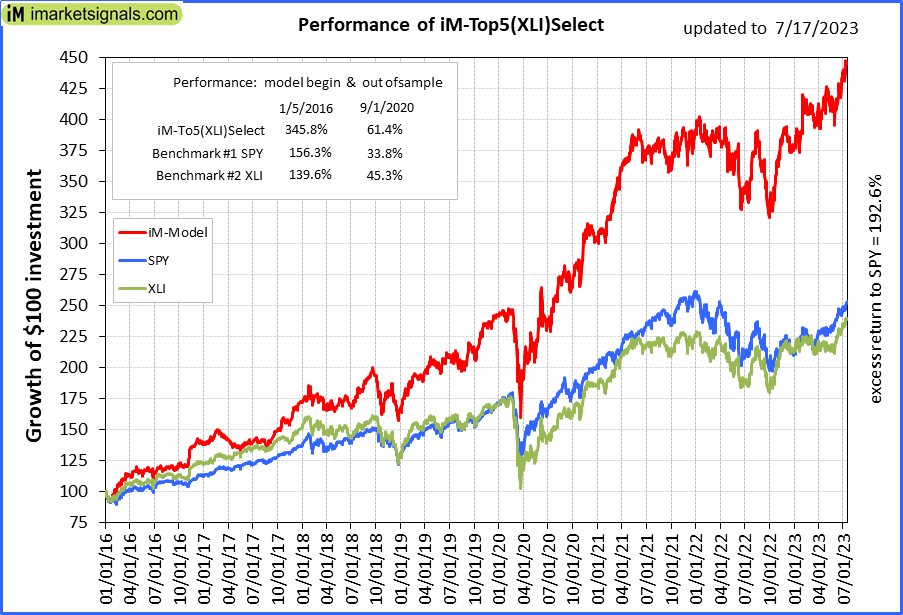 |
iM-Top5(XLI)Select: Since inception, on 1/5/2016, the model gained 345.30% while the benchmark SPY gained 152.71% over the same period. Over the previous week the market value of iM-Top5(XLI)Select gained 1.78% at a time when SPY gained 2.54%. A starting capital of $100,000 at inception on 1/5/2016 would have grown to $445,303 which includes $3,067 cash and excludes $5,757 spent on fees and slippage. |
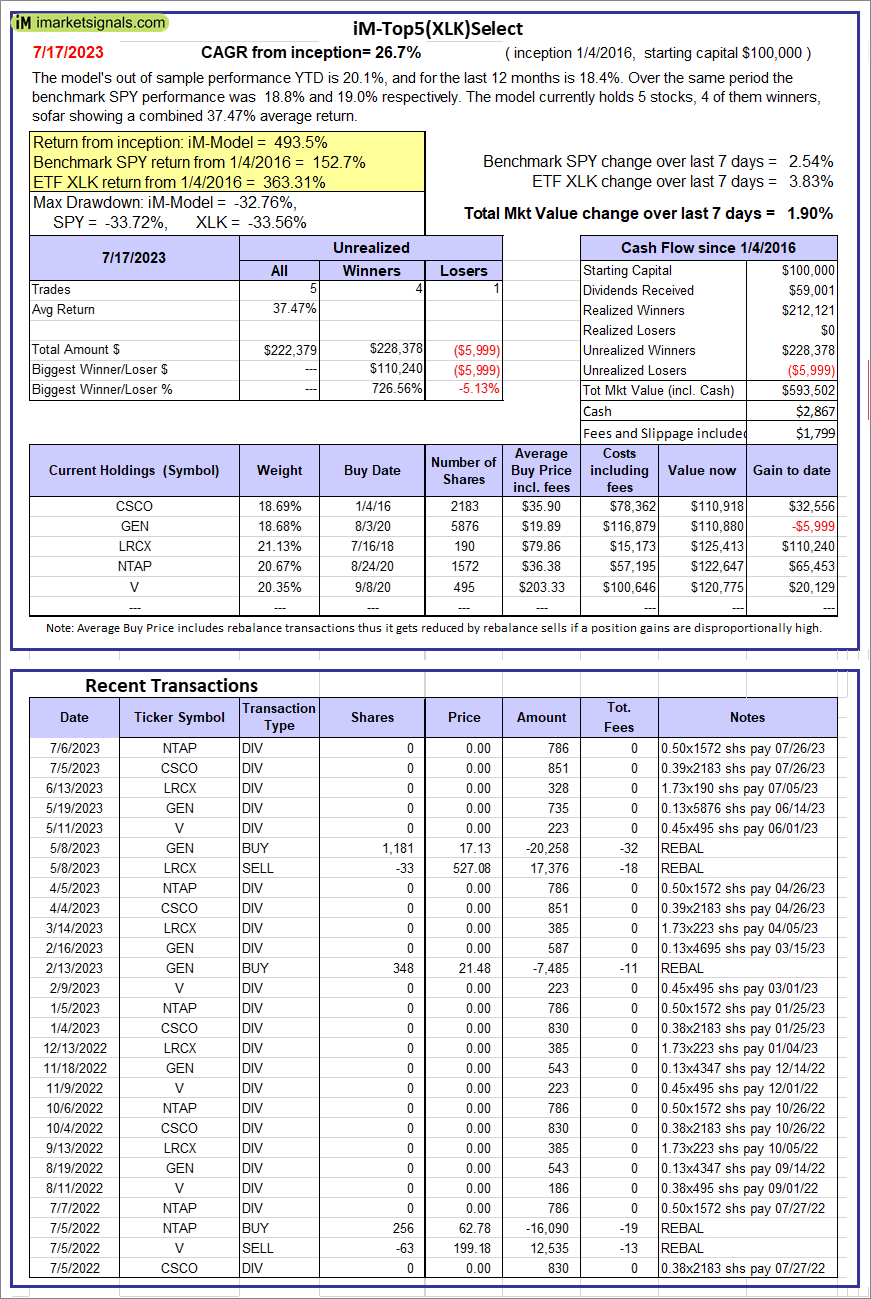 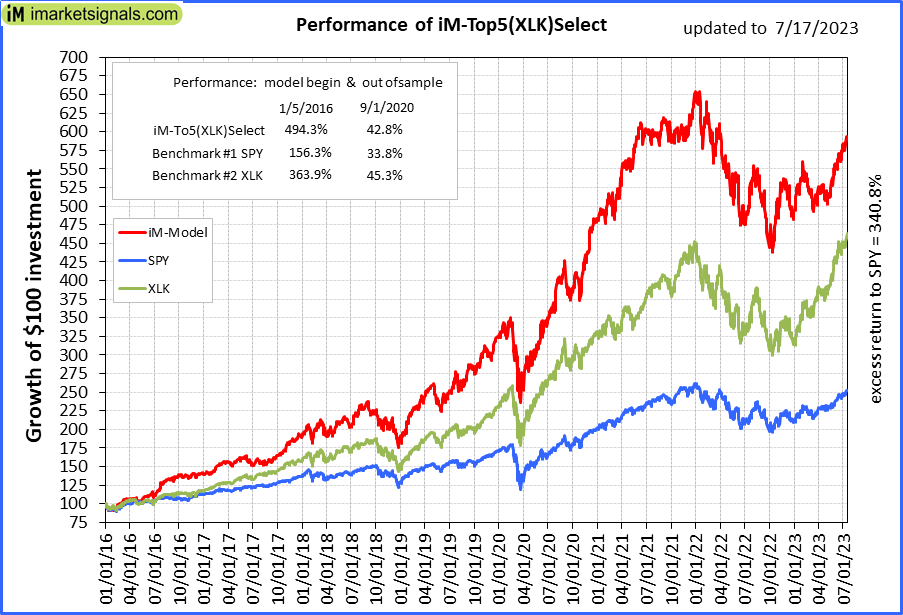 |
iM-Top5(XLK)Select: Since inception, on 1/5/2016, the model gained 493.50% while the benchmark SPY gained 152.71% over the same period. Over the previous week the market value of iM-Top5(XLK)Select gained 1.90% at a time when SPY gained 2.54%. A starting capital of $100,000 at inception on 1/5/2016 would have grown to $593,502 which includes $2,867 cash and excludes $1,799 spent on fees and slippage. |
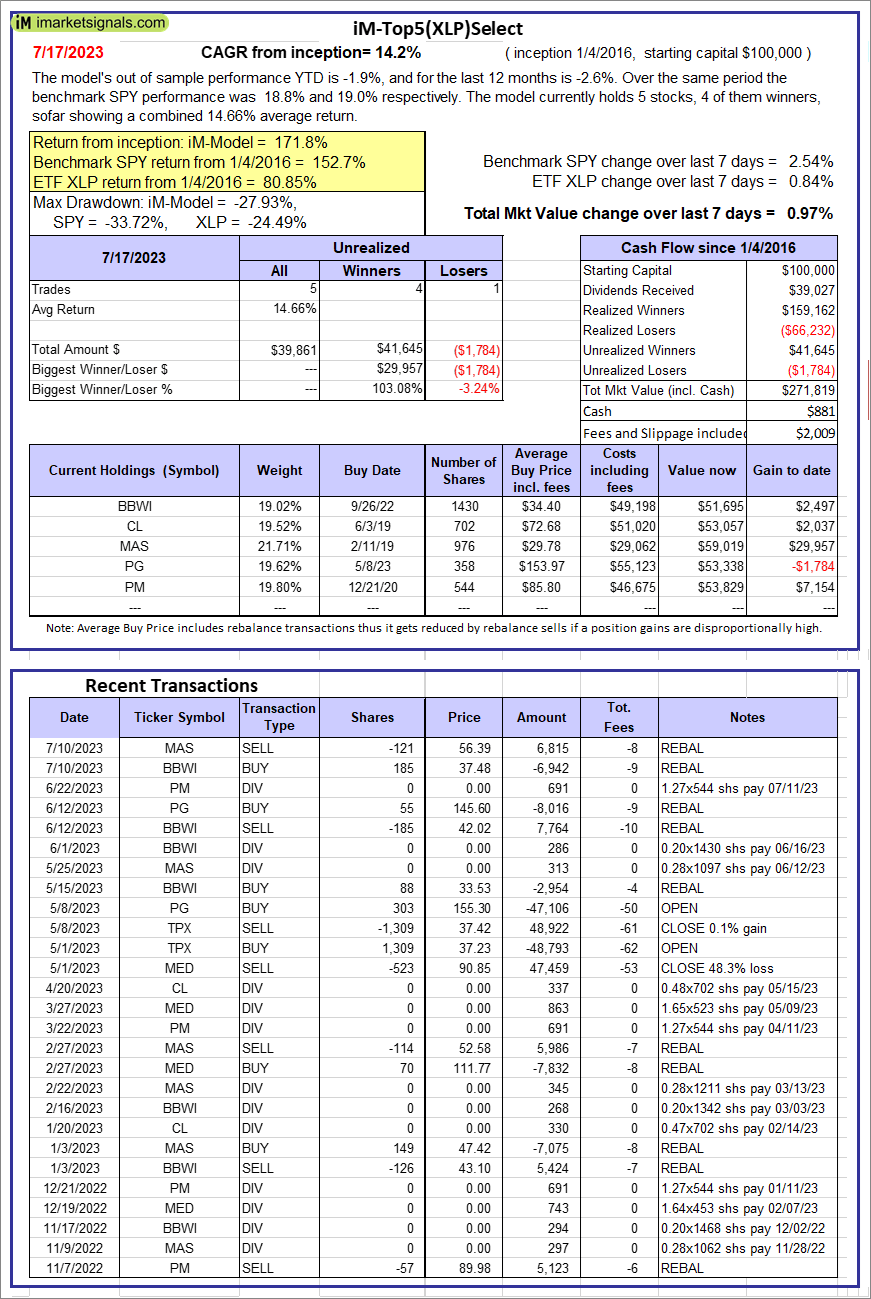 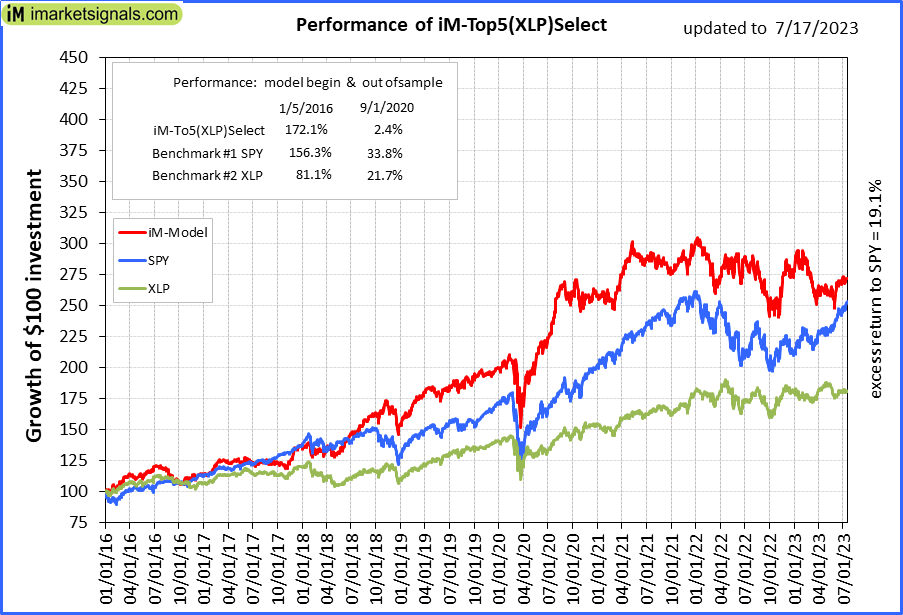 |
iM-Top5(XLP)Select: Since inception, on 1/5/2016, the model gained 171.82% while the benchmark SPY gained 152.71% over the same period. Over the previous week the market value of iM-Top5(XLP)Select gained 0.97% at a time when SPY gained 2.54%. A starting capital of $100,000 at inception on 1/5/2016 would have grown to $271,819 which includes $881 cash and excludes $2,009 spent on fees and slippage. |
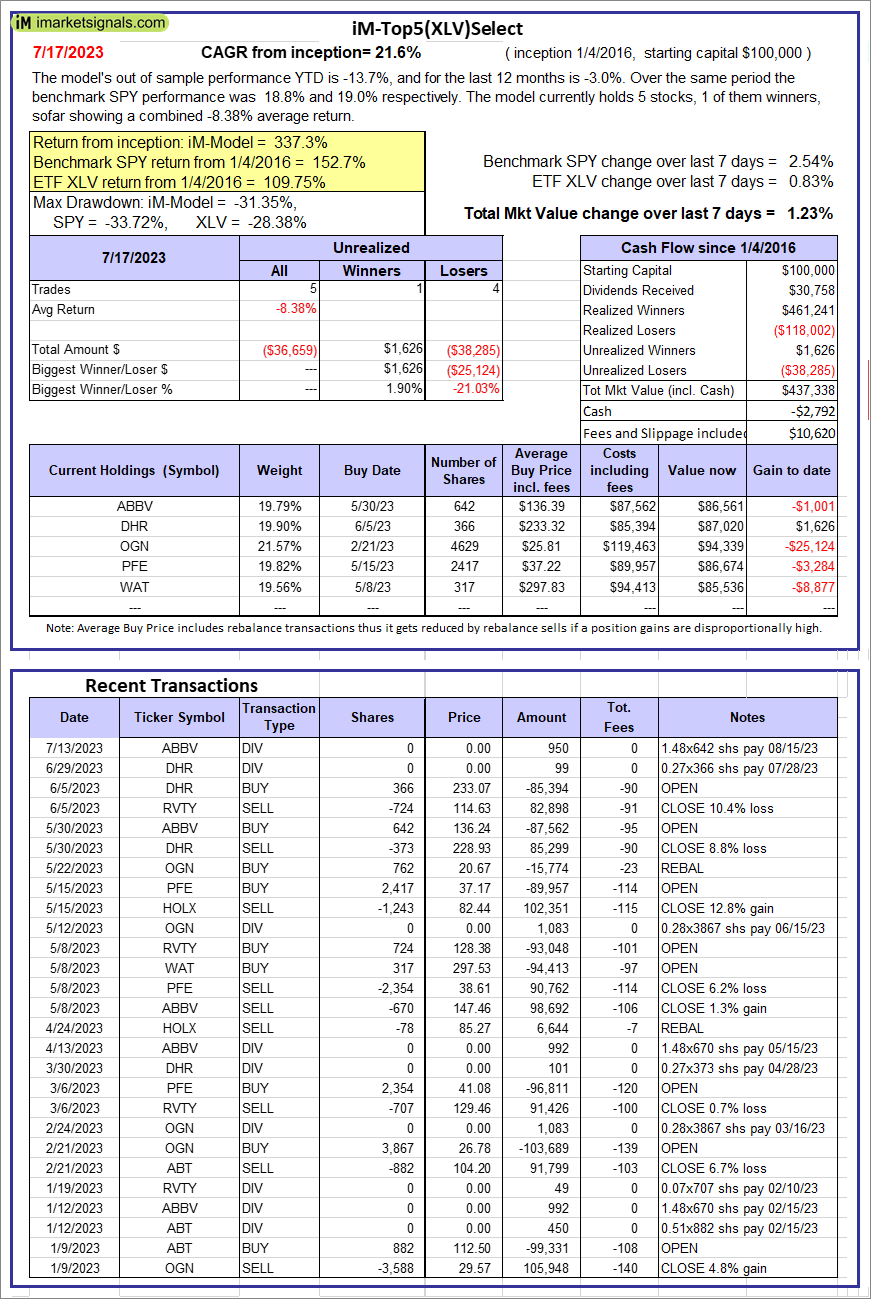 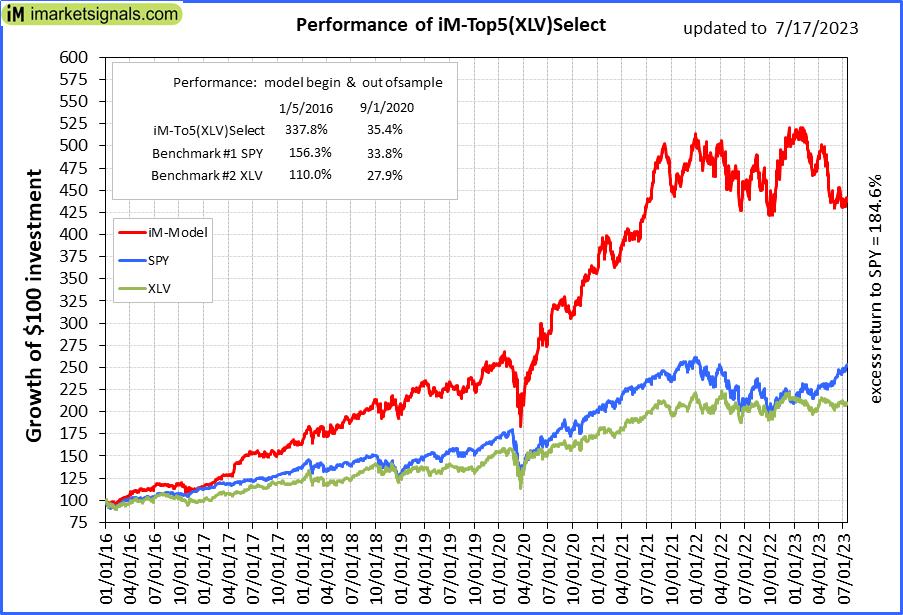 |
iM-Top5(XLV)Select: Since inception, on 1/5/2016, the model gained 337.34% while the benchmark SPY gained 152.71% over the same period. Over the previous week the market value of iM-Top5(XLV)Select gained 1.23% at a time when SPY gained 2.54%. A starting capital of $100,000 at inception on 1/5/2016 would have grown to $437,338 which includes -$2,792 cash and excludes $10,620 spent on fees and slippage. |
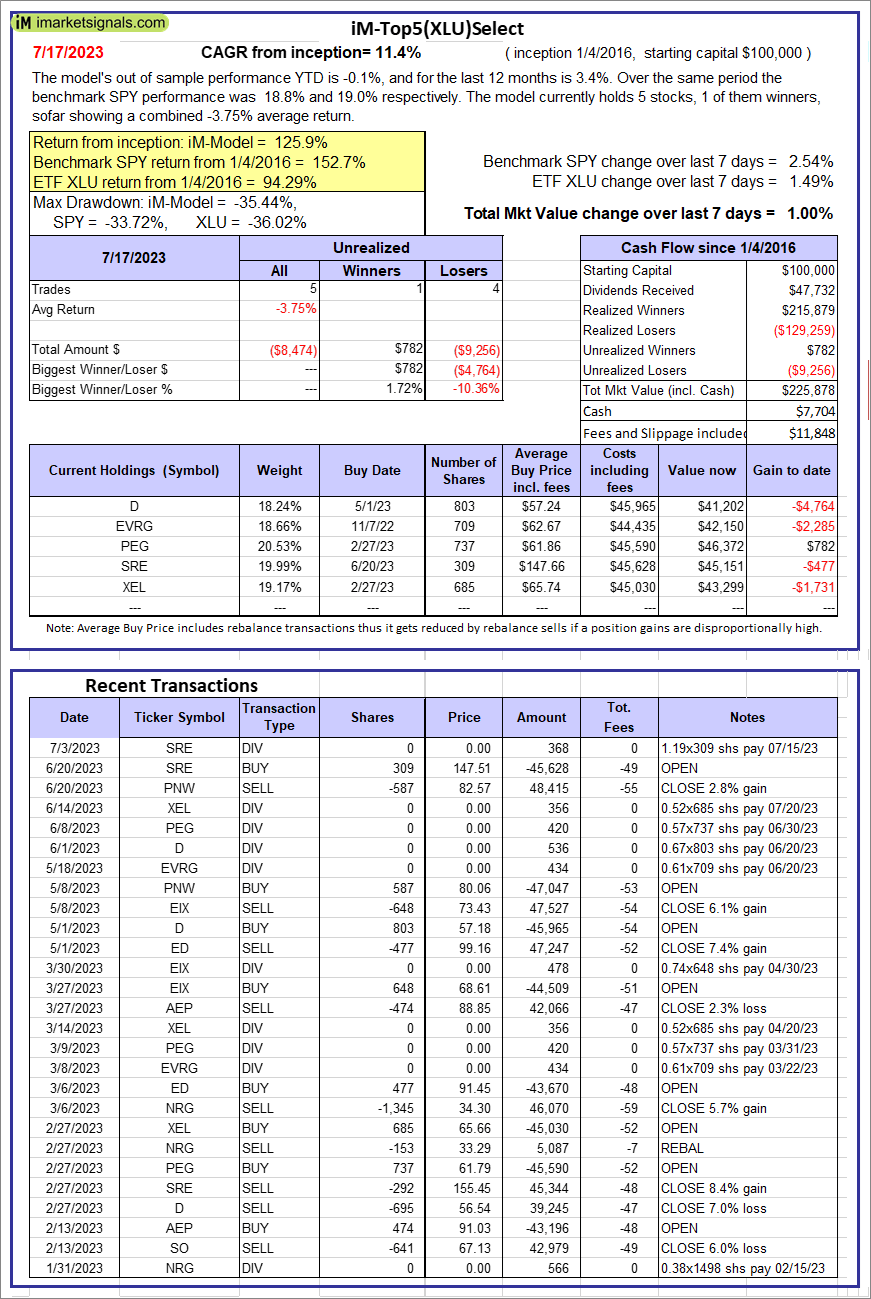 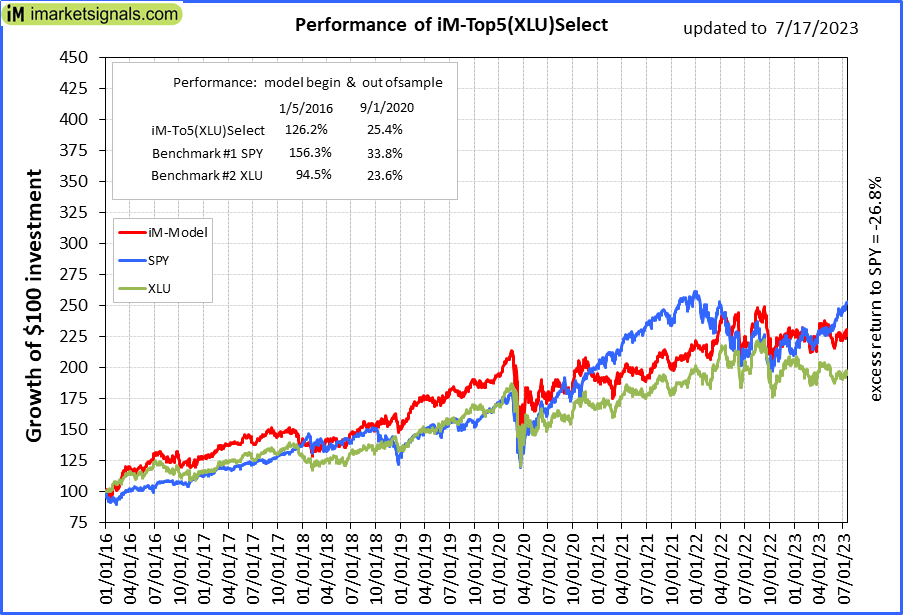 |
iM-Top5(XLU)Select: Since inception, on 1/5/2016, the model gained 125.88% while the benchmark SPY gained 152.71% over the same period. Over the previous week the market value of iM-Top5(XLU)Select gained 1.00% at a time when SPY gained 2.54%. A starting capital of $100,000 at inception on 1/5/2016 would have grown to $225,878 which includes $7,704 cash and excludes $11,848 spent on fees and slippage. |
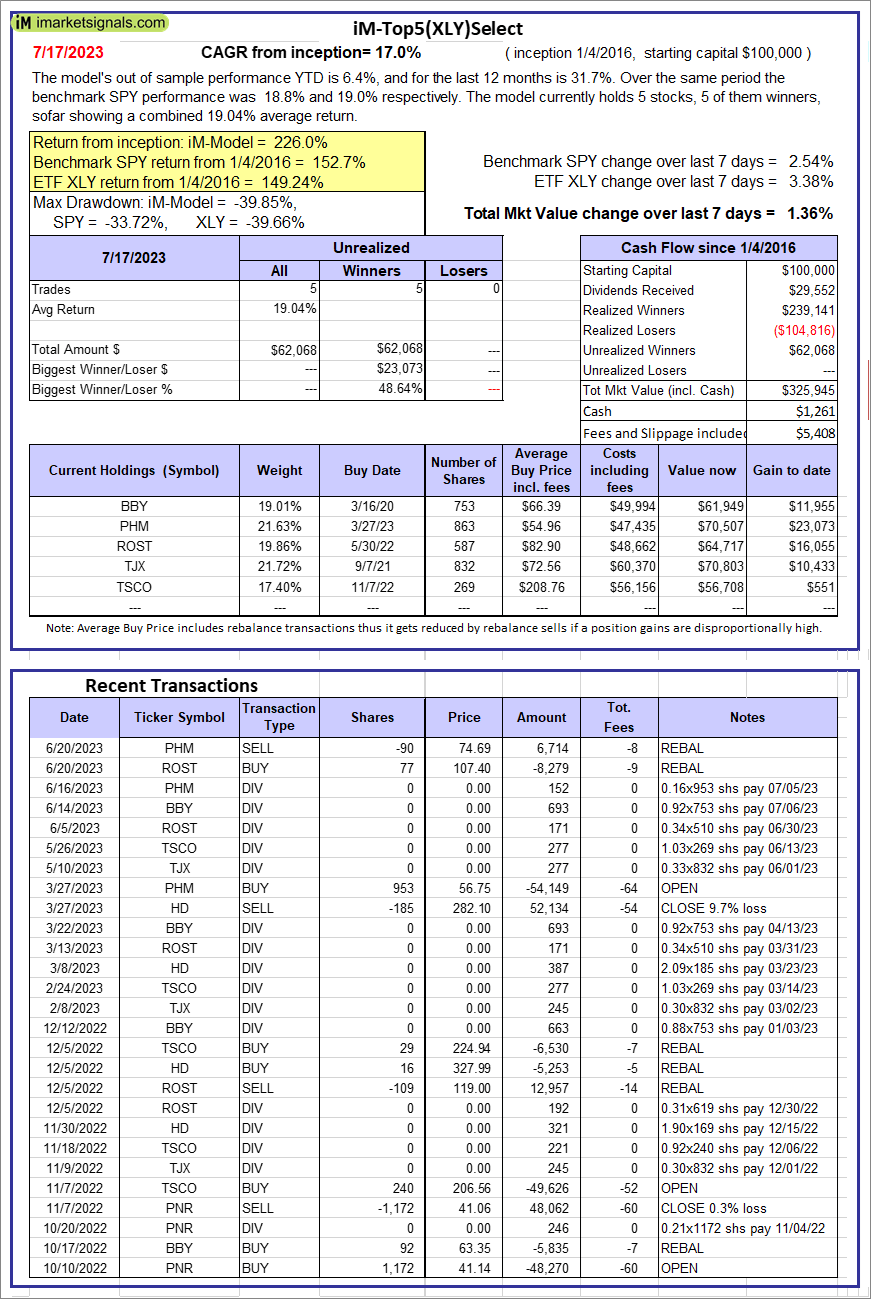 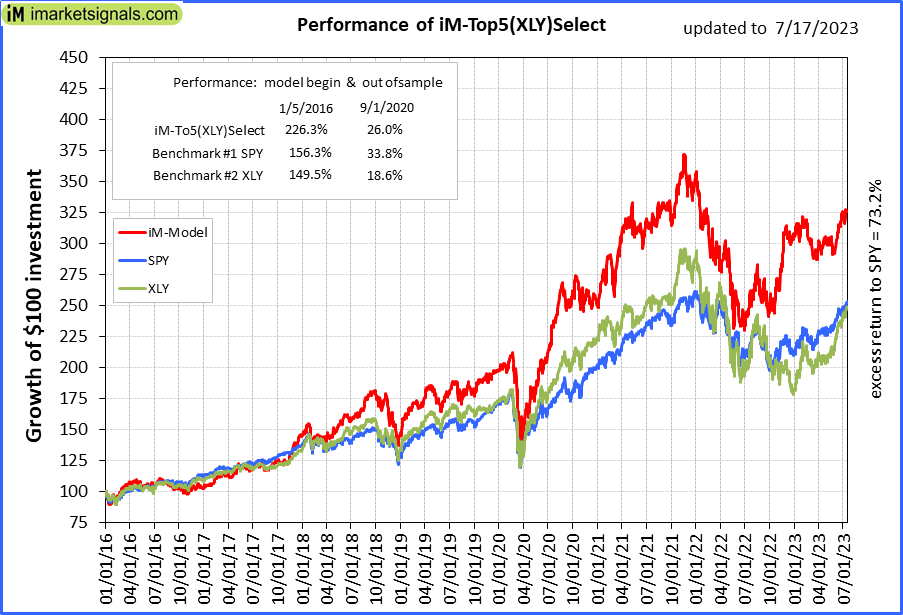 |
iM-Top5(XLY)Select: Since inception, on 1/5/2016, the model gained 225.95% while the benchmark SPY gained 152.71% over the same period. Over the previous week the market value of iM-Top5(XLY)Select gained 1.36% at a time when SPY gained 2.54%. A starting capital of $100,000 at inception on 1/5/2016 would have grown to $325,945 which includes $1,261 cash and excludes $5,408 spent on fees and slippage. |
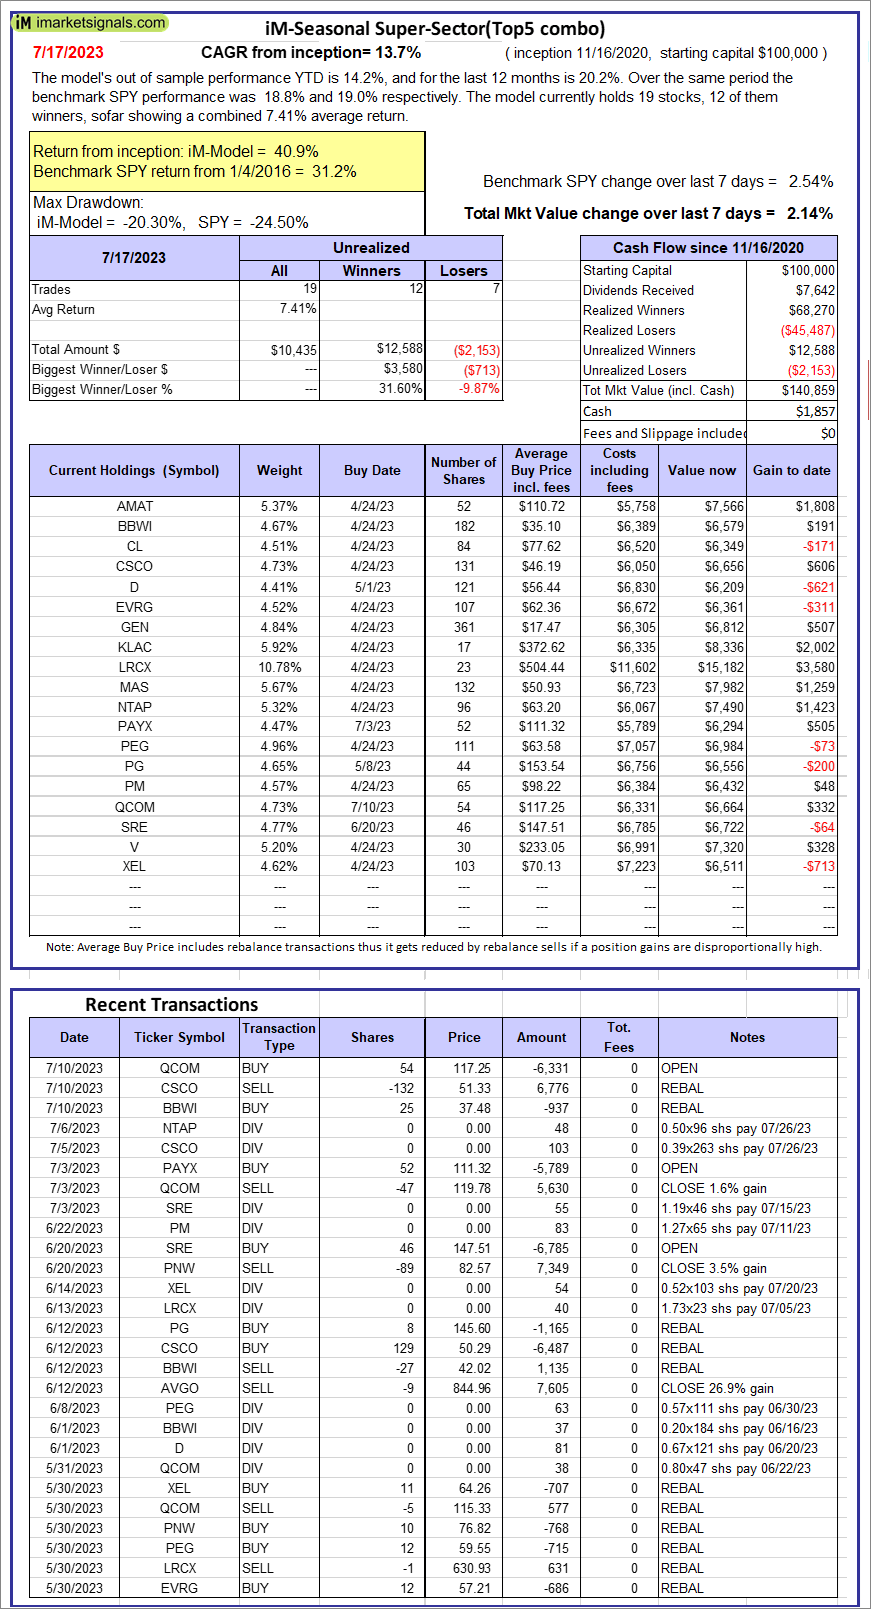 |
iM-Seasonal Super-Sectors (Top5 combo) : Since inception, on 11/17/2020, the model gained 40.86% while the benchmark SPY gained 31.18% over the same period. Over the previous week the market value of iM-Seasonal Super-Sectors (Top5 combo) gained 2.14% at a time when SPY gained 2.54%. A starting capital of $100,000 at inception on 11/17/2020 would have grown to $140,859 which includes $1,857 cash and excludes $00 spent on fees and slippage. |
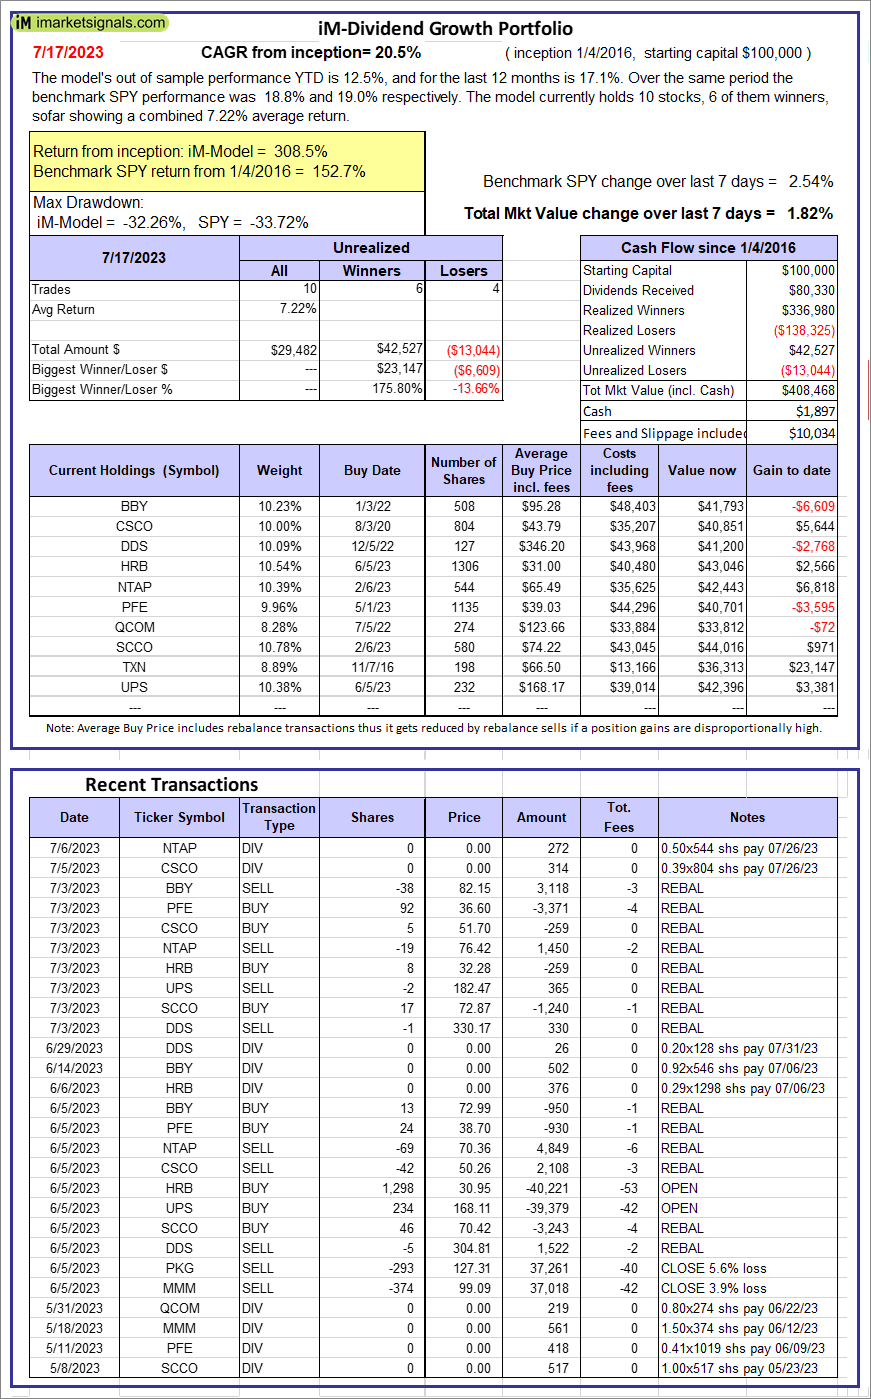 |
iM-Dividend Growth Portfolio: The model’s out of sample performance YTD is 12.5%, and for the last 12 months is 17.1%. Over the same period the benchmark SPY performance was 18.8% and 19.0% respectively. Over the previous week the market value of the iM-Dividend Growth Portfolio gained 1.82% at a time when SPY gained 2.54%. A starting capital of $100,000 at inception on 6/30/2016 would have grown to $408,468 which includes $1,897 cash and excludes $10,034 spent on fees and slippage. |
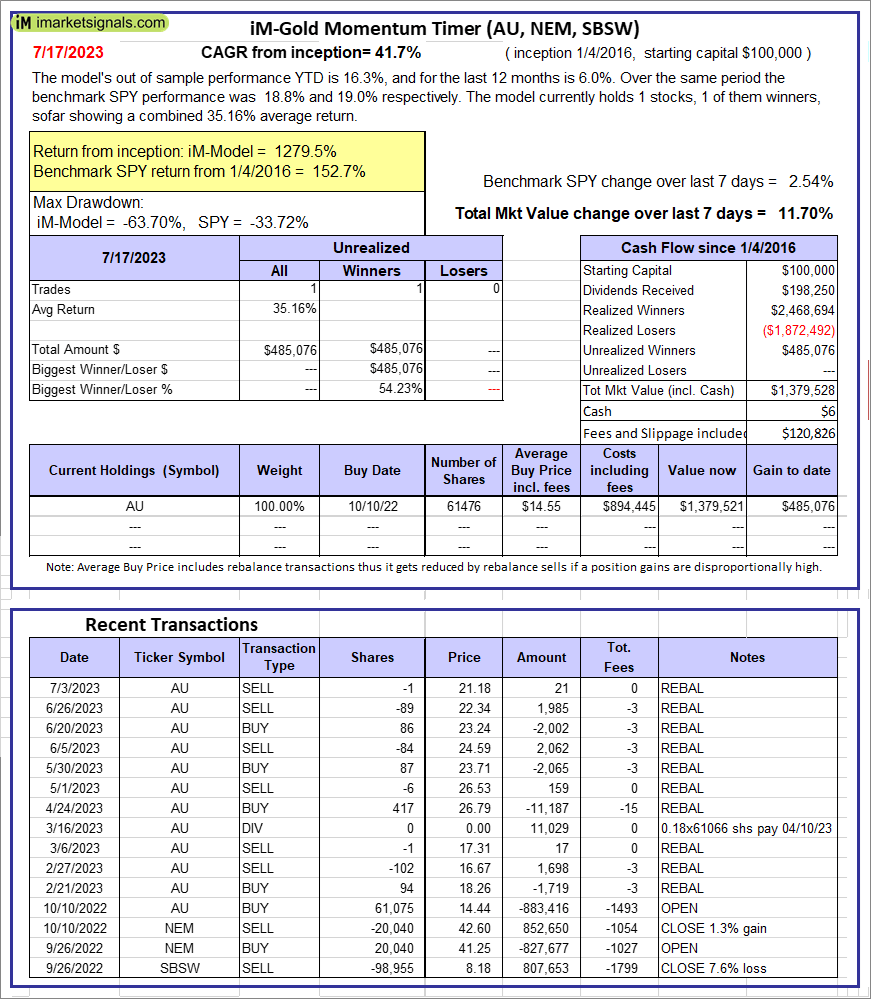 |
iM-Gold Momentum Timer (AU, NEM, SBSW): The model’s out of sample performance YTD is 16.3%, and for the last 12 months is 6.0%. Over the same period the benchmark SPY performance was 18.8% and 19.0% respectively. Over the previous week the market value of iM-Gold Momentum Timer (AU, NEM, SBSW) gained 11.70% at a time when SPY gained 2.54%. A starting capital of $100,000 at inception on 6/30/2016 would have grown to $06 which includes $120,826 cash and excludes Gain to date spent on fees and slippage. |
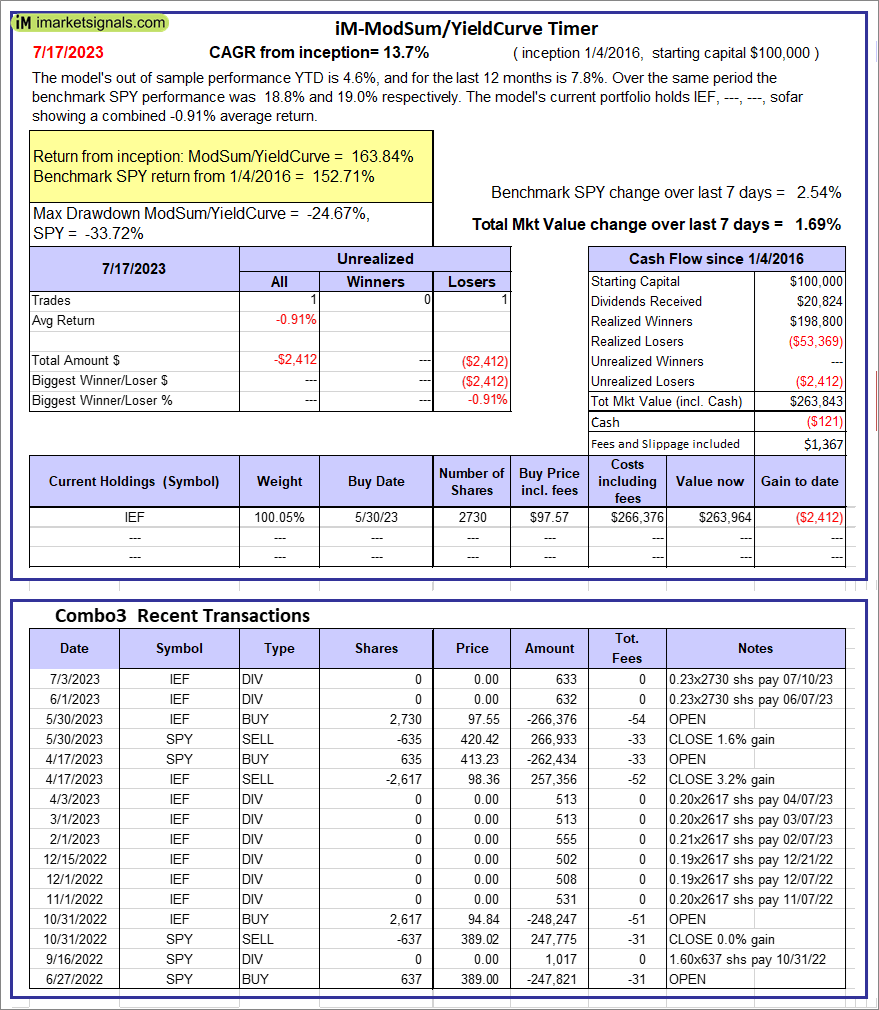 |
iM-ModSum/YieldCurve Timer: The model’s out of sample performance YTD is 4.6%, and for the last 12 months is 7.8%. Over the same period the benchmark SPY performance was 18.8% and 19.0% respectively. Over the previous week the market value of iM-PortSum/YieldCurve Timer gained 1.69% at a time when SPY gained 2.54%. A starting capital of $100,000 at inception on 1/1/2016 would have grown to $263,843 which includes -$121 cash and excludes $1,367 spent on fees and slippage. |
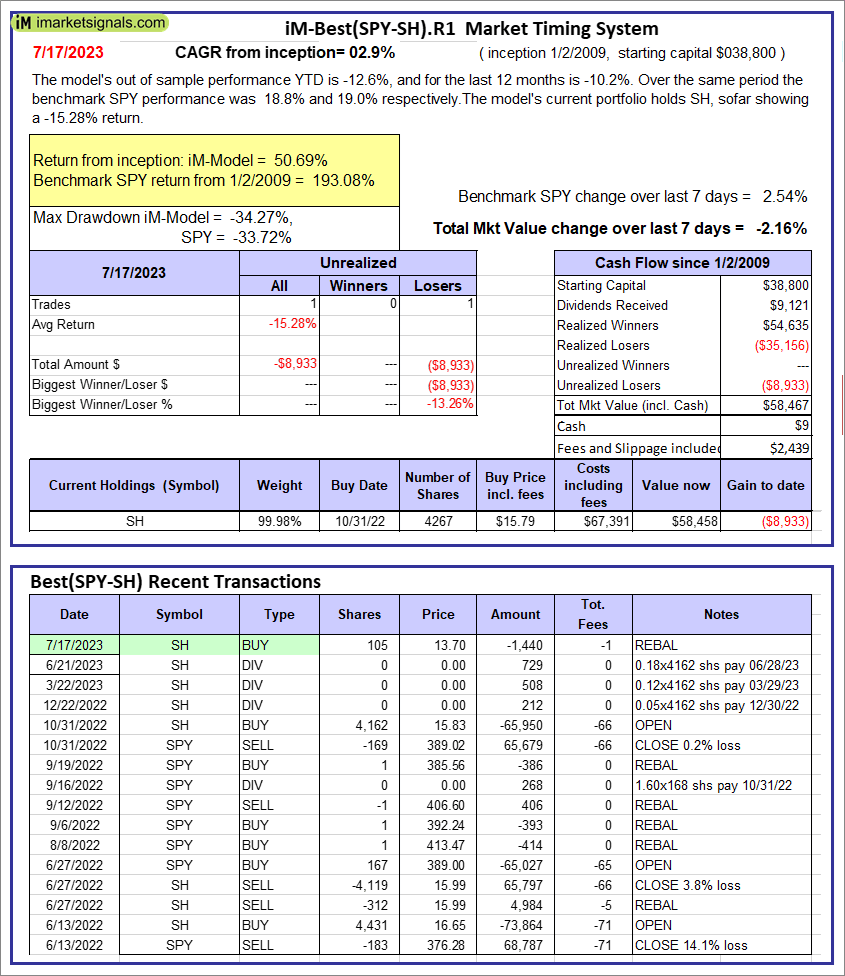 |
iM-Best(SPY-SH).R1: The model’s out of sample performance YTD is -12.6%, and for the last 12 months is -10.2%. Over the same period the benchmark SPY performance was 18.8% and 19.0% respectively. Over the previous week the market value of Best(SPY-SH) gained -2.16% at a time when SPY gained 2.54%. A starting capital of $100,000 at inception on 1/2/2009 would have grown to $58,467 which includes $9 cash and excludes $2,439 spent on fees and slippage. |
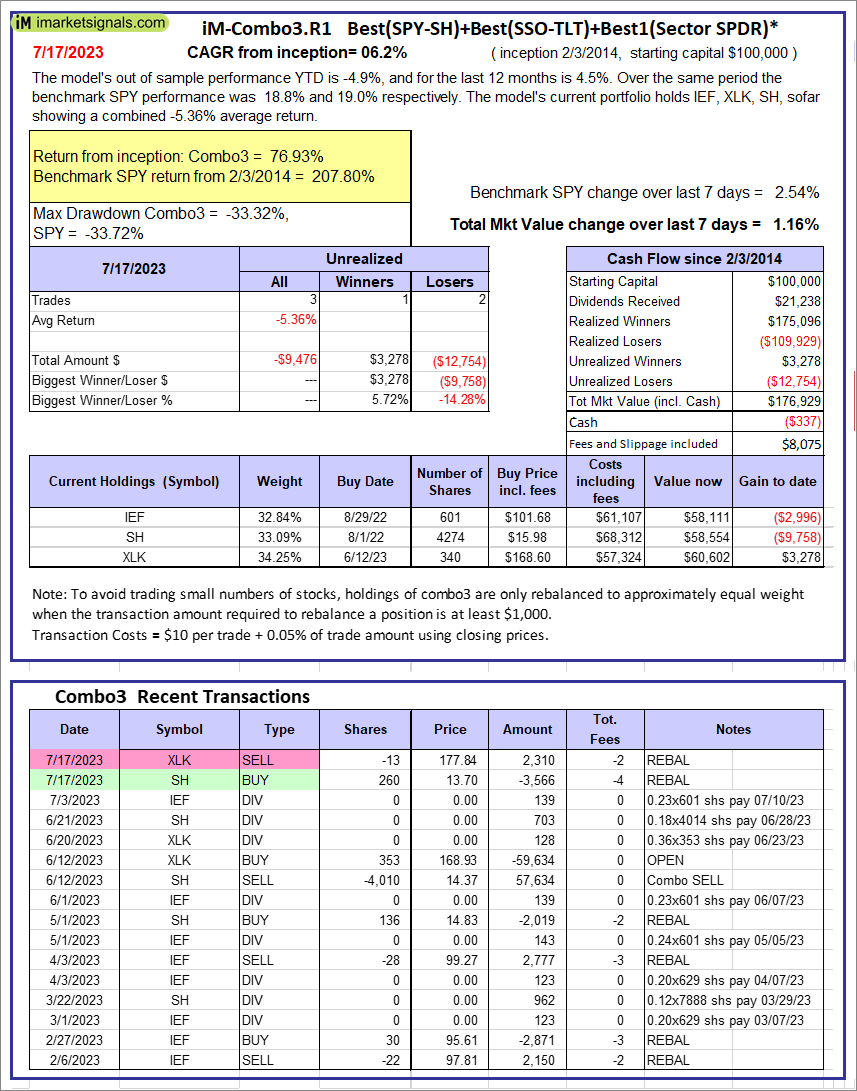 |
iM-Combo3.R1: The model’s out of sample performance YTD is -4.9%, and for the last 12 months is 4.5%. Over the same period the benchmark SPY performance was 18.8% and 19.0% respectively. Over the previous week the market value of iM-Combo3.R1 gained 1.16% at a time when SPY gained 2.54%. A starting capital of $100,000 at inception on 2/3/2014 would have grown to $176,929 which includes -$337 cash and excludes $8,075 spent on fees and slippage. |
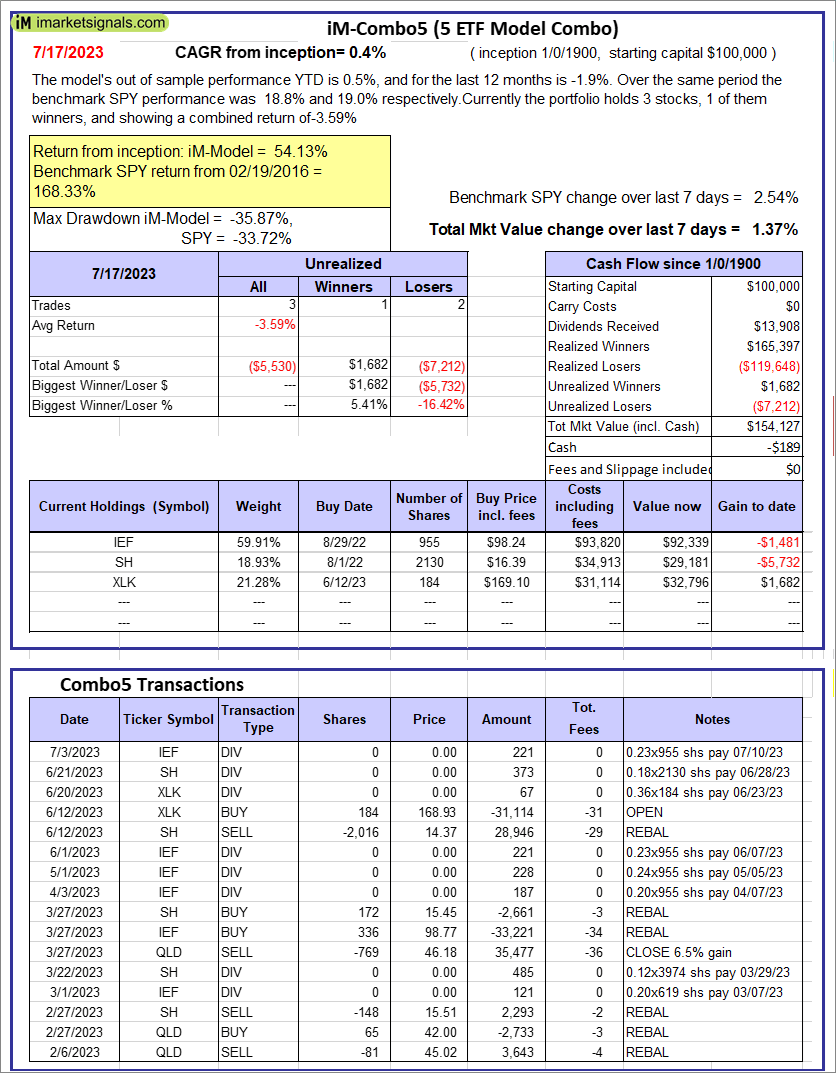 |
iM-Combo5: The model’s out of sample performance YTD is 0.5%, and for the last 12 months is -1.9%. Over the same period the benchmark SPY performance was 18.8% and 19.0% respectively. Over the previous week the market value of iM-Combo5 gained 1.37% at a time when SPY gained 2.54%. A starting capital of $100,000 at inception on 2/22/2016 would have grown to $154,127 which includes -$189 cash and excludes $0 spent on fees and slippage. |
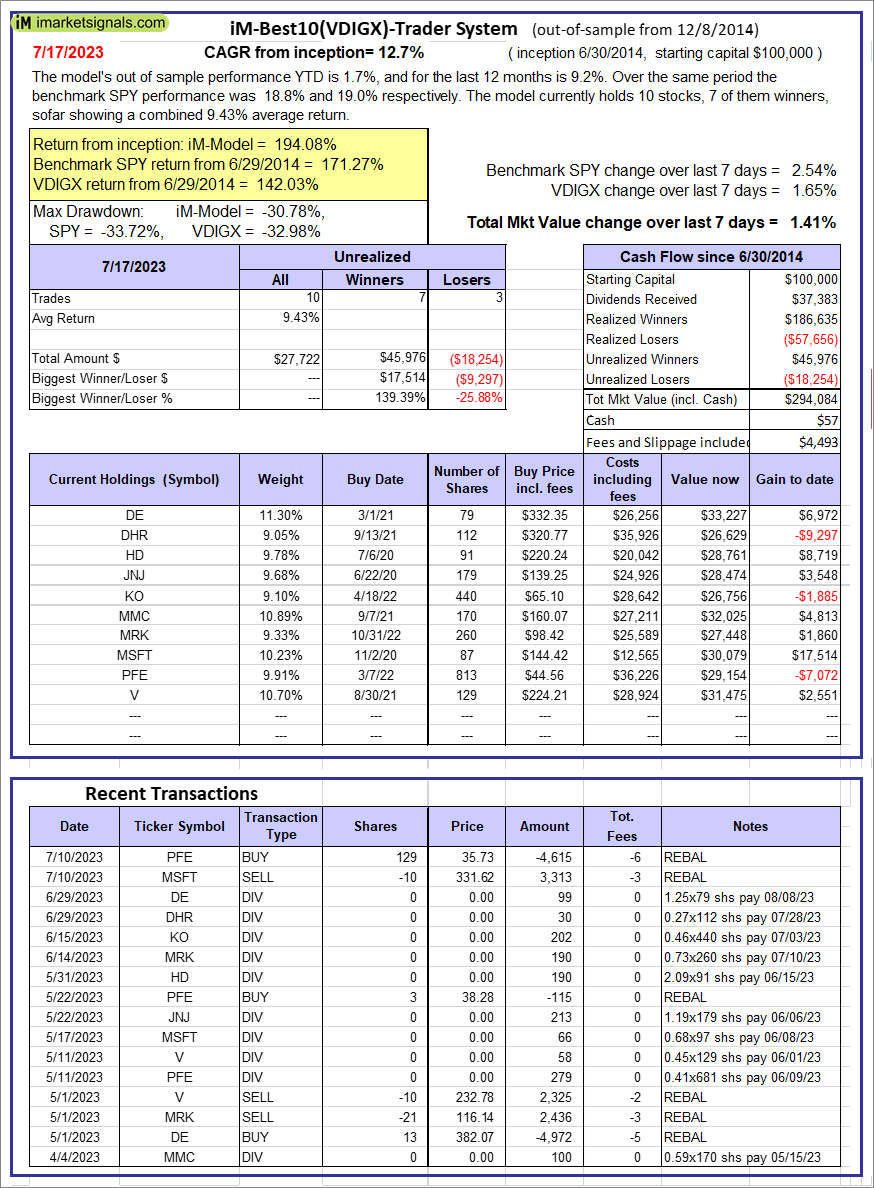 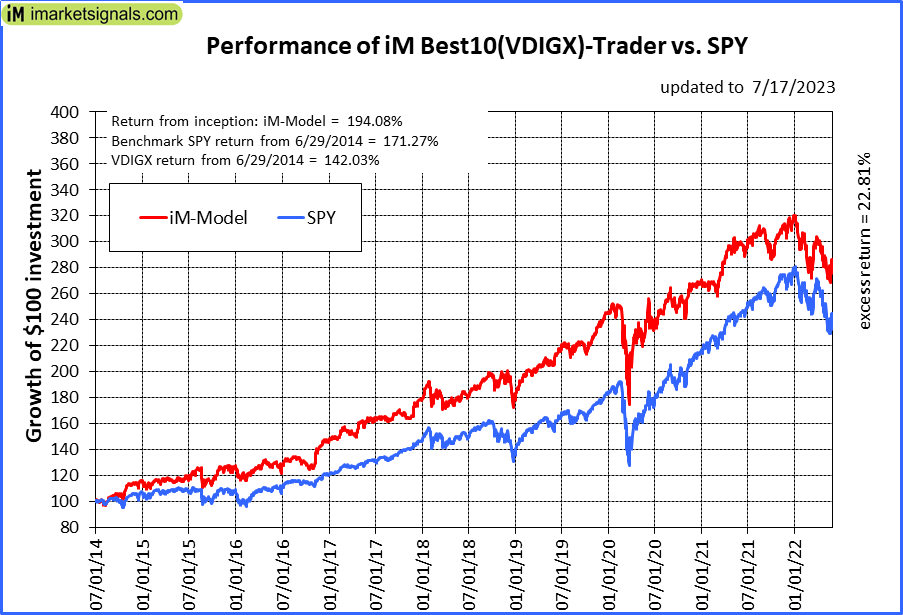 |
iM-Best10(VDIGX)-Trader: The model’s out of sample performance YTD is 1.7%, and for the last 12 months is 9.2%. Over the same period the benchmark SPY performance was 18.8% and 19.0% respectively. Since inception, on 7/1/2014, the model gained 194.08% while the benchmark SPY gained 171.27% and VDIGX gained 142.03% over the same period. Over the previous week the market value of iM-Best10(VDIGX) gained 1.41% at a time when SPY gained 2.54%. A starting capital of $100,000 at inception on 7/1/2014 would have grown to $294,084 which includes $57 cash and excludes $4,493 spent on fees and slippage. |
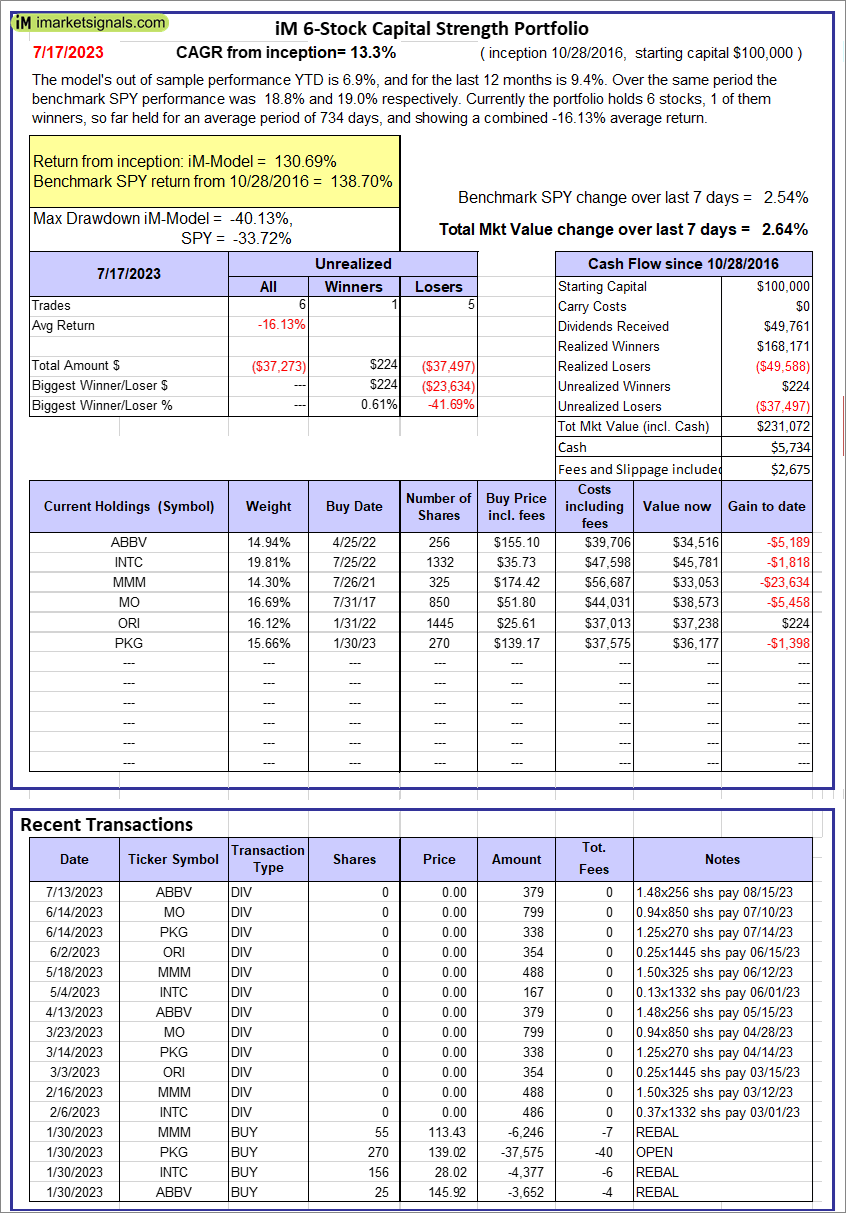 |
iM 6-Stock Capital Strength Portfolio: The model’s out of sample performance YTD is 6.9%, and for the last 12 months is 9.4%. Over the same period the benchmark SPY performance was 18.8% and 19.0% respectively. Over the previous week the market value of the iM 6-Stock Capital Strength Portfolio gained 2.64% at a time when SPY gained 2.54%. A starting capital of $100,000 at inception on 10/28/2016 would have grown to $231,072 which includes $5,734 cash and excludes $2,675 spent on fees and slippage. |
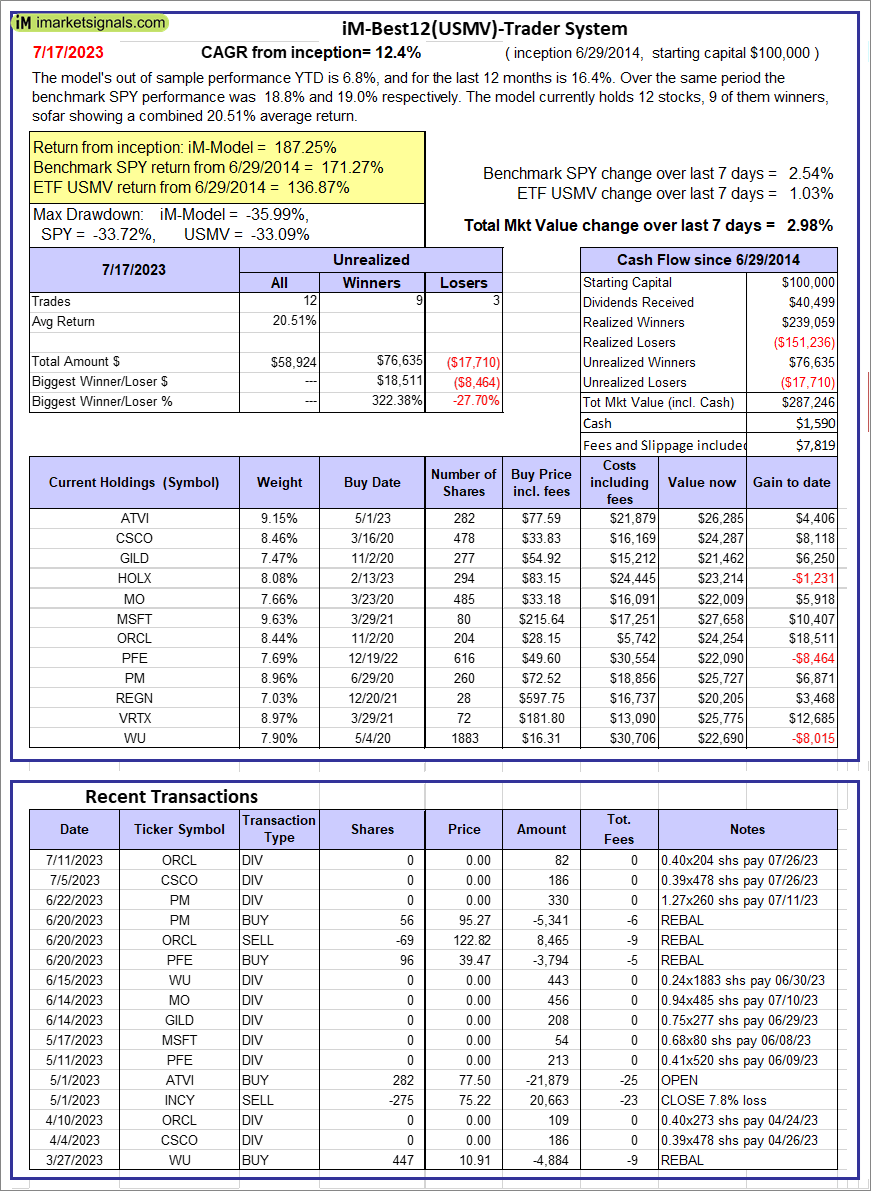 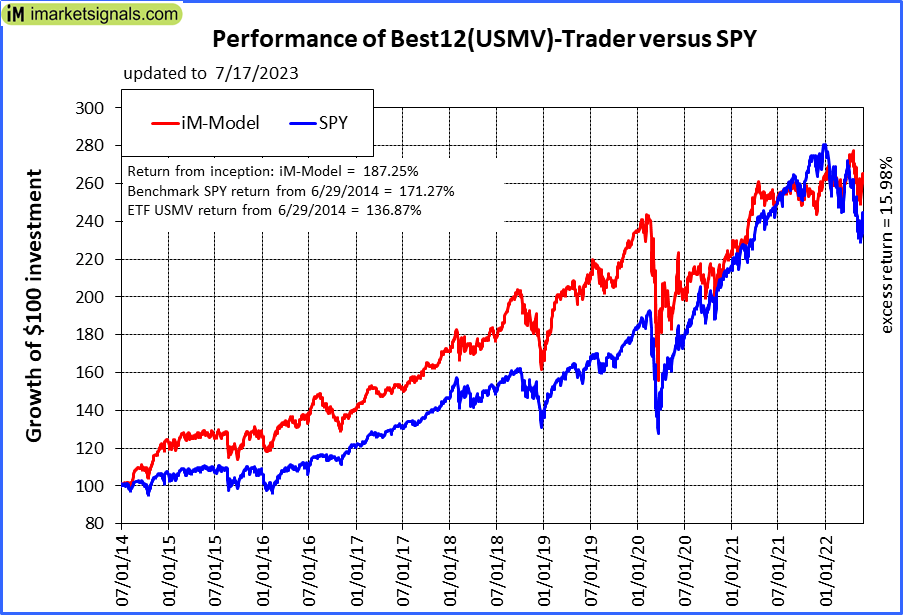 |
iM-Best12(USMV)-Trader: The model’s out of sample performance YTD is 6.8%, and for the last 12 months is 16.4%. Over the same period the benchmark SPY performance was 18.8% and 19.0% respectively. Since inception, on 6/30/2014, the model gained 187.25% while the benchmark SPY gained 171.27% and the ETF USMV gained 136.87% over the same period. Over the previous week the market value of iM-Best12(USMV)-Trader gained 2.98% at a time when SPY gained 2.54%. A starting capital of $100,000 at inception on 6/30/2014 would have grown to $287,246 which includes $1,590 cash and excludes $7,819 spent on fees and slippage. |
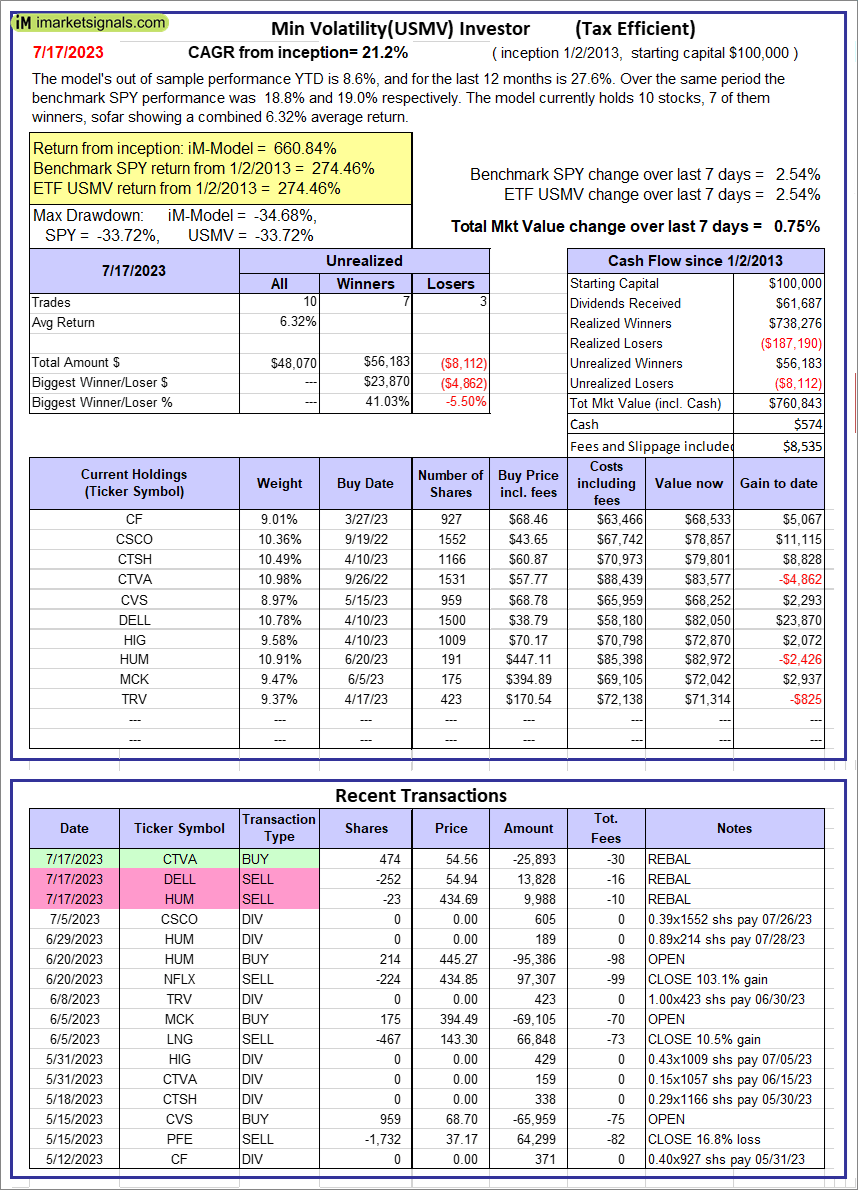 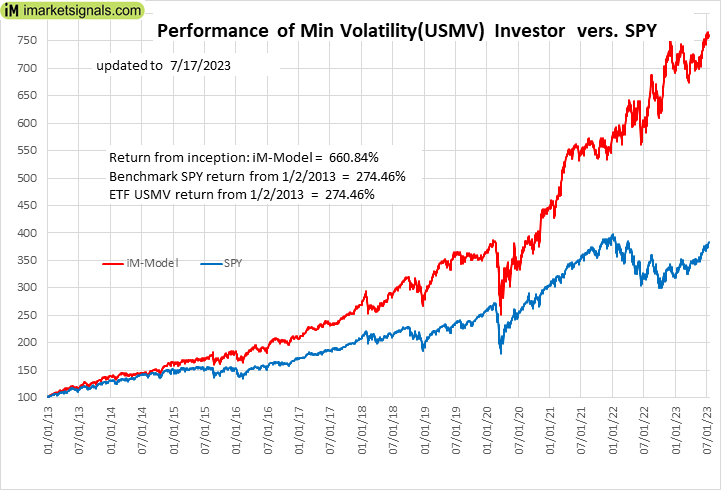 |
iM-Min Volatility(USMV) Investor (Tax Efficient): The model’s out of sample performance YTD is 8.6%, and for the last 12 months is 27.6%. Over the same period the benchmark SPY performance was 18.8% and 19.0% respectively. Since inception, on 1/3/2013, the model gained 660.84% while the benchmark SPY gained 274.46% and the ETF USMV gained 274.46% over the same period. Over the previous week the market value of iM-Best12(USMV)Q1 gained 0.75% at a time when SPY gained 2.54%. A starting capital of $100,000 at inception on 1/3/2013 would have grown to $760,843 which includes $574 cash and excludes $8,535 spent on fees and slippage. |
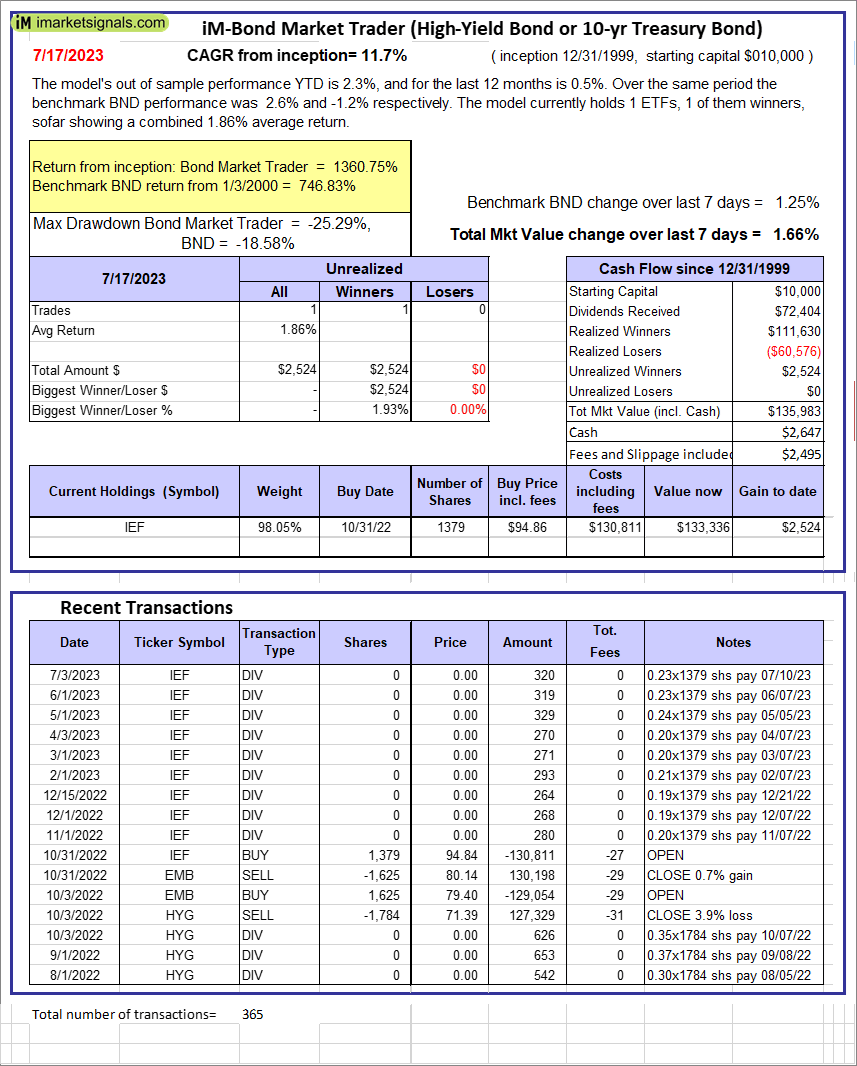 |
iM-Bond Market Trader (High-Yield Bond or 10-yr Treasury Bond): The model’s out of sample performance YTD is 2.3%, and for the last 12 months is 0.5%. Over the same period the benchmark BND performance was 2.6% and -1.2% respectively. Over the previous week the market value of the iM-Bond Market Trader (High-Yield Bond or 10-yr Treasury Bond) gained 1.66% at a time when BND gained 1.25%. A starting capital of $10,000 at inception on 1/3/2000 would have grown to $135,983 which includes $2,647 cash and excludes $2,495 spent on fees and slippage. |
|
|
iM-ModSum/YieldCurve Timer: The model’s out of sample performance YTD is 4.6%, and for the last 12 months is 7.8%. Over the same period the benchmark SPY performance was 18.8% and 19.0% respectively. Over the previous week the market value of iM-PortSum/YieldCurve Timer gained 1.69% at a time when SPY gained 2.54%. A starting capital of $100,000 at inception on 1/1/2016 would have grown to $263,843 which includes -$121 cash and excludes $1,367 spent on fees and slippage. |
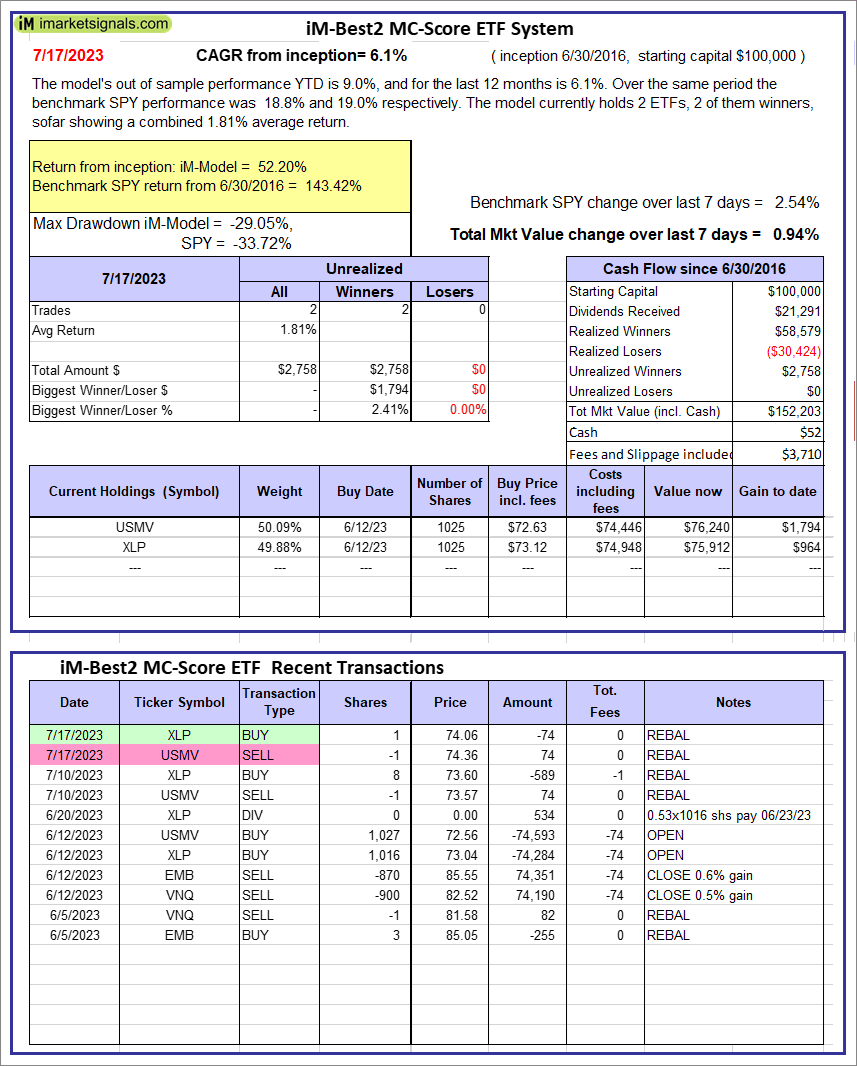 |
iM-Best2 MC-Score ETF System: The model’s out of sample performance YTD is 9.0%, and for the last 12 months is 6.1%. Over the same period the benchmark SPY performance was 18.8% and 19.0% respectively. Over the previous week the market value of the iM-Best2 MC-Score ETF System gained 0.94% at a time when SPY gained 2.54%. A starting capital of $100,000 at inception on 6/30/2016 would have grown to $152,203 which includes $52 cash and excludes $3,710 spent on fees and slippage. |
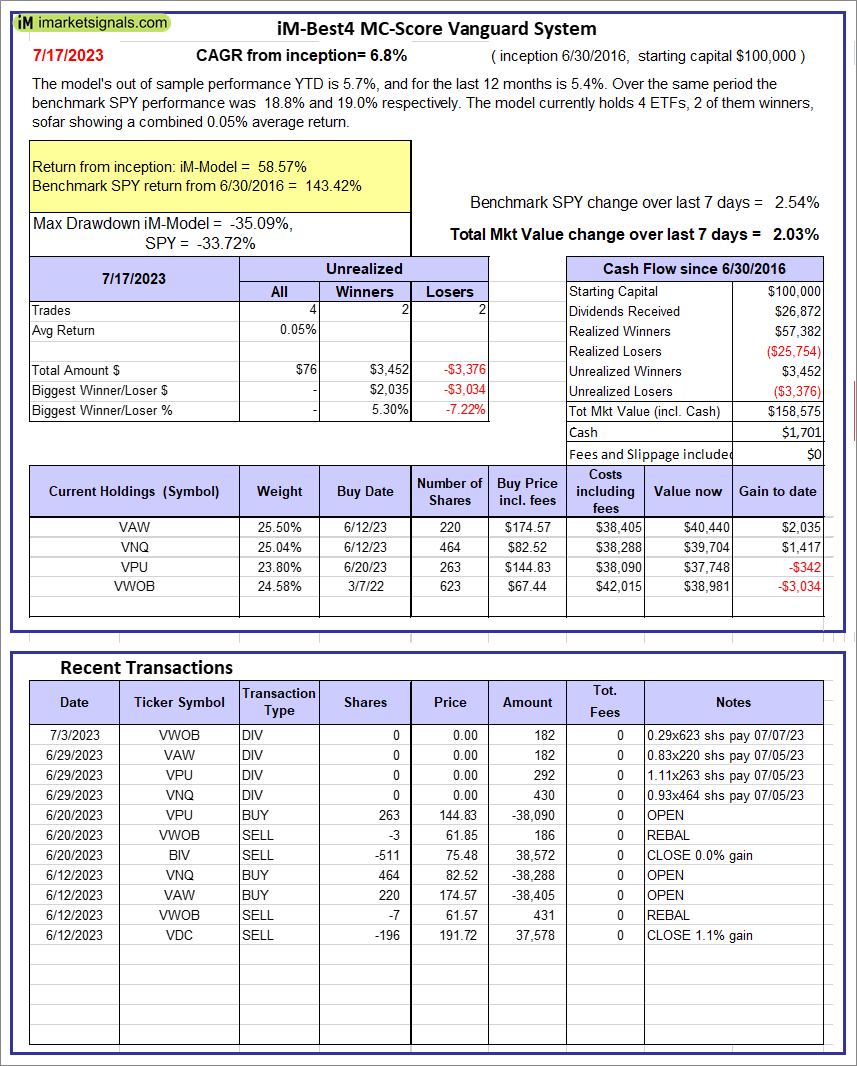 |
iM-Best4 MC-Score Vanguard System: The model’s out of sample performance YTD is 5.7%, and for the last 12 months is 5.4%. Over the same period the benchmark SPY performance was 18.8% and 19.0% respectively. Over the previous week the market value of the iM-Best4 MC-Score Vanguard System gained 2.03% at a time when SPY gained 2.54%. A starting capital of $100,000 at inception on 6/30/2016 would have grown to $158,575 which includes $1,701 cash and excludes $00 spent on fees and slippage. |
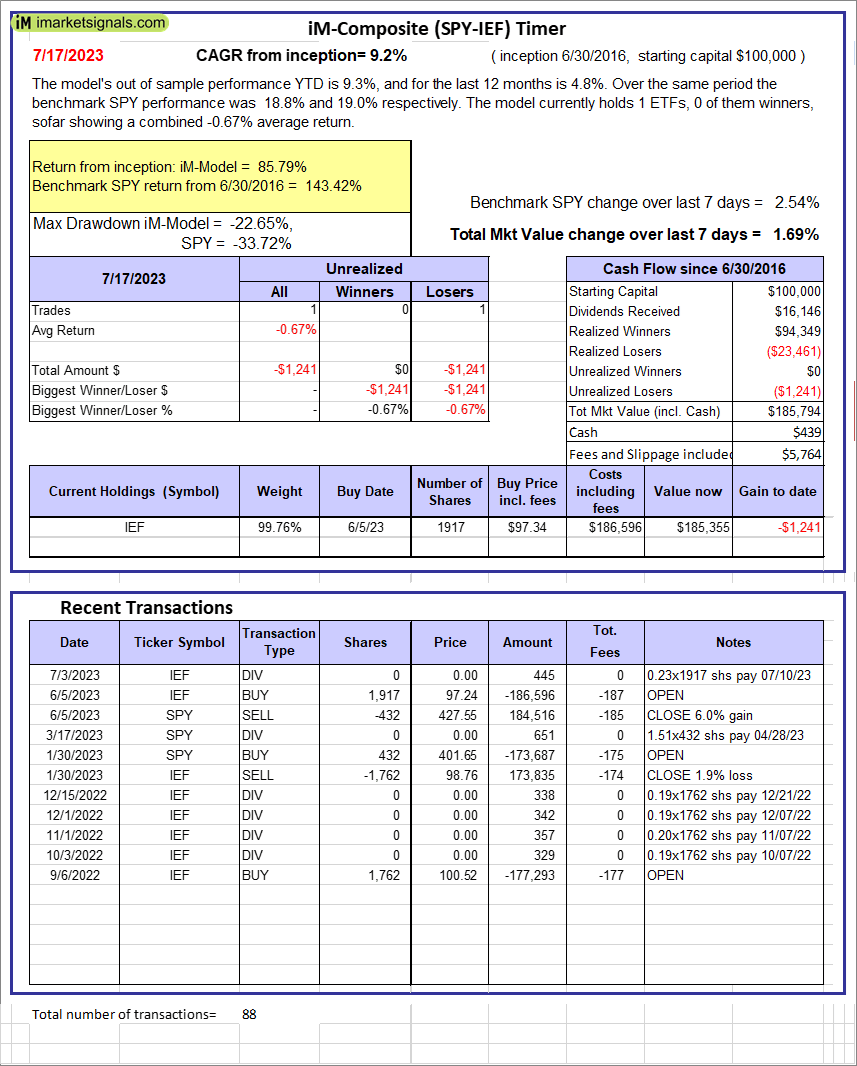 |
iM-Composite (SPY-IEF) Timer: The model’s out of sample performance YTD is 9.3%, and for the last 12 months is 4.8%. Over the same period the benchmark SPY performance was 18.8% and 19.0% respectively. Over the previous week the market value of the iM-Composite (SPY-IEF) Timer gained 1.69% at a time when SPY gained 2.54%. A starting capital of $100,000 at inception on 6/30/2016 would have grown to $185,794 which includes $439 cash and excludes $5,764 spent on fees and slippage. |
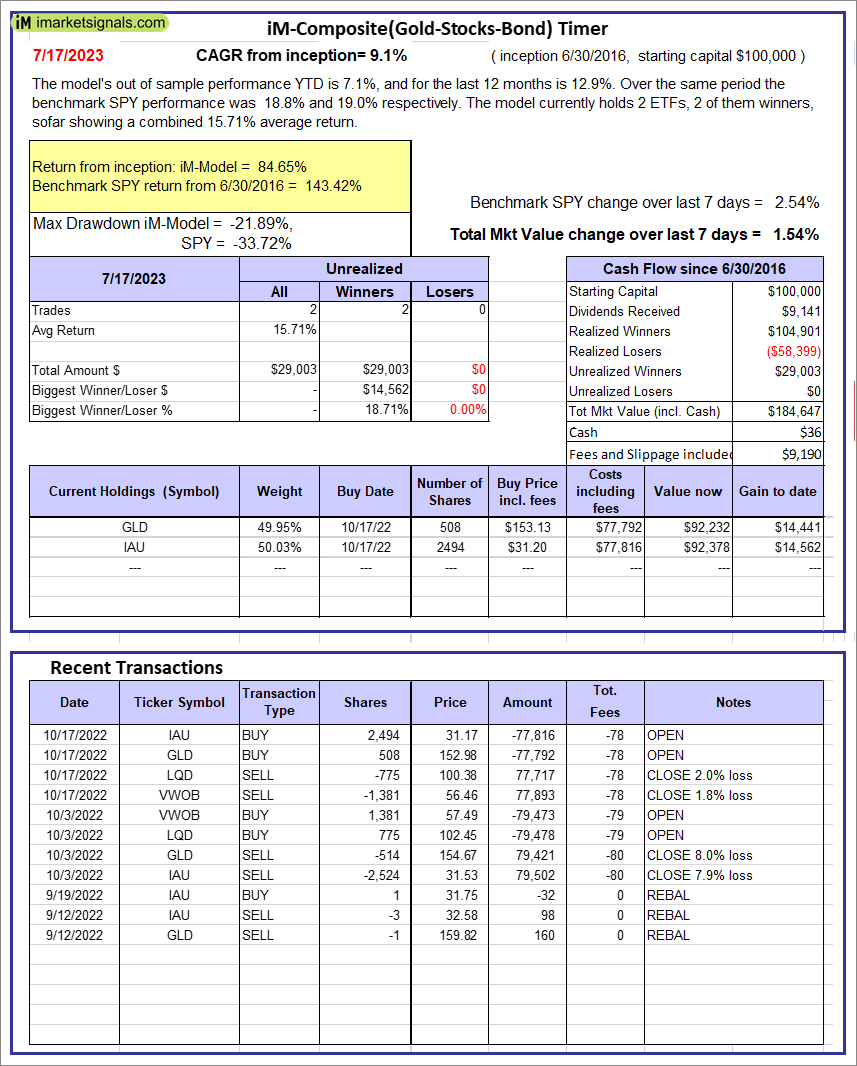 |
iM-Composite(Gold-Stocks-Bond) Timer: The model’s out of sample performance YTD is 7.1%, and for the last 12 months is 12.9%. Over the same period the benchmark SPY performance was 18.8% and 19.0% respectively. Over the previous week the market value of the iM-Composite(Gold-Stocks-Bond) Timer gained 1.54% at a time when SPY gained 2.54%. A starting capital of $100,000 at inception on 6/30/2016 would have grown to $184,647 which includes $36 cash and excludes $9,190 spent on fees and slippage. |
iM-Best Reports – 7/17/2023
Posted in pmp SPY-SH
Leave a Reply
You must be logged in to post a comment.