
  |
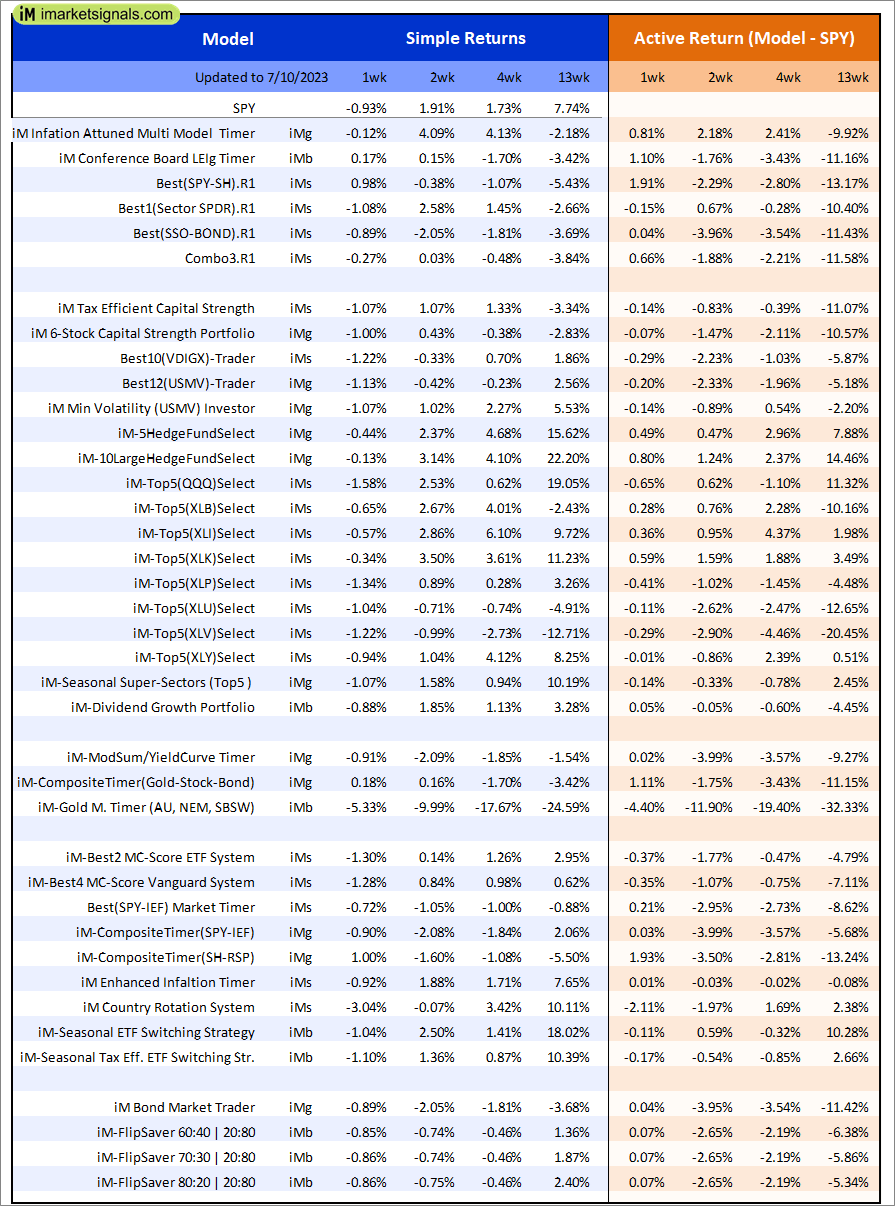
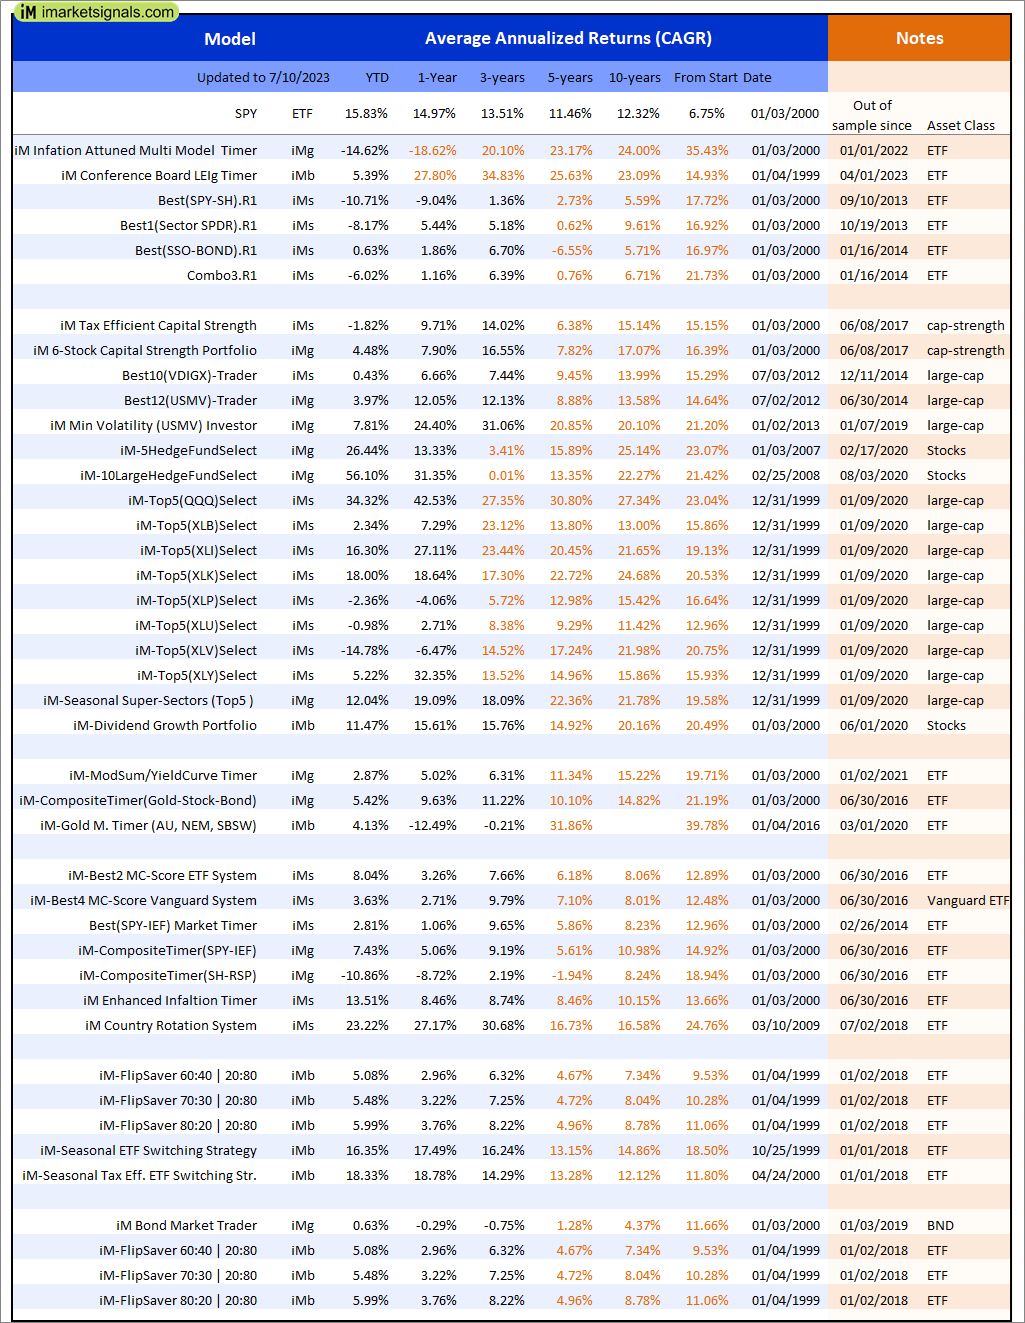
Out of sample performance summary of our models for the past 1, 2, 4 and 13 week periods. The active active return indicates how the models over- or underperformed the benchmark ETF SPY. Also the YTD, and the 1-, 3-, 5- and 10-year annualized returns are shown in the second table |
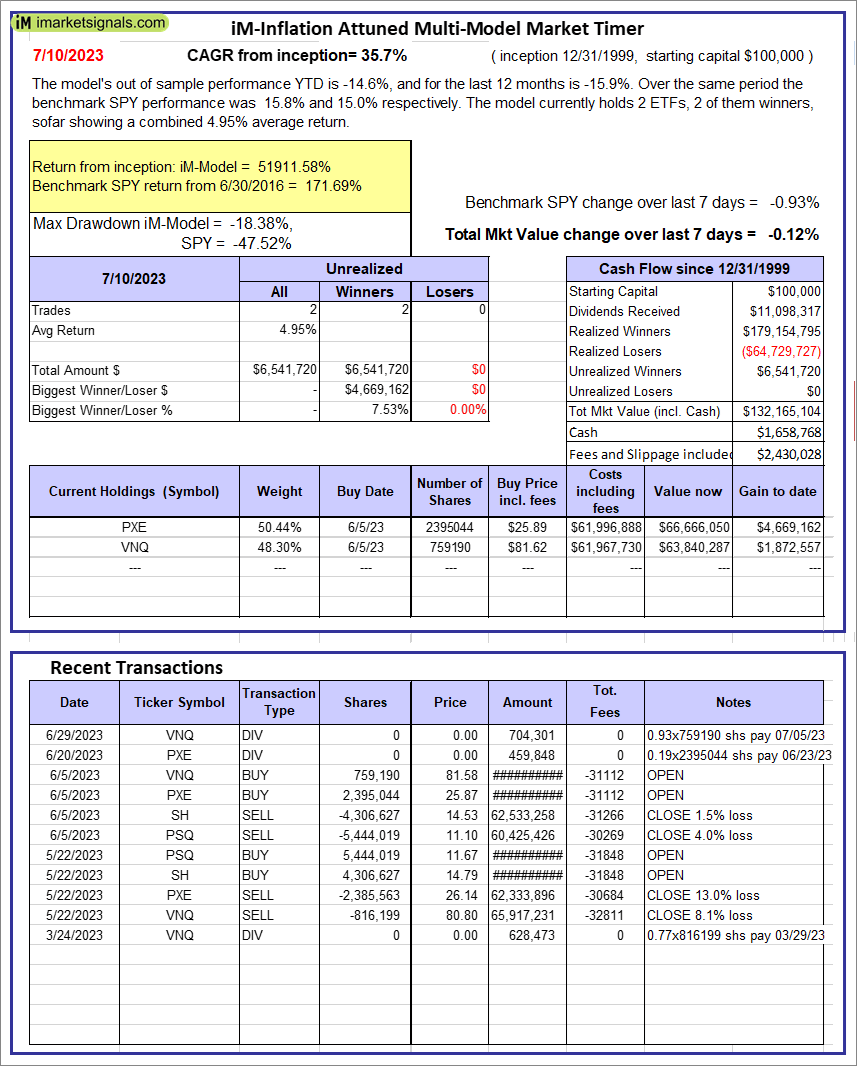 |
iM-Inflation Attuned Multi-Model Market Timer: The model’s out of sample performance YTD is -14.6%, and for the last 12 months is -15.9%. Over the same period the benchmark SPY performance was 15.8% and 15.0% respectively. Over the previous week the market value of the iM-Inflation Attuned Multi-Model Market Timer gained -0.12% at a time when SPY gained -0.93%. A starting capital of $100,000 at inception on 3/24/2017 would have grown to $132,165,104 which includes $1,658,768 cash and excludes $2,430,028 spent on fees and slippage. |
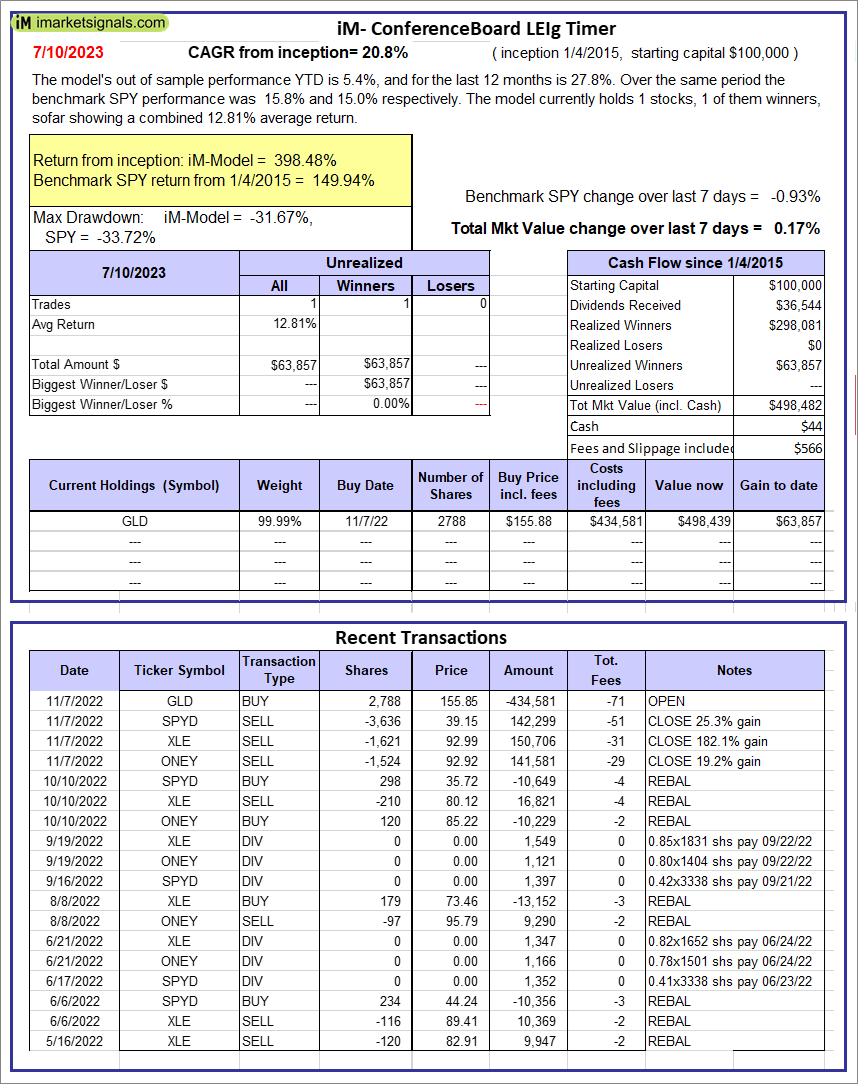 |
iM-Conference Board LEIg Timer: The model’s performance YTD is 14.3%, and for the last 12 months is 7.3%. Over the same period the benchmark SPY performance was 20.1% and 9.4% respectively. Over the previous week the market value of the iM-Conference Board LEIg Timer gained 0.17% at a time when SPY gained -0.93%. A starting capital of $100,000 at inception on 4/5/2017 would have grown to $498,482 which includes $44 cash and excludes $566 spent on fees and slippage. |
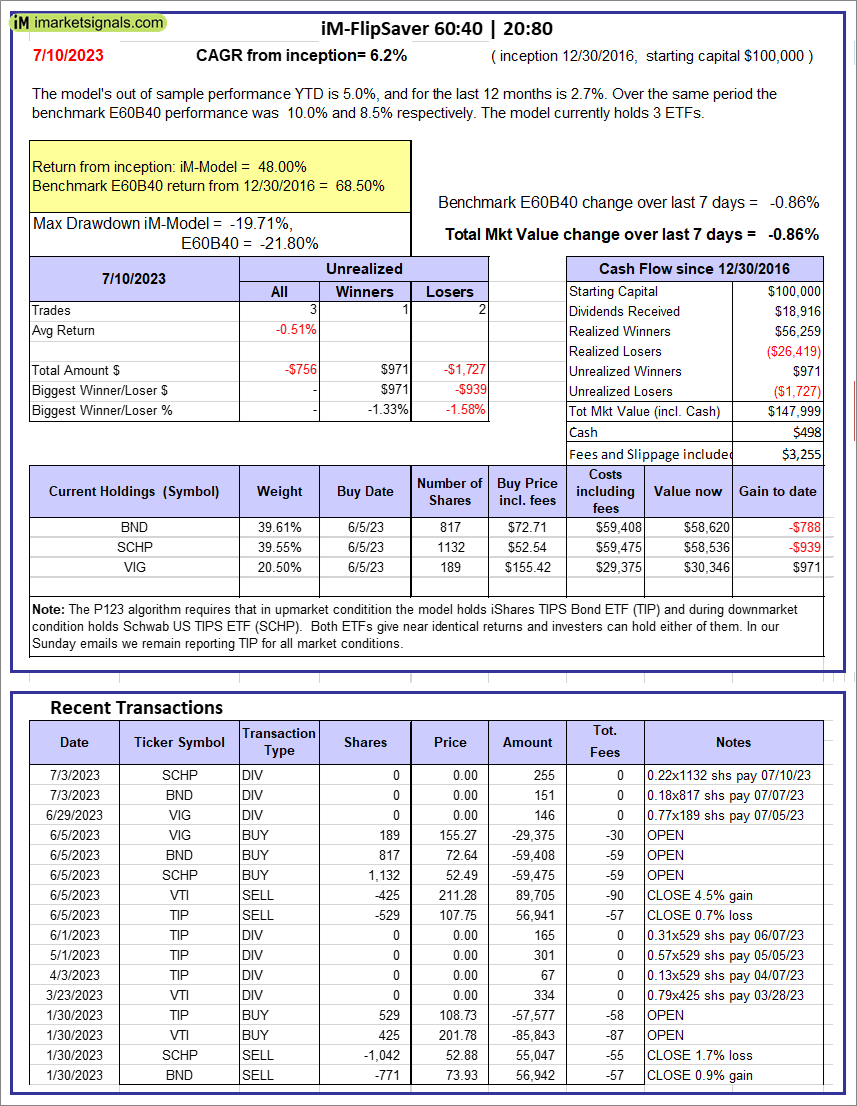 |
iM-FlipSaver 60:40 | 20:80 – 2017: The model’s out of sample performance YTD is 5.0%, and for the last 12 months is 2.7%. Over the same period the benchmark E60B40 performance was 10.0% and 8.5% respectively. Over the previous week the market value of iM-FlipSaver 80:20 | 20:80 gained -0.86% at a time when SPY gained -0.86%. A starting capital of $100,000 at inception on 7/16/2015 would have grown to $147,999 which includes $498 cash and excludes $3,255 spent on fees and slippage. |
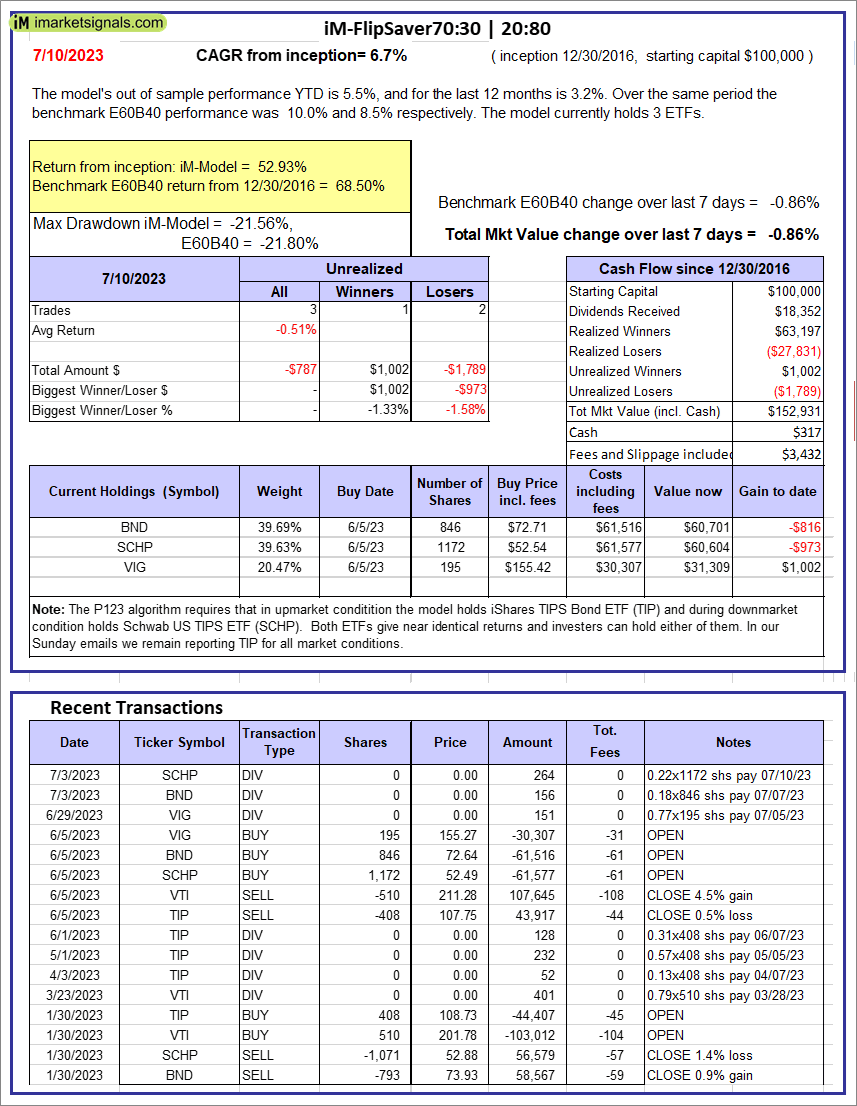 |
iM-FlipSaver 70:30 | 20:80 – 2017: The model’s out of sample performance YTD is 5.5%, and for the last 12 months is 3.2%. Over the same period the benchmark E60B40 performance was 10.0% and 8.5% respectively. Over the previous week the market value of iM-FlipSaver 70:30 | 20:80 gained -0.86% at a time when SPY gained -0.86%. A starting capital of $100,000 at inception on 7/15/2015 would have grown to $152,931 which includes $317 cash and excludes $3,432 spent on fees and slippage. |
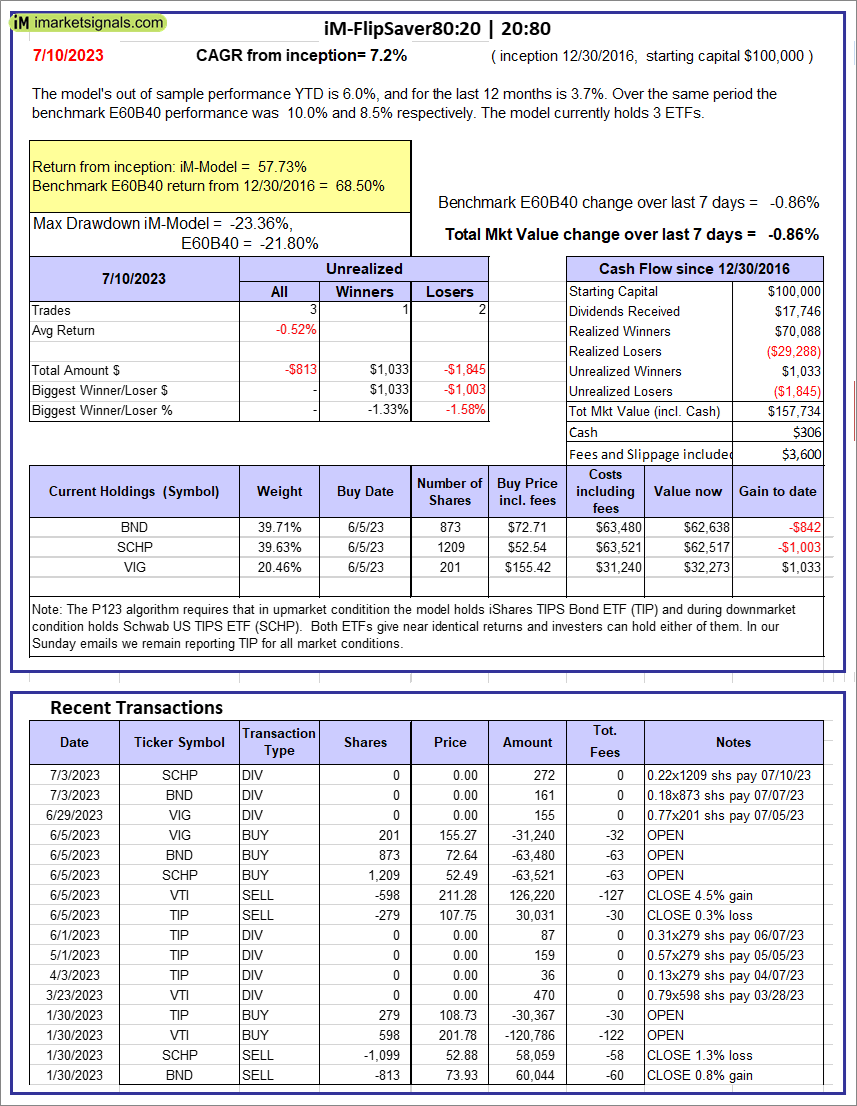 |
iM-FlipSaver 80:20 | 20:80 – 2017: The model’s out of sample performance YTD is 6.0%, and for the last 12 months is 3.7%. Over the same period the benchmark E60B40 performance was 10.0% and 8.5% respectively. Over the previous week the market value of iM-FlipSaver 80:20 | 20:80 gained -0.86% at a time when SPY gained -0.86%. A starting capital of $100,000 at inception on 1/2/2017 would have grown to $157,734 which includes $306 cash and excludes $3,600 spent on fees and slippage. |
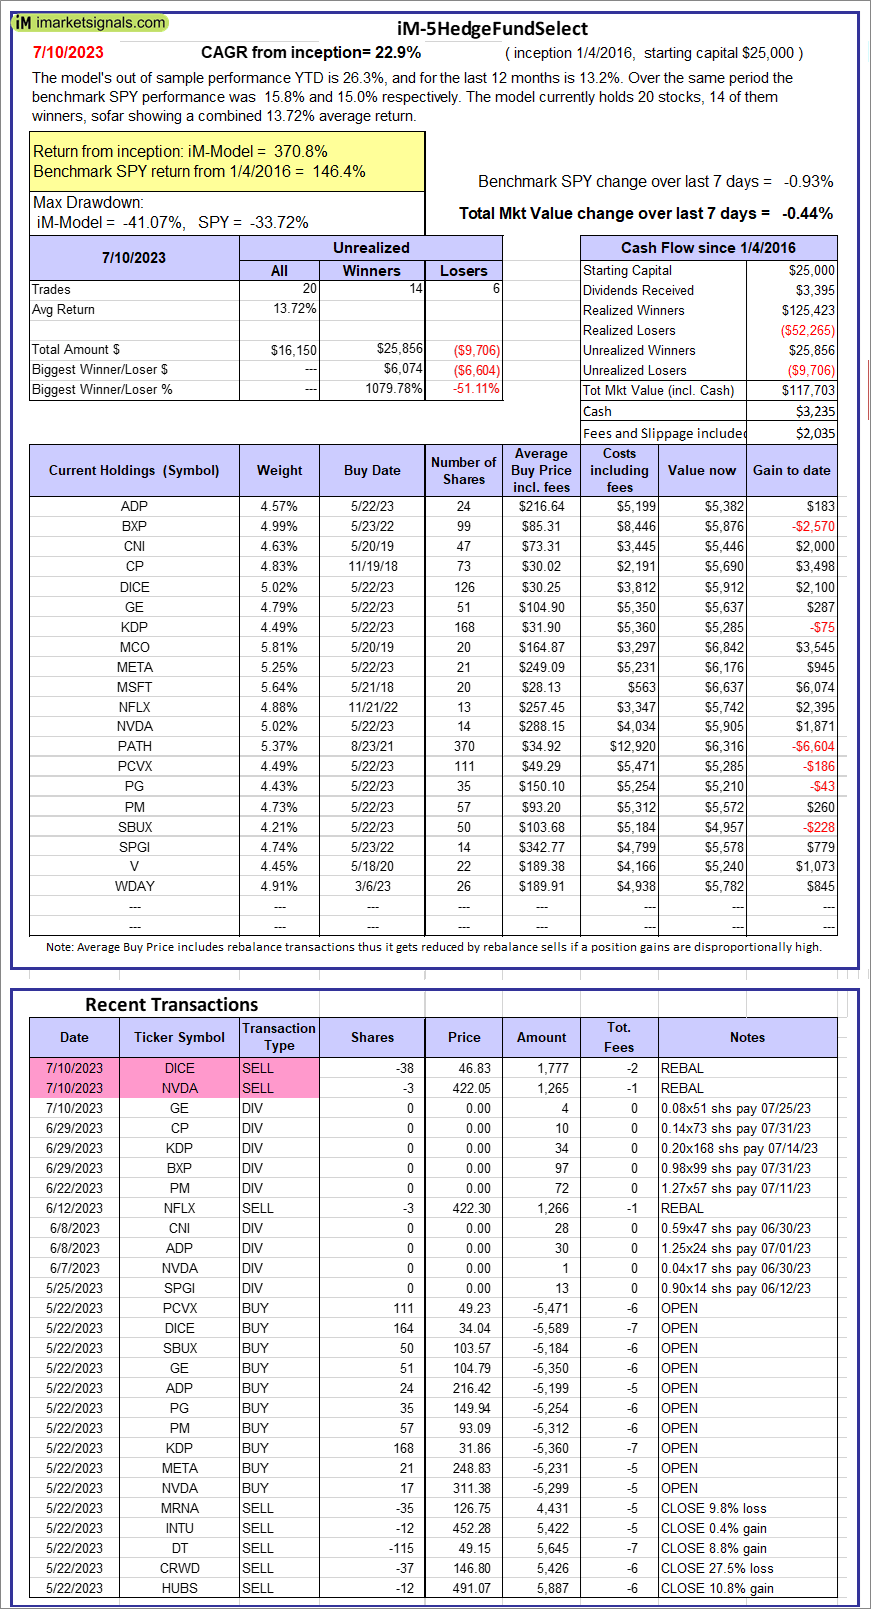 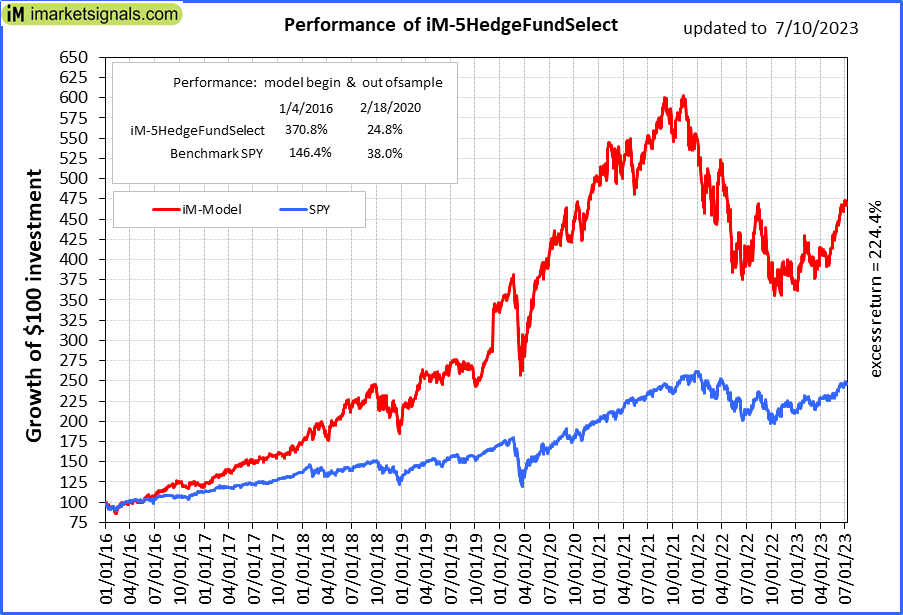 |
iM-5HedgeFundSelect: Since inception, on 1/5/2016, the model gained 370.81% while the benchmark SPY gained 146.44% over the same period. Over the previous week the market value of iM-5HedgeFundSelect gained -0.44% at a time when SPY gained -0.93%. A starting capital of $25,000 at inception on 1/5/2016 would have grown to $117,703 which includes $3,235 cash and excludes $2,035 spent on fees and slippage. |
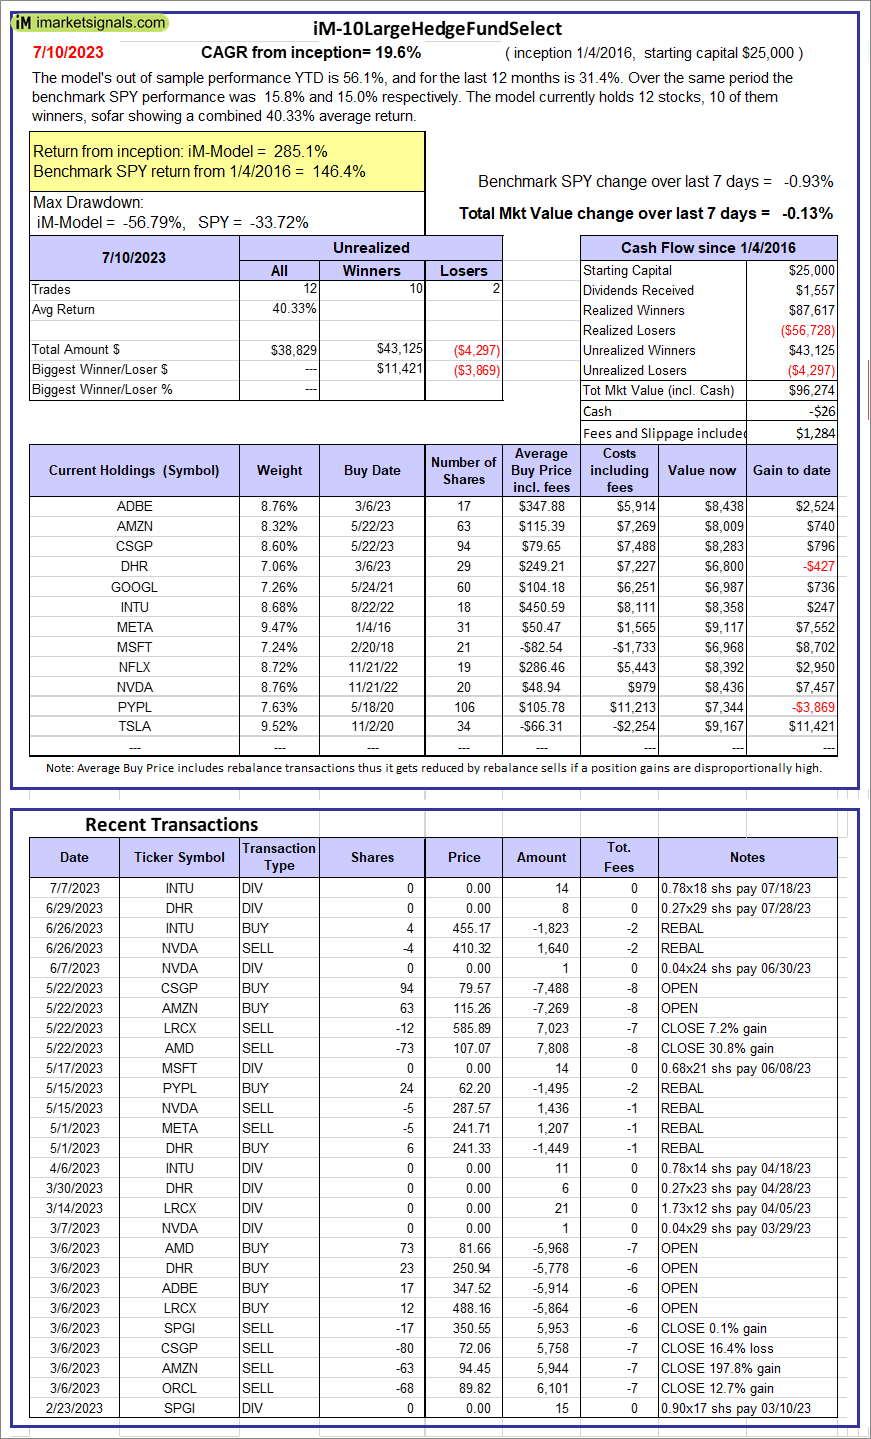 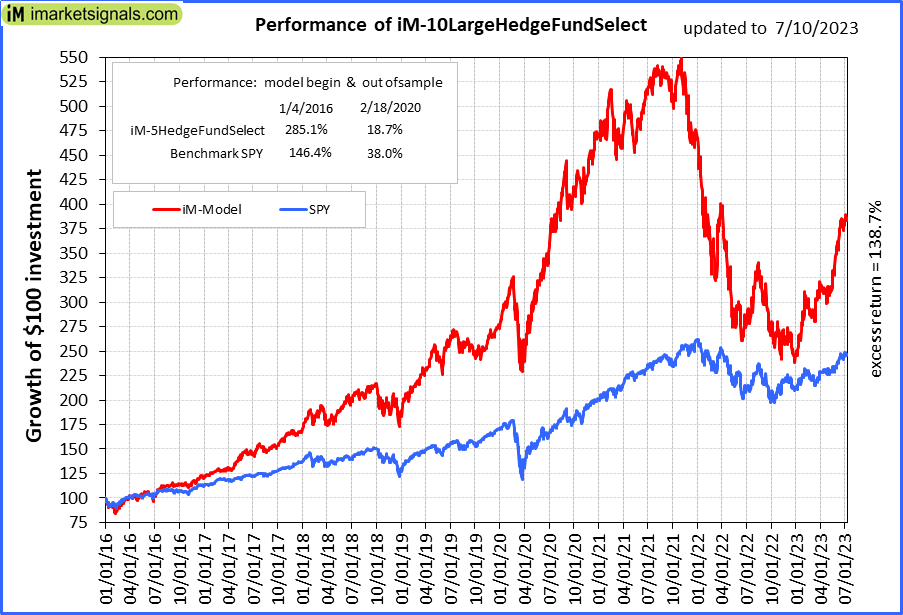 |
iM-10LargeHedgeFundSelect: Since inception, on 1/5/2016, the model gained 285.09% while the benchmark SPY gained 146.44% over the same period. Over the previous week the market value of iM-10LargeHedgeFundSelect gained -0.13% at a time when SPY gained -0.93%. A starting capital of $25,000 at inception on 1/5/2016 would have grown to $96,274 which includes -$26 cash and excludes $1,284 spent on fees and slippage. |
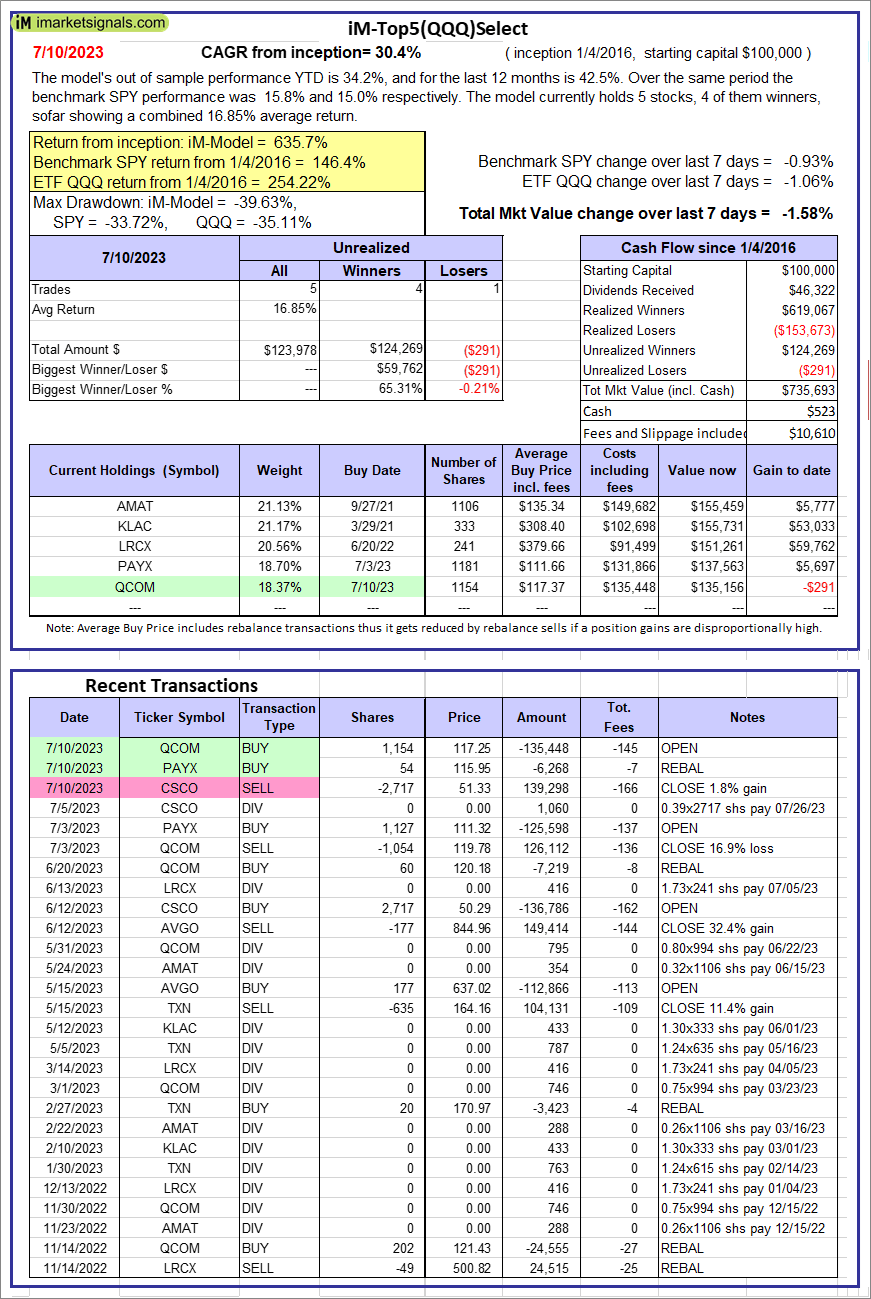 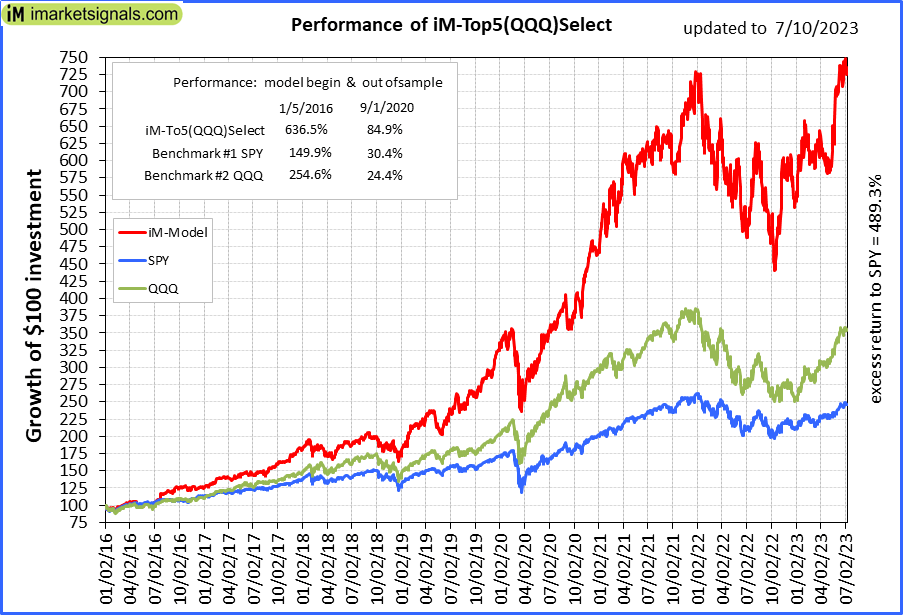 |
iM-Top5(QQQ)Select: Since inception, on 1/5/2016, the model gained 635.69% while the benchmark SPY gained 146.44% over the same period. Over the previous week the market value of iM-Top5(QQQ)Select gained -1.58% at a time when SPY gained -0.93%. A starting capital of $100,000 at inception on 1/5/2016 would have grown to $735,693 which includes $523 cash and excludes $10,610 spent on fees and slippage. |
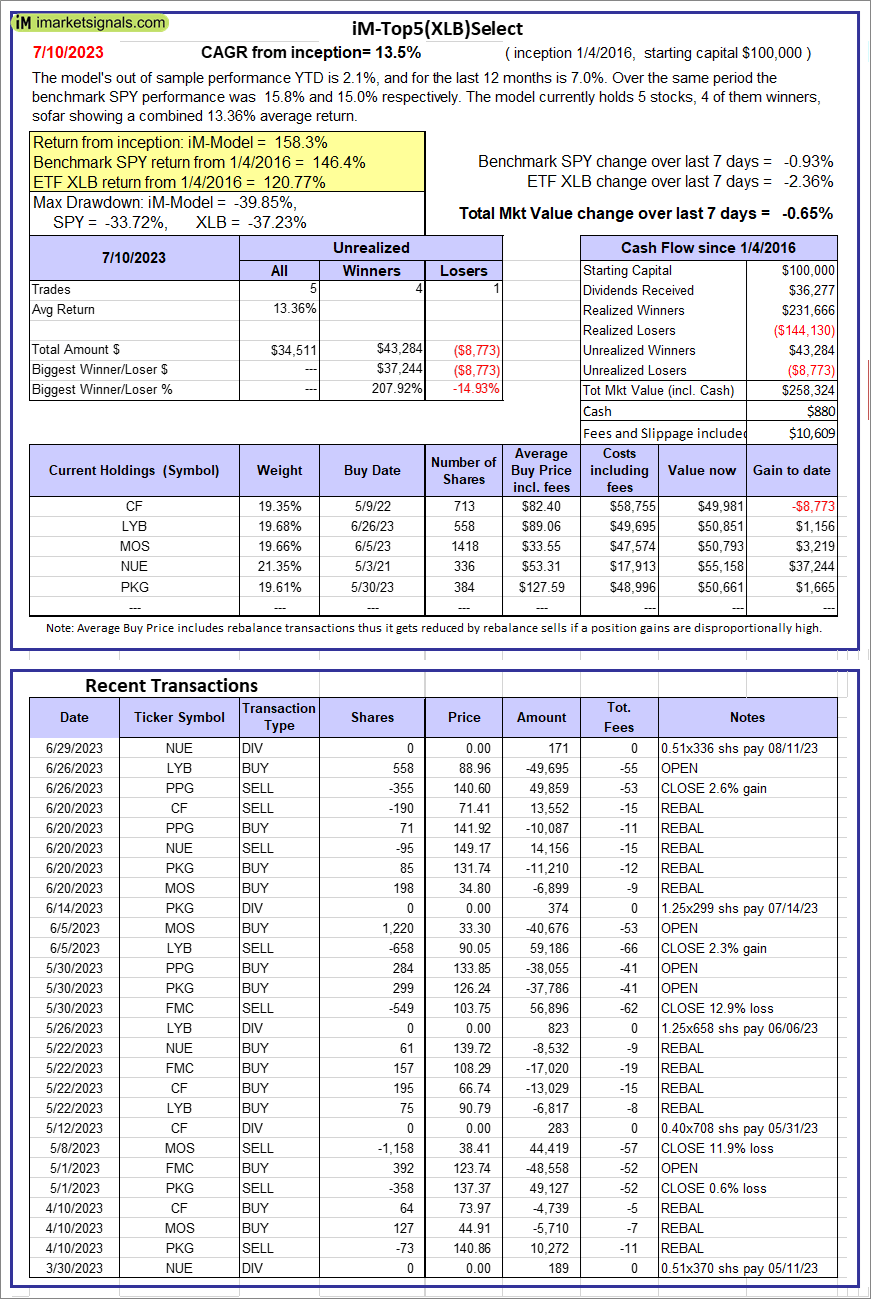 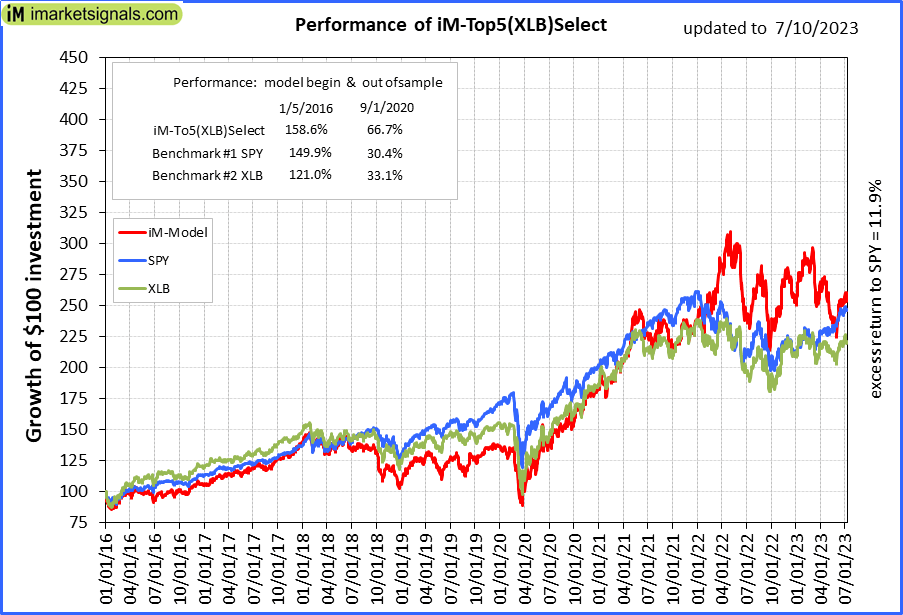 |
iM-Top5(XLB)Select: Since inception, on 1/5/2016, the model gained 158.32% while the benchmark SPY gained 146.44% over the same period. Over the previous week the market value of iM-Top5(XLB)Select gained -0.65% at a time when SPY gained -0.93%. A starting capital of $100,000 at inception on 1/5/2016 would have grown to $258,324 which includes $880 cash and excludes $10,609 spent on fees and slippage. |
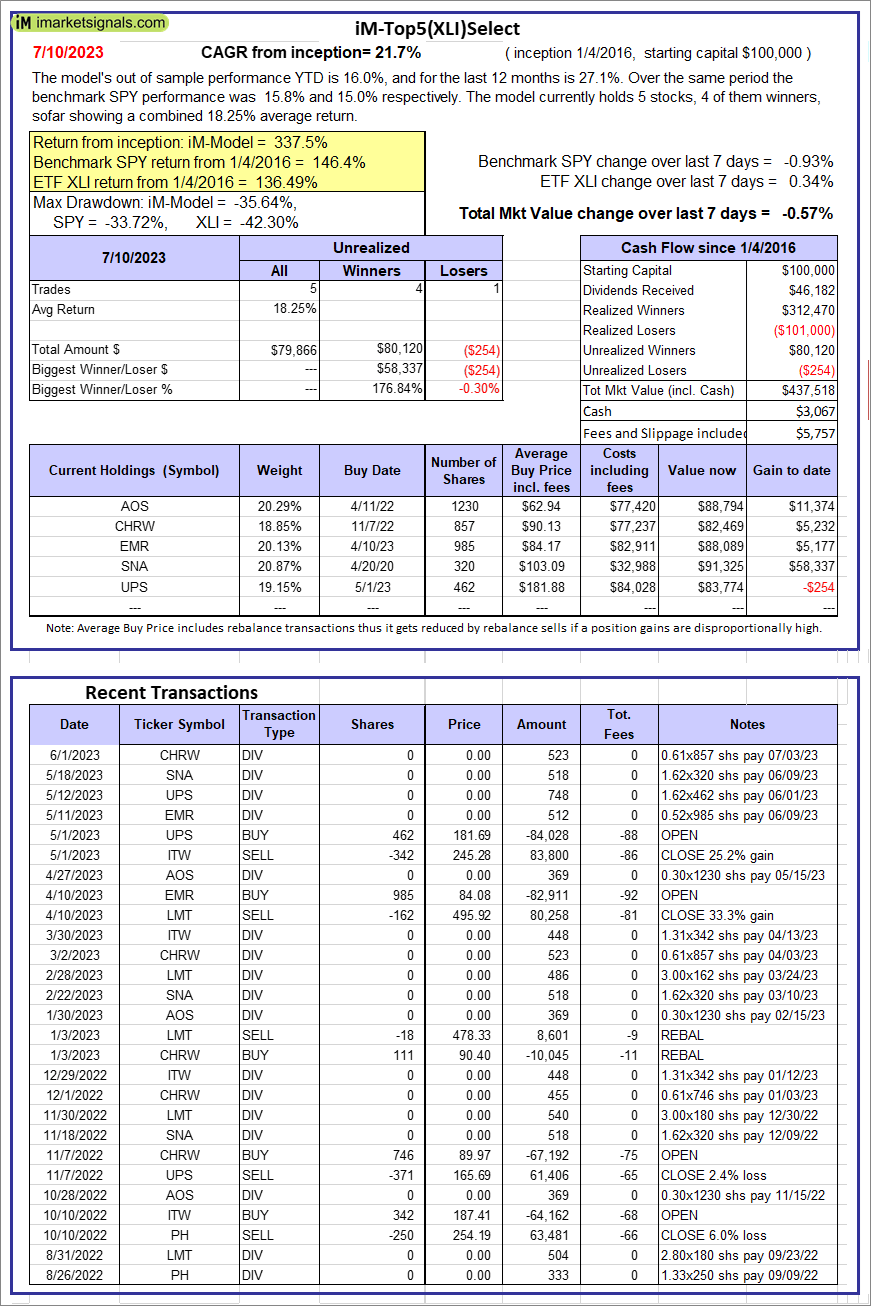 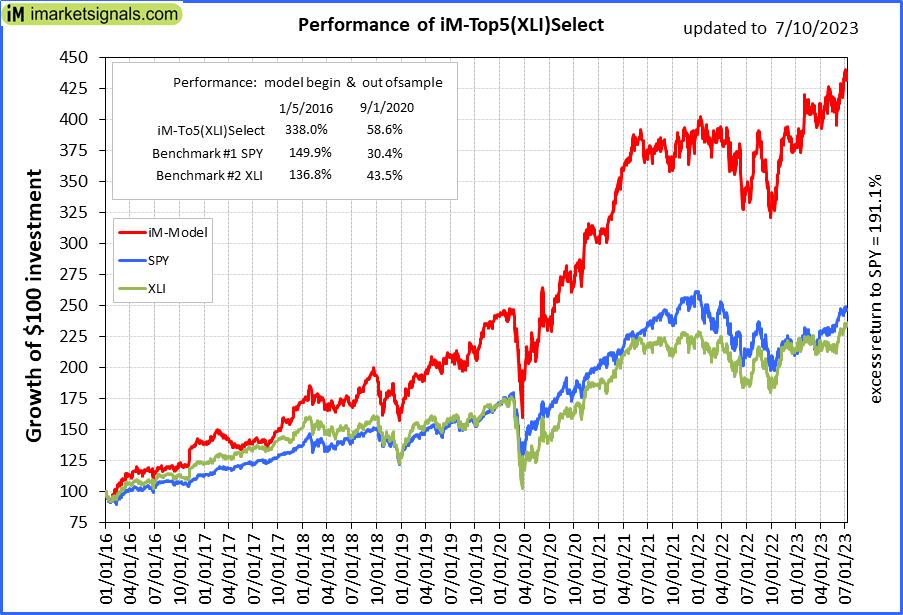 |
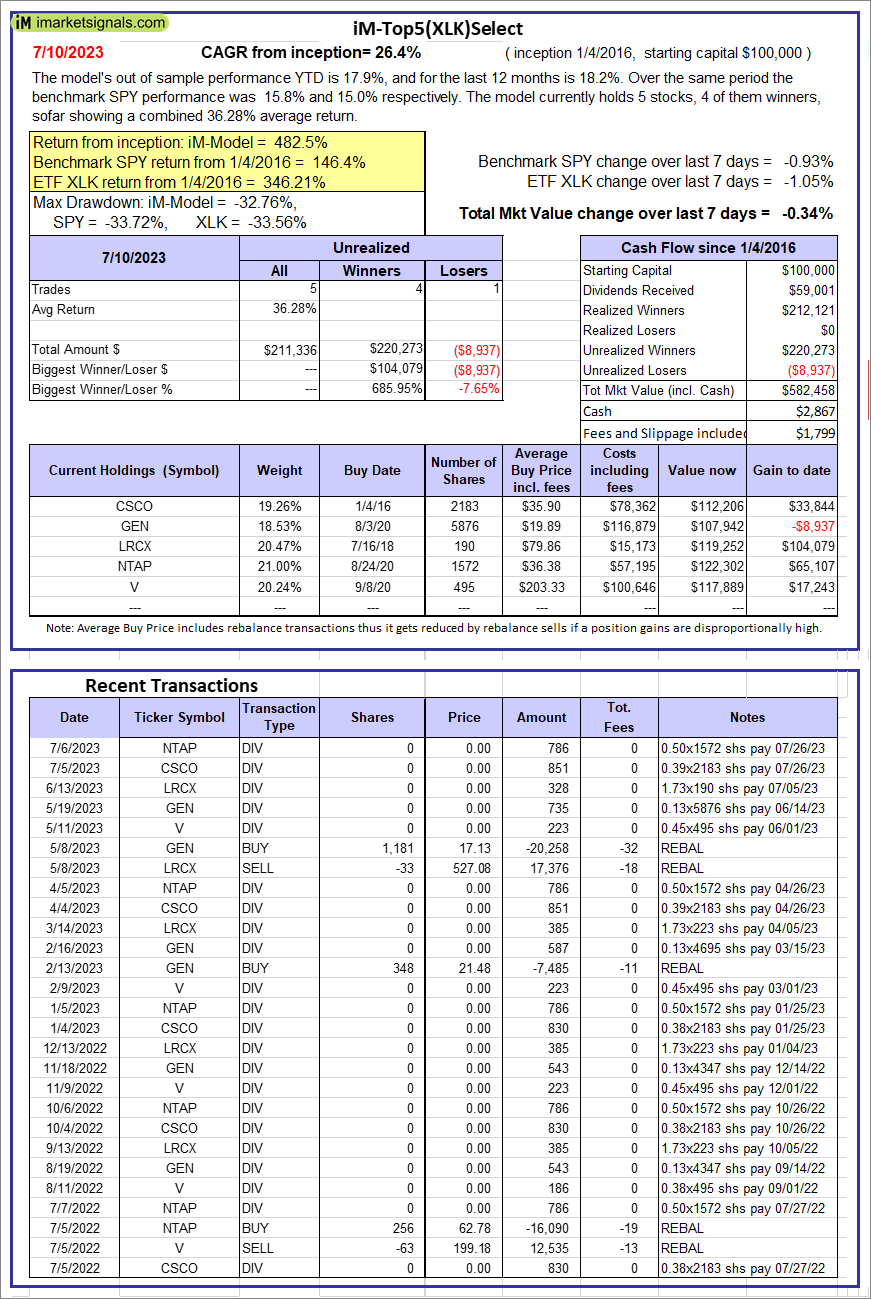
iM-Top5(XLI)Select: Since inception, on 1/5/2016, the model gained 337.52% while the benchmark SPY gained 146.44% over the same period. Over the previous week the market value of iM-Top5(XLI)Select gained -0.57% at a time when SPY gained -0.93%. A starting capital of $100,000 at inception on 1/5/2016 would have grown to $437,518 which includes $3,067 cash and excludes $5,757 spent on fees and slippage. |
 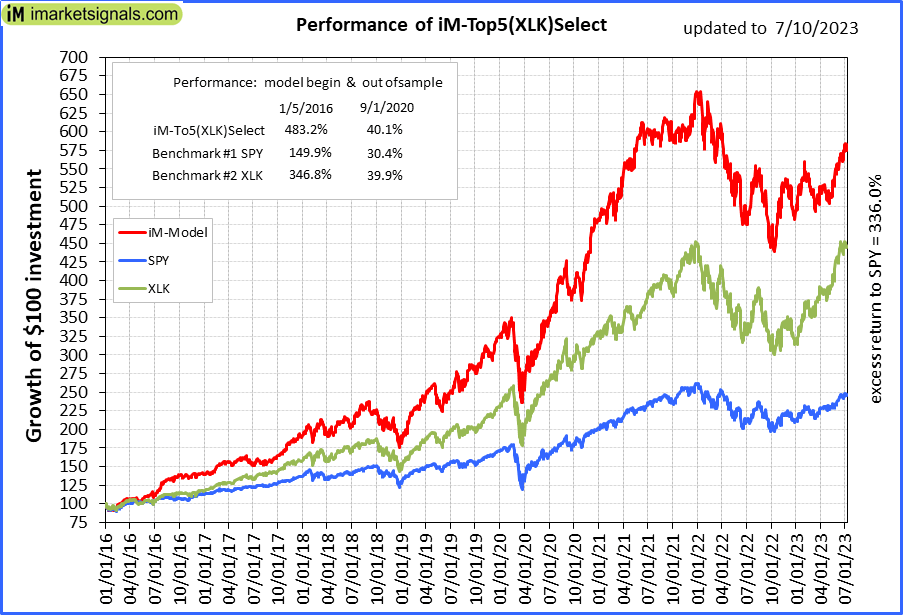 |
iM-Top5(XLK)Select: Since inception, on 1/5/2016, the model gained 482.46% while the benchmark SPY gained 146.44% over the same period. Over the previous week the market value of iM-Top5(XLK)Select gained -0.34% at a time when SPY gained -0.93%. A starting capital of $100,000 at inception on 1/5/2016 would have grown to $582,458 which includes $2,867 cash and excludes $1,799 spent on fees and slippage. |
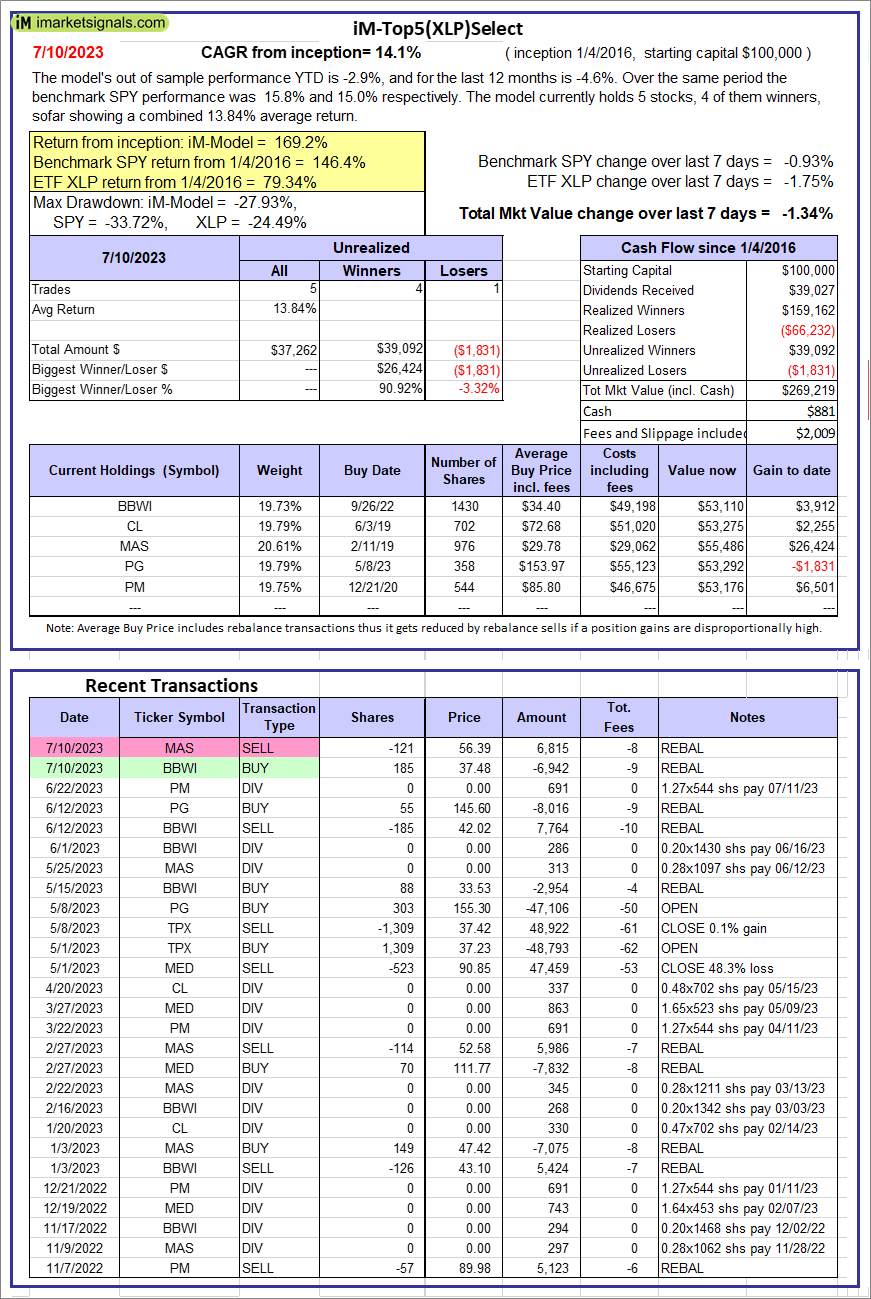 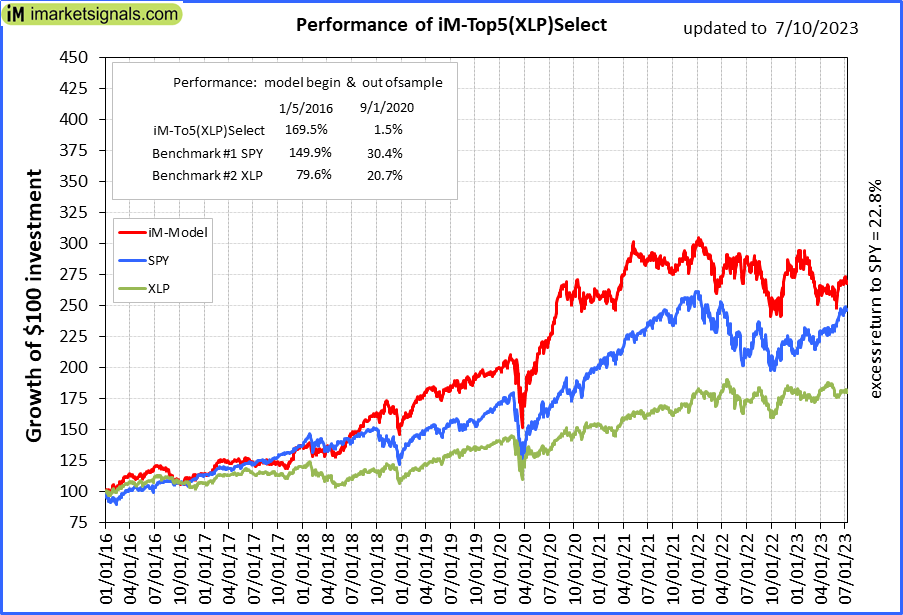 |
iM-Top5(XLP)Select: Since inception, on 1/5/2016, the model gained 169.22% while the benchmark SPY gained 146.44% over the same period. Over the previous week the market value of iM-Top5(XLP)Select gained -1.34% at a time when SPY gained -0.93%. A starting capital of $100,000 at inception on 1/5/2016 would have grown to $269,219 which includes $881 cash and excludes $2,009 spent on fees and slippage. |
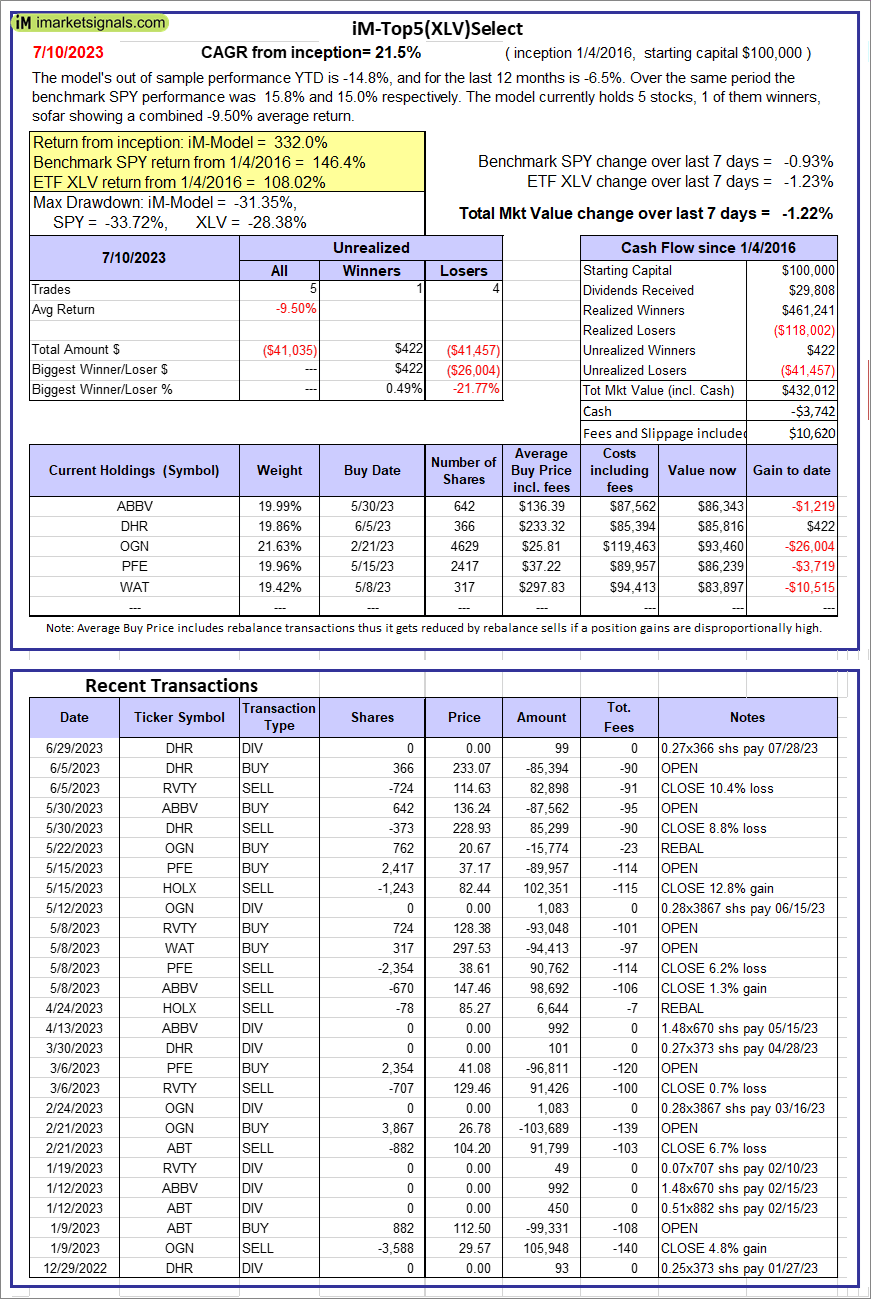 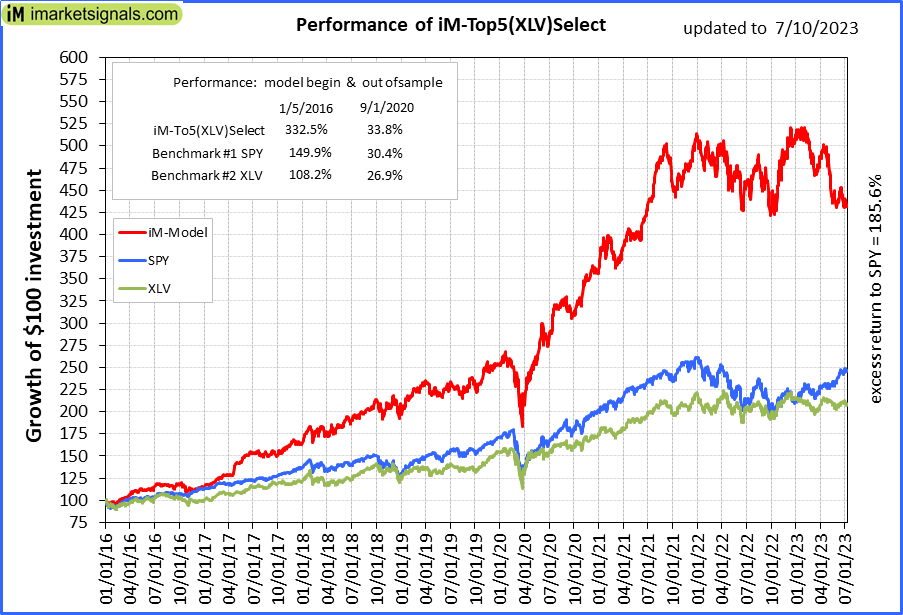 |
iM-Top5(XLV)Select: Since inception, on 1/5/2016, the model gained 332.01% while the benchmark SPY gained 146.44% over the same period. Over the previous week the market value of iM-Top5(XLV)Select gained -1.22% at a time when SPY gained -0.93%. A starting capital of $100,000 at inception on 1/5/2016 would have grown to $432,012 which includes -$3,742 cash and excludes $10,620 spent on fees and slippage. |
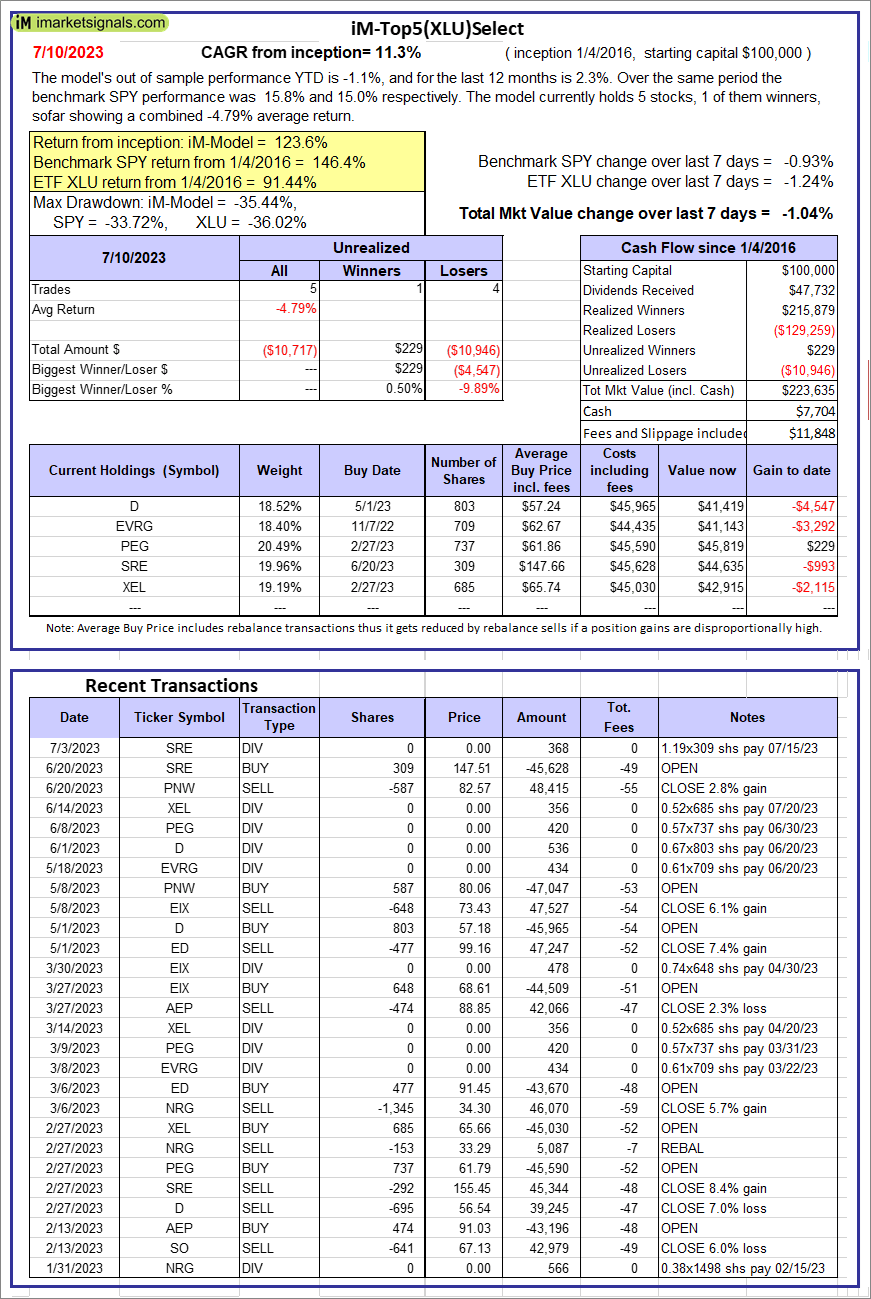 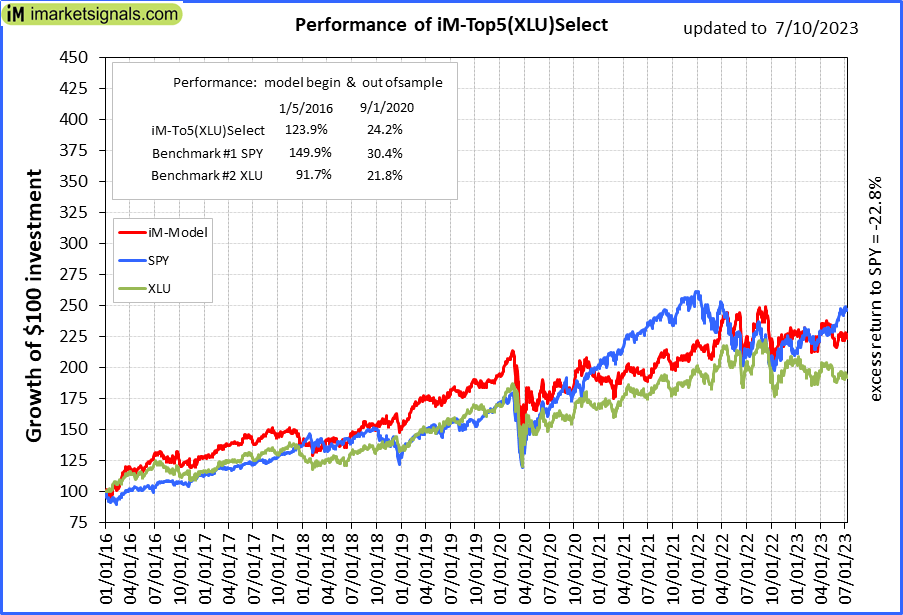 |
iM-Top5(XLU)Select: Since inception, on 1/5/2016, the model gained 123.64% while the benchmark SPY gained 146.44% over the same period. Over the previous week the market value of iM-Top5(XLU)Select gained -1.04% at a time when SPY gained -0.93%. A starting capital of $100,000 at inception on 1/5/2016 would have grown to $223,635 which includes $7,704 cash and excludes $11,848 spent on fees and slippage. |
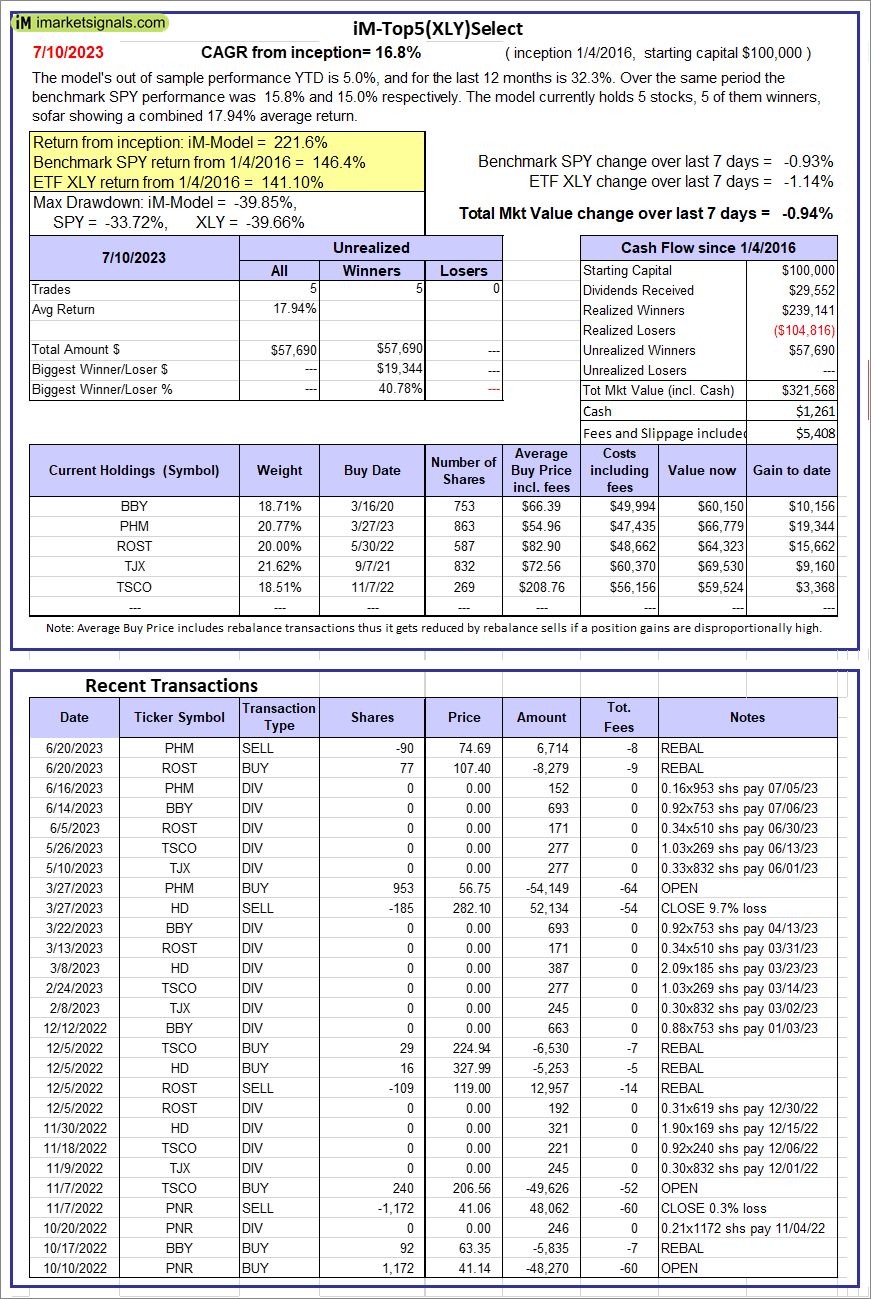 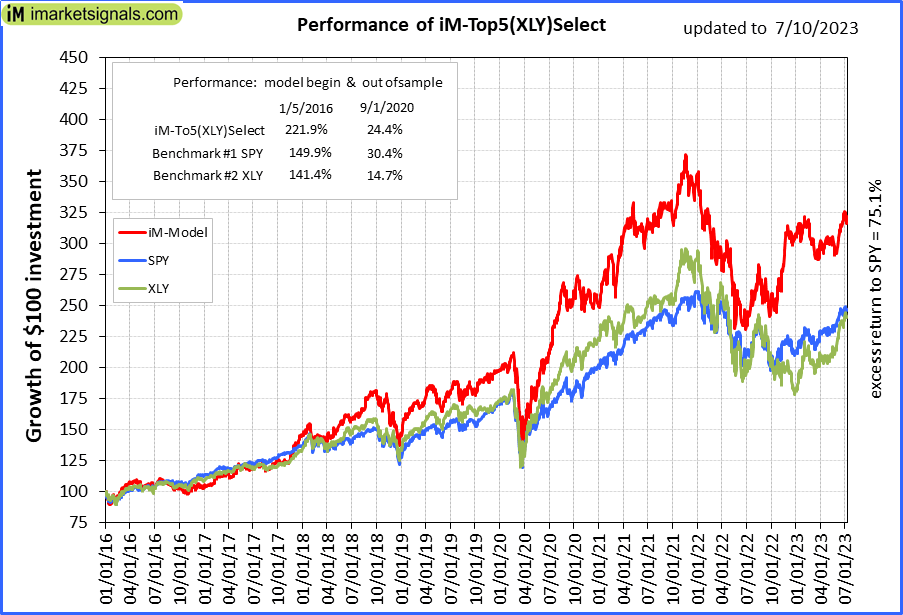 |
iM-Top5(XLY)Select: Since inception, on 1/5/2016, the model gained 221.57% while the benchmark SPY gained 146.44% over the same period. Over the previous week the market value of iM-Top5(XLY)Select gained -0.94% at a time when SPY gained -0.93%. A starting capital of $100,000 at inception on 1/5/2016 would have grown to $321,568 which includes $1,261 cash and excludes $5,408 spent on fees and slippage. |
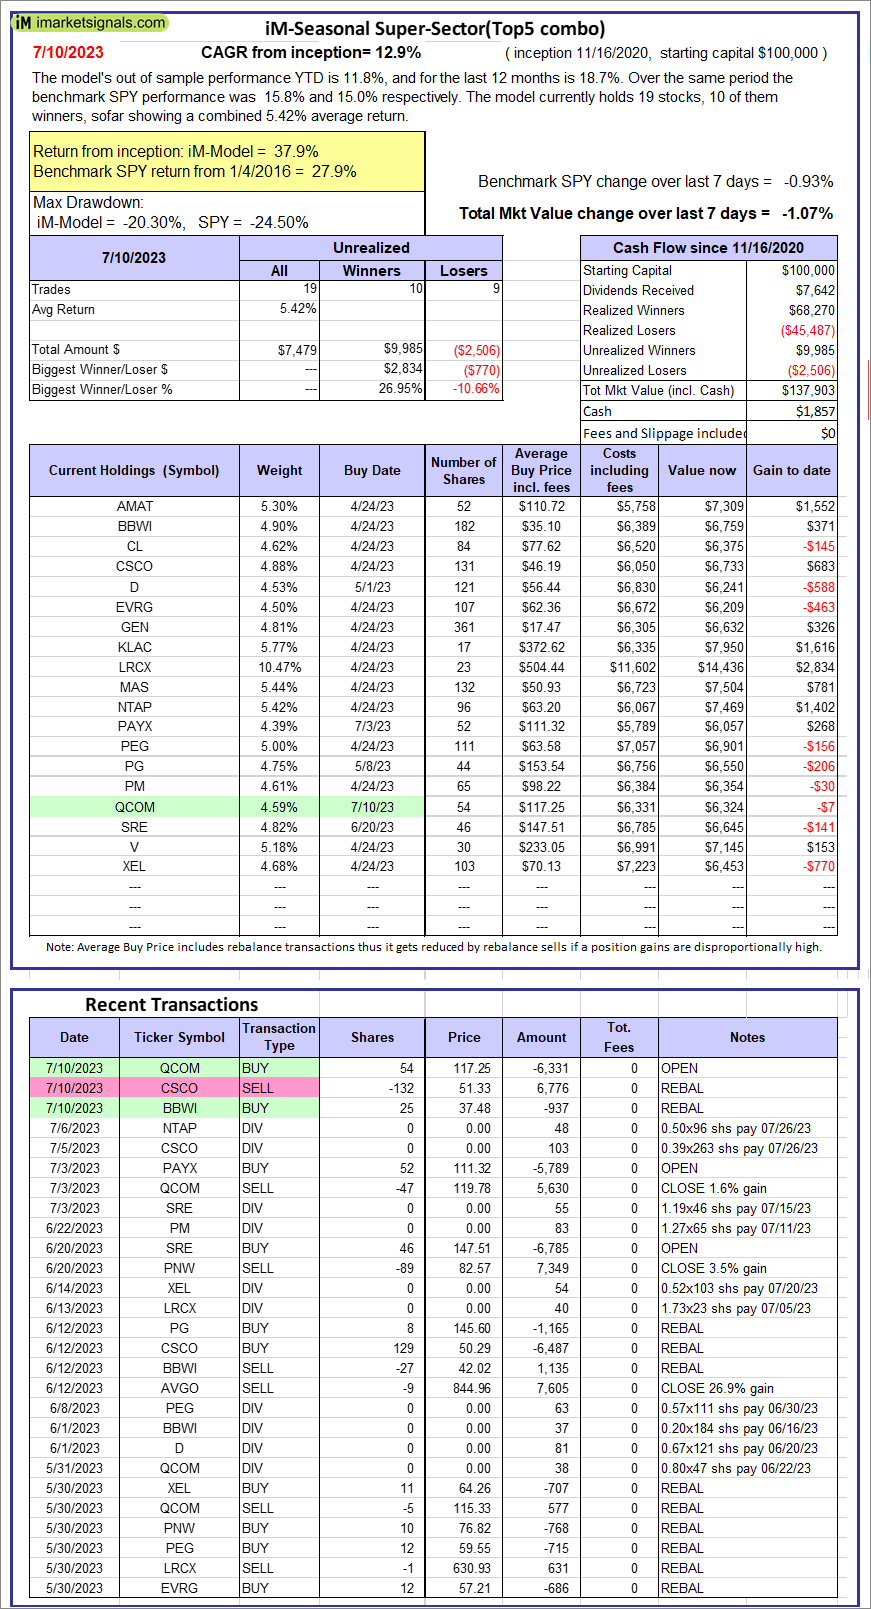 |
iM-Seasonal Super-Sectors (Top5 combo) : Since inception, on 11/17/2020, the model gained 37.90% while the benchmark SPY gained 27.93% over the same period. Over the previous week the market value of iM-Seasonal Super-Sectors (Top5 combo) gained -1.07% at a time when SPY gained -0.93%. A starting capital of $100,000 at inception on 11/17/2020 would have grown to $137,903 which includes $1,857 cash and excludes $00 spent on fees and slippage. |
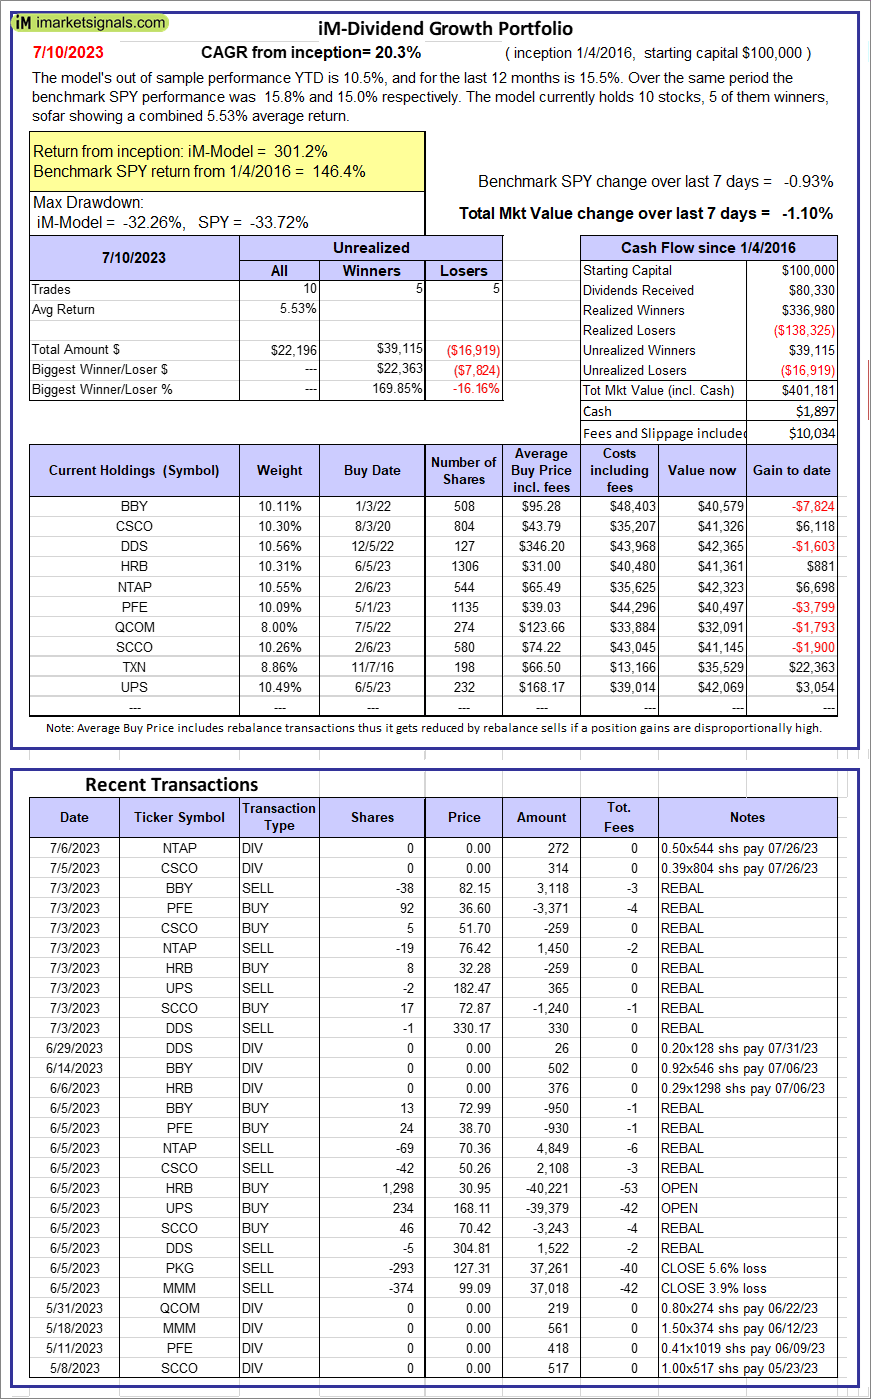 |
iM-Dividend Growth Portfolio: The model’s out of sample performance YTD is 10.5%, and for the last 12 months is 15.5%. Over the same period the benchmark SPY performance was 15.8% and 15.0% respectively. Over the previous week the market value of the iM-Dividend Growth Portfolio gained -1.10% at a time when SPY gained -0.93%. A starting capital of $100,000 at inception on 6/30/2016 would have grown to $401,181 which includes $1,897 cash and excludes $10,034 spent on fees and slippage. |
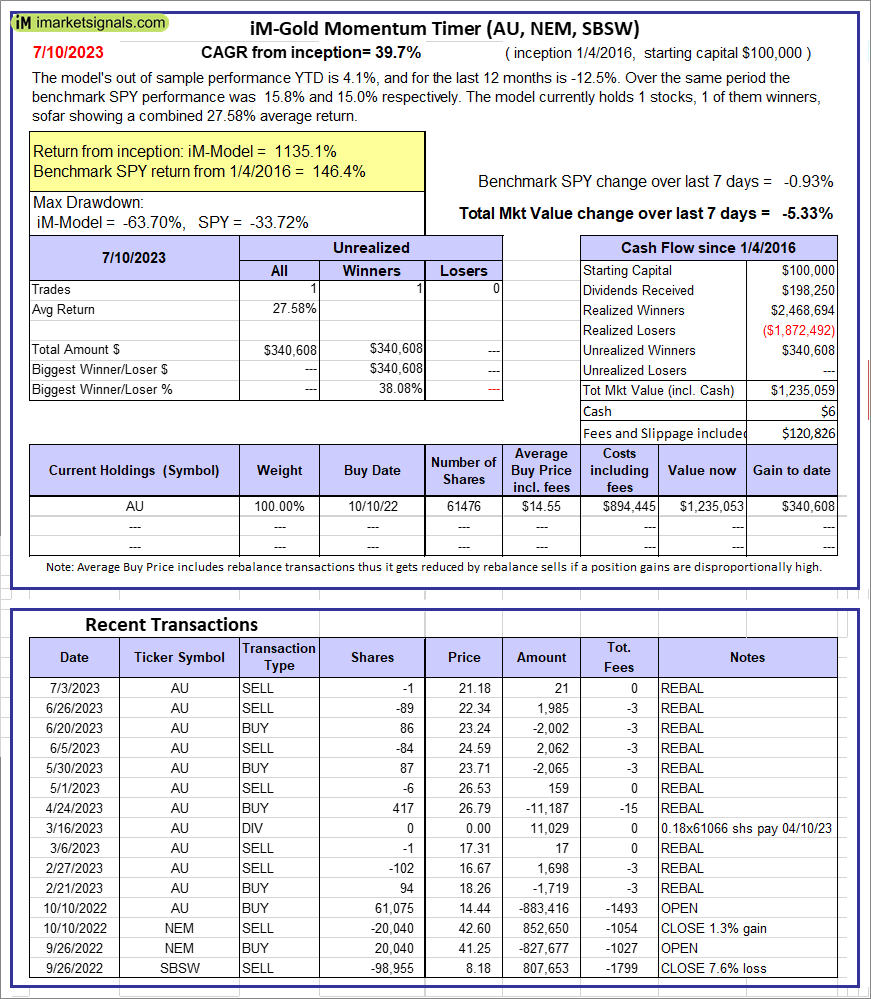 |
iM-Gold Momentum Timer (AU, NEM, SBSW): The model’s out of sample performance YTD is 4.1%, and for the last 12 months is -12.5%. Over the same period the benchmark SPY performance was 15.8% and 15.0% respectively. Over the previous week the market value of iM-Gold Momentum Timer (AU, NEM, SBSW) gained -5.33% at a time when SPY gained -0.93%. A starting capital of $100,000 at inception on 6/30/2016 would have grown to $06 which includes $120,826 cash and excludes Gain to date spent on fees and slippage. |
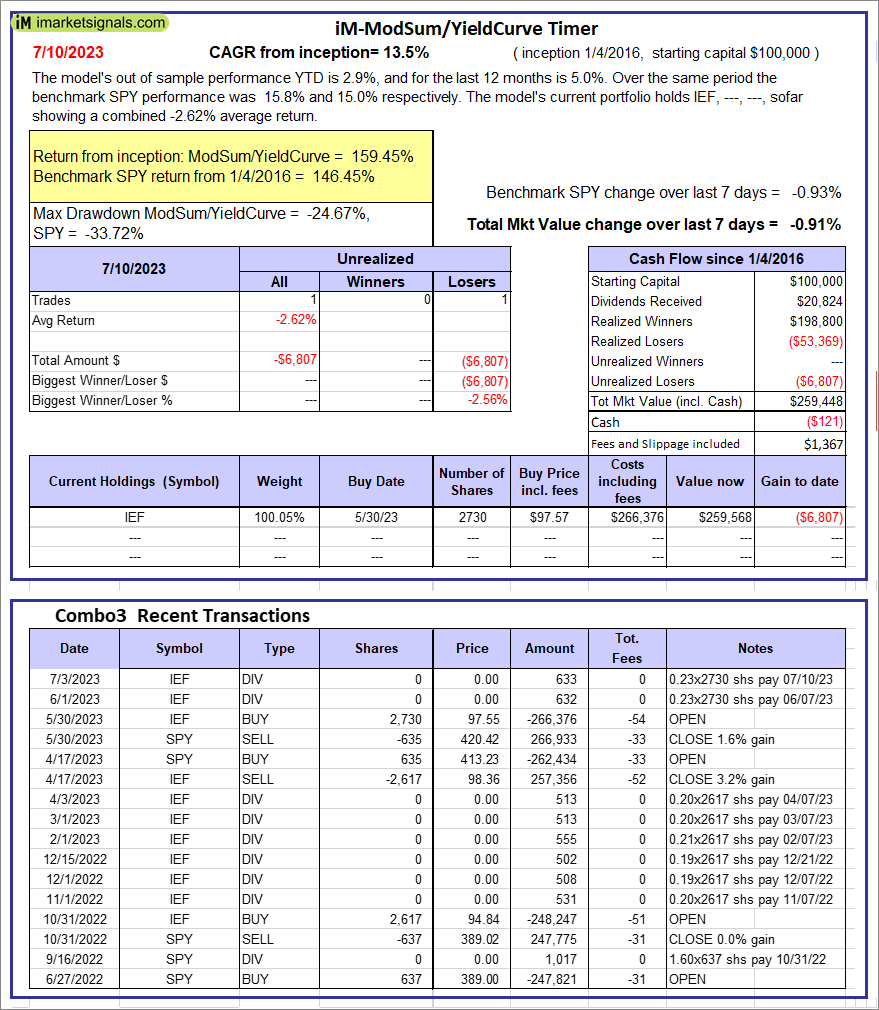 |
iM-ModSum/YieldCurve Timer: The model’s out of sample performance YTD is 2.9%, and for the last 12 months is 5.0%. Over the same period the benchmark SPY performance was 15.8% and 15.0% respectively. Over the previous week the market value of iM-PortSum/YieldCurve Timer gained -0.91% at a time when SPY gained -0.93%. A starting capital of $100,000 at inception on 1/1/2016 would have grown to $259,448 which includes -$121 cash and excludes $1,367 spent on fees and slippage. |
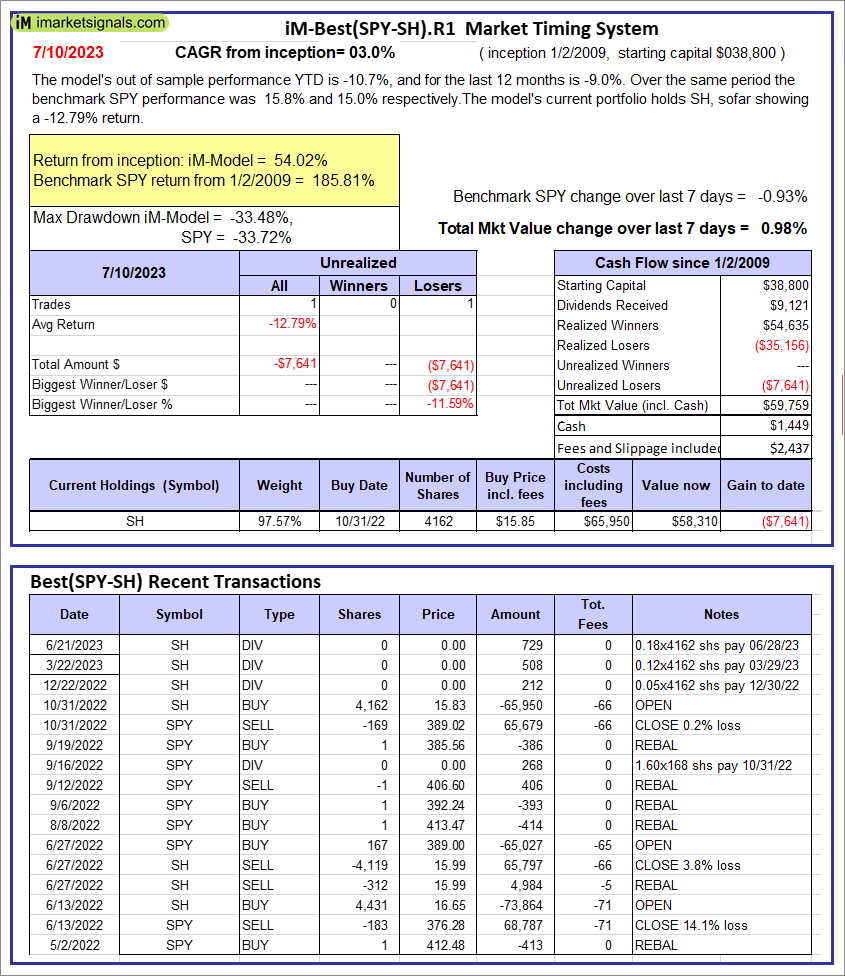 |
iM-Best(SPY-SH).R1: The model’s out of sample performance YTD is -10.7%, and for the last 12 months is -9.0%. Over the same period the benchmark SPY performance was 15.8% and 15.0% respectively. Over the previous week the market value of Best(SPY-SH) gained 0.98% at a time when SPY gained -0.93%. A starting capital of $100,000 at inception on 1/2/2009 would have grown to $59,759 which includes $1,449 cash and excludes $2,437 spent on fees and slippage. |
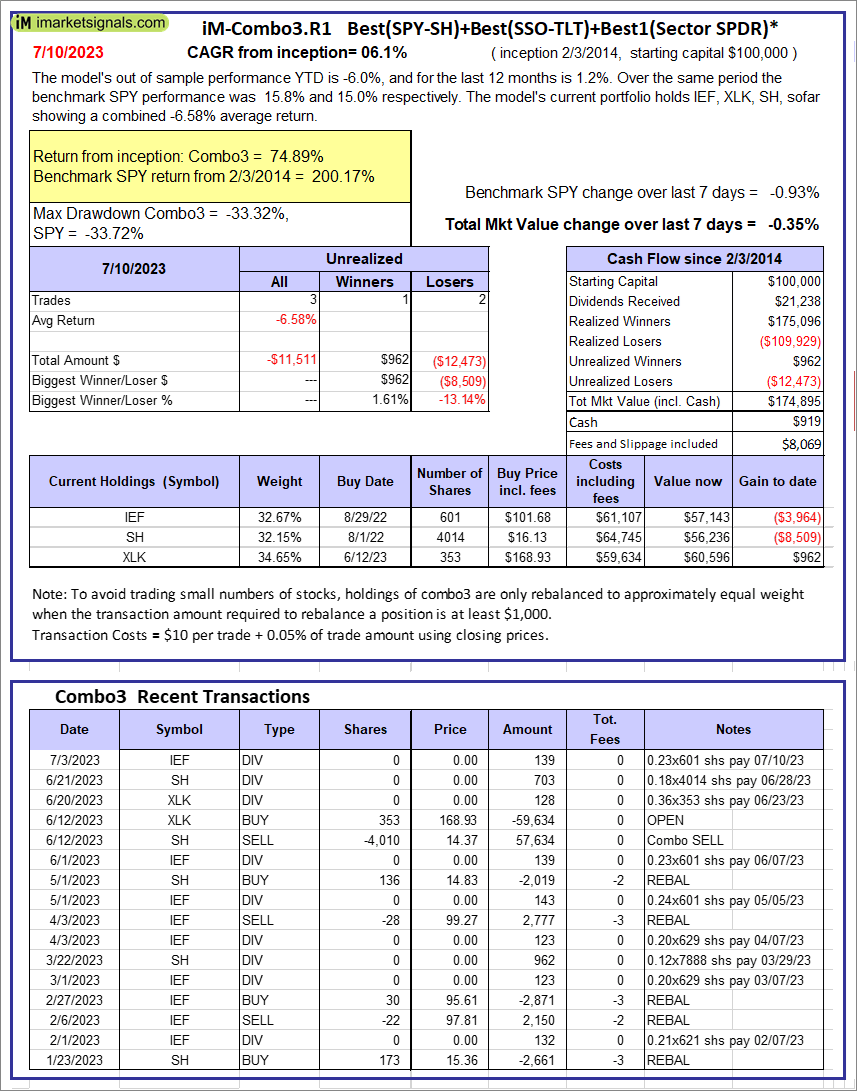 |
iM-Combo3.R1: The model’s out of sample performance YTD is -6.0%, and for the last 12 months is 1.2%. Over the same period the benchmark SPY performance was 15.8% and 15.0% respectively. Over the previous week the market value of iM-Combo3.R1 gained -0.35% at a time when SPY gained -0.93%. A starting capital of $100,000 at inception on 2/3/2014 would have grown to $174,895 which includes $919 cash and excludes $8,069 spent on fees and slippage. |
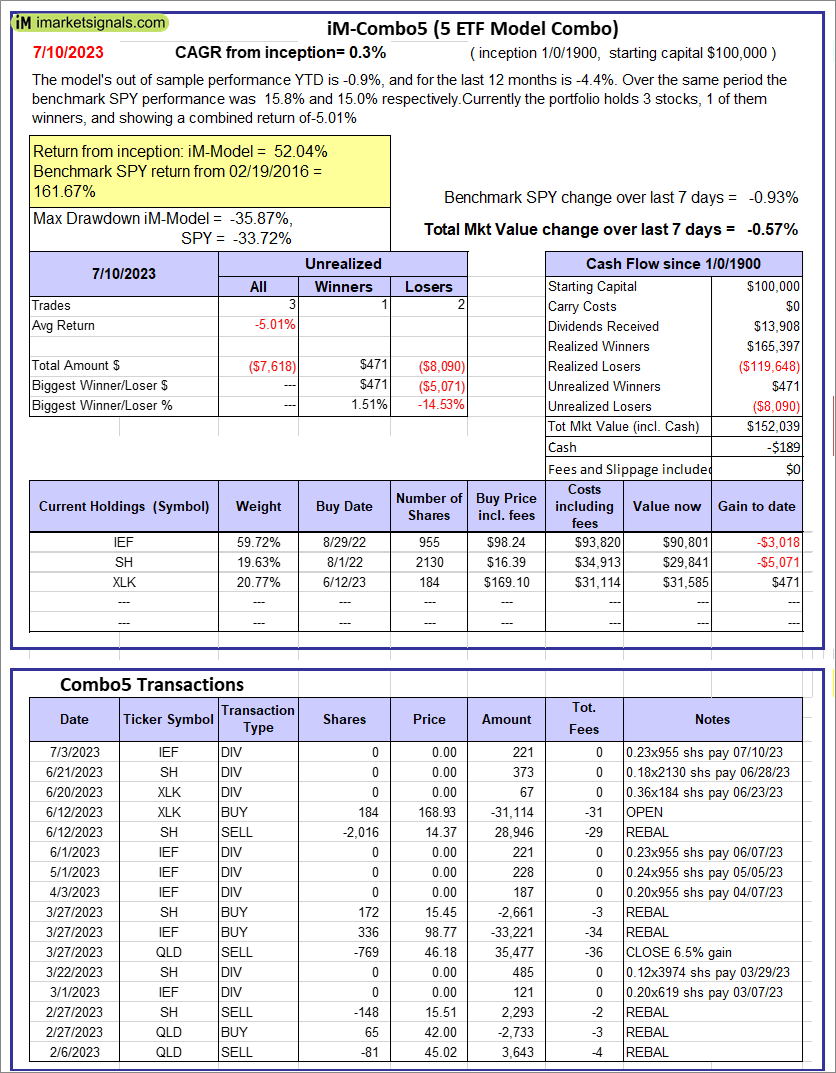 |
iM-Combo5: The model’s out of sample performance YTD is -0.9%, and for the last 12 months is -4.4%. Over the same period the benchmark SPY performance was 15.8% and 15.0% respectively. Over the previous week the market value of iM-Combo5 gained -0.57% at a time when SPY gained -0.93%. A starting capital of $100,000 at inception on 2/22/2016 would have grown to $152,039 which includes -$189 cash and excludes $0 spent on fees and slippage. |
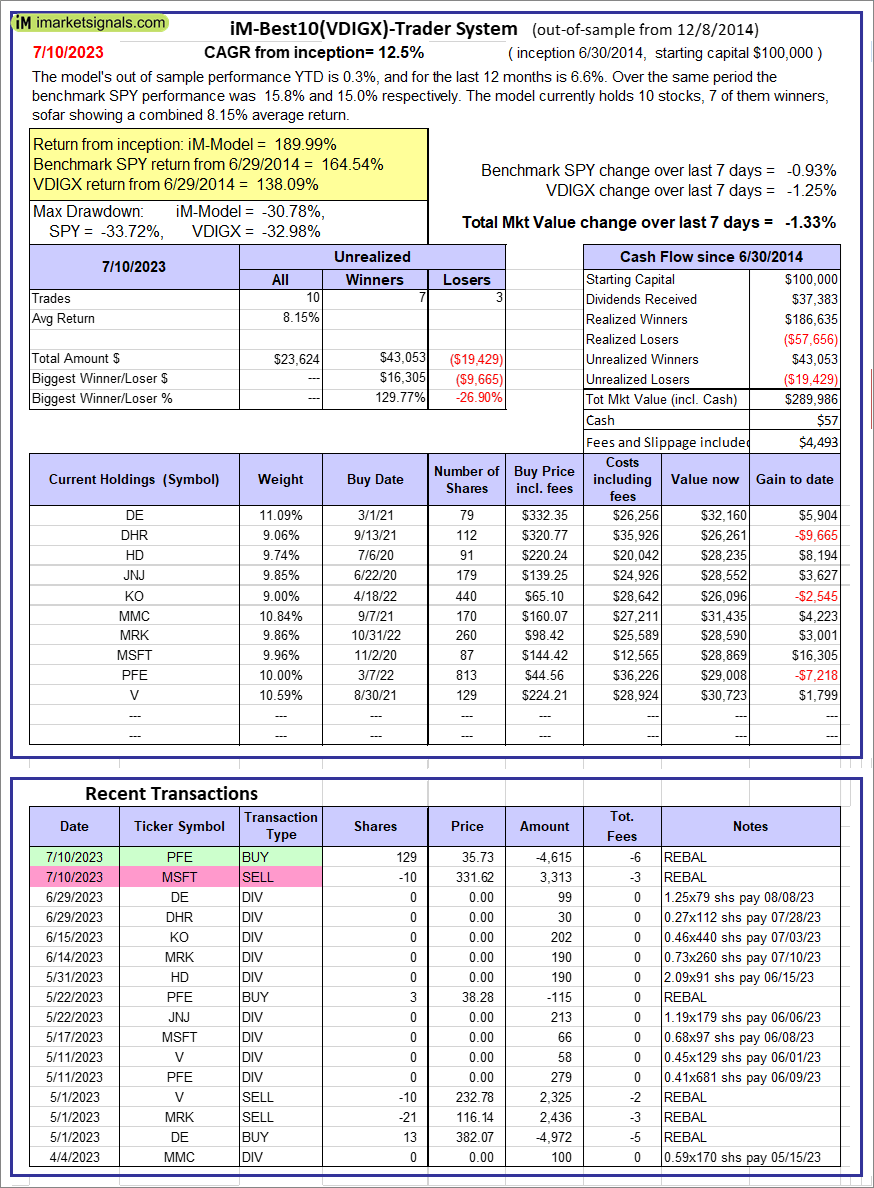 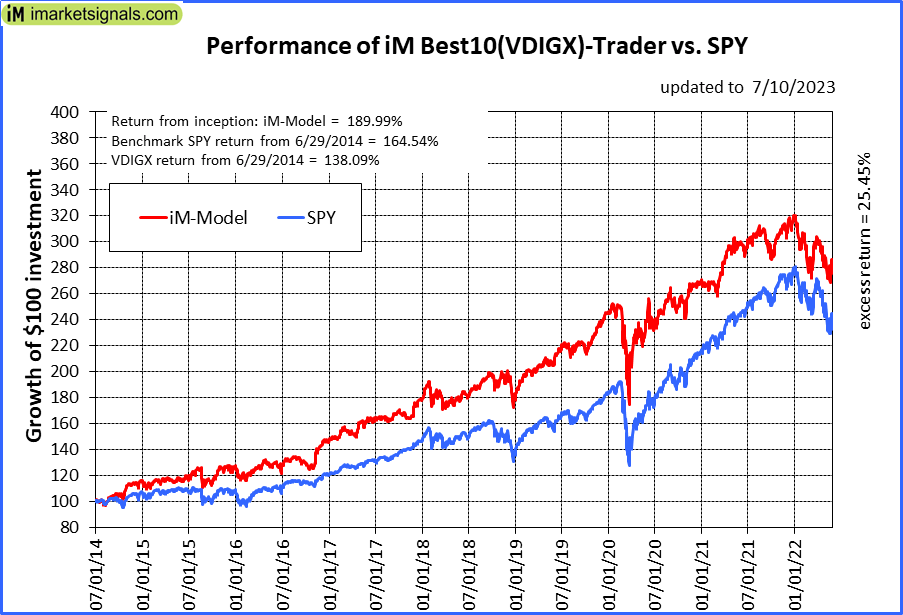 |
iM-Best10(VDIGX)-Trader: The model’s out of sample performance YTD is 0.3%, and for the last 12 months is 6.6%. Over the same period the benchmark SPY performance was 15.8% and 15.0% respectively. Since inception, on 7/1/2014, the model gained 189.99% while the benchmark SPY gained 164.54% and VDIGX gained 138.09% over the same period. Over the previous week the market value of iM-Best10(VDIGX) gained -1.33% at a time when SPY gained -0.93%. A starting capital of $100,000 at inception on 7/1/2014 would have grown to $289,986 which includes $57 cash and excludes $4,493 spent on fees and slippage. |
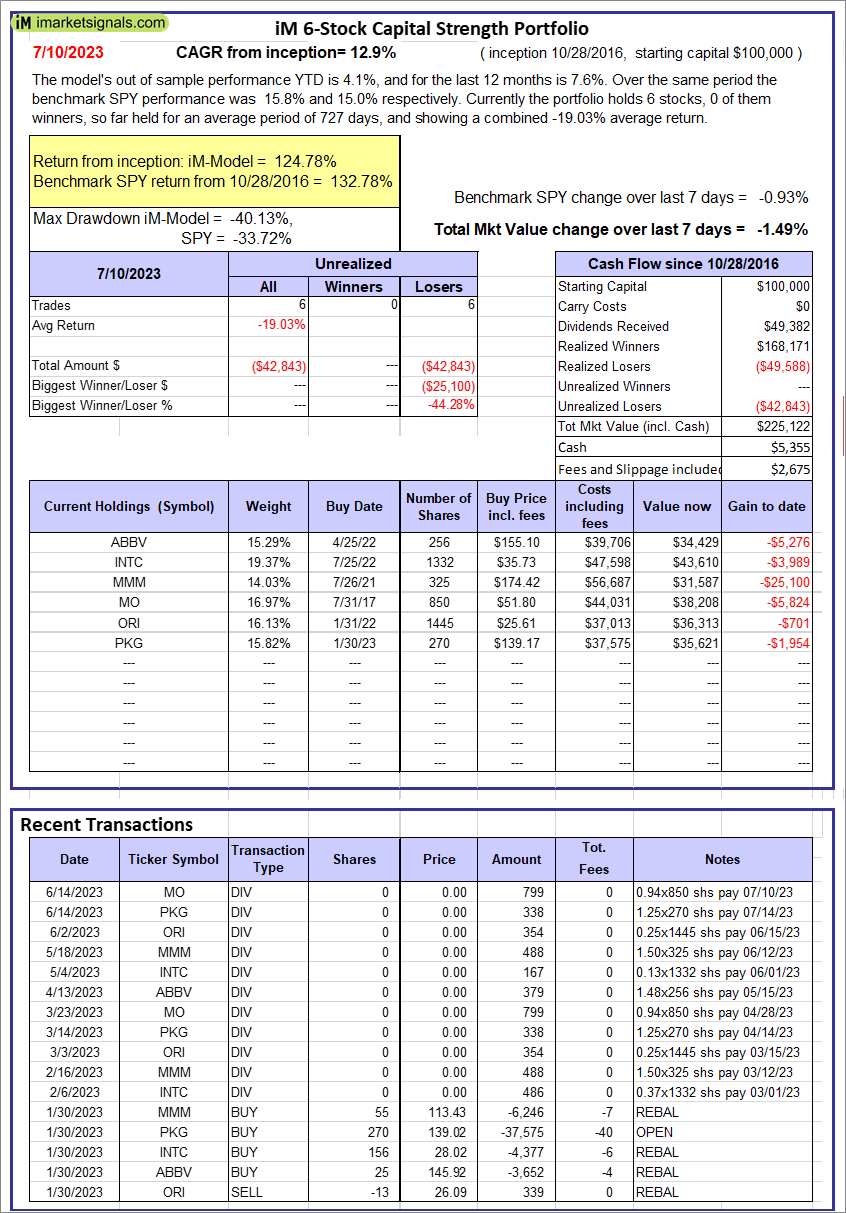 |
iM 6-Stock Capital Strength Portfolio: The model’s out of sample performance YTD is 4.1%, and for the last 12 months is 7.6%. Over the same period the benchmark SPY performance was 15.8% and 15.0% respectively. Over the previous week the market value of the iM 6-Stock Capital Strength Portfolio gained -1.49% at a time when SPY gained -0.93%. A starting capital of $100,000 at inception on 10/28/2016 would have grown to $225,122 which includes $5,355 cash and excludes $2,675 spent on fees and slippage. |
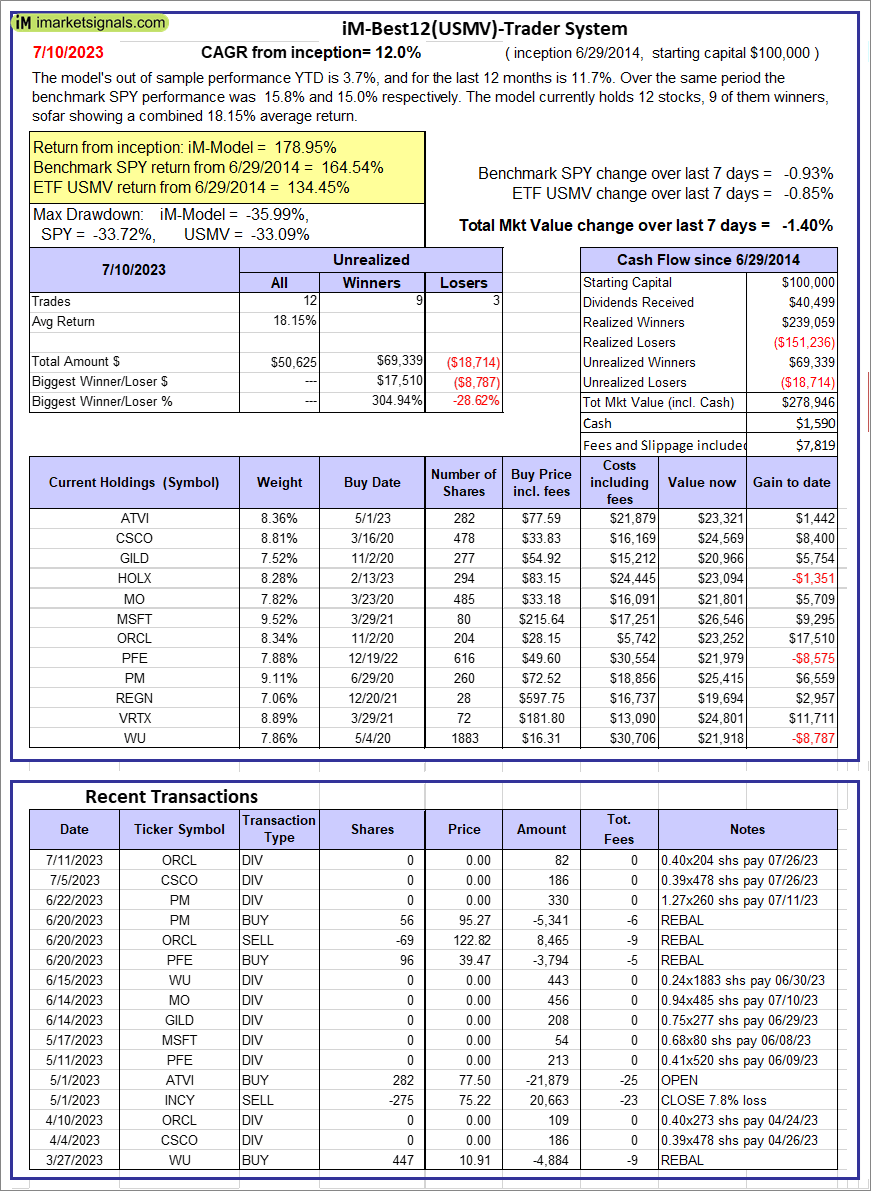 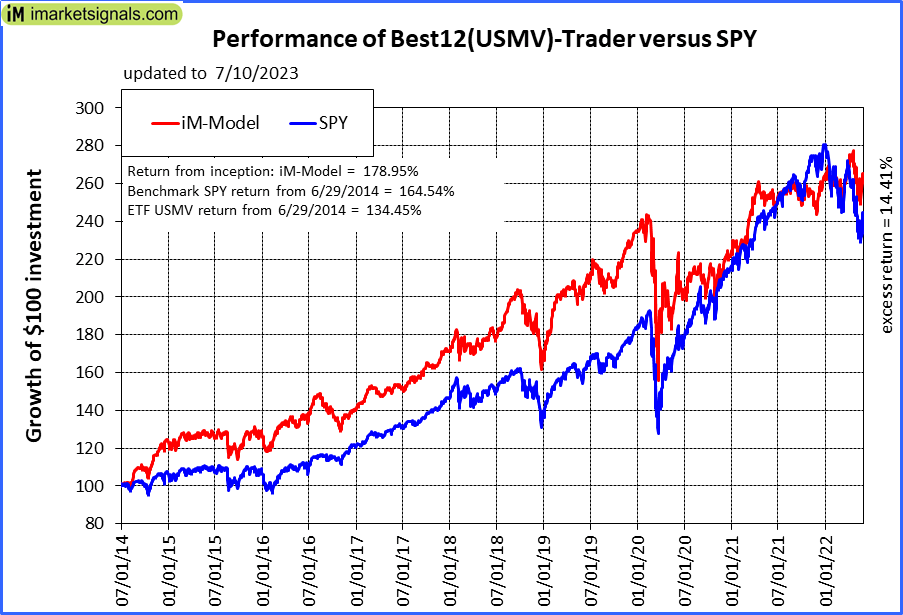 |
iM-Best12(USMV)-Trader: The model’s out of sample performance YTD is 3.7%, and for the last 12 months is 11.7%. Over the same period the benchmark SPY performance was 15.8% and 15.0% respectively. Since inception, on 6/30/2014, the model gained 178.95% while the benchmark SPY gained 164.54% and the ETF USMV gained 134.45% over the same period. Over the previous week the market value of iM-Best12(USMV)-Trader gained -1.40% at a time when SPY gained -0.93%. A starting capital of $100,000 at inception on 6/30/2014 would have grown to $278,946 which includes $1,590 cash and excludes $7,819 spent on fees and slippage. |
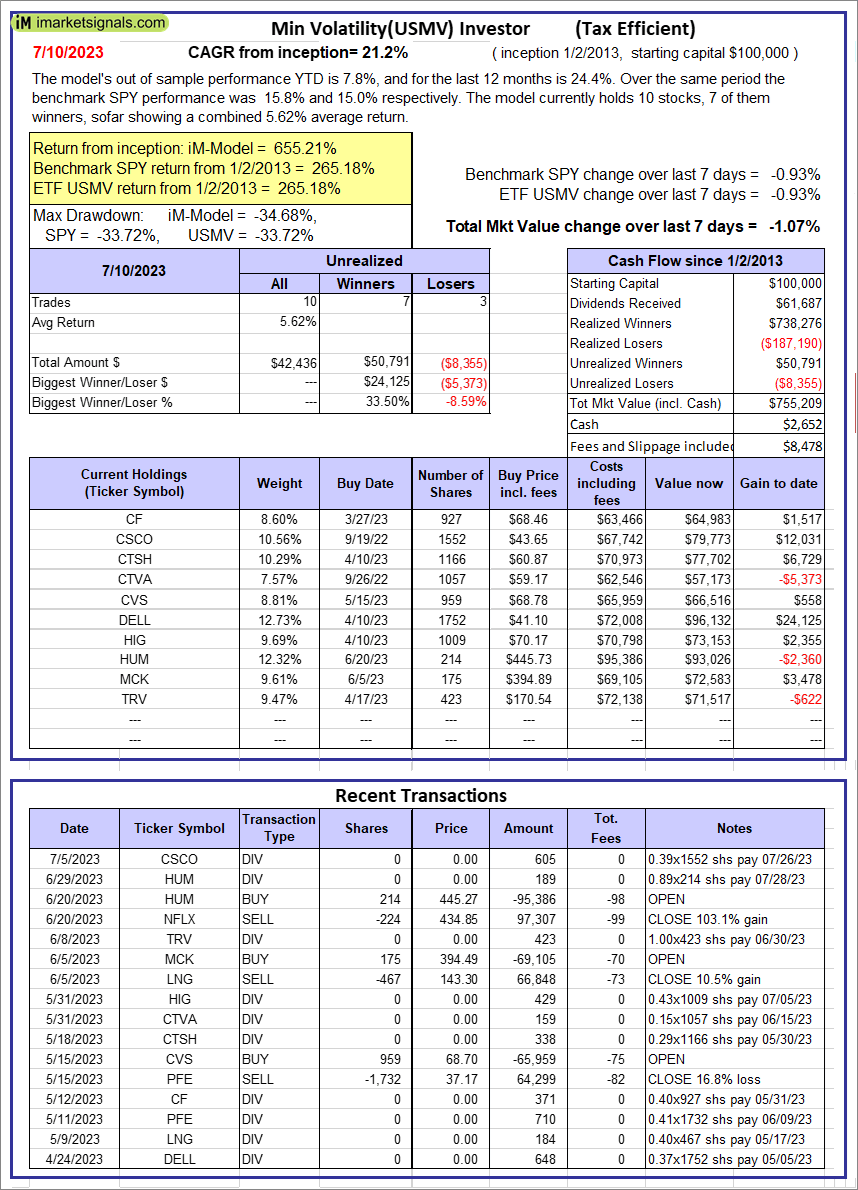 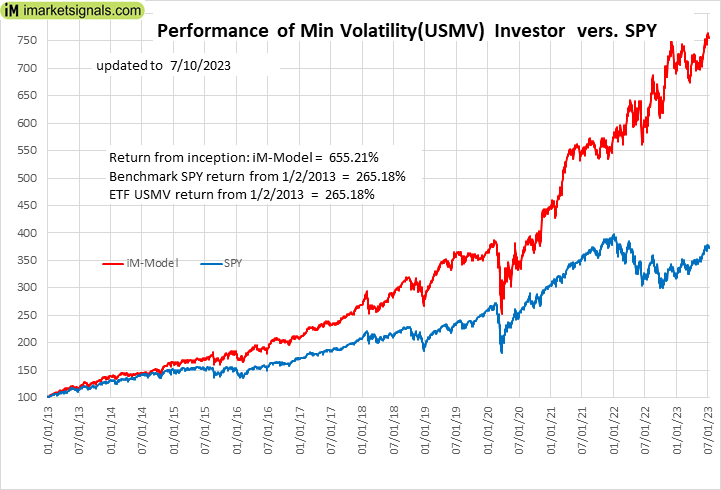 |
iM-Min Volatility(USMV) Investor (Tax Efficient): The model’s out of sample performance YTD is 7.8%, and for the last 12 months is 24.4%. Over the same period the benchmark SPY performance was 15.8% and 15.0% respectively. Since inception, on 1/3/2013, the model gained 655.21% while the benchmark SPY gained 265.18% and the ETF USMV gained 265.18% over the same period. Over the previous week the market value of iM-Best12(USMV)Q1 gained -1.07% at a time when SPY gained -0.93%. A starting capital of $100,000 at inception on 1/3/2013 would have grown to $755,209 which includes $2,652 cash and excludes $8,478 spent on fees and slippage. |
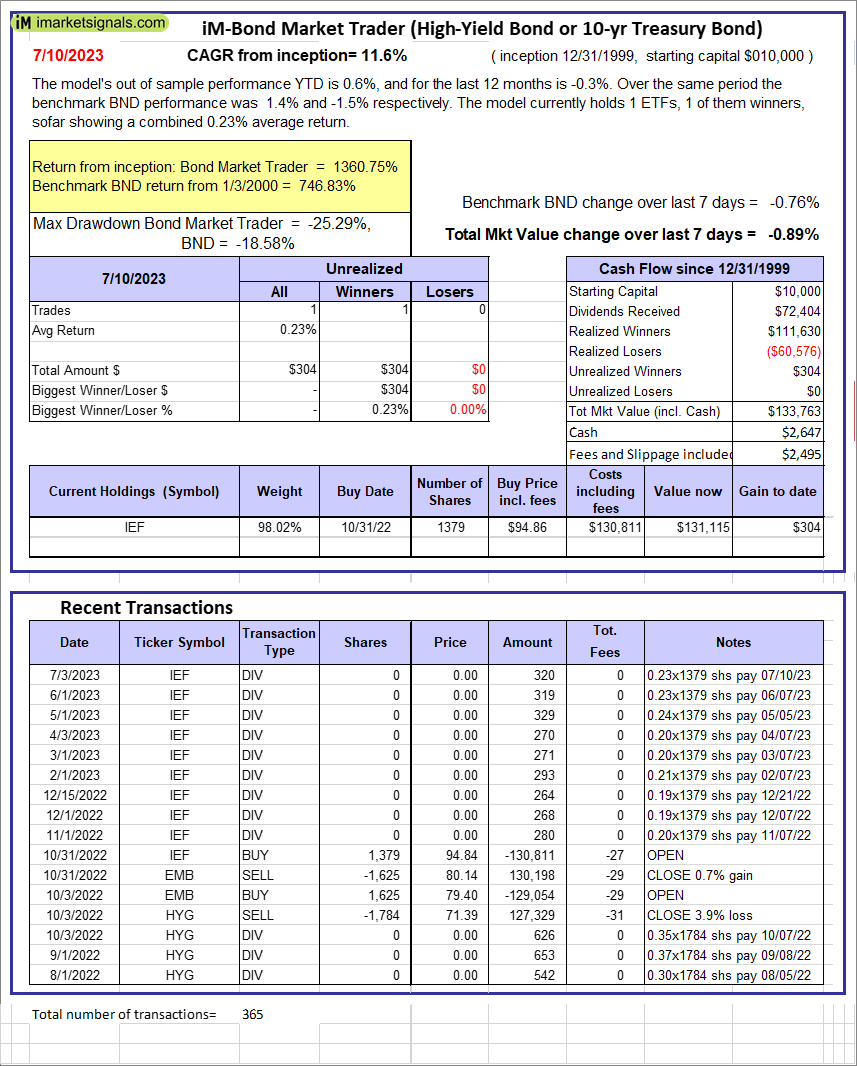 |
iM-Bond Market Trader (High-Yield Bond or 10-yr Treasury Bond): The model’s out of sample performance YTD is 0.6%, and for the last 12 months is -0.3%. Over the same period the benchmark BND performance was 1.4% and -1.5% respectively. Over the previous week the market value of the iM-Bond Market Trader (High-Yield Bond or 10-yr Treasury Bond) gained -0.89% at a time when BND gained -0.76%. A starting capital of $10,000 at inception on 1/3/2000 would have grown to $133,763 which includes $2,647 cash and excludes $2,495 spent on fees and slippage. |
|
|
iM-ModSum/YieldCurve Timer: The model’s out of sample performance YTD is 2.9%, and for the last 12 months is 5.0%. Over the same period the benchmark SPY performance was 15.8% and 15.0% respectively. Over the previous week the market value of iM-PortSum/YieldCurve Timer gained -0.91% at a time when SPY gained -0.93%. A starting capital of $100,000 at inception on 1/1/2016 would have grown to $259,448 which includes -$121 cash and excludes $1,367 spent on fees and slippage. |
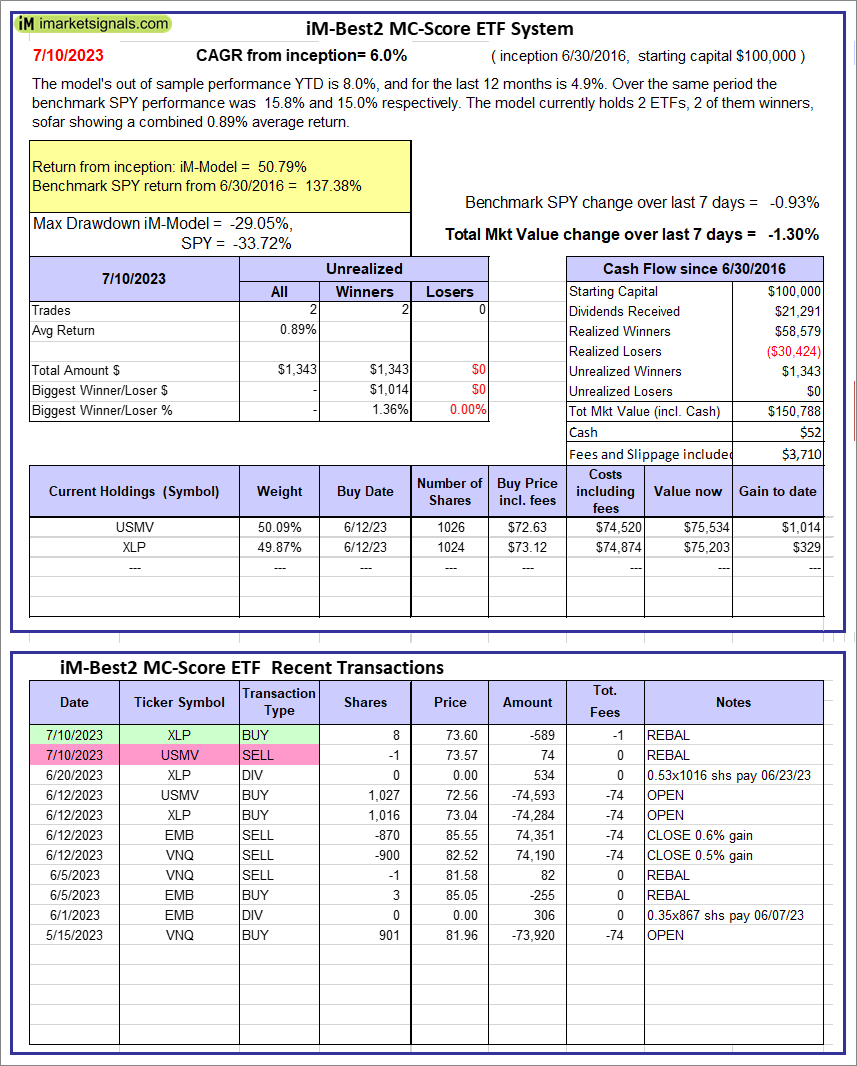 |
iM-Best2 MC-Score ETF System: The model’s out of sample performance YTD is 8.0%, and for the last 12 months is 4.9%. Over the same period the benchmark SPY performance was 15.8% and 15.0% respectively. Over the previous week the market value of the iM-Best2 MC-Score ETF System gained -1.30% at a time when SPY gained -0.93%. A starting capital of $100,000 at inception on 6/30/2016 would have grown to $150,788 which includes $52 cash and excludes $3,710 spent on fees and slippage. |
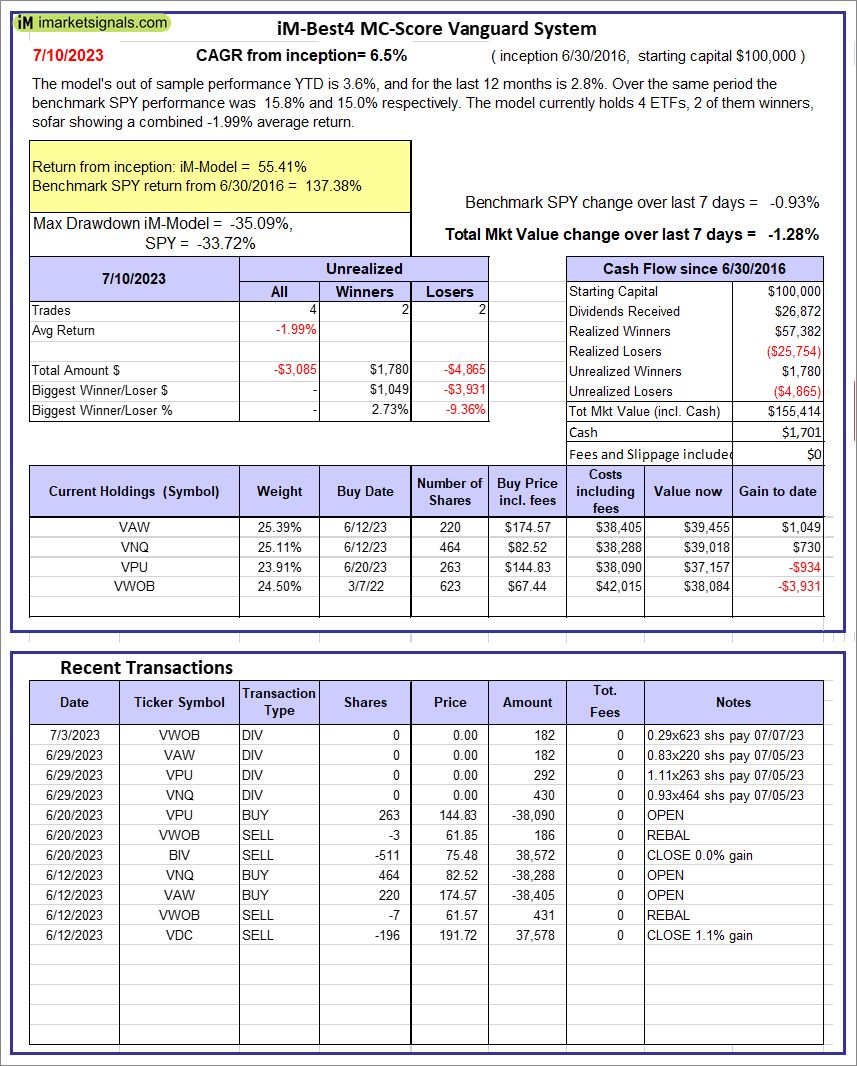 |
iM-Best4 MC-Score Vanguard System: The model’s out of sample performance YTD is 3.6%, and for the last 12 months is 2.8%. Over the same period the benchmark SPY performance was 15.8% and 15.0% respectively. Over the previous week the market value of the iM-Best4 MC-Score Vanguard System gained -1.28% at a time when SPY gained -0.93%. A starting capital of $100,000 at inception on 6/30/2016 would have grown to $155,414 which includes $1,701 cash and excludes $00 spent on fees and slippage. |
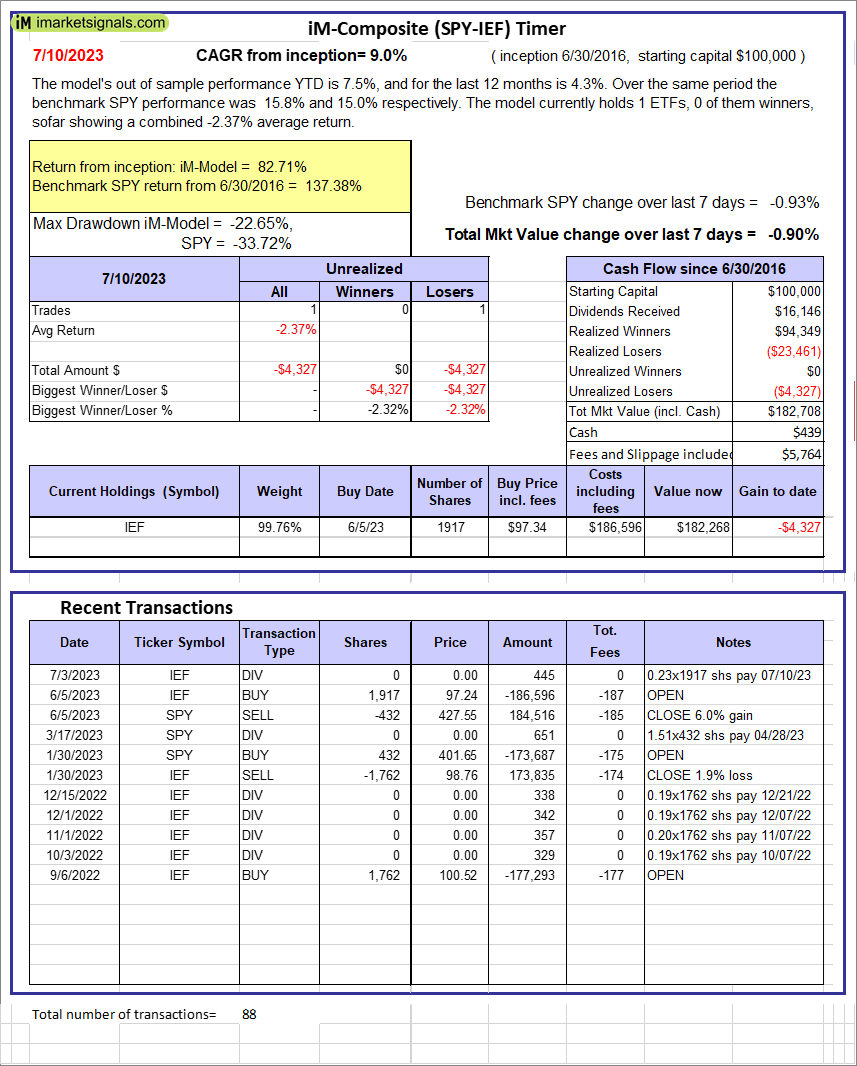 |
iM-Composite (SPY-IEF) Timer: The model’s out of sample performance YTD is 7.5%, and for the last 12 months is 4.3%. Over the same period the benchmark SPY performance was 15.8% and 15.0% respectively. Over the previous week the market value of the iM-Composite (SPY-IEF) Timer gained -0.90% at a time when SPY gained -0.93%. A starting capital of $100,000 at inception on 6/30/2016 would have grown to $182,708 which includes $439 cash and excludes $5,764 spent on fees and slippage. |
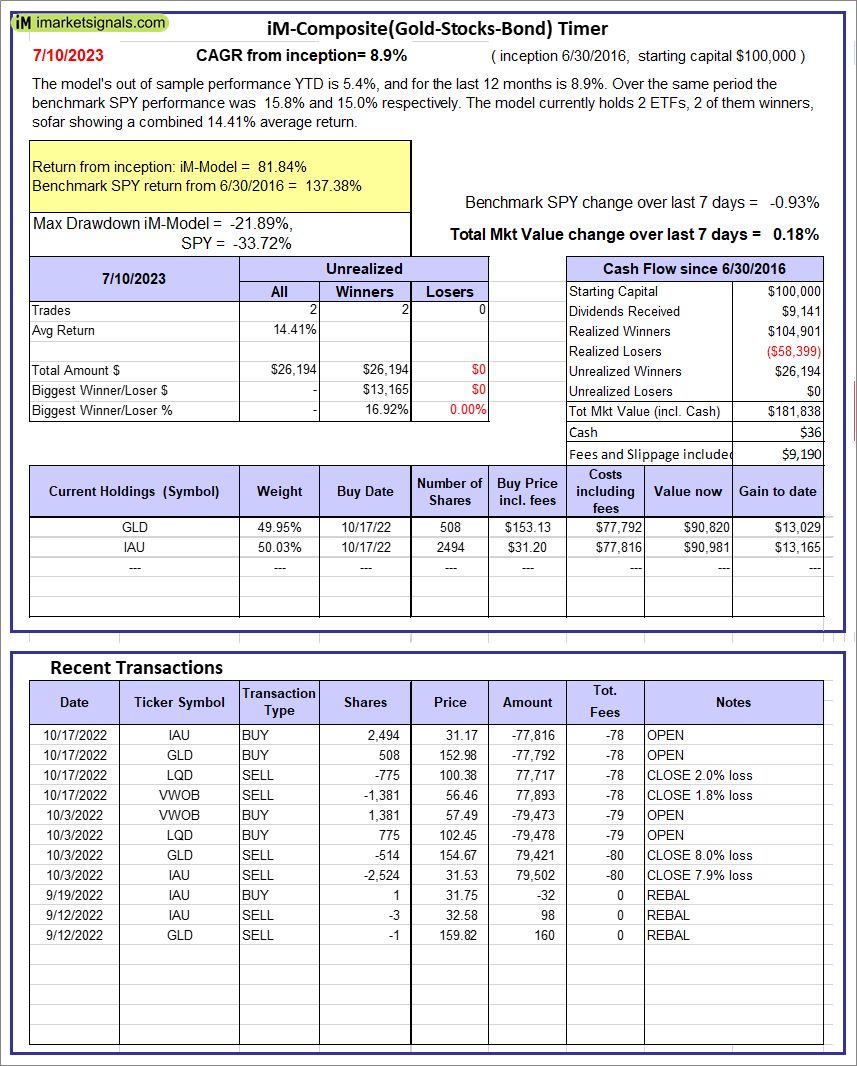 |
iM-Composite(Gold-Stocks-Bond) Timer: The model’s out of sample performance YTD is 5.4%, and for the last 12 months is 8.9%. Over the same period the benchmark SPY performance was 15.8% and 15.0% respectively. Over the previous week the market value of the iM-Composite(Gold-Stocks-Bond) Timer gained 0.18% at a time when SPY gained -0.93%. A starting capital of $100,000 at inception on 6/30/2016 would have grown to $181,838 which includes $36 cash and excludes $9,190 spent on fees and slippage. |
iM-Best Reports – 7/10/2023
Posted in pmp SPY-SH
Leave a Reply
You must be logged in to post a comment.