
  |
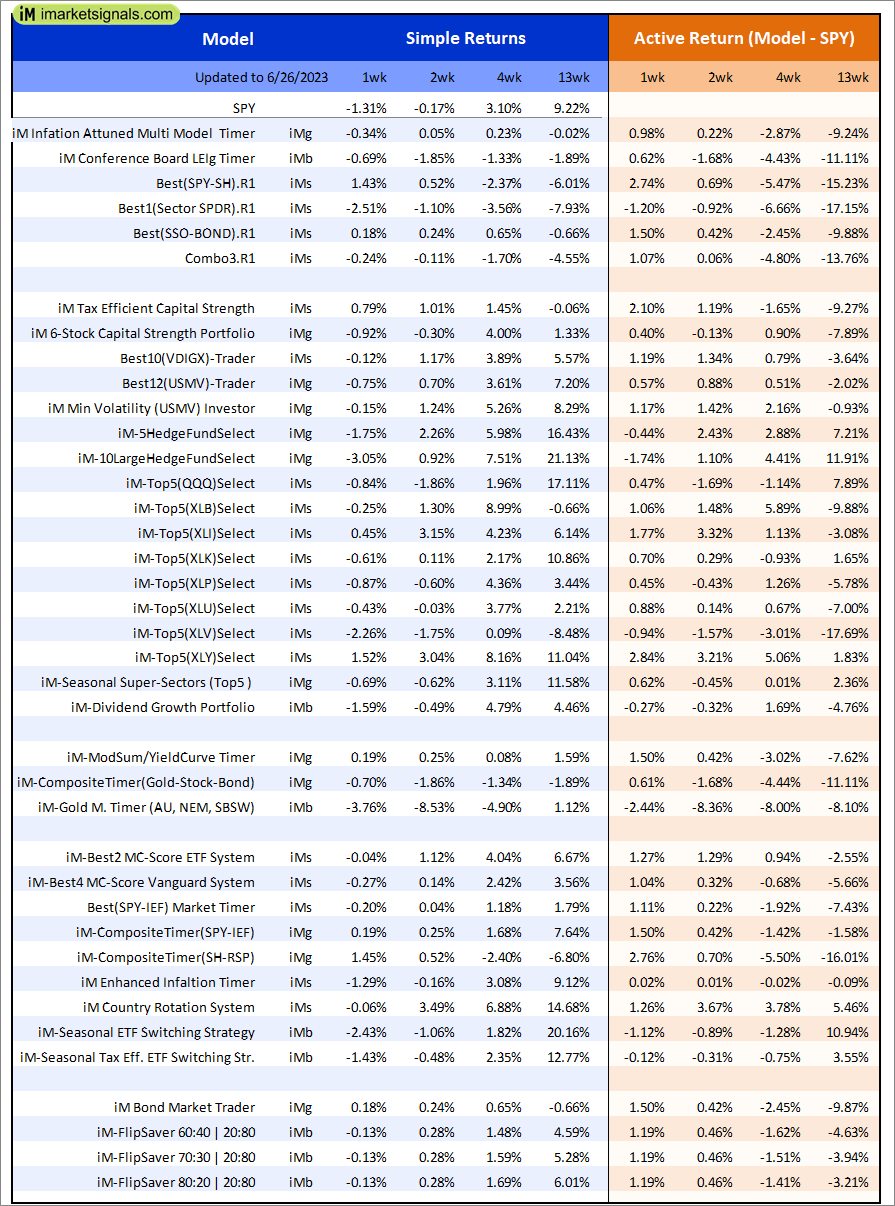
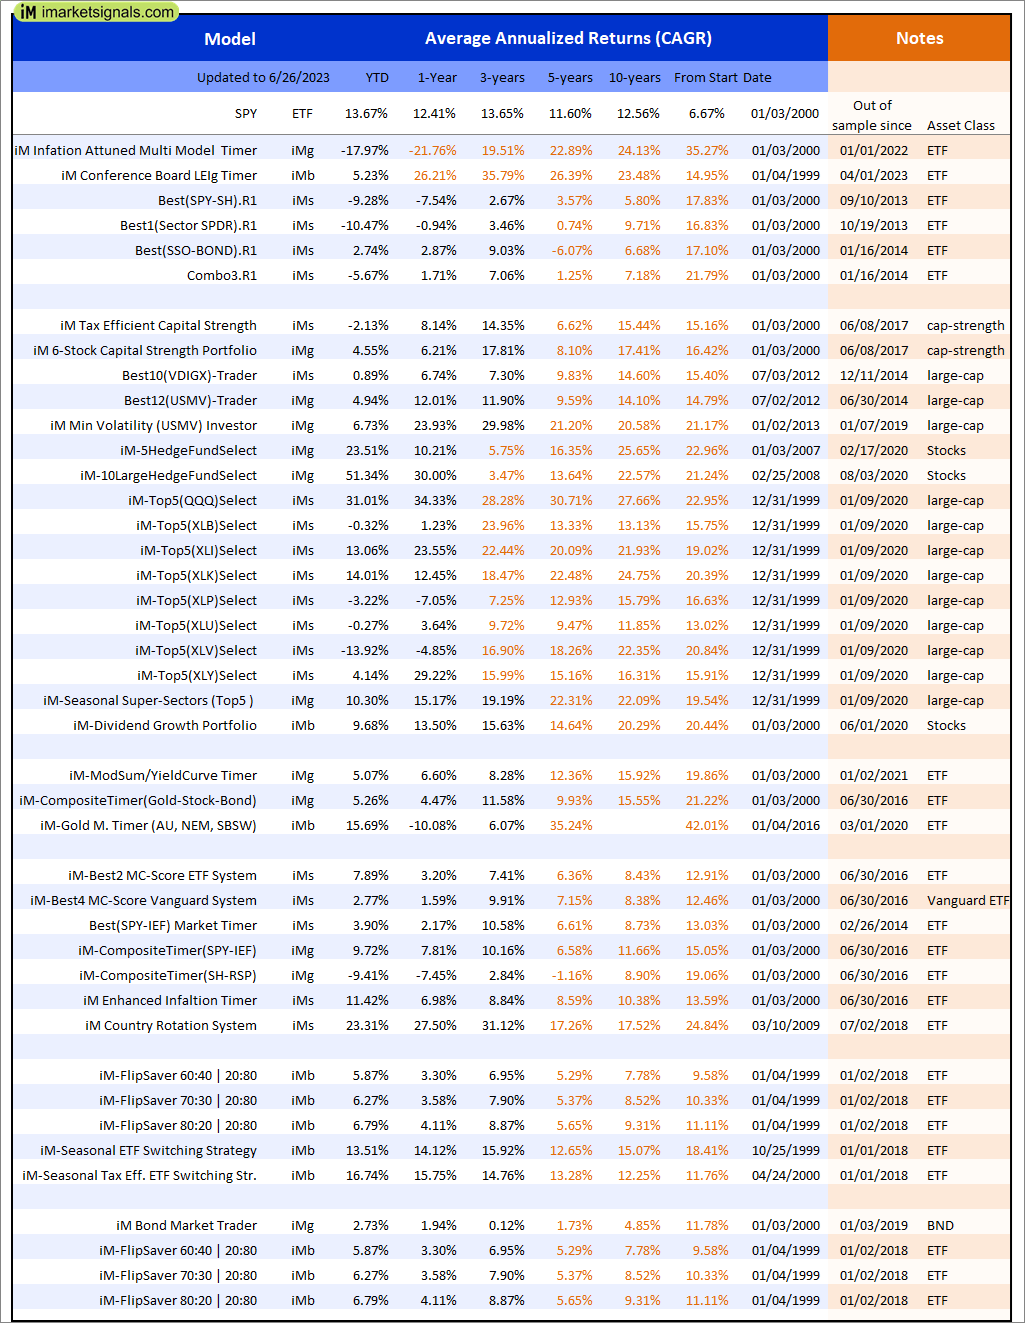
Out of sample performance summary of our models for the past 1, 2, 4 and 13 week periods. The active active return indicates how the models over- or underperformed the benchmark ETF SPY. Also the YTD, and the 1-, 3-, 5- and 10-year annualized returns are shown in the second table |
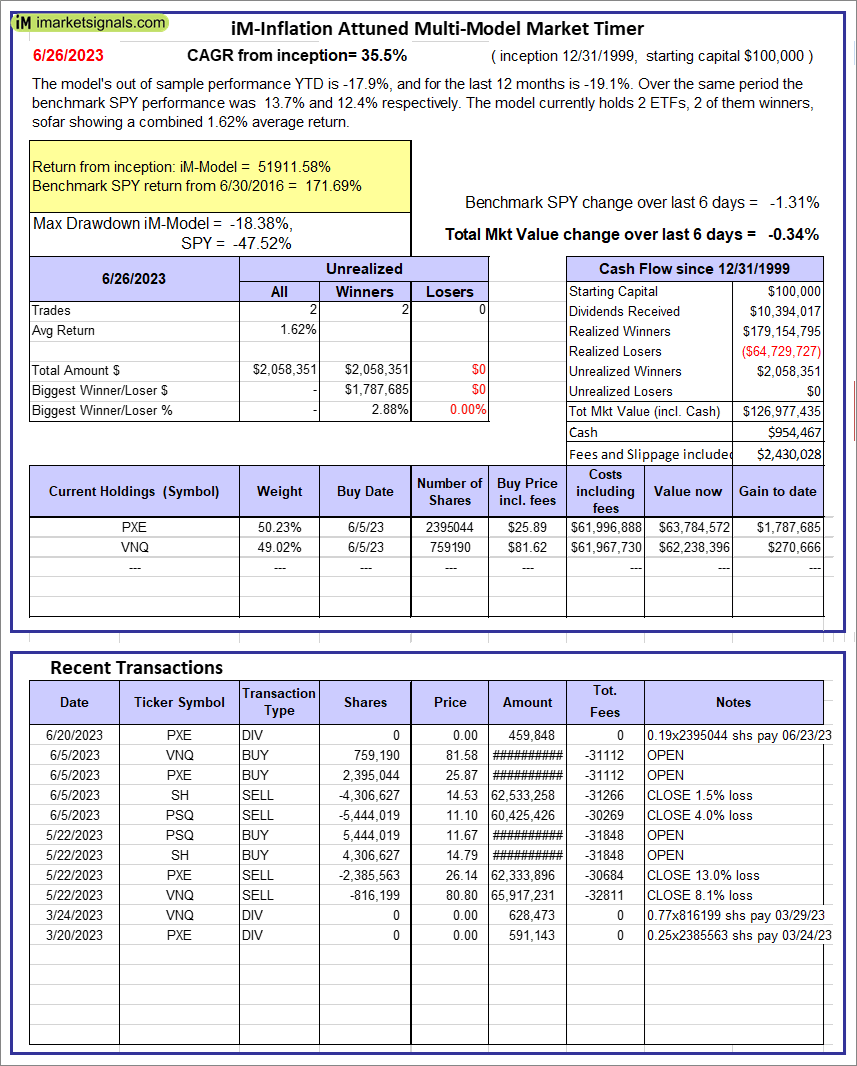 |
iM-Inflation Attuned Multi-Model Market Timer: The model’s out of sample performance YTD is -17.9%, and for the last 12 months is -19.1%. Over the same period the benchmark SPY performance was 13.7% and 12.4% respectively. Over the previous week the market value of the iM-Inflation Attuned Multi-Model Market Timer gained -0.34% at a time when SPY gained -1.31%. A starting capital of $100,000 at inception on 3/24/2017 would have grown to $126,977,435 which includes $954,467 cash and excludes $2,430,028 spent on fees and slippage. |
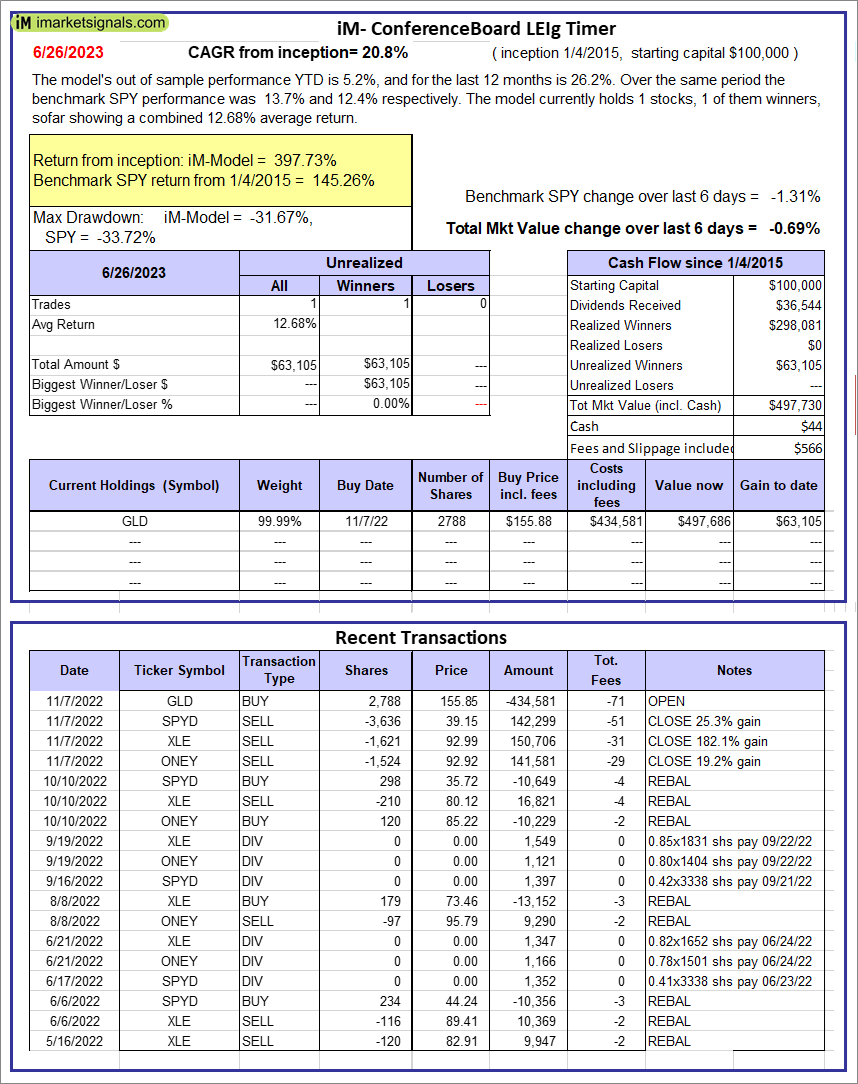 |
iM-Conference Board LEIg Timer: The model’s performance YTD is 14.3%, and for the last 12 months is 7.3%. Over the same period the benchmark SPY performance was 20.1% and 9.4% respectively. Over the previous week the market value of the iM-Conference Board LEIg Timer gained -0.69% at a time when SPY gained -1.31%. A starting capital of $100,000 at inception on 4/5/2017 would have grown to $497,730 which includes $44 cash and excludes $566 spent on fees and slippage. |
 |
iM-FlipSaver 60:40 | 20:80 – 2017: The model’s out of sample performance YTD is 5.8%, and for the last 12 months is 3.0%. Over the same period the benchmark E60B40 performance was 9.3% and 7.8% respectively. Over the previous week the market value of iM-FlipSaver 80:20 | 20:80 gained -0.13% at a time when SPY gained -0.75%. A starting capital of $100,000 at inception on 7/16/2015 would have grown to $149,108 which includes -$53 cash and excludes $3,255 spent on fees and slippage. |
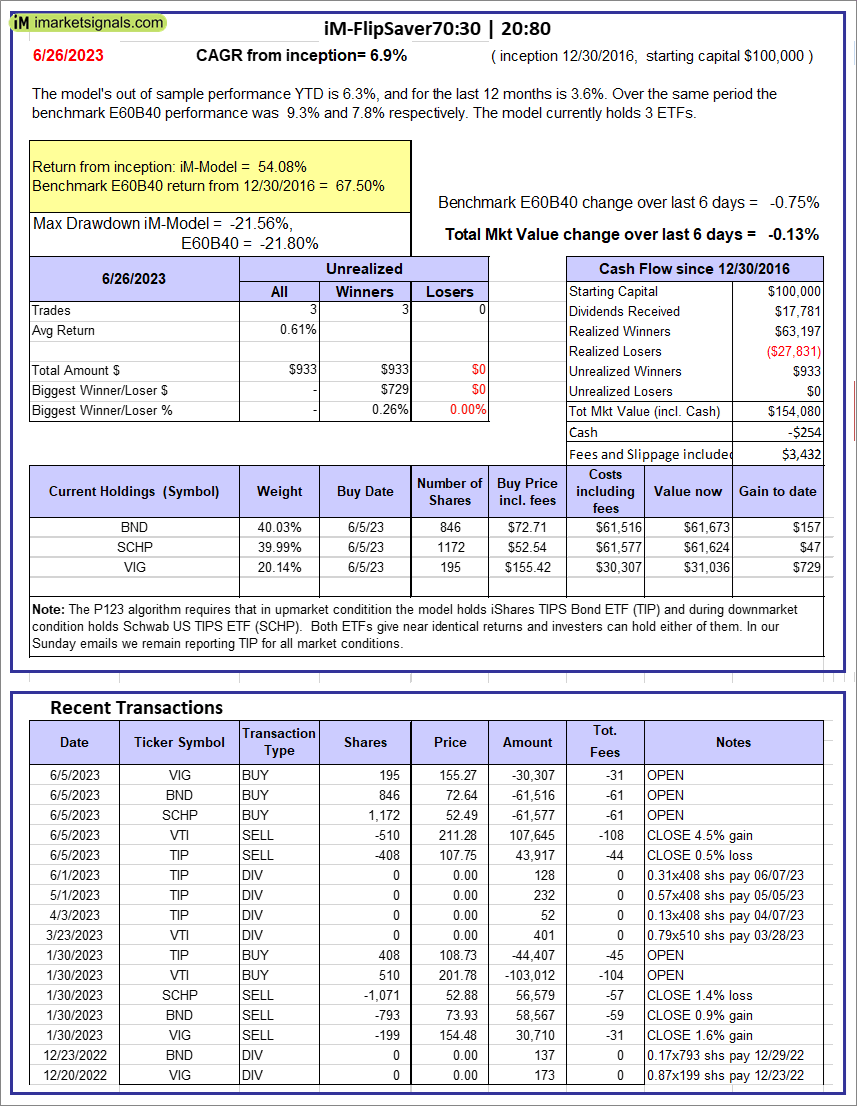 |
iM-FlipSaver 70:30 | 20:80 – 2017: The model’s out of sample performance YTD is 6.3%, and for the last 12 months is 3.6%. Over the same period the benchmark E60B40 performance was 9.3% and 7.8% respectively. Over the previous week the market value of iM-FlipSaver 70:30 | 20:80 gained -0.13% at a time when SPY gained -0.75%. A starting capital of $100,000 at inception on 7/15/2015 would have grown to $154,080 which includes -$254 cash and excludes $3,432 spent on fees and slippage. |
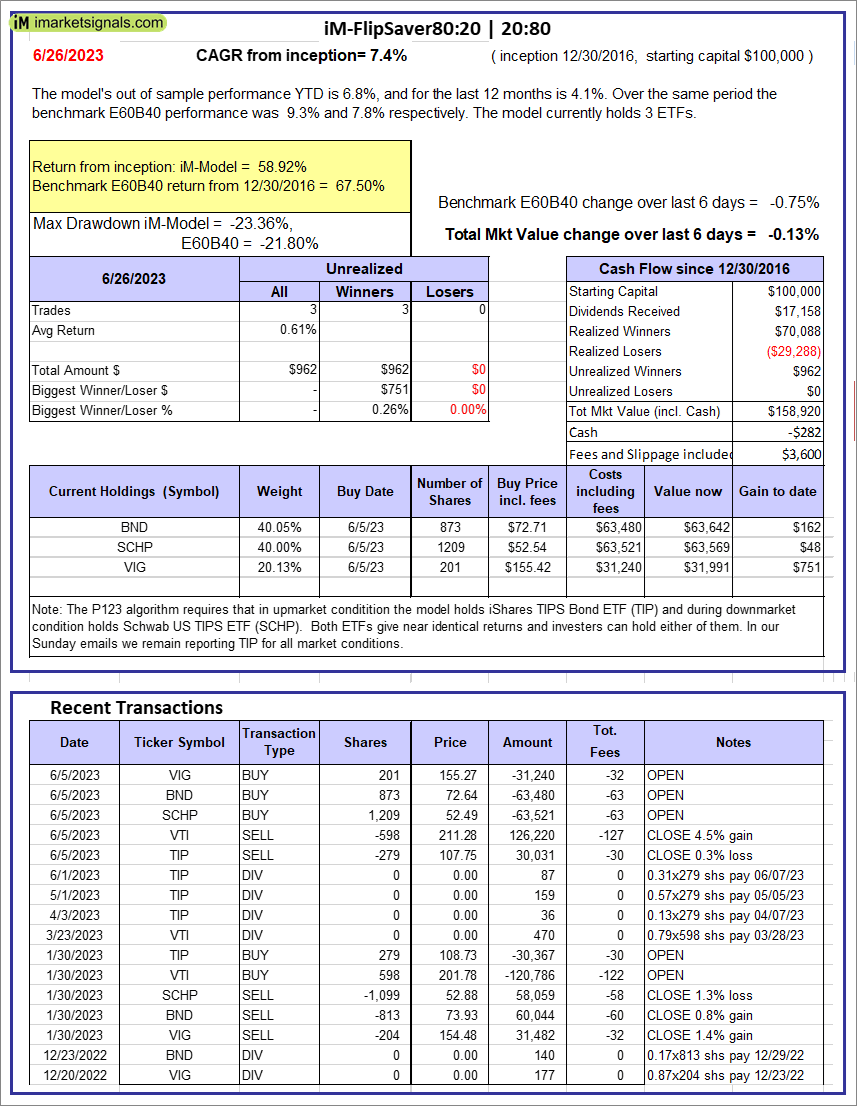 |
iM-FlipSaver 80:20 | 20:80 – 2017: The model’s out of sample performance YTD is 6.8%, and for the last 12 months is 4.1%. Over the same period the benchmark E60B40 performance was 9.3% and 7.8% respectively. Over the previous week the market value of iM-FlipSaver 80:20 | 20:80 gained -0.13% at a time when SPY gained -0.75%. A starting capital of $100,000 at inception on 1/2/2017 would have grown to $158,920 which includes -$282 cash and excludes $3,600 spent on fees and slippage. |
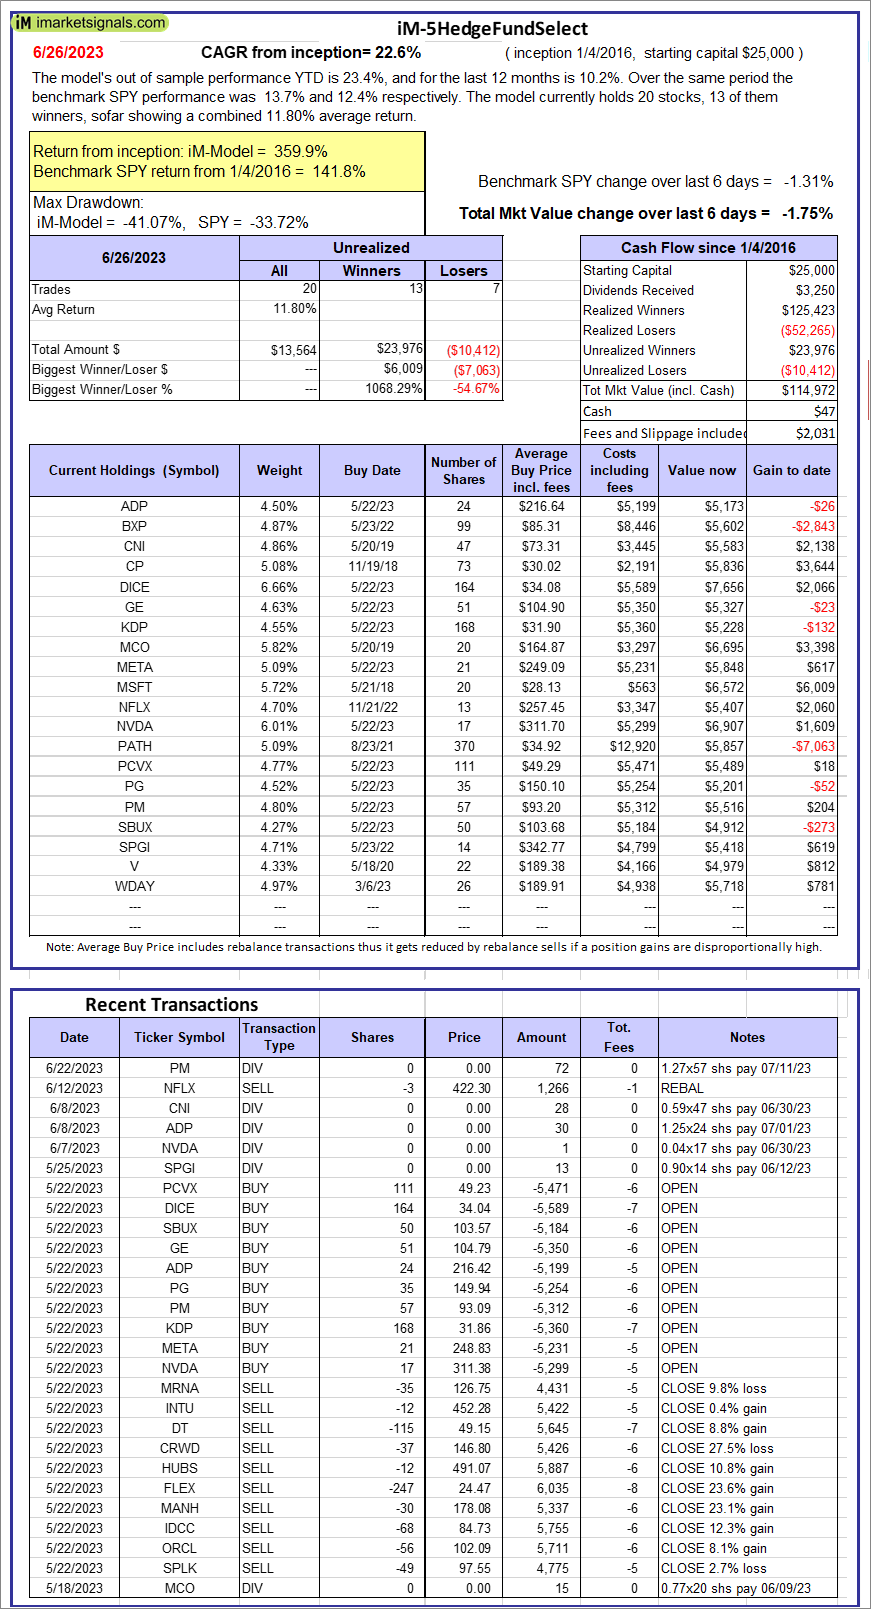 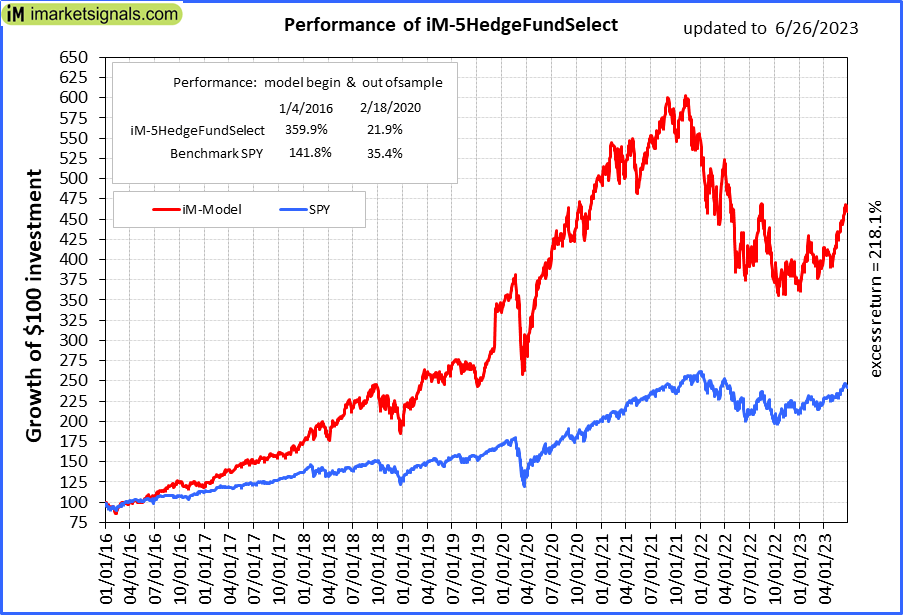 |
iM-5HedgeFundSelect: Since inception, on 1/5/2016, the model gained 359.89% while the benchmark SPY gained 141.83% over the same period. Over the previous week the market value of iM-5HedgeFundSelect gained -1.75% at a time when SPY gained -1.31%. A starting capital of $25,000 at inception on 1/5/2016 would have grown to $114,972 which includes $47 cash and excludes $2,031 spent on fees and slippage. |
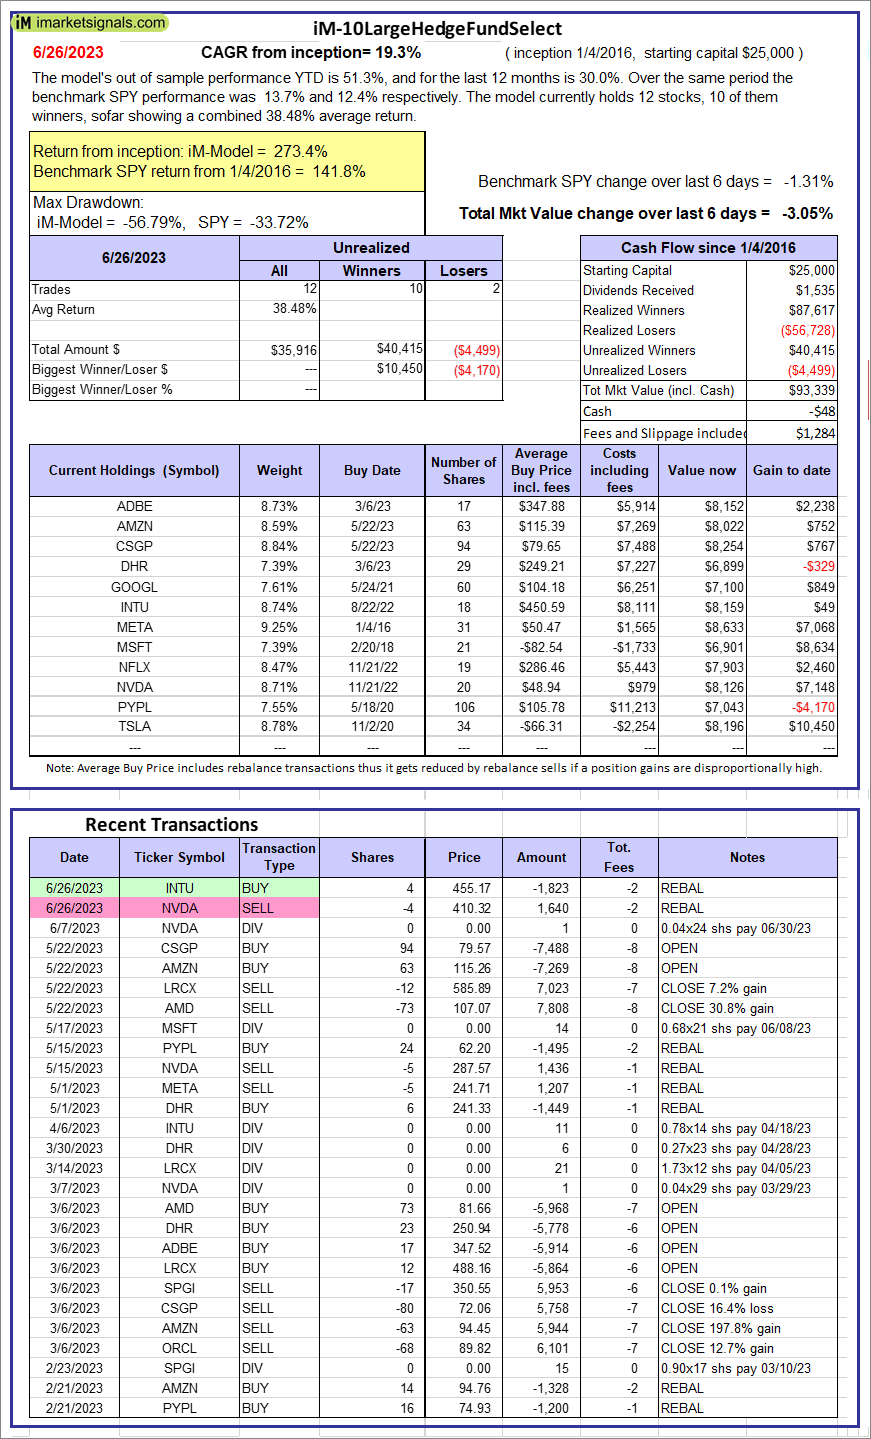 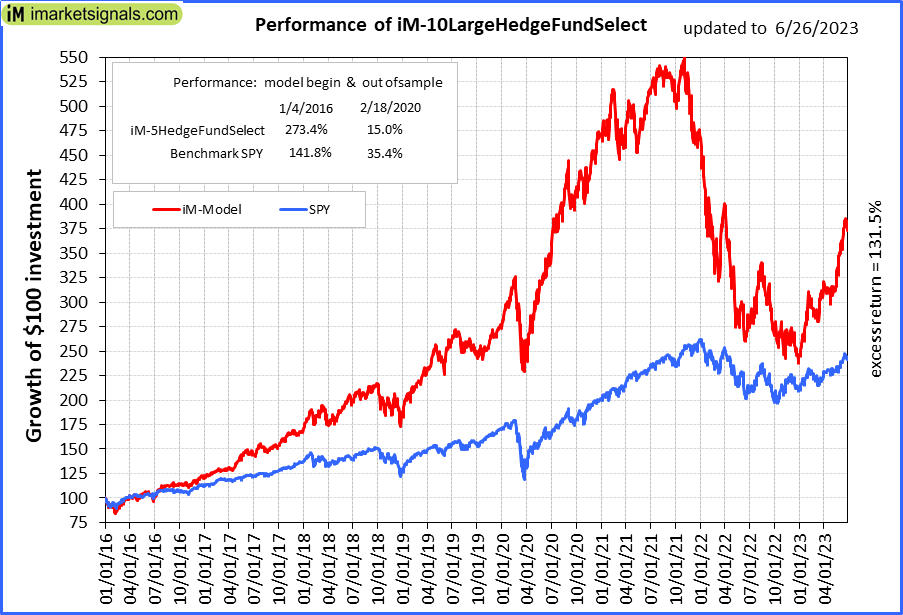 |
iM-10LargeHedgeFundSelect: Since inception, on 1/5/2016, the model gained 273.36% while the benchmark SPY gained 141.83% over the same period. Over the previous week the market value of iM-10LargeHedgeFundSelect gained -3.05% at a time when SPY gained -1.31%. A starting capital of $25,000 at inception on 1/5/2016 would have grown to $93,339 which includes -$48 cash and excludes $1,284 spent on fees and slippage. |
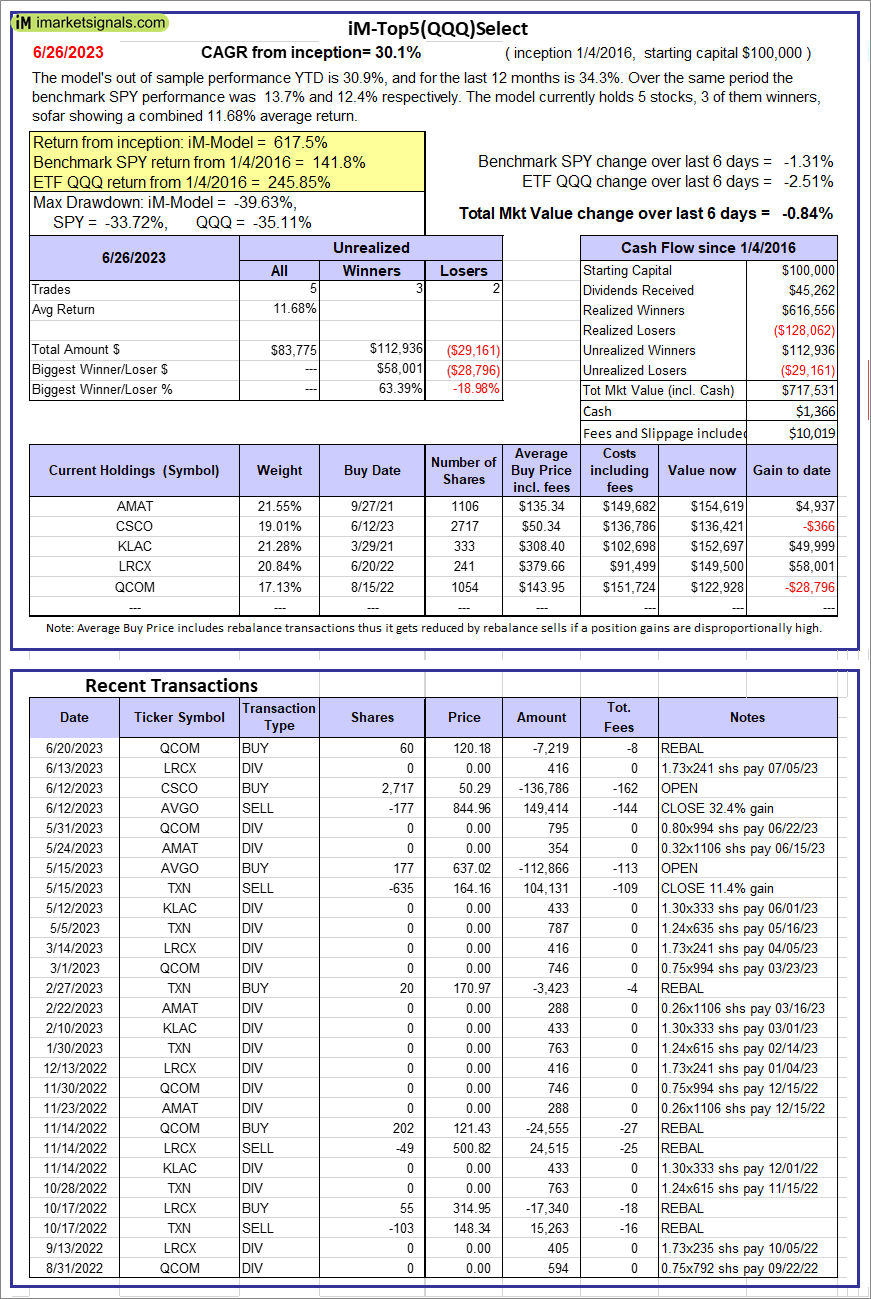 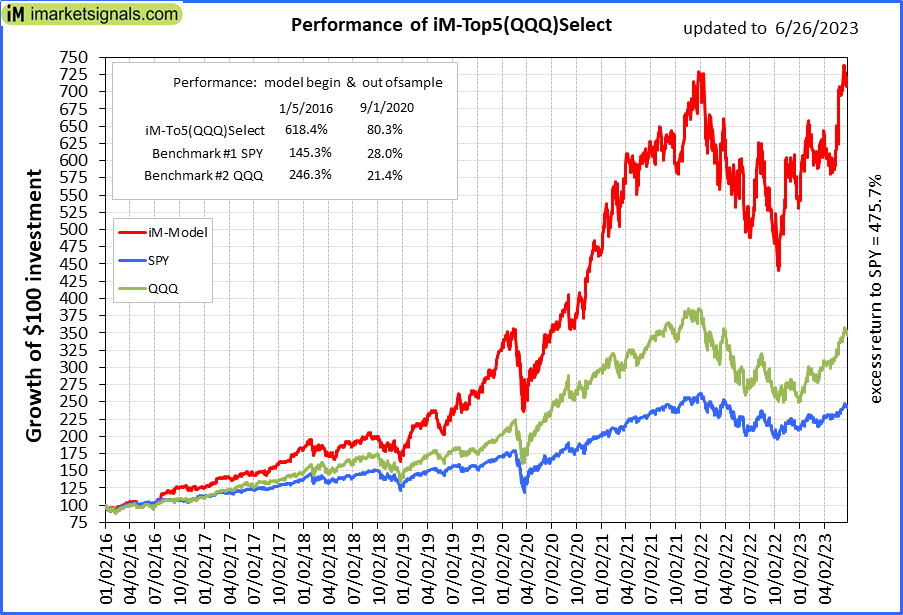 |
iM-Top5(QQQ)Select: Since inception, on 1/5/2016, the model gained 617.53% while the benchmark SPY gained 141.83% over the same period. Over the previous week the market value of iM-Top5(QQQ)Select gained -0.84% at a time when SPY gained -1.31%. A starting capital of $100,000 at inception on 1/5/2016 would have grown to $717,531 which includes $1,366 cash and excludes $10,019 spent on fees and slippage. |
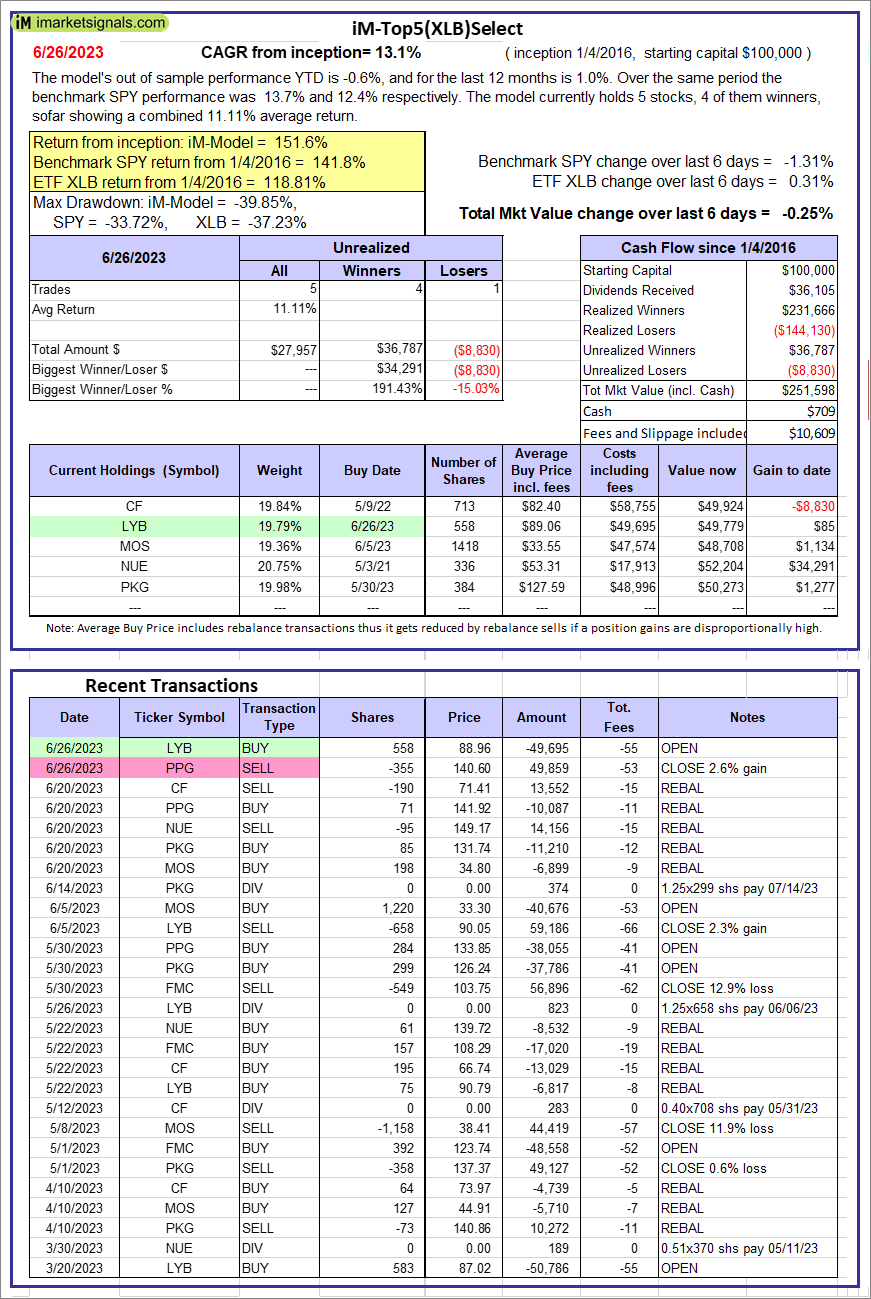 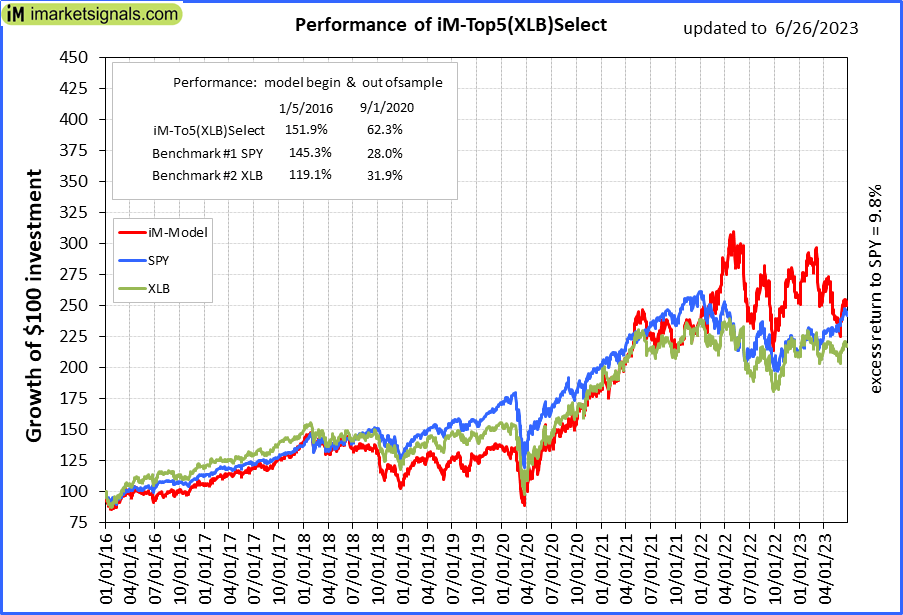 |
iM-Top5(XLB)Select: Since inception, on 1/5/2016, the model gained 151.60% while the benchmark SPY gained 141.83% over the same period. Over the previous week the market value of iM-Top5(XLB)Select gained -0.25% at a time when SPY gained -1.31%. A starting capital of $100,000 at inception on 1/5/2016 would have grown to $251,598 which includes $709 cash and excludes $10,609 spent on fees and slippage. |
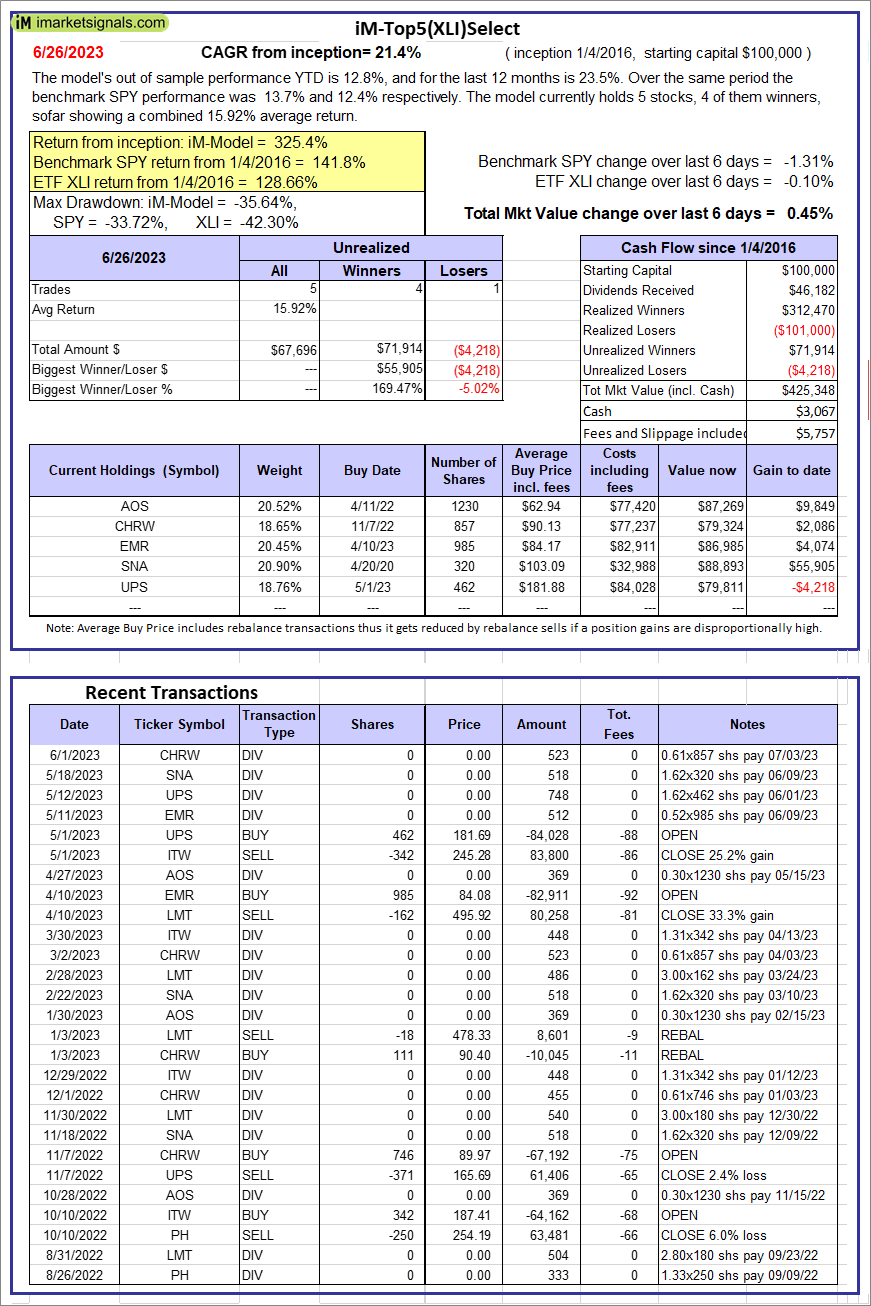 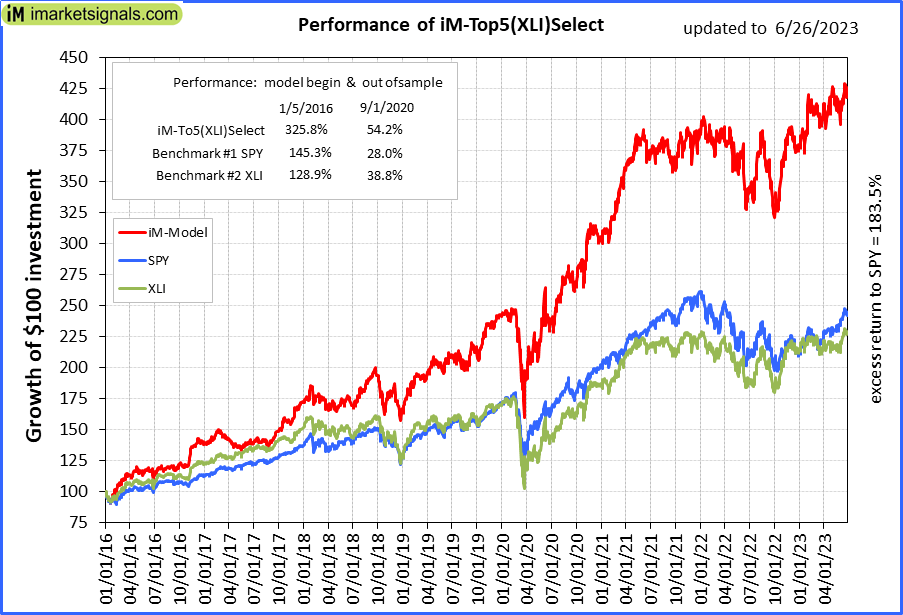 |
iM-Top5(XLI)Select: Since inception, on 1/5/2016, the model gained 325.35% while the benchmark SPY gained 141.83% over the same period. Over the previous week the market value of iM-Top5(XLI)Select gained 0.45% at a time when SPY gained -1.31%. A starting capital of $100,000 at inception on 1/5/2016 would have grown to $425,348 which includes $3,067 cash and excludes $5,757 spent on fees and slippage. |
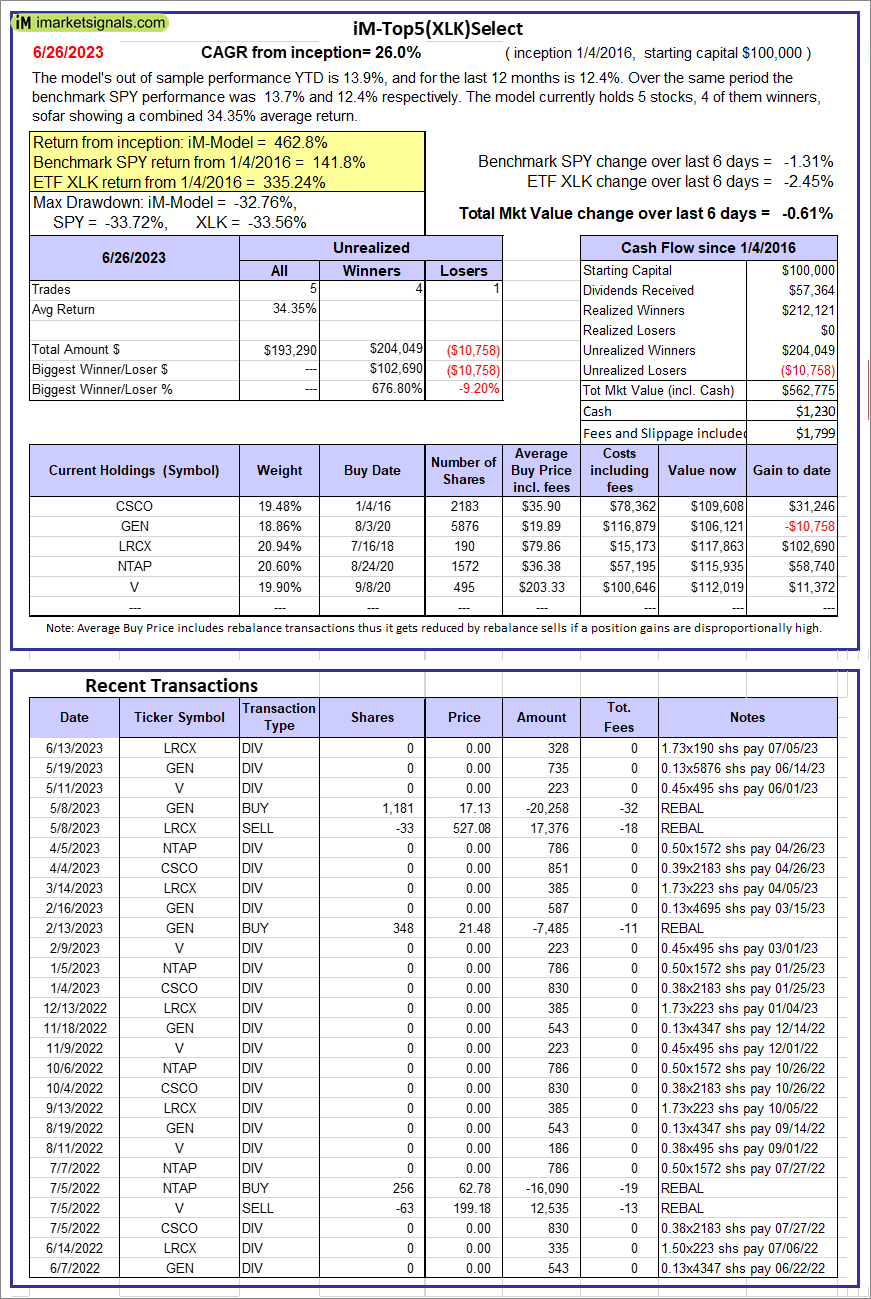 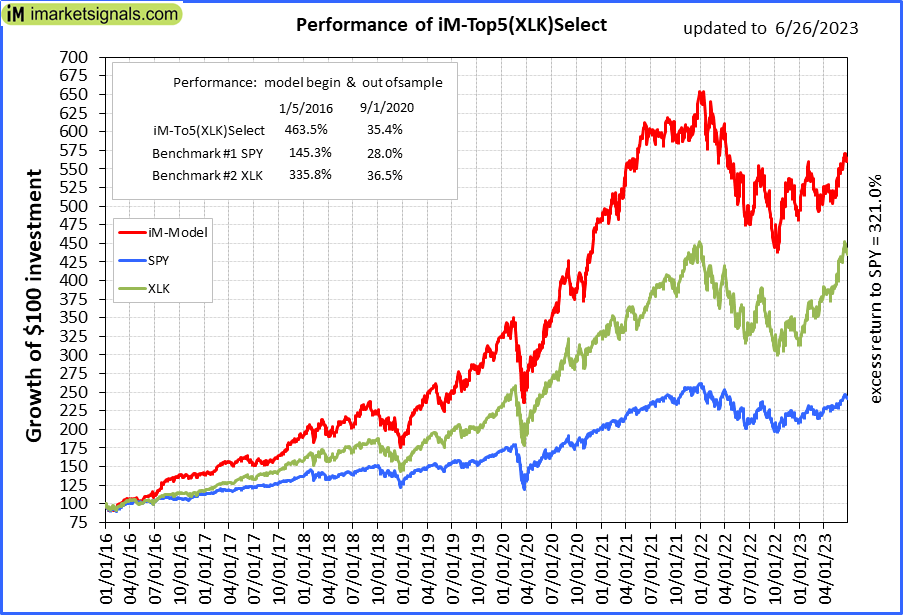 |
iM-Top5(XLK)Select: Since inception, on 1/5/2016, the model gained 462.78% while the benchmark SPY gained 141.83% over the same period. Over the previous week the market value of iM-Top5(XLK)Select gained -0.61% at a time when SPY gained -1.31%. A starting capital of $100,000 at inception on 1/5/2016 would have grown to $562,775 which includes $1,230 cash and excludes $1,799 spent on fees and slippage. |
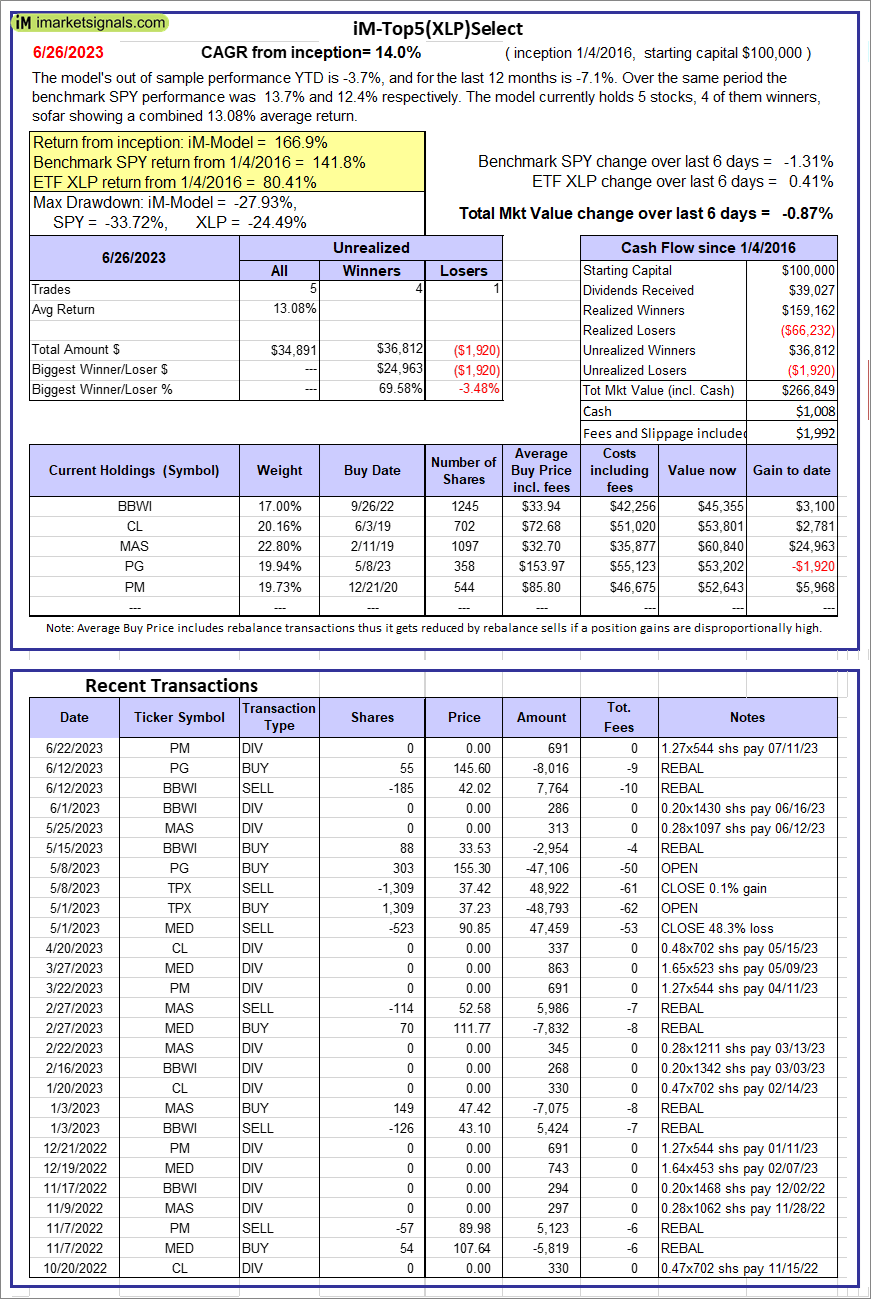 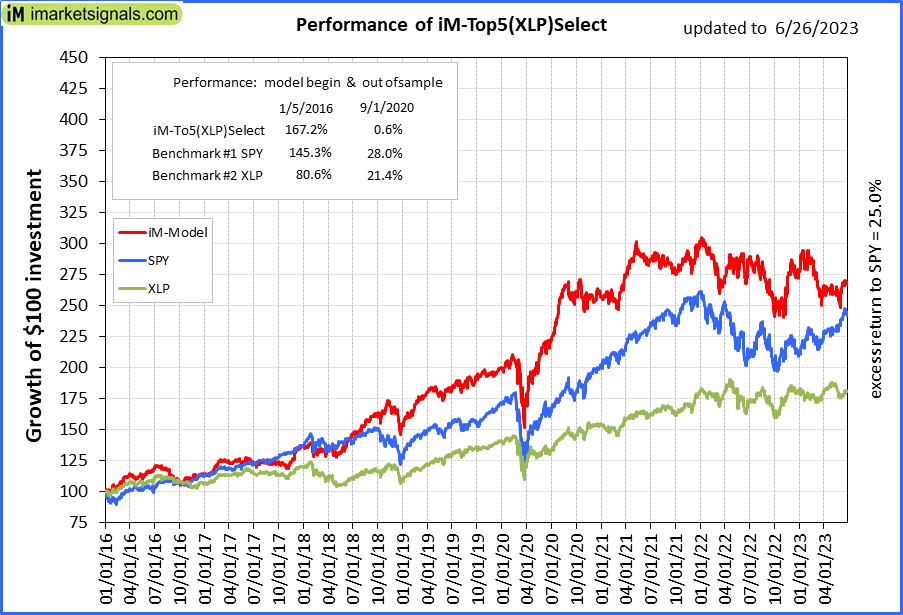 |
iM-Top5(XLP)Select: Since inception, on 1/5/2016, the model gained 166.85% while the benchmark SPY gained 141.83% over the same period. Over the previous week the market value of iM-Top5(XLP)Select gained -0.87% at a time when SPY gained -1.31%. A starting capital of $100,000 at inception on 1/5/2016 would have grown to $266,849 which includes $1,008 cash and excludes $1,992 spent on fees and slippage. |
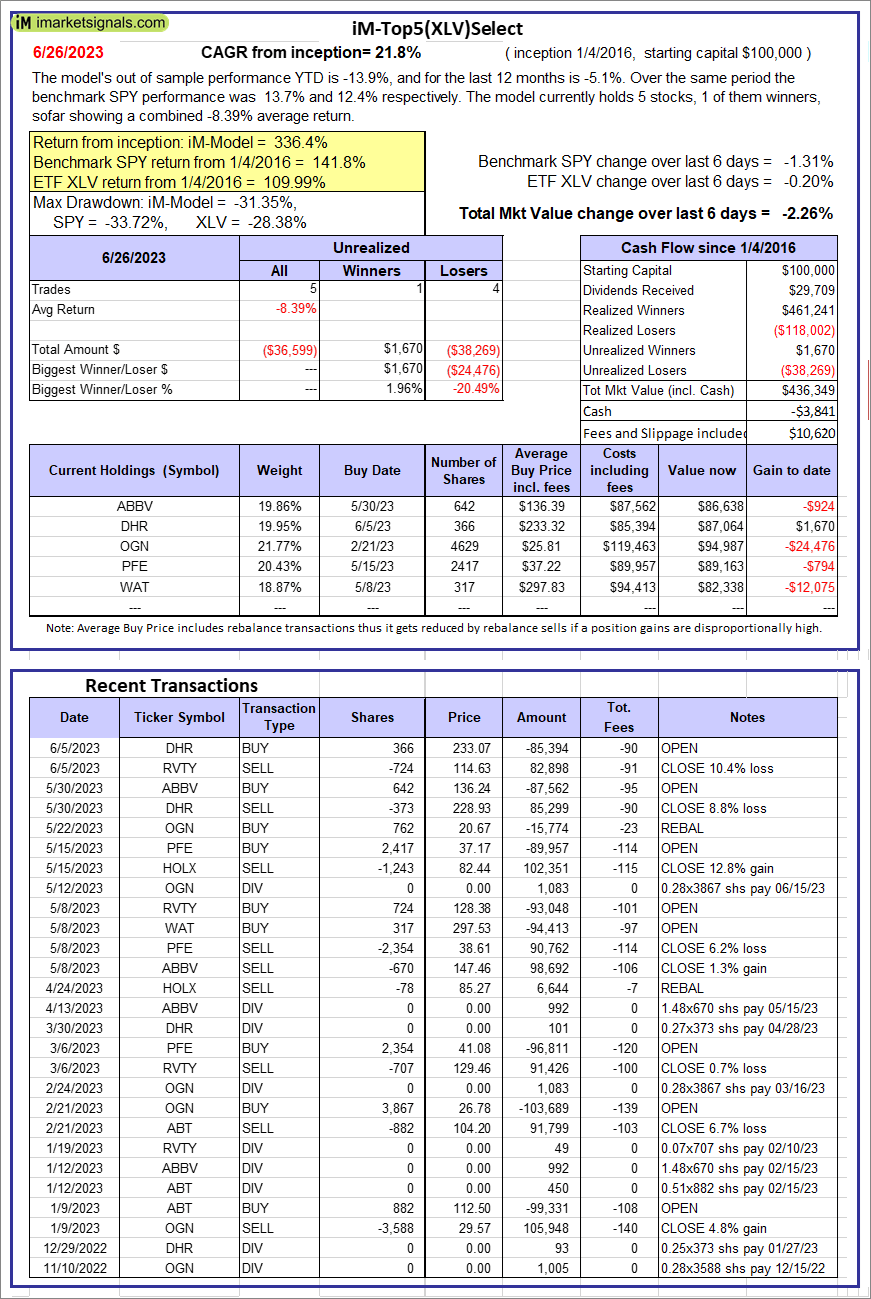 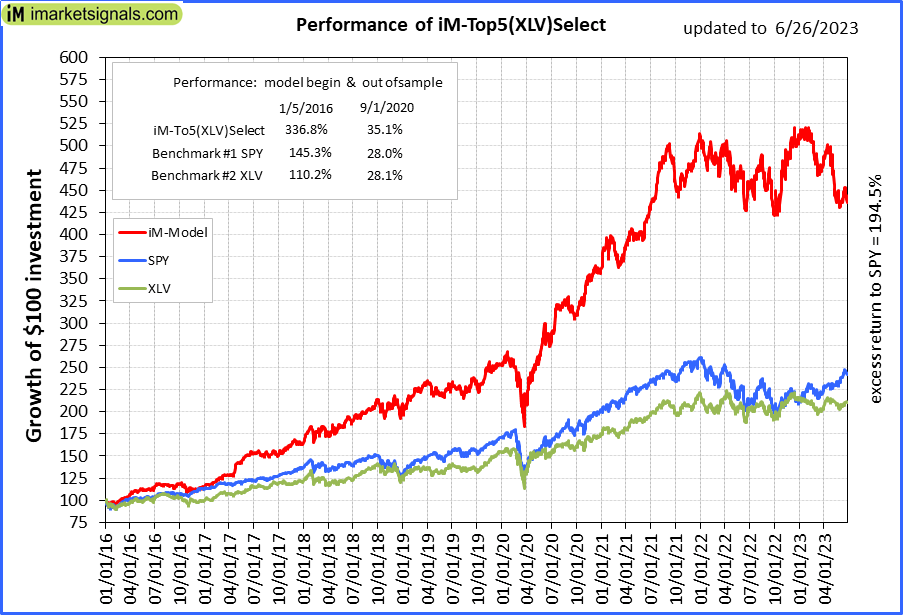 |
iM-Top5(XLV)Select: Since inception, on 1/5/2016, the model gained 336.35% while the benchmark SPY gained 141.83% over the same period. Over the previous week the market value of iM-Top5(XLV)Select gained -2.26% at a time when SPY gained -1.31%. A starting capital of $100,000 at inception on 1/5/2016 would have grown to $436,349 which includes -$3,841 cash and excludes $10,620 spent on fees and slippage. |
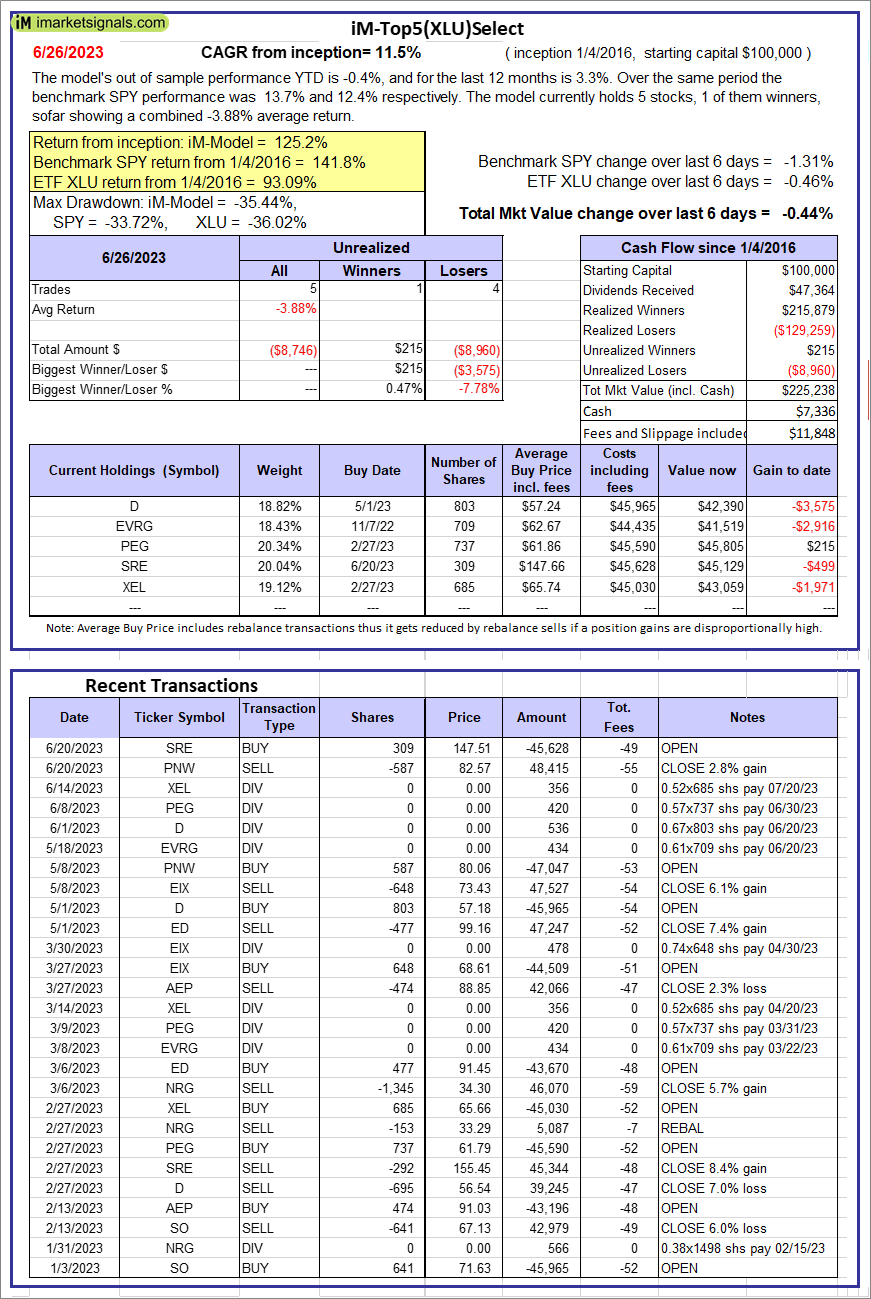 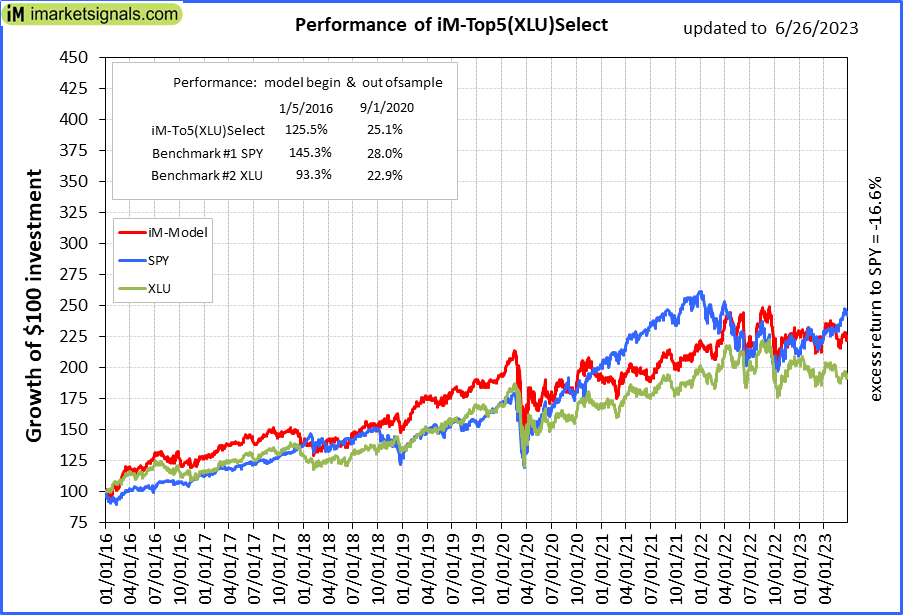 |
iM-Top5(XLU)Select: Since inception, on 1/5/2016, the model gained 125.24% while the benchmark SPY gained 141.83% over the same period. Over the previous week the market value of iM-Top5(XLU)Select gained -0.44% at a time when SPY gained -1.31%. A starting capital of $100,000 at inception on 1/5/2016 would have grown to $225,238 which includes $7,336 cash and excludes $11,848 spent on fees and slippage. |
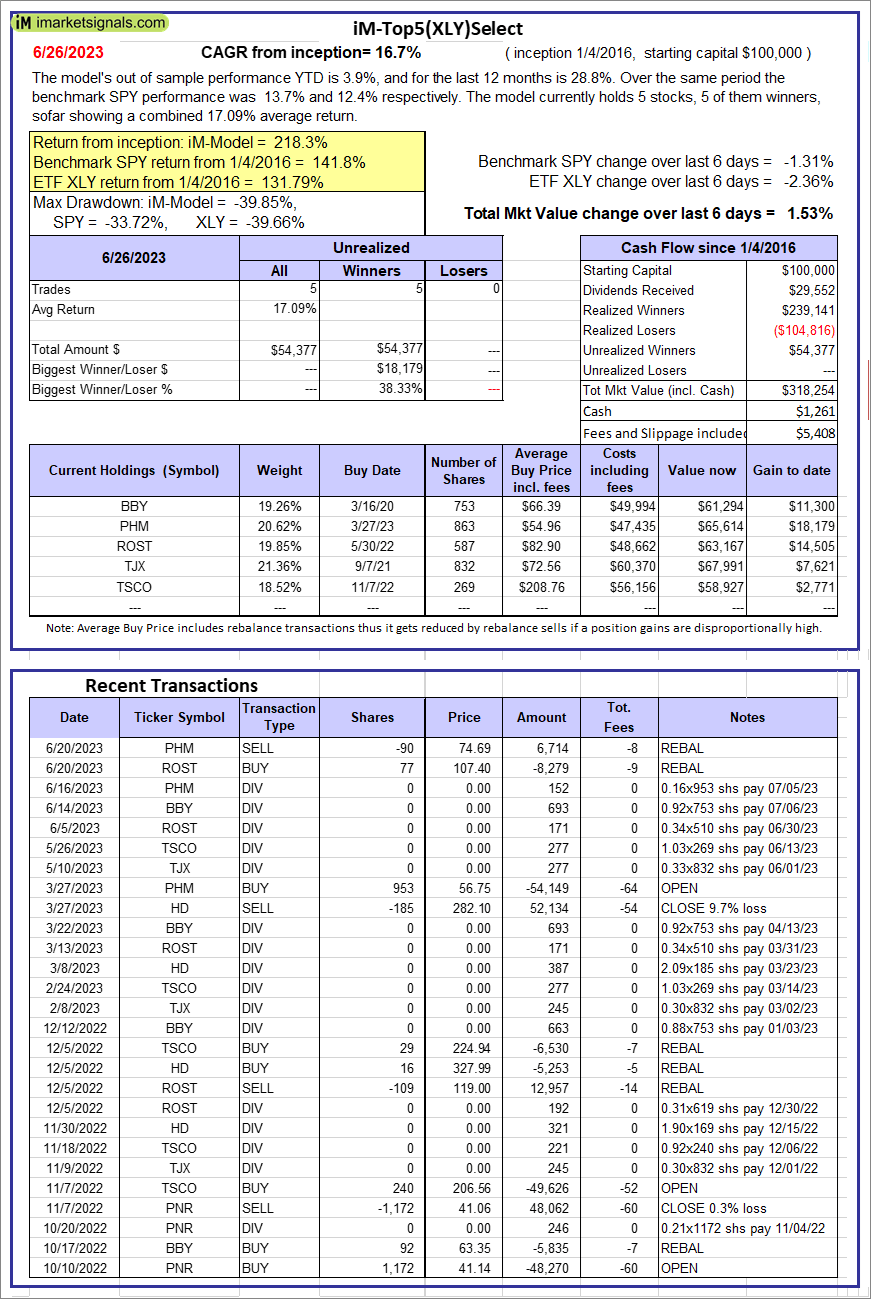 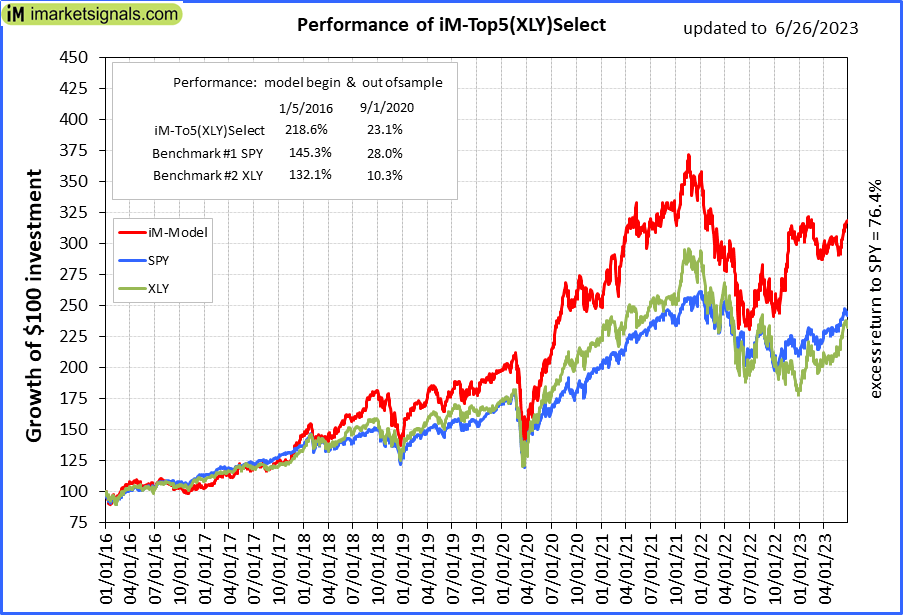 |
iM-Top5(XLY)Select: Since inception, on 1/5/2016, the model gained 218.25% while the benchmark SPY gained 141.83% over the same period. Over the previous week the market value of iM-Top5(XLY)Select gained 1.53% at a time when SPY gained -1.31%. A starting capital of $100,000 at inception on 1/5/2016 would have grown to $318,254 which includes $1,261 cash and excludes $5,408 spent on fees and slippage. |
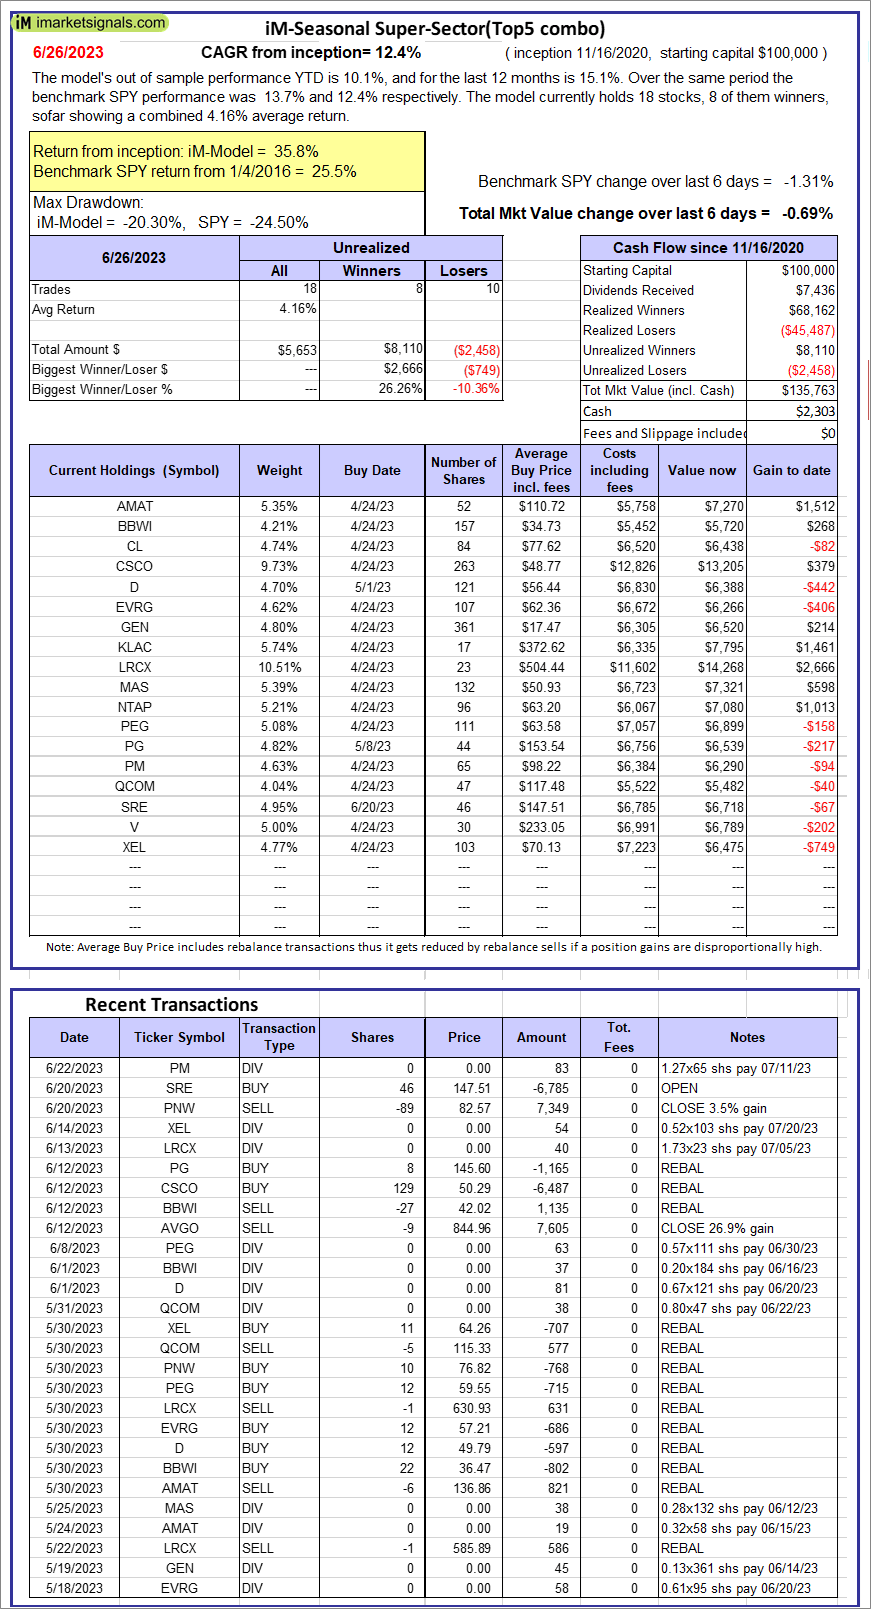 |
iM-Seasonal Super-Sectors (Top5 combo) : Since inception, on 11/17/2020, the model gained 35.76% while the benchmark SPY gained 25.54% over the same period. Over the previous week the market value of iM-Seasonal Super-Sectors (Top5 combo) gained -0.69% at a time when SPY gained -1.31%. A starting capital of $100,000 at inception on 11/17/2020 would have grown to $135,763 which includes $2,303 cash and excludes $00 spent on fees and slippage. |
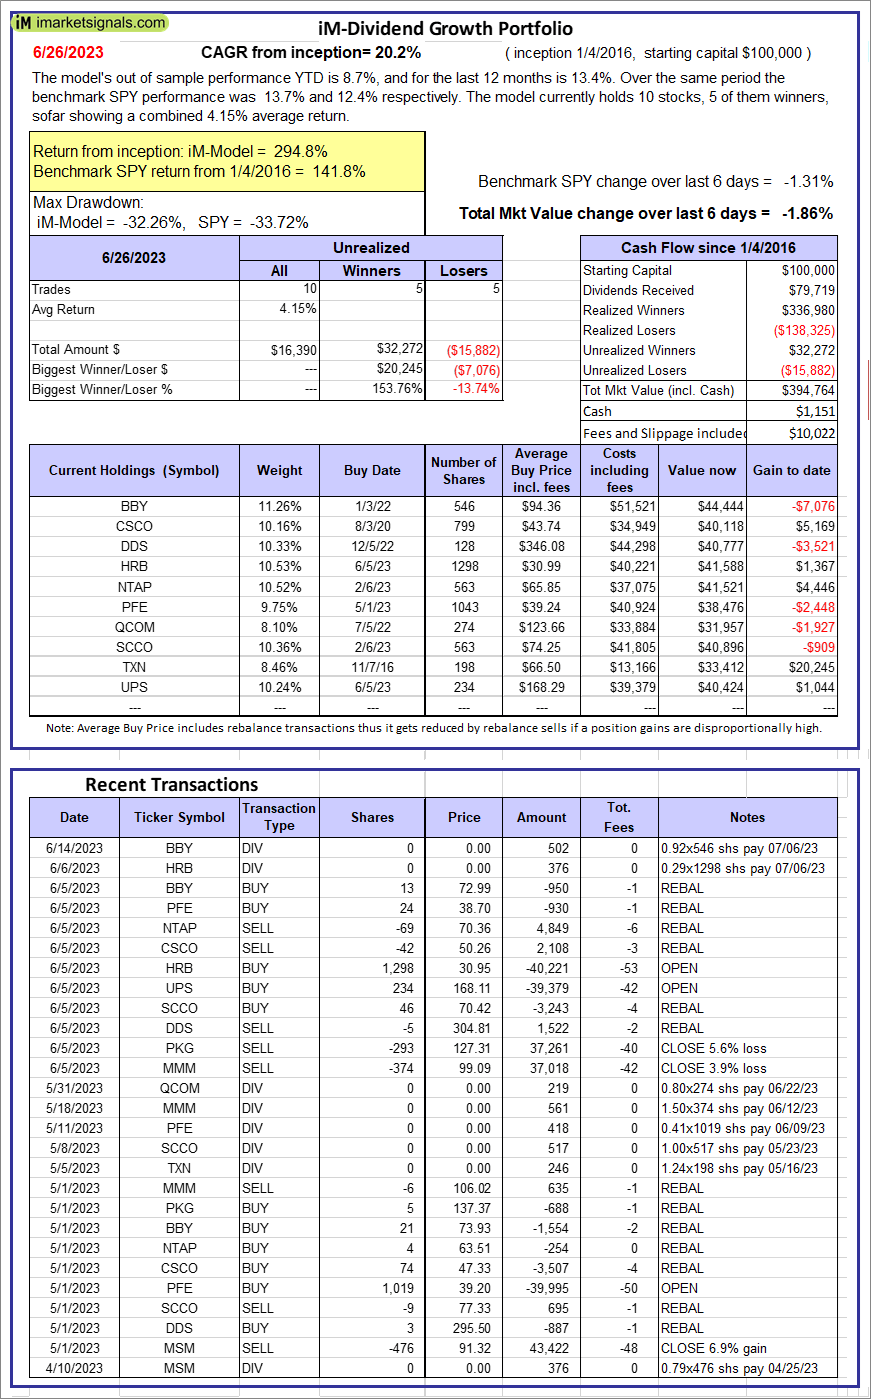 |
iM-Dividend Growth Portfolio: The model’s out of sample performance YTD is 8.7%, and for the last 12 months is 13.4%. Over the same period the benchmark SPY performance was 13.7% and 12.4% respectively. Over the previous week the market value of the iM-Dividend Growth Portfolio gained -1.86% at a time when SPY gained -1.31%. A starting capital of $100,000 at inception on 6/30/2016 would have grown to $394,764 which includes $1,151 cash and excludes $10,022 spent on fees and slippage. |
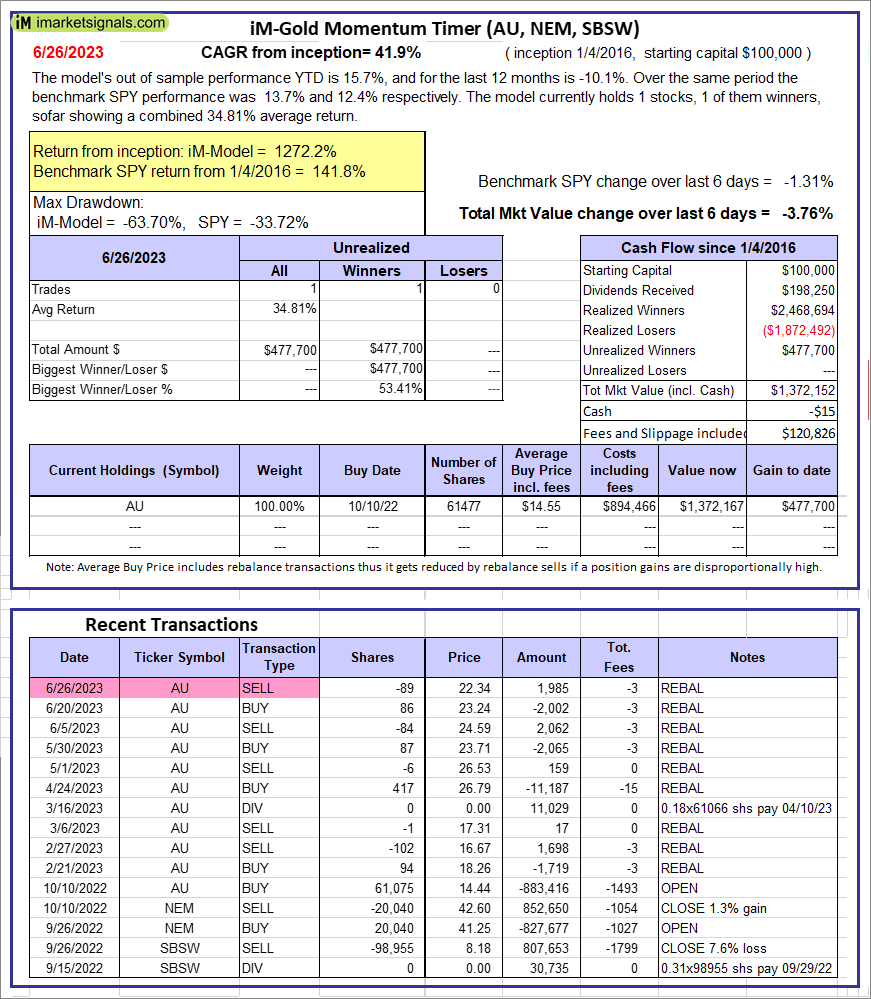 |
iM-Gold Momentum Timer (AU, NEM, SBSW): The model’s out of sample performance YTD is 15.7%, and for the last 12 months is -10.1%. Over the same period the benchmark SPY performance was 13.7% and 12.4% respectively. Over the previous week the market value of iM-Gold Momentum Timer (AU, NEM, SBSW) gained -3.76% at a time when SPY gained -1.31%. A starting capital of $100,000 at inception on 6/30/2016 would have grown to -$15 which includes $120,826 cash and excludes Gain to date spent on fees and slippage. |
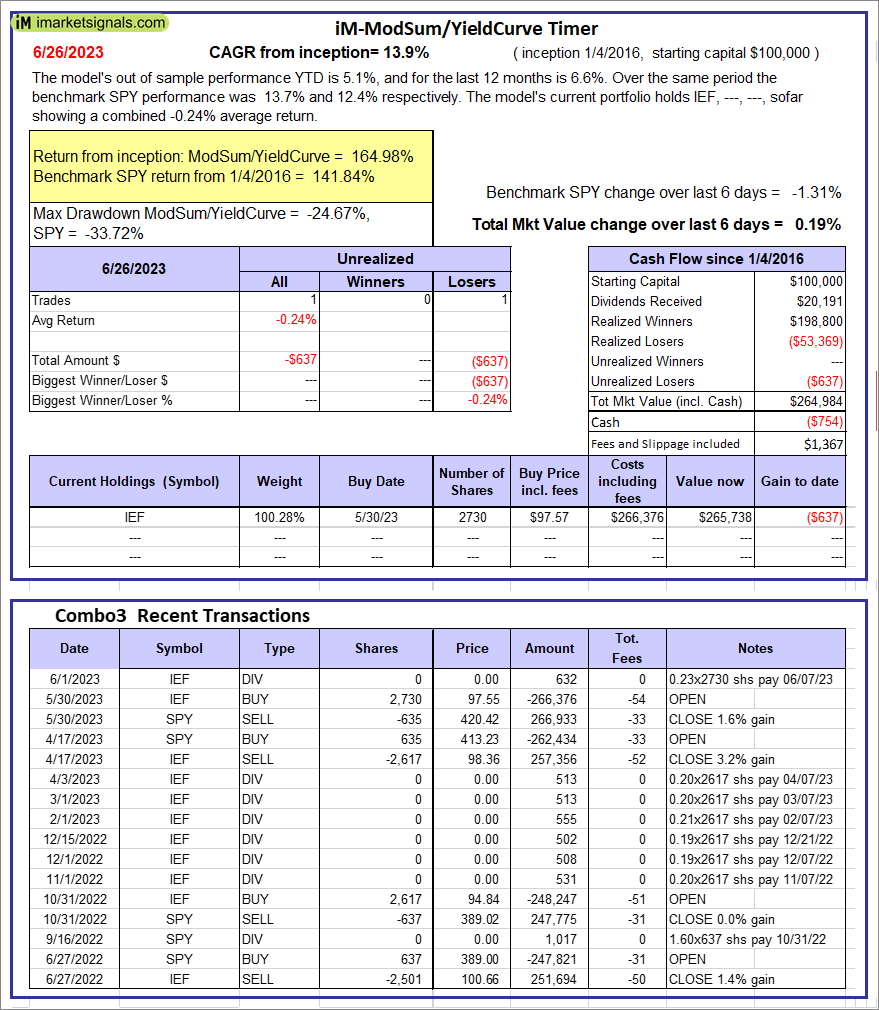 |
iM-ModSum/YieldCurve Timer: The model’s out of sample performance YTD is 5.1%, and for the last 12 months is 6.6%. Over the same period the benchmark SPY performance was 13.7% and 12.4% respectively. Over the previous week the market value of iM-PortSum/YieldCurve Timer gained 0.19% at a time when SPY gained -1.31%. A starting capital of $100,000 at inception on 1/1/2016 would have grown to $264,984 which includes -$754 cash and excludes $1,367 spent on fees and slippage. |
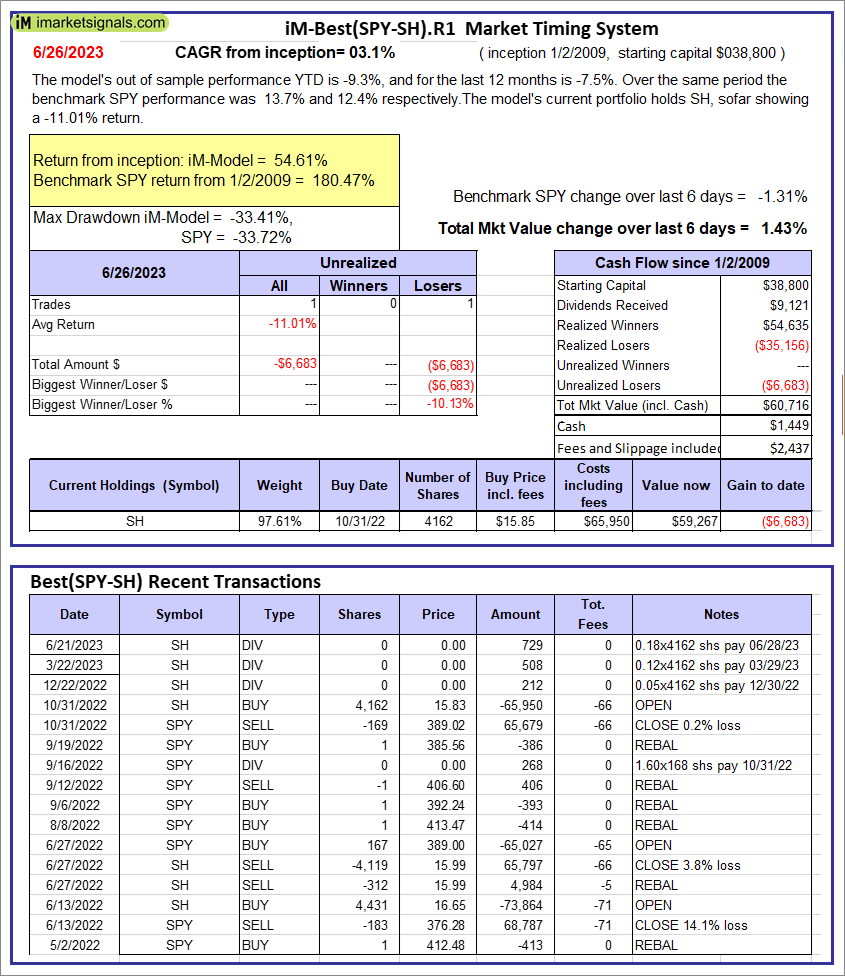 |
iM-Best(SPY-SH).R1: The model’s out of sample performance YTD is -9.3%, and for the last 12 months is -7.5%. Over the same period the benchmark SPY performance was 13.7% and 12.4% respectively. Over the previous week the market value of Best(SPY-SH) gained 1.43% at a time when SPY gained -1.31%. A starting capital of $100,000 at inception on 1/2/2009 would have grown to $60,716 which includes $1,449 cash and excludes $2,437 spent on fees and slippage. |
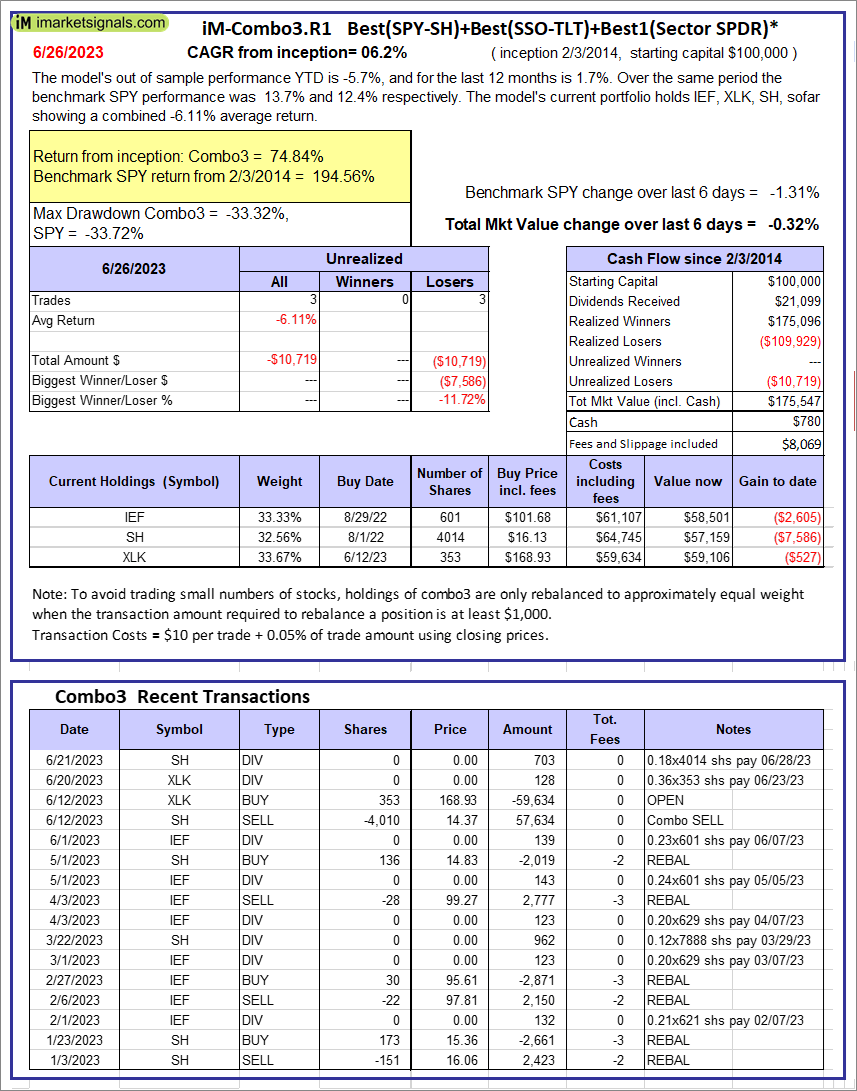 |
iM-Combo3.R1: The model’s out of sample performance YTD is -5.7%, and for the last 12 months is 1.7%. Over the same period the benchmark SPY performance was 13.7% and 12.4% respectively. Over the previous week the market value of iM-Combo3.R1 gained -0.32% at a time when SPY gained -1.31%. A starting capital of $100,000 at inception on 2/3/2014 would have grown to $175,547 which includes $780 cash and excludes $8,069 spent on fees and slippage. |
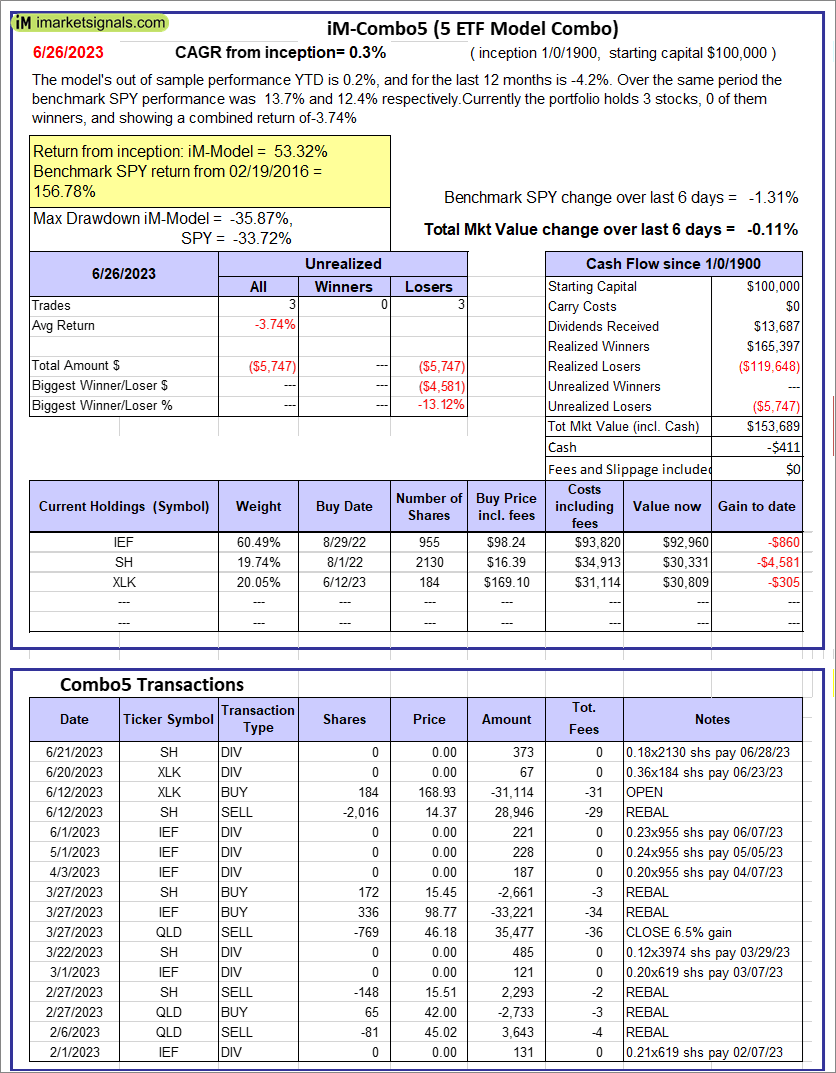 |
iM-Combo5: The model’s out of sample performance YTD is 0.2%, and for the last 12 months is -4.2%. Over the same period the benchmark SPY performance was 13.7% and 12.4% respectively. Over the previous week the market value of iM-Combo5 gained -0.11% at a time when SPY gained -1.31%. A starting capital of $100,000 at inception on 2/22/2016 would have grown to $153,689 which includes -$411 cash and excludes $0 spent on fees and slippage. |
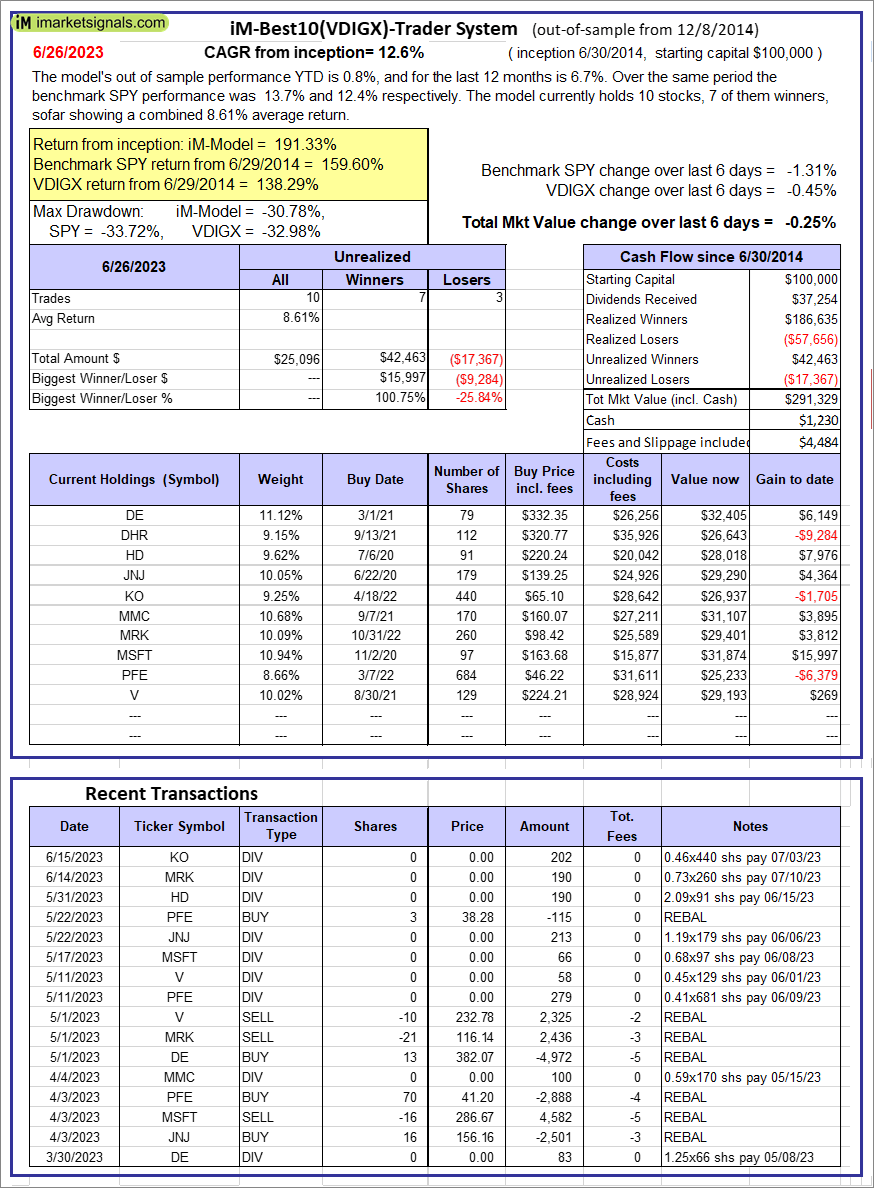 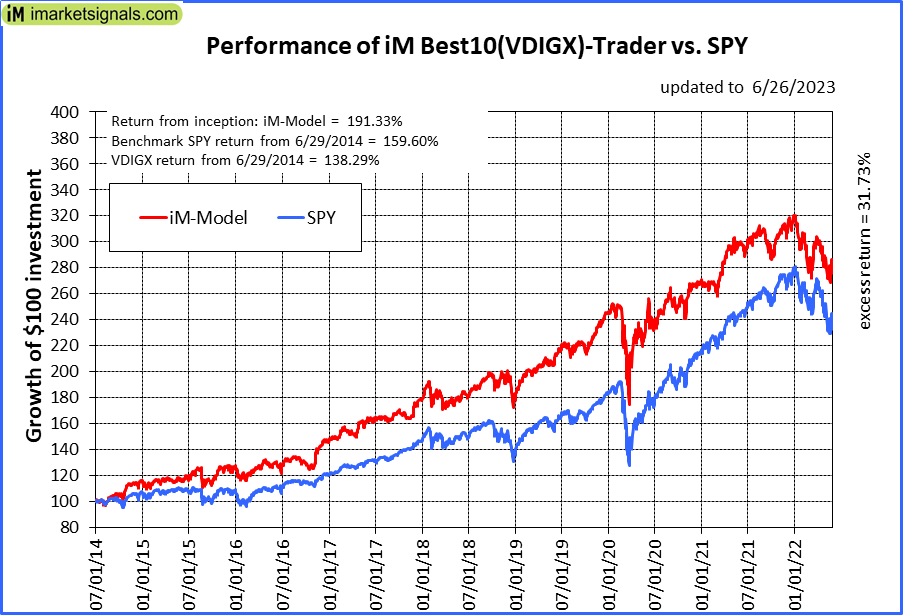 |
iM-Best10(VDIGX)-Trader: The model’s out of sample performance YTD is 0.8%, and for the last 12 months is 6.7%. Over the same period the benchmark SPY performance was 13.7% and 12.4% respectively. Since inception, on 7/1/2014, the model gained 191.33% while the benchmark SPY gained 159.60% and VDIGX gained 138.29% over the same period. Over the previous week the market value of iM-Best10(VDIGX) gained -0.25% at a time when SPY gained -1.31%. A starting capital of $100,000 at inception on 7/1/2014 would have grown to $291,329 which includes $1,230 cash and excludes $4,484 spent on fees and slippage. |
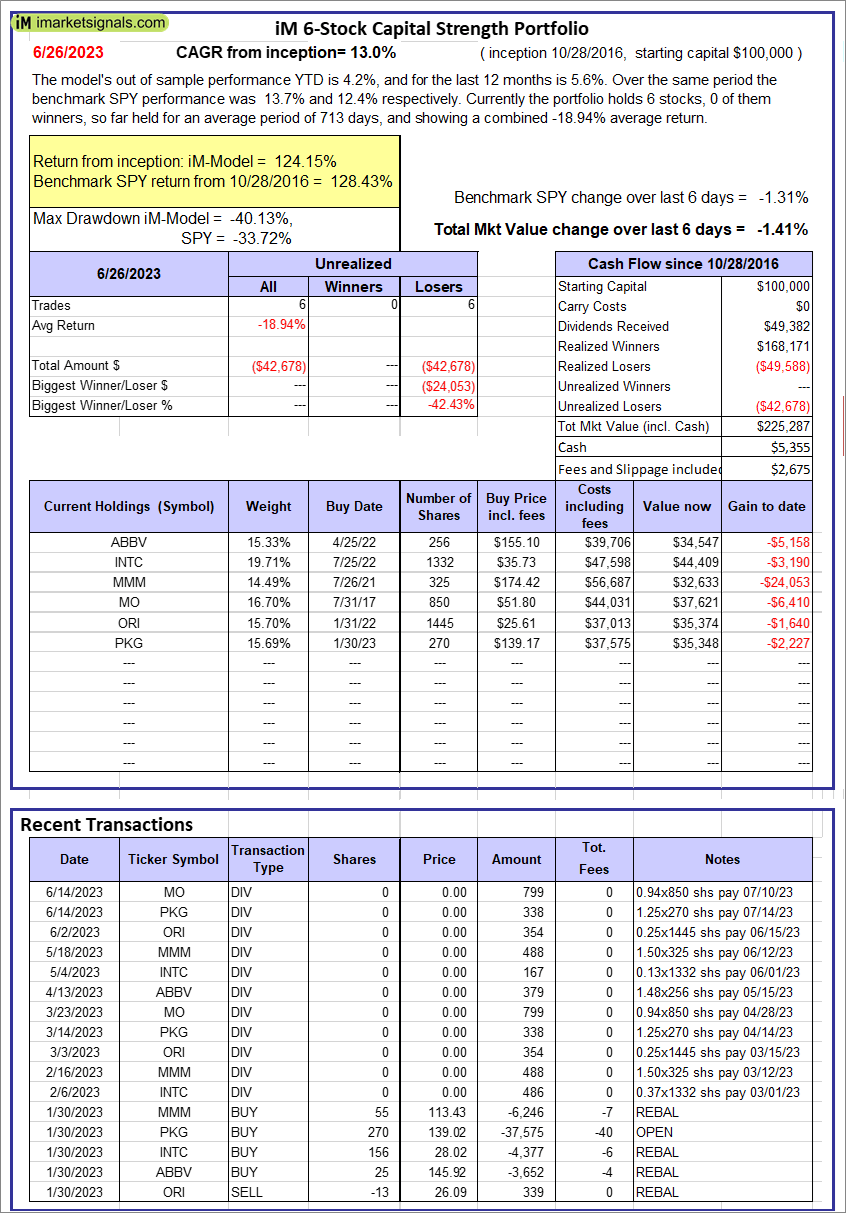 |
iM 6-Stock Capital Strength Portfolio: The model’s out of sample performance YTD is 4.2%, and for the last 12 months is 5.6%. Over the same period the benchmark SPY performance was 13.7% and 12.4% respectively. Over the previous week the market value of the iM 6-Stock Capital Strength Portfolio gained -1.41% at a time when SPY gained -1.31%. A starting capital of $100,000 at inception on 10/28/2016 would have grown to $225,287 which includes $5,355 cash and excludes $2,675 spent on fees and slippage. |
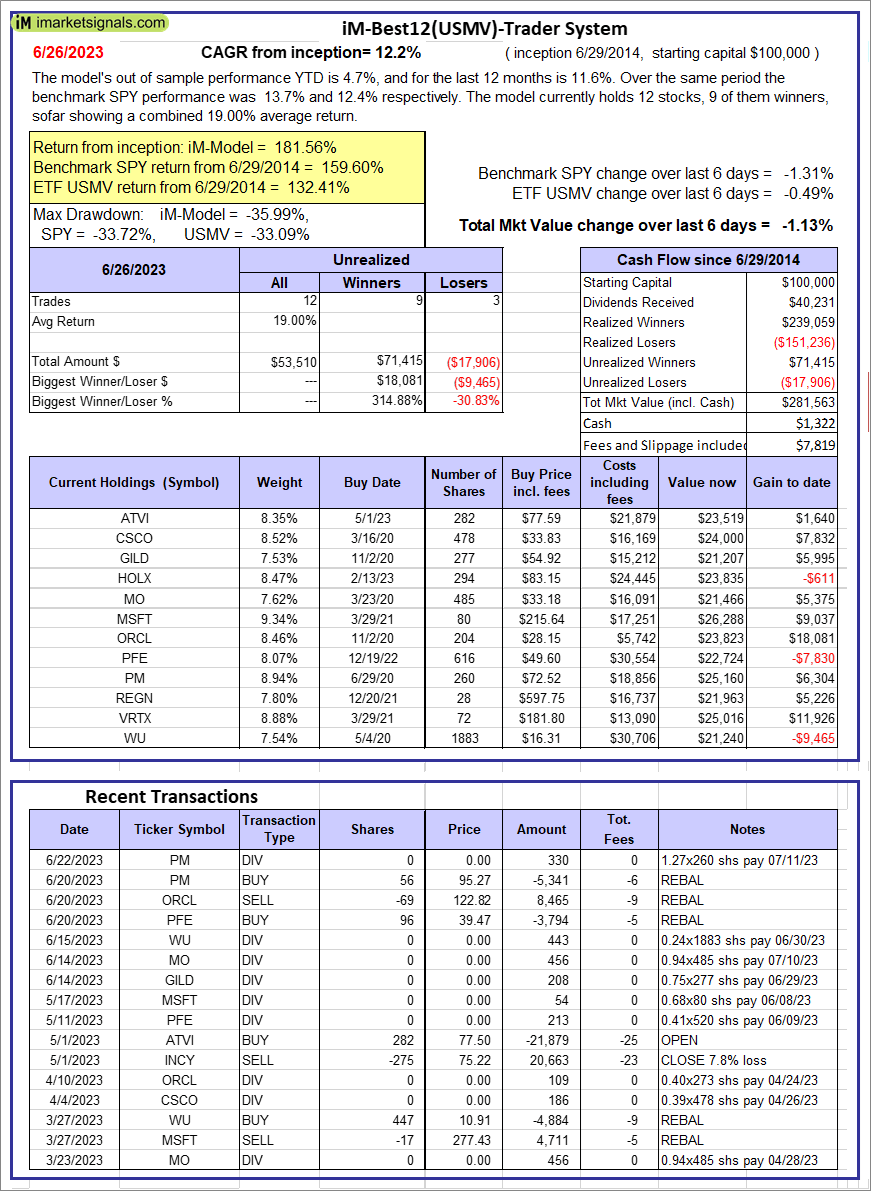 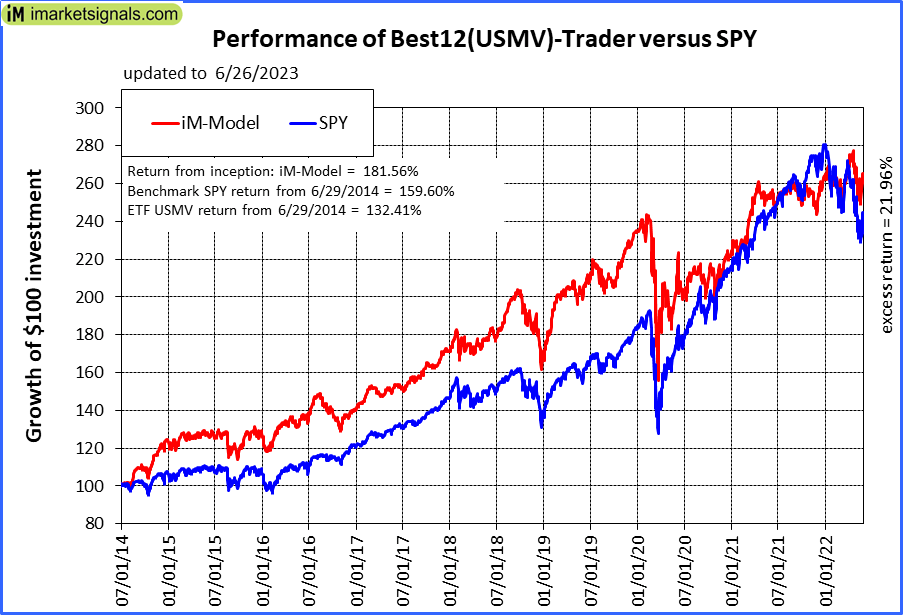 |
iM-Best12(USMV)-Trader: The model’s out of sample performance YTD is 4.7%, and for the last 12 months is 11.6%. Over the same period the benchmark SPY performance was 13.7% and 12.4% respectively. Since inception, on 6/30/2014, the model gained 181.56% while the benchmark SPY gained 159.60% and the ETF USMV gained 132.41% over the same period. Over the previous week the market value of iM-Best12(USMV)-Trader gained -1.13% at a time when SPY gained -1.31%. A starting capital of $100,000 at inception on 6/30/2014 would have grown to $281,563 which includes $1,322 cash and excludes $7,819 spent on fees and slippage. |
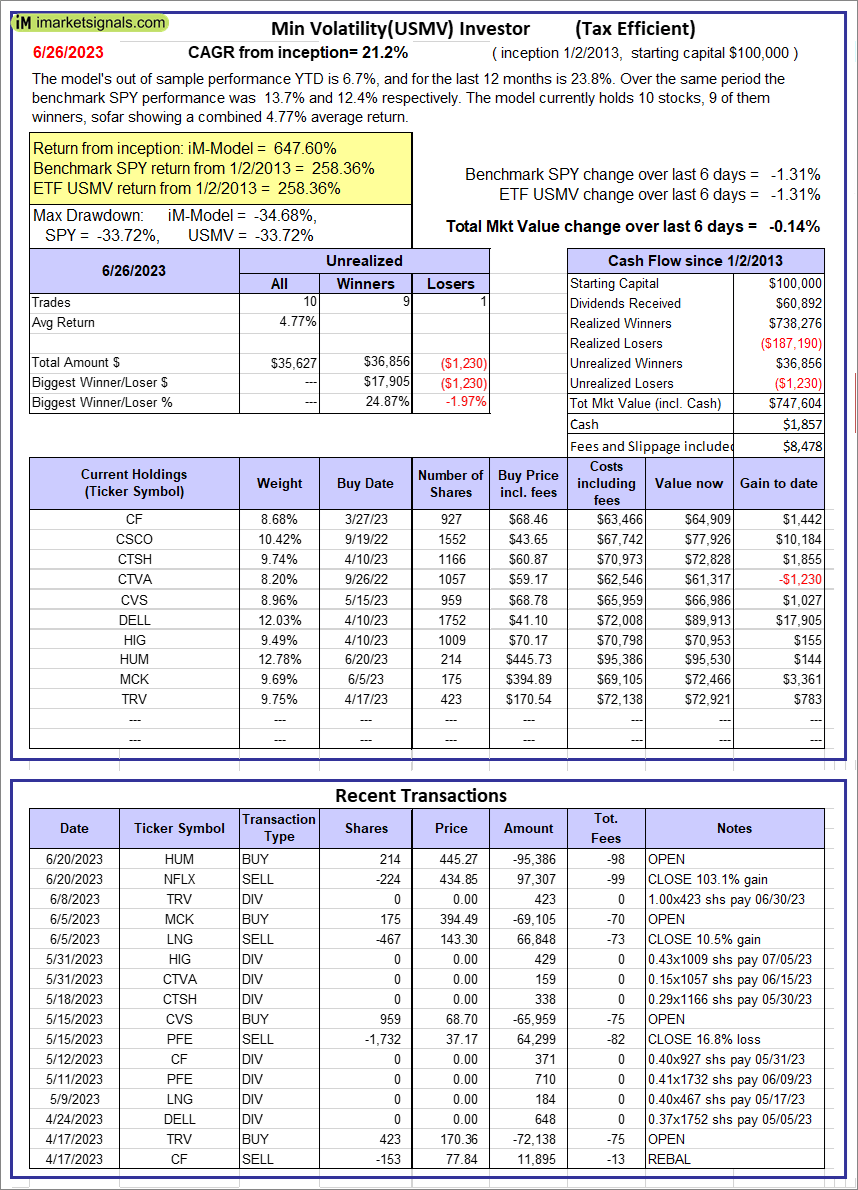 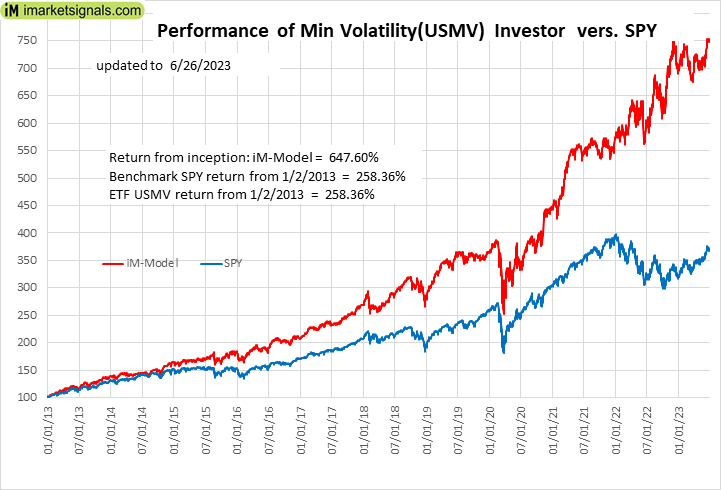 |
iM-Min Volatility(USMV) Investor (Tax Efficient): The model’s out of sample performance YTD is 6.7%, and for the last 12 months is 23.8%. Over the same period the benchmark SPY performance was 13.7% and 12.4% respectively. Since inception, on 1/3/2013, the model gained 647.60% while the benchmark SPY gained 258.36% and the ETF USMV gained 258.36% over the same period. Over the previous week the market value of iM-Best12(USMV)Q1 gained -0.14% at a time when SPY gained -1.31%. A starting capital of $100,000 at inception on 1/3/2013 would have grown to $747,604 which includes $1,857 cash and excludes $8,478 spent on fees and slippage. |
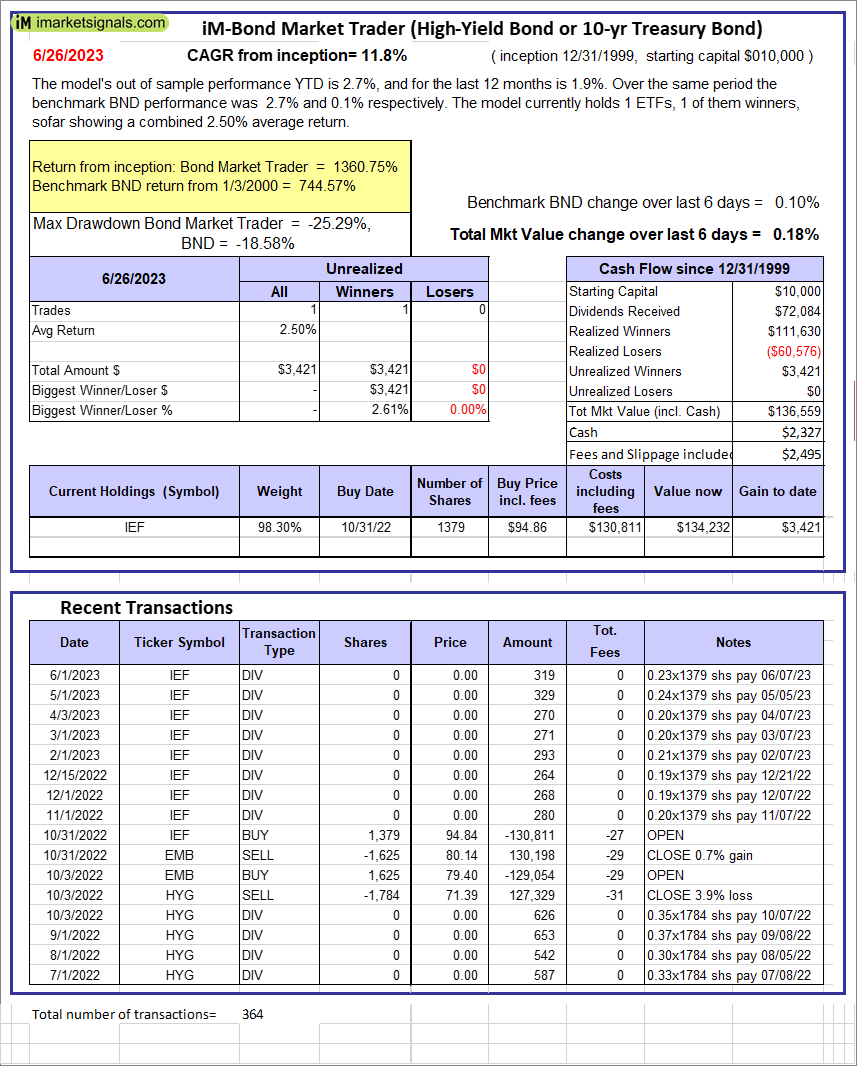 |
iM-Bond Market Trader (High-Yield Bond or 10-yr Treasury Bond): The model’s out of sample performance YTD is 2.7%, and for the last 12 months is 1.9%. Over the same period the benchmark BND performance was 2.7% and 0.1% respectively. Over the previous week the market value of the iM-Bond Market Trader (High-Yield Bond or 10-yr Treasury Bond) gained 0.18% at a time when BND gained 0.10%. A starting capital of $10,000 at inception on 1/3/2000 would have grown to $136,559 which includes $2,327 cash and excludes $2,495 spent on fees and slippage. |
|
|
iM-ModSum/YieldCurve Timer: The model’s out of sample performance YTD is 5.1%, and for the last 12 months is 6.6%. Over the same period the benchmark SPY performance was 13.7% and 12.4% respectively. Over the previous week the market value of iM-PortSum/YieldCurve Timer gained 0.19% at a time when SPY gained -1.31%. A starting capital of $100,000 at inception on 1/1/2016 would have grown to $264,984 which includes -$754 cash and excludes $1,367 spent on fees and slippage. |
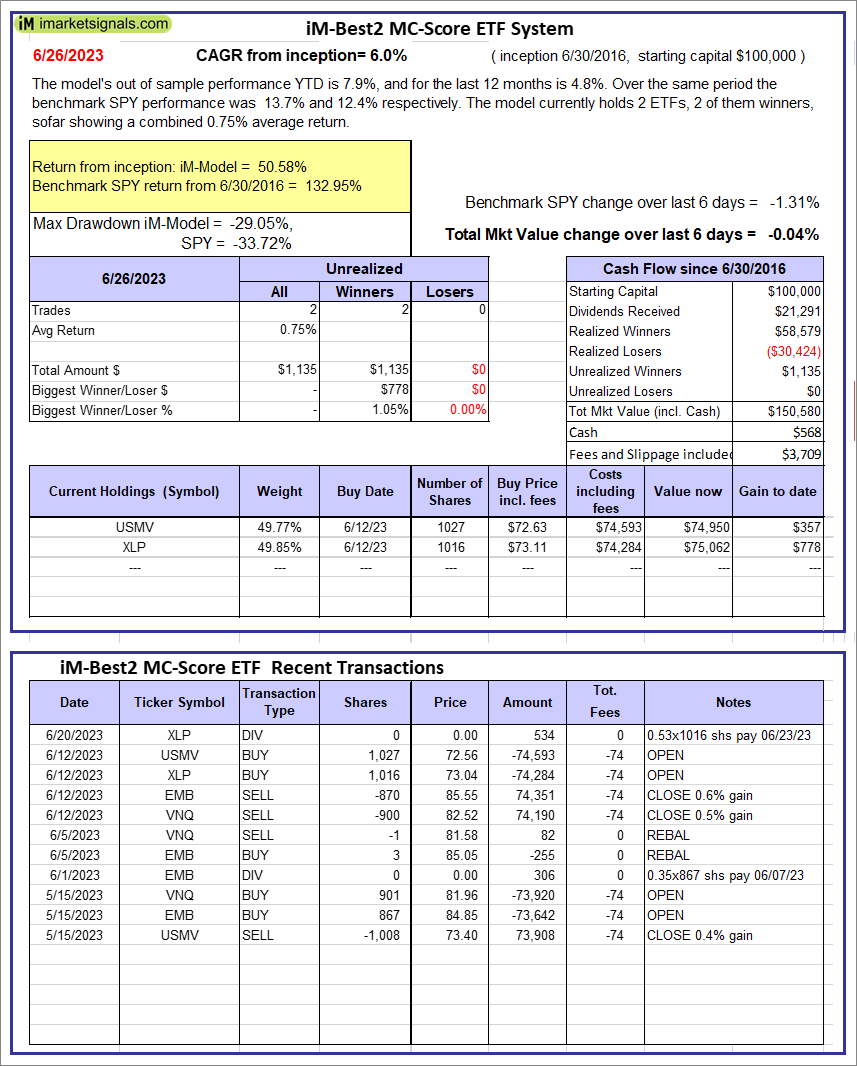 |
iM-Best2 MC-Score ETF System: The model’s out of sample performance YTD is 7.9%, and for the last 12 months is 4.8%. Over the same period the benchmark SPY performance was 13.7% and 12.4% respectively. Over the previous week the market value of the iM-Best2 MC-Score ETF System gained -0.04% at a time when SPY gained -1.31%. A starting capital of $100,000 at inception on 6/30/2016 would have grown to $150,580 which includes $568 cash and excludes $3,709 spent on fees and slippage. |
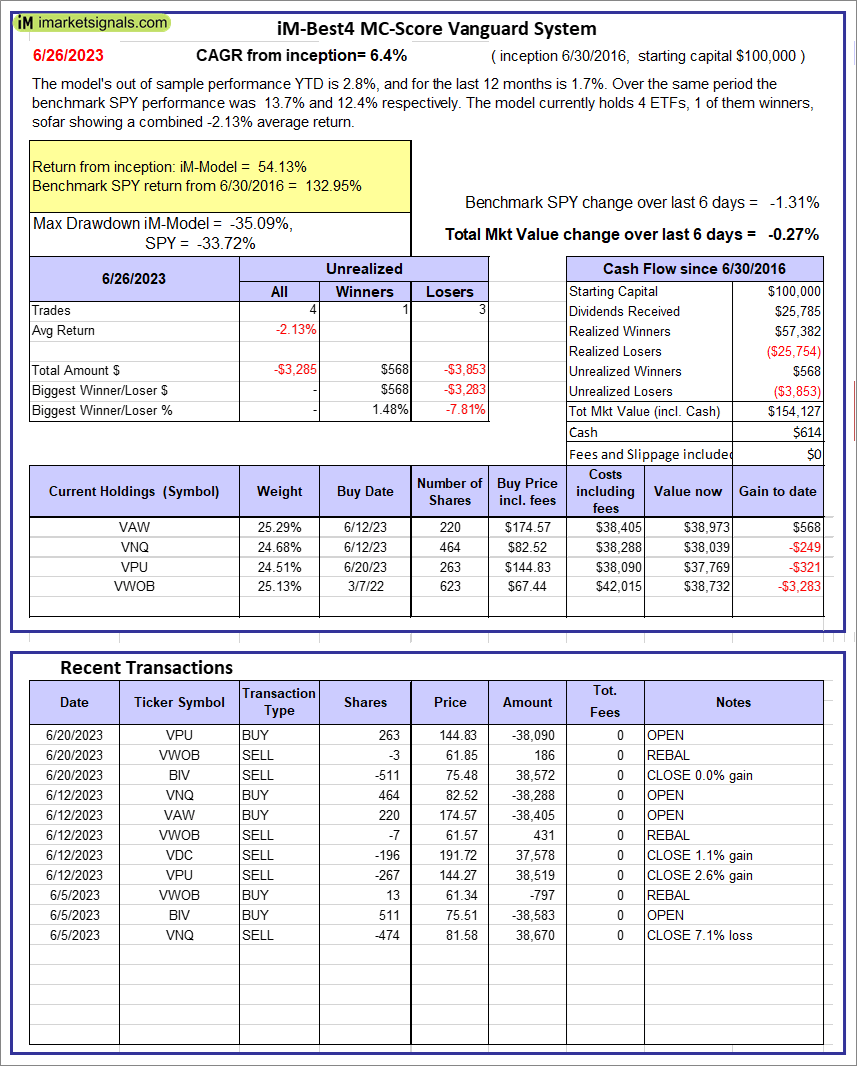 |
iM-Best4 MC-Score Vanguard System: The model’s out of sample performance YTD is 2.8%, and for the last 12 months is 1.7%. Over the same period the benchmark SPY performance was 13.7% and 12.4% respectively. Over the previous week the market value of the iM-Best4 MC-Score Vanguard System gained -0.27% at a time when SPY gained -1.31%. A starting capital of $100,000 at inception on 6/30/2016 would have grown to $154,127 which includes $614 cash and excludes $00 spent on fees and slippage. |
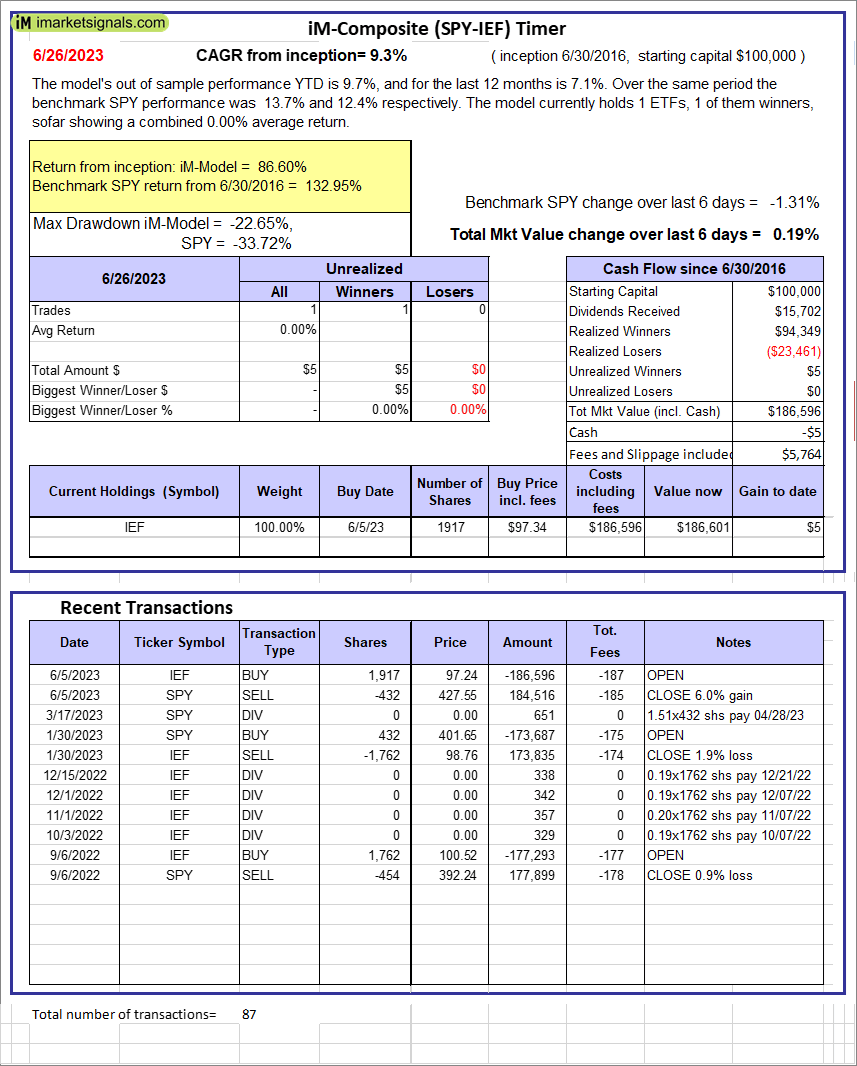 |
iM-Composite (SPY-IEF) Timer: The model’s out of sample performance YTD is 9.7%, and for the last 12 months is 7.1%. Over the same period the benchmark SPY performance was 13.7% and 12.4% respectively. Over the previous week the market value of the iM-Composite (SPY-IEF) Timer gained 0.19% at a time when SPY gained -1.31%. A starting capital of $100,000 at inception on 6/30/2016 would have grown to $186,596 which includes -$5 cash and excludes $5,764 spent on fees and slippage. |
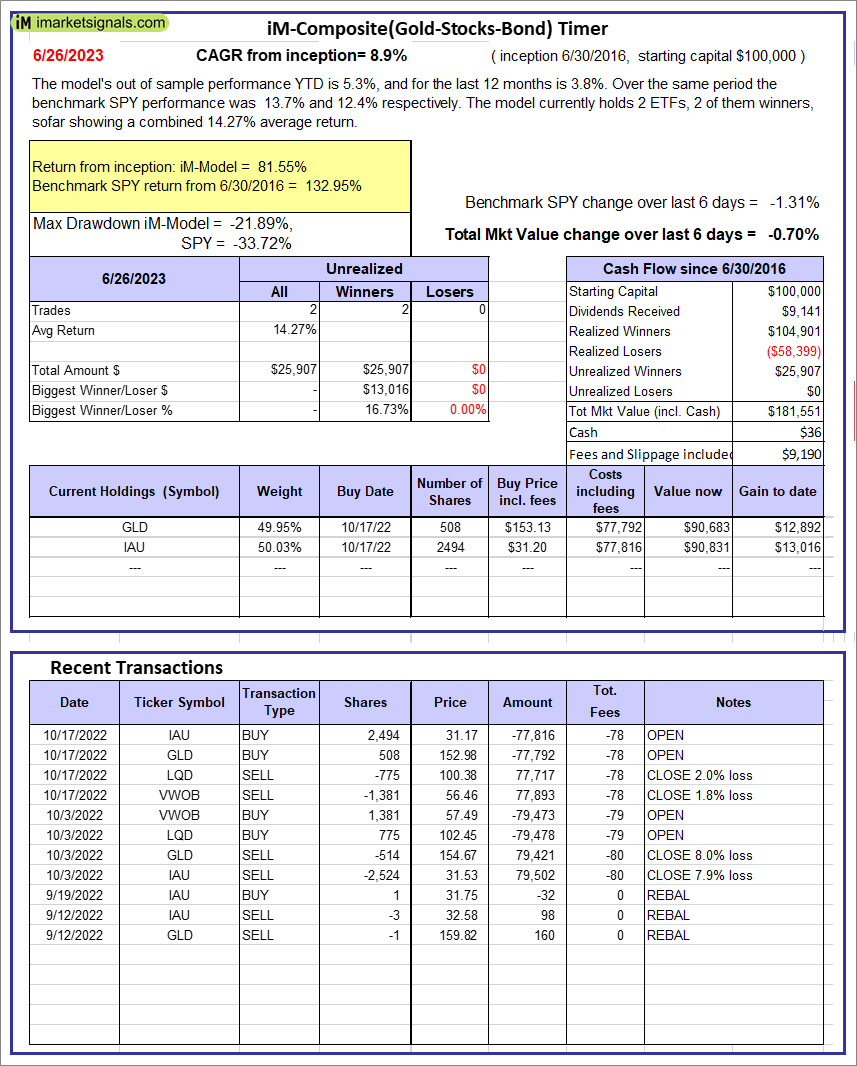 |
iM-Composite(Gold-Stocks-Bond) Timer: The model’s out of sample performance YTD is 5.3%, and for the last 12 months is 3.8%. Over the same period the benchmark SPY performance was 13.7% and 12.4% respectively. Over the previous week the market value of the iM-Composite(Gold-Stocks-Bond) Timer gained -0.70% at a time when SPY gained -1.31%. A starting capital of $100,000 at inception on 6/30/2016 would have grown to $181,551 which includes $36 cash and excludes $9,190 spent on fees and slippage. |
iM-Best Reports – 6/26/2023
Posted in pmp SPY-SH
Leave a Reply
You must be logged in to post a comment.