
  |
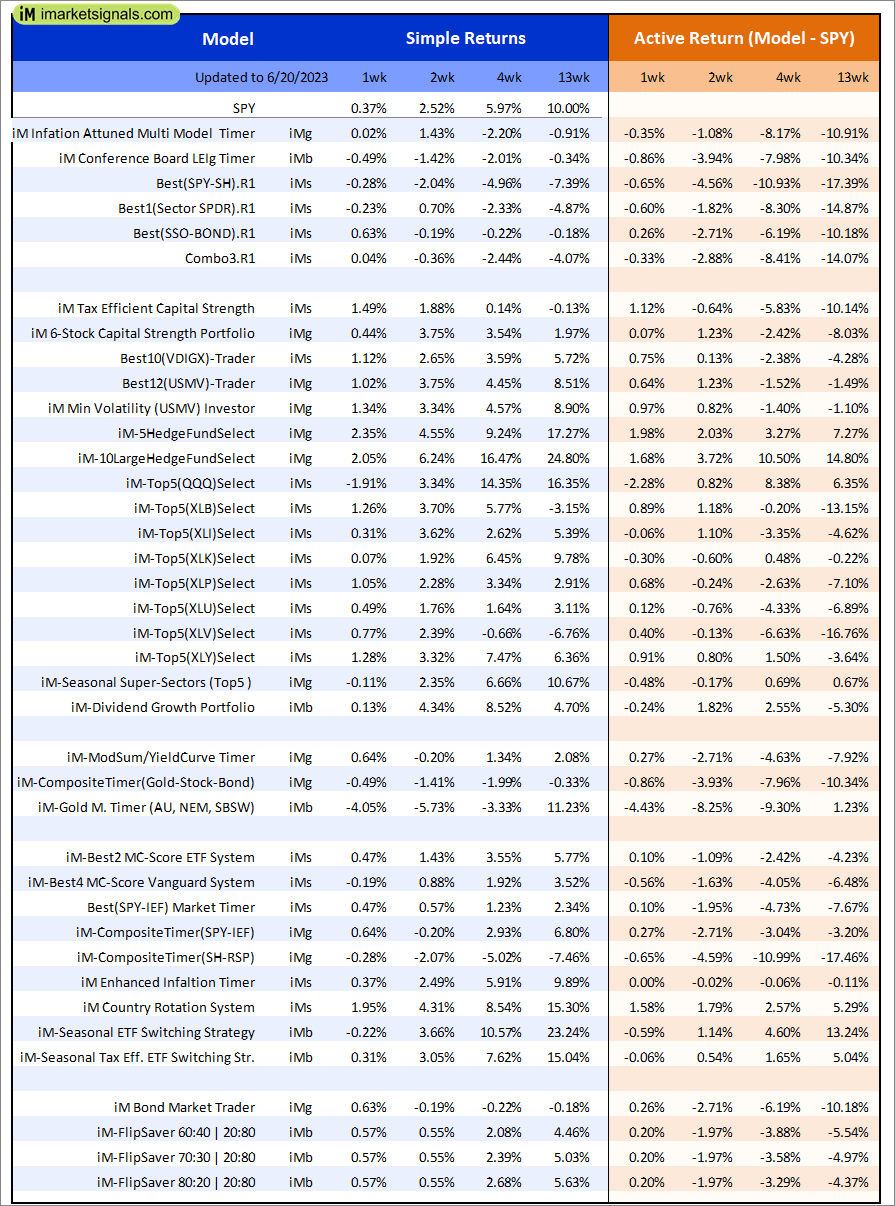
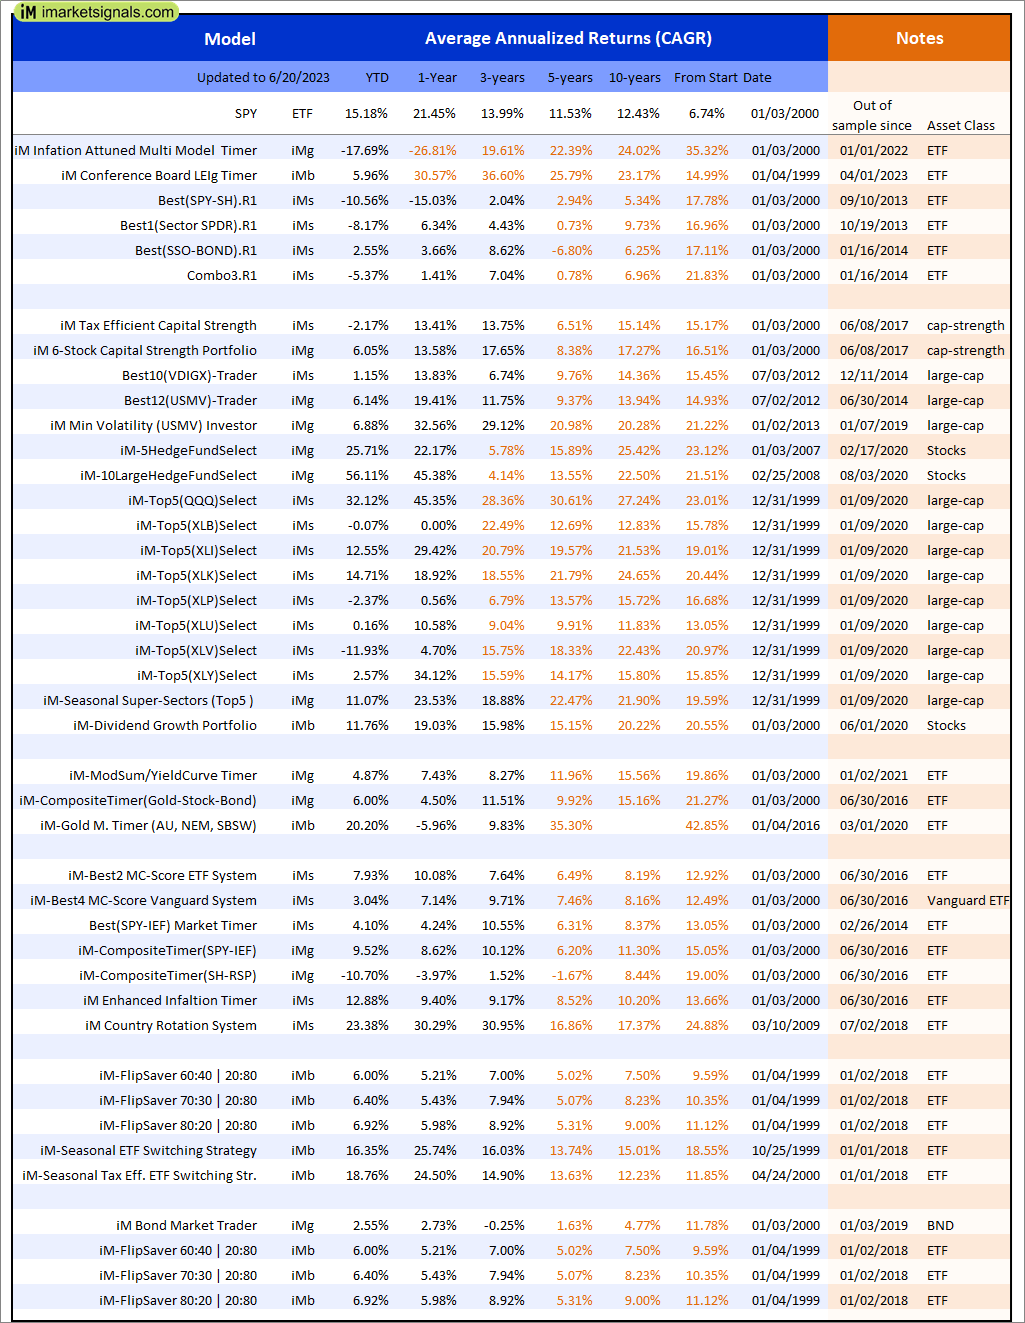
Out of sample performance summary of our models for the past 1, 2, 4 and 13 week periods. The active active return indicates how the models over- or underperformed the benchmark ETF SPY. Also the YTD, and the 1-, 3-, 5- and 10-year annualized returns are shown in the second table |
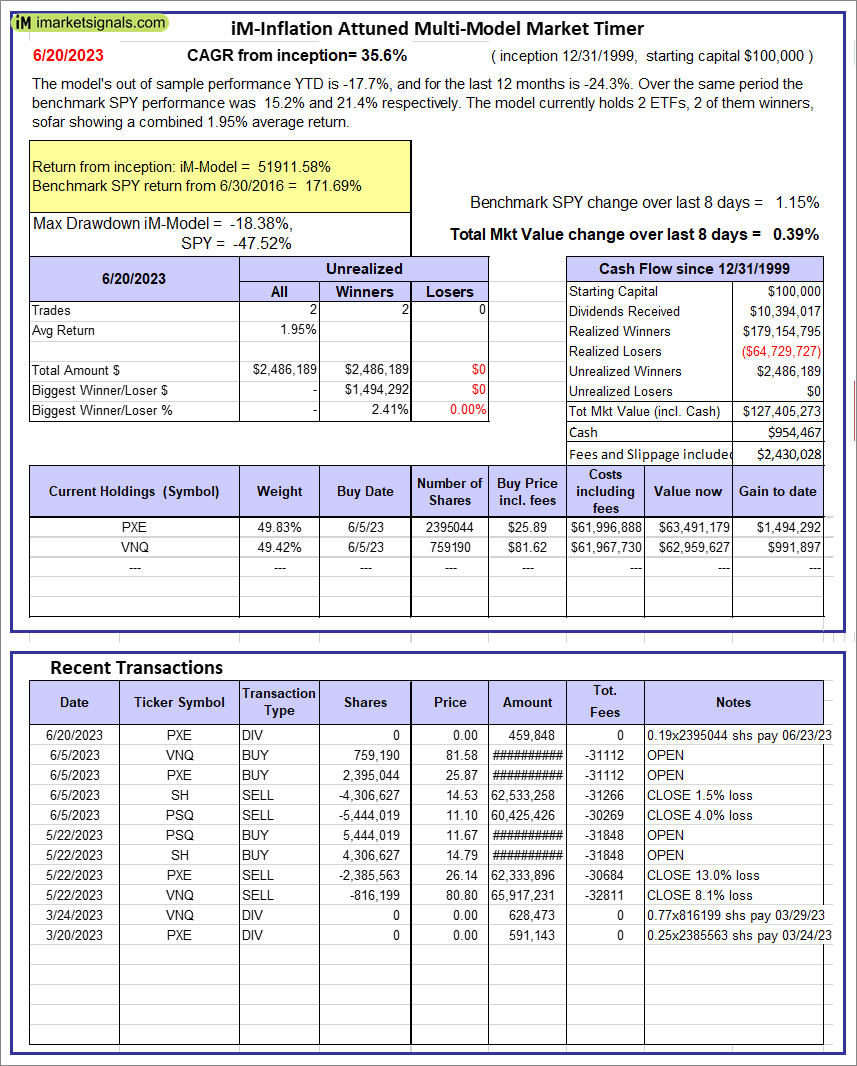 |
iM-Inflation Attuned Multi-Model Market Timer: The model’s out of sample performance YTD is -17.7%, and for the last 12 months is -24.3%. Over the same period the benchmark SPY performance was 15.2% and 21.4% respectively. Over the previous week the market value of the iM-Inflation Attuned Multi-Model Market Timer gained 0.39% at a time when SPY gained 1.15%. A starting capital of $100,000 at inception on 3/24/2017 would have grown to $127,405,273 which includes $954,467 cash and excludes $2,430,028 spent on fees and slippage. |
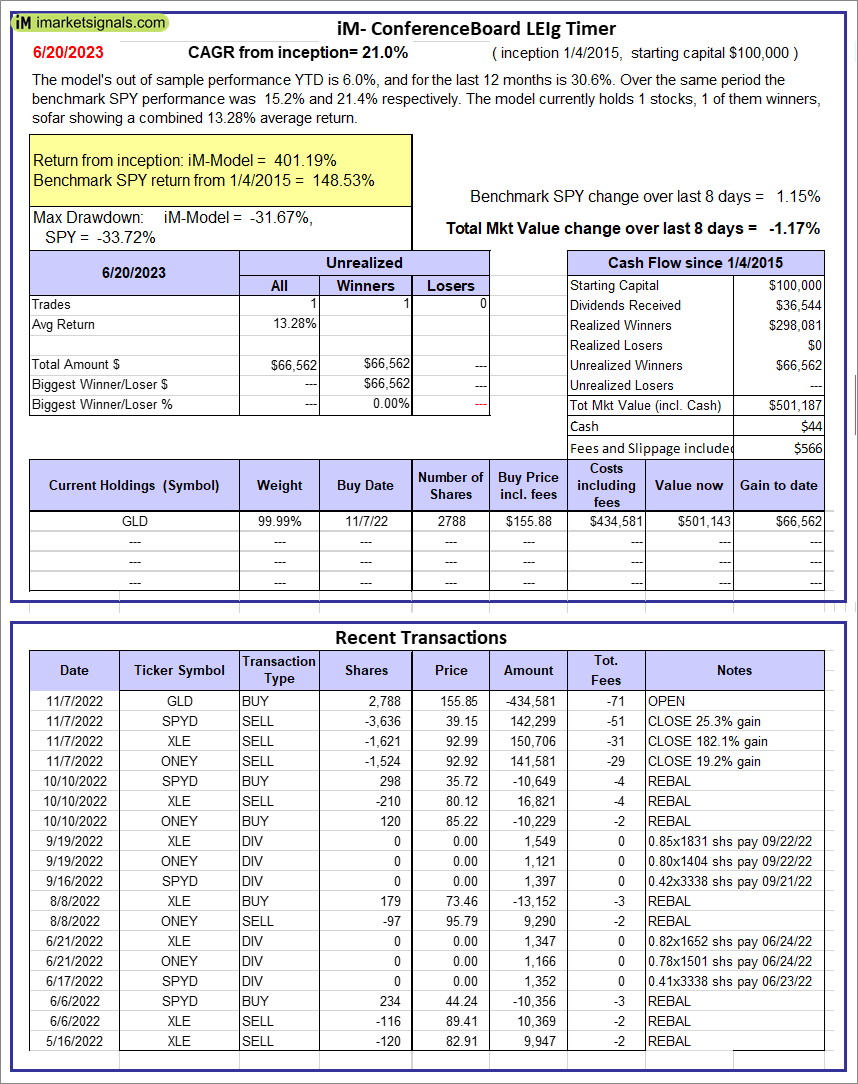 |
iM-Conference Board LEIg Timer: The model’s performance YTD is 14.3%, and for the last 12 months is 7.3%. Over the same period the benchmark SPY performance was 20.1% and 9.4% respectively. Over the previous week the market value of the iM-Conference Board LEIg Timer gained -1.17% at a time when SPY gained 1.15%. A starting capital of $100,000 at inception on 4/5/2017 would have grown to $501,187 which includes $44 cash and excludes $566 spent on fees and slippage. |
 |
iM-FlipSaver 60:40 | 20:80 – 2017: The model’s out of sample performance YTD is 5.9%, and for the last 12 months is 4.9%. Over the same period the benchmark E60B40 performance was 10.2% and 13.2% respectively. Over the previous week the market value of iM-FlipSaver 80:20 | 20:80 gained 0.41% at a time when SPY gained 0.76%. A starting capital of $100,000 at inception on 7/16/2015 would have grown to $149,298 which includes -$53 cash and excludes $3,255 spent on fees and slippage. |
 |
iM-FlipSaver 70:30 | 20:80 – 2017: The model’s out of sample performance YTD is 6.4%, and for the last 12 months is 5.4%. Over the same period the benchmark E60B40 performance was 10.2% and 13.2% respectively. Over the previous week the market value of iM-FlipSaver 70:30 | 20:80 gained 0.41% at a time when SPY gained 0.76%. A starting capital of $100,000 at inception on 7/15/2015 would have grown to $154,276 which includes -$254 cash and excludes $3,432 spent on fees and slippage. |
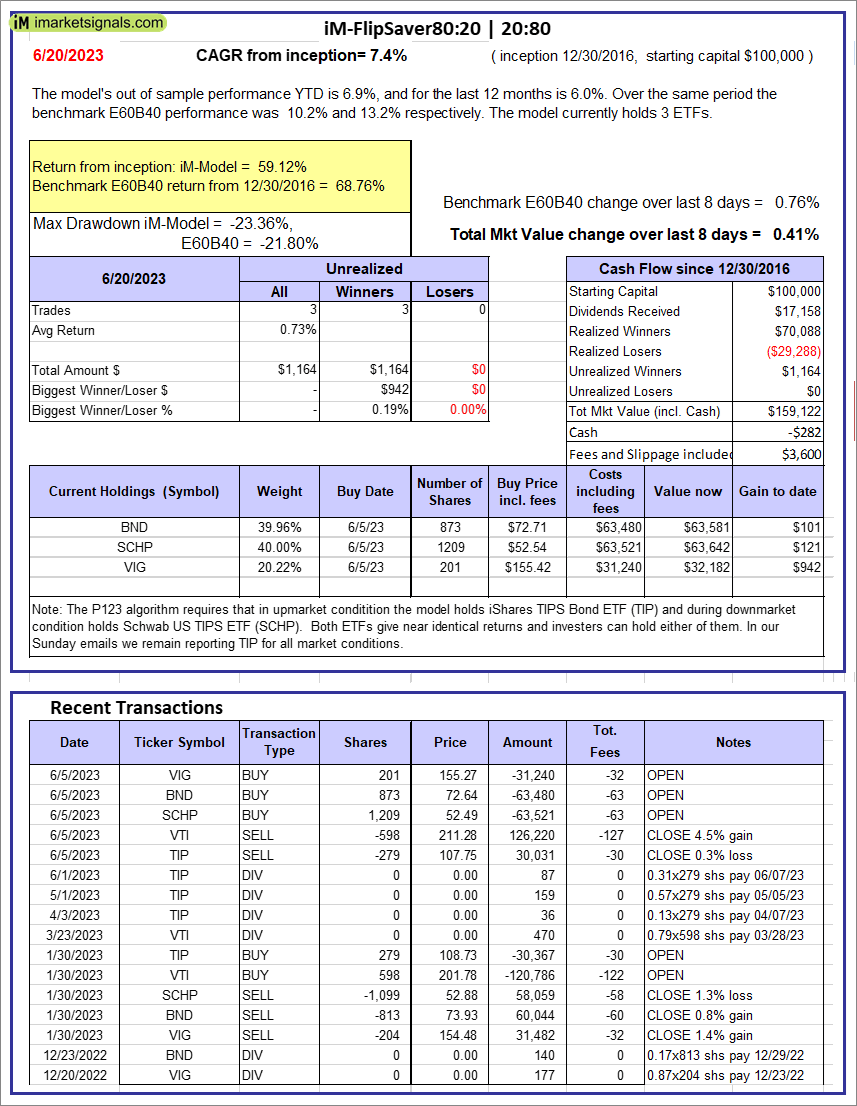 |
iM-FlipSaver 80:20 | 20:80 – 2017: The model’s out of sample performance YTD is 6.9%, and for the last 12 months is 6.0%. Over the same period the benchmark E60B40 performance was 10.2% and 13.2% respectively. Over the previous week the market value of iM-FlipSaver 80:20 | 20:80 gained 0.41% at a time when SPY gained 0.76%. A starting capital of $100,000 at inception on 1/2/2017 would have grown to $159,122 which includes -$282 cash and excludes $3,600 spent on fees and slippage. |
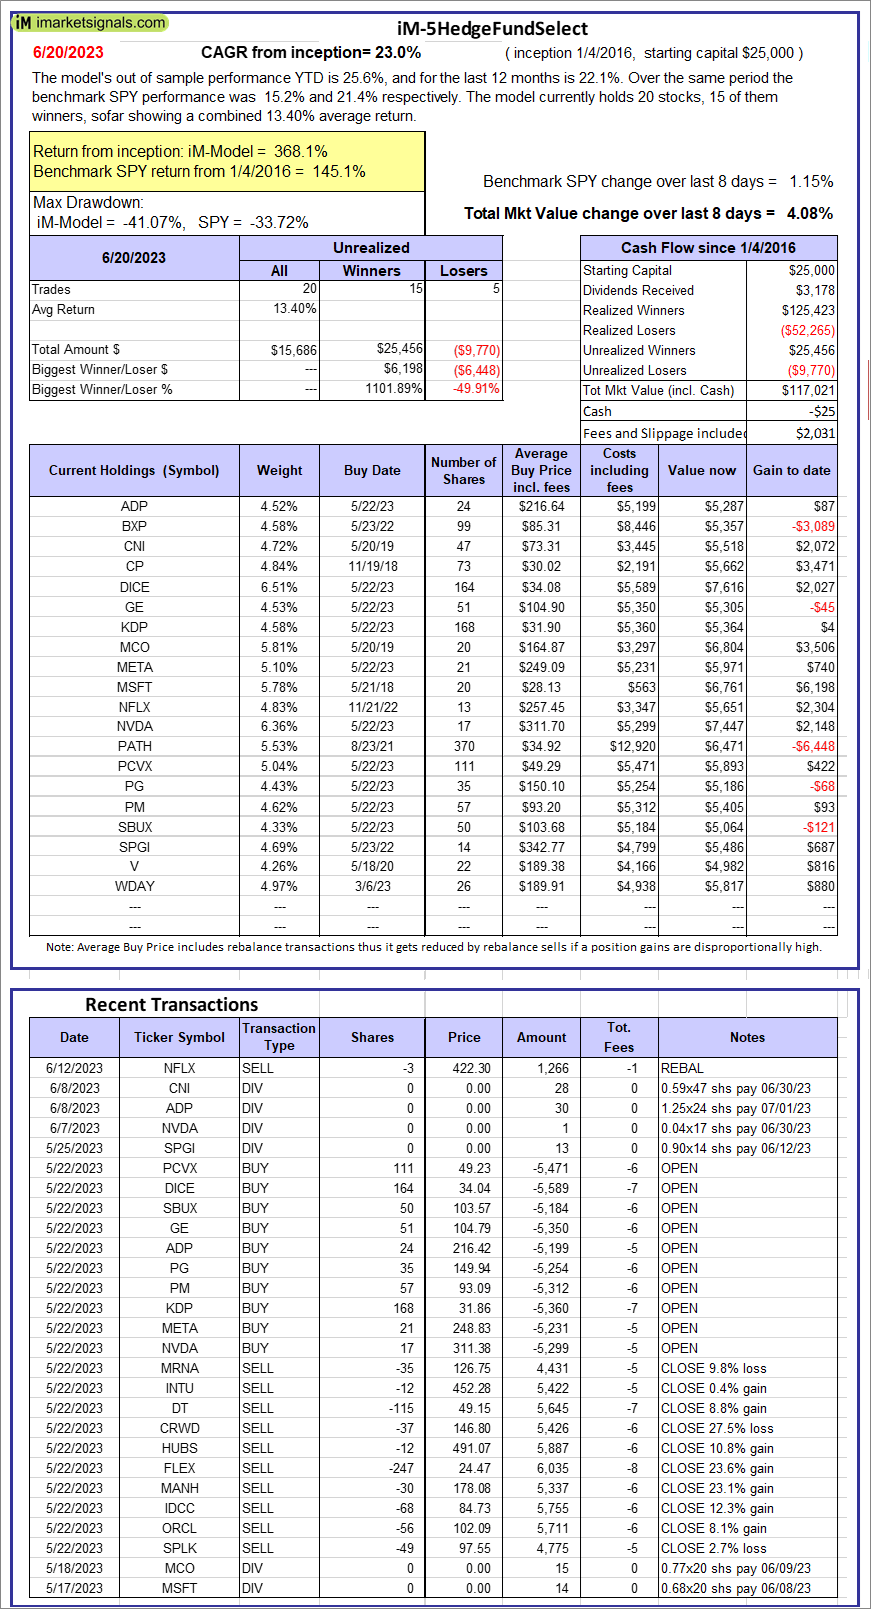 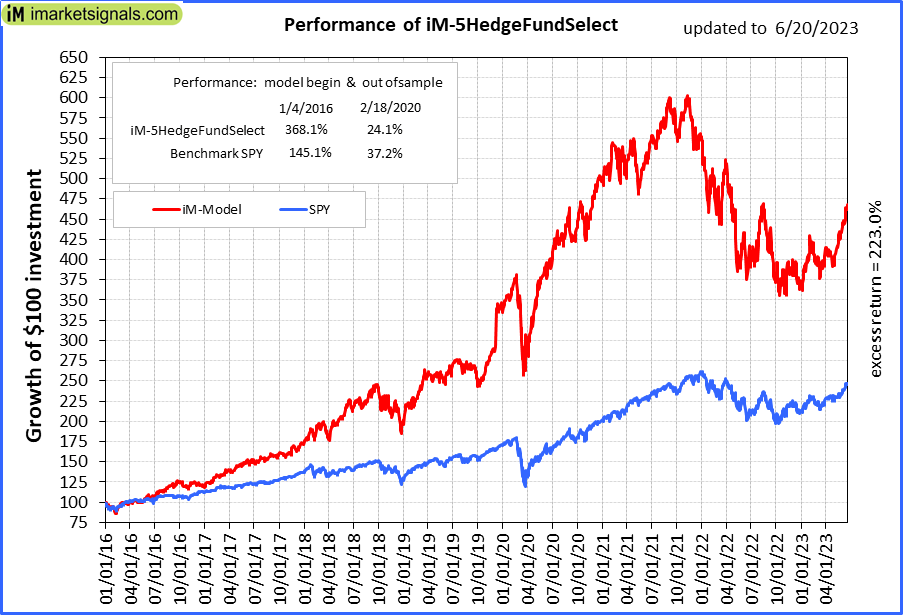 |
iM-5HedgeFundSelect: Since inception, on 1/5/2016, the model gained 368.09% while the benchmark SPY gained 145.05% over the same period. Over the previous week the market value of iM-5HedgeFundSelect gained 4.08% at a time when SPY gained 1.15%. A starting capital of $25,000 at inception on 1/5/2016 would have grown to $117,021 which includes -$25 cash and excludes $2,031 spent on fees and slippage. |
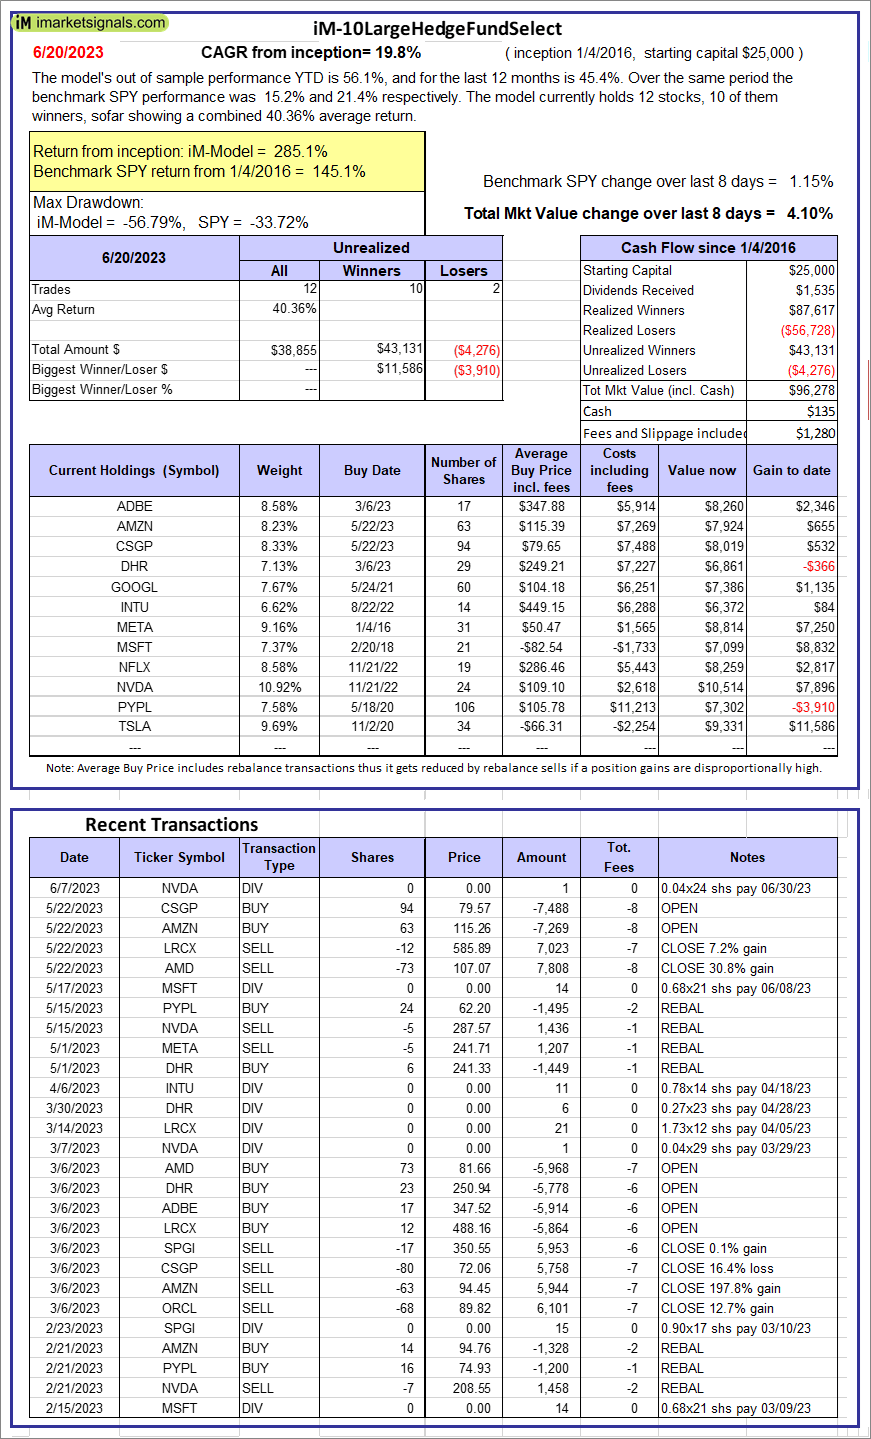 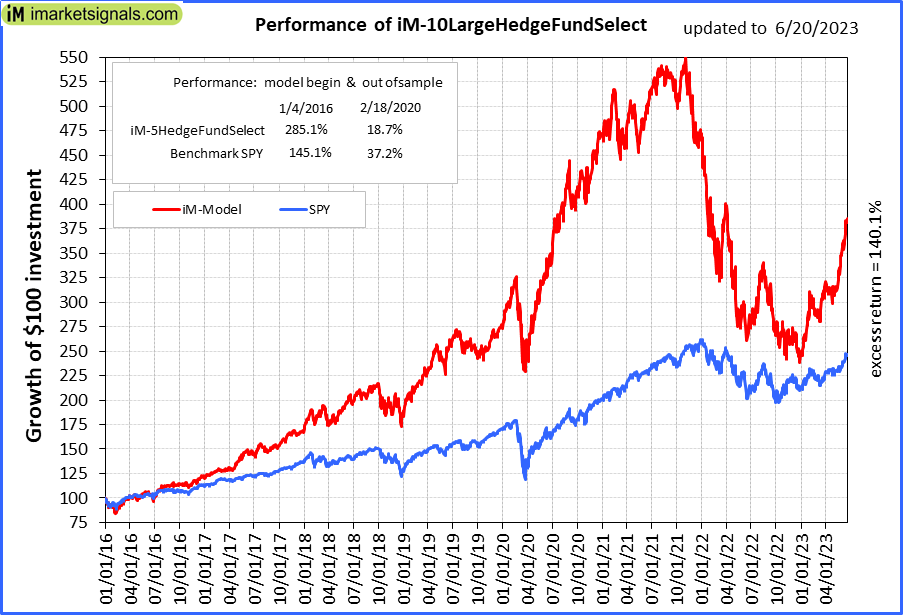 |
iM-10LargeHedgeFundSelect: Since inception, on 1/5/2016, the model gained 285.11% while the benchmark SPY gained 145.05% over the same period. Over the previous week the market value of iM-10LargeHedgeFundSelect gained 4.10% at a time when SPY gained 1.15%. A starting capital of $25,000 at inception on 1/5/2016 would have grown to $96,278 which includes $135 cash and excludes $1,280 spent on fees and slippage. |
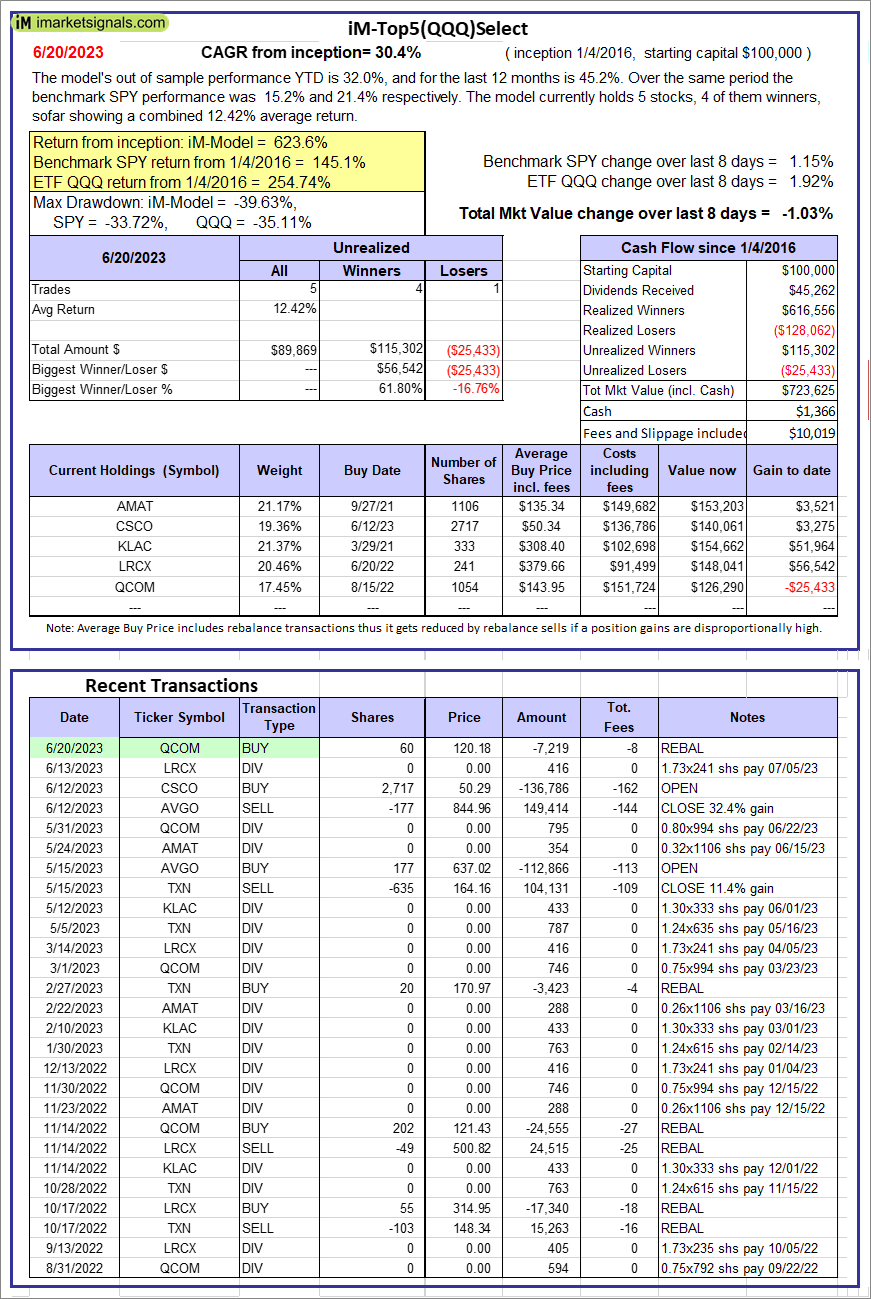 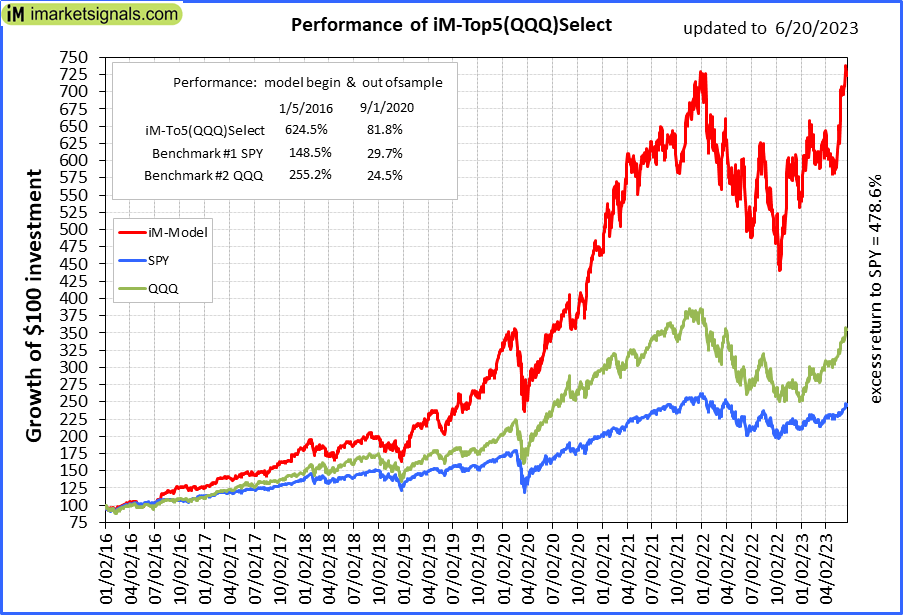 |
iM-Top5(QQQ)Select: Since inception, on 1/5/2016, the model gained 623.62% while the benchmark SPY gained 145.05% over the same period. Over the previous week the market value of iM-Top5(QQQ)Select gained -1.03% at a time when SPY gained 1.15%. A starting capital of $100,000 at inception on 1/5/2016 would have grown to $723,625 which includes $1,366 cash and excludes $10,019 spent on fees and slippage. |
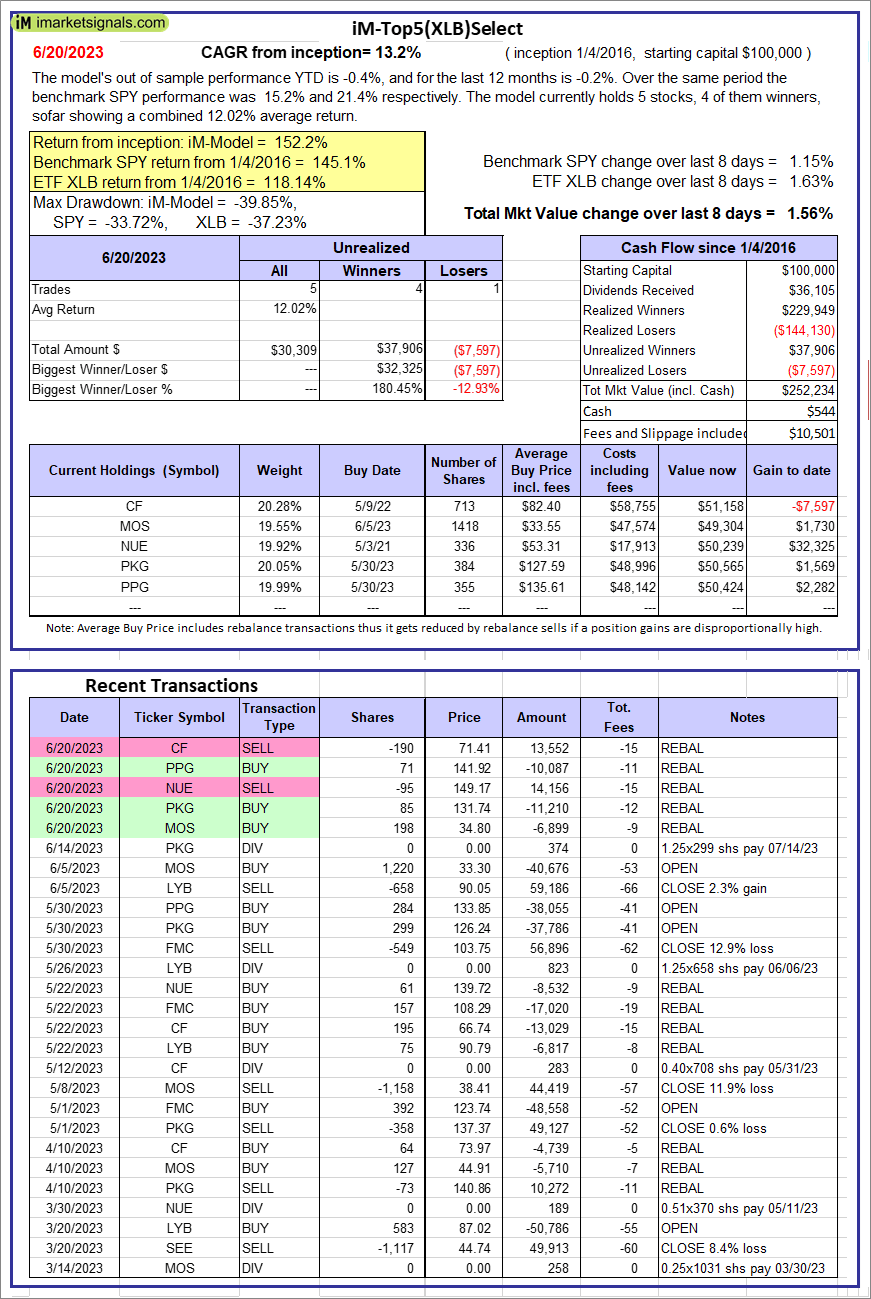 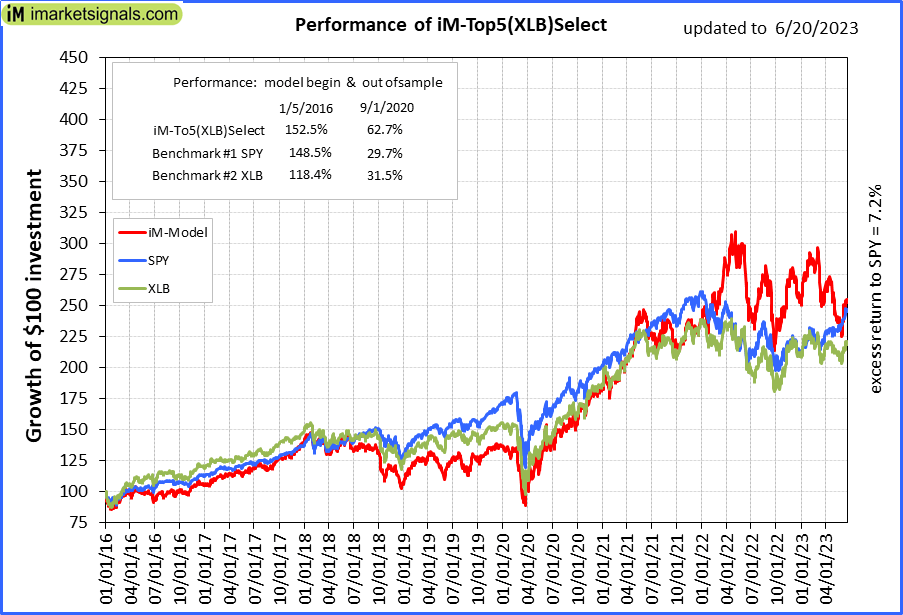 |
iM-Top5(XLB)Select: Since inception, on 1/5/2016, the model gained 152.23% while the benchmark SPY gained 145.05% over the same period. Over the previous week the market value of iM-Top5(XLB)Select gained 1.56% at a time when SPY gained 1.15%. A starting capital of $100,000 at inception on 1/5/2016 would have grown to $252,234 which includes $544 cash and excludes $10,501 spent on fees and slippage. |
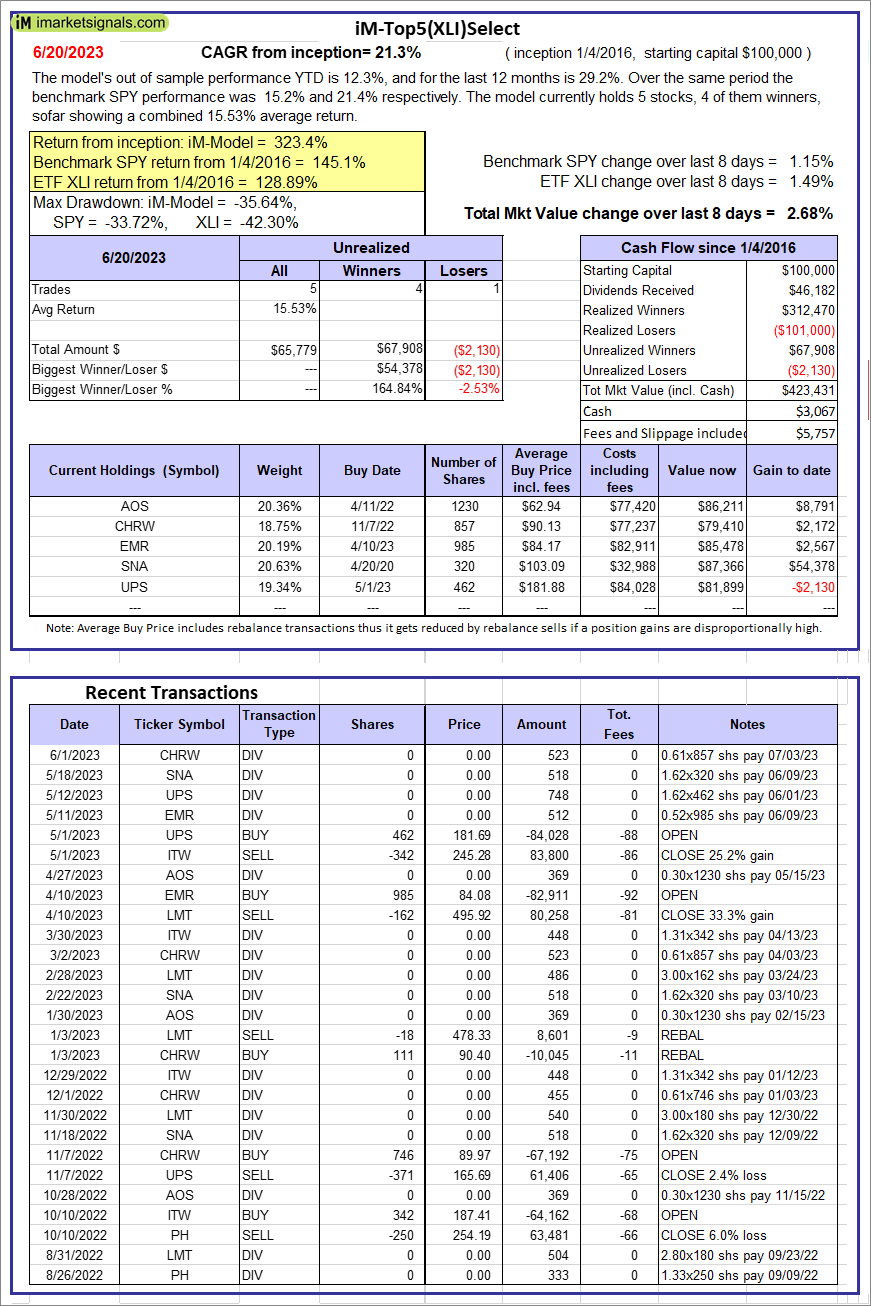 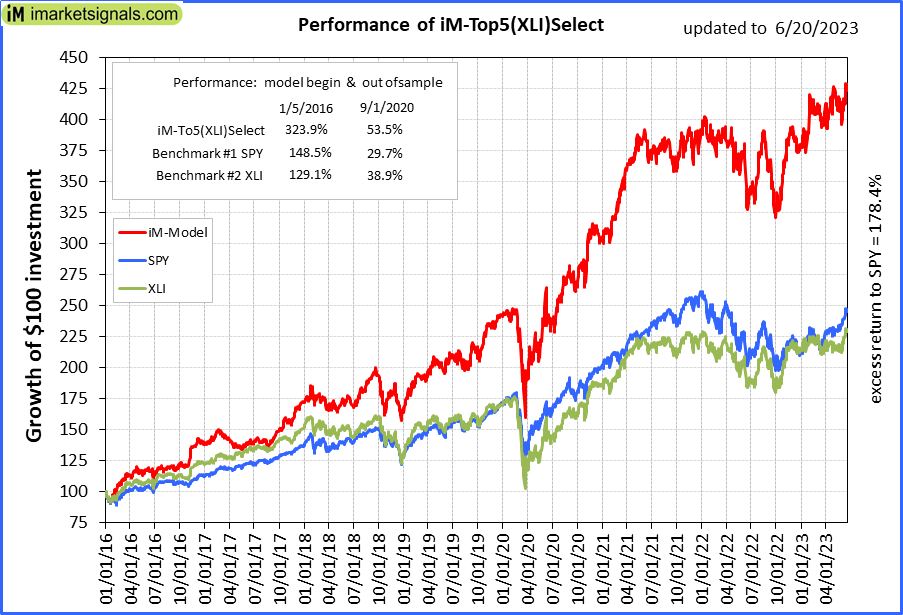 |
iM-Top5(XLI)Select: Since inception, on 1/5/2016, the model gained 323.43% while the benchmark SPY gained 145.05% over the same period. Over the previous week the market value of iM-Top5(XLI)Select gained 2.68% at a time when SPY gained 1.15%. A starting capital of $100,000 at inception on 1/5/2016 would have grown to $423,431 which includes $3,067 cash and excludes $5,757 spent on fees and slippage. |
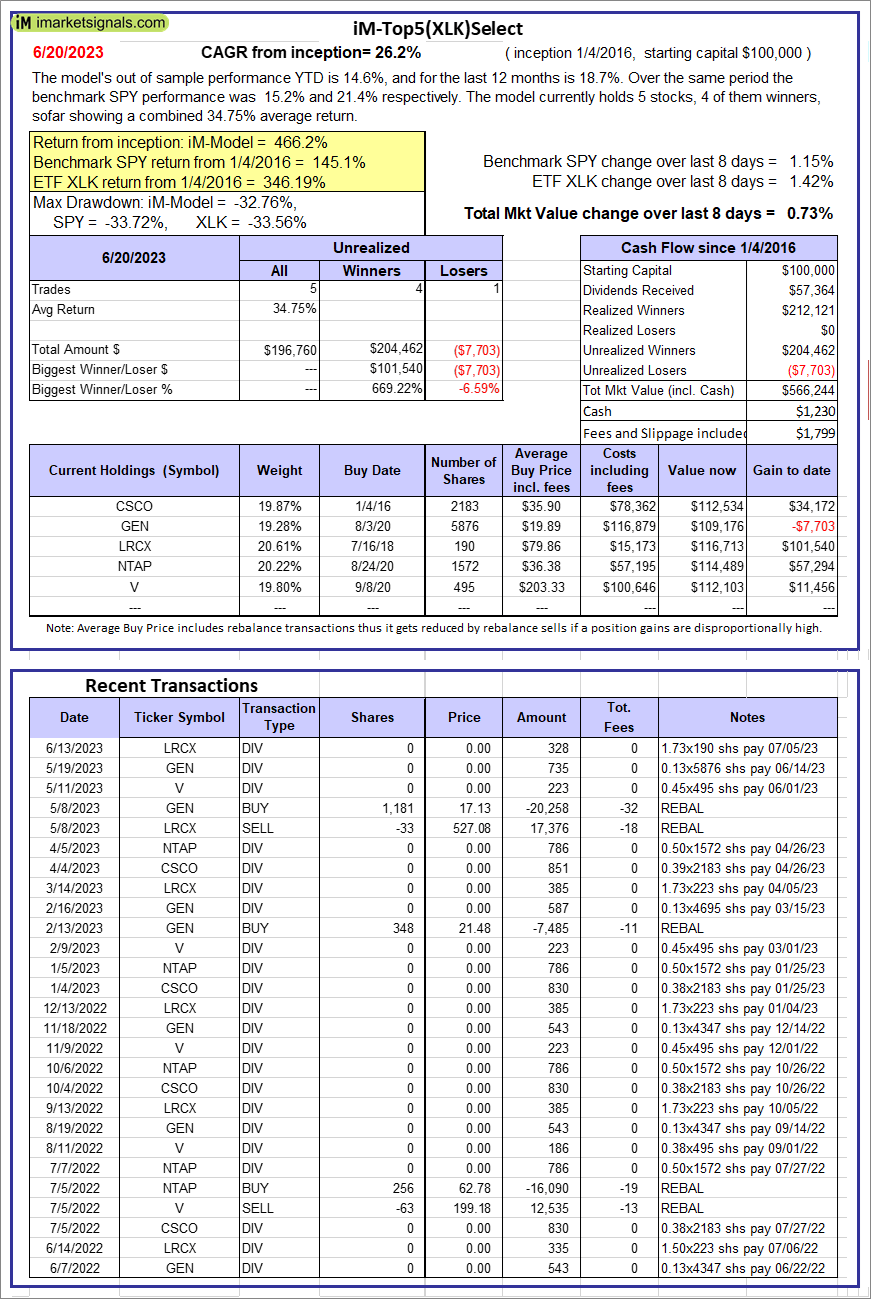 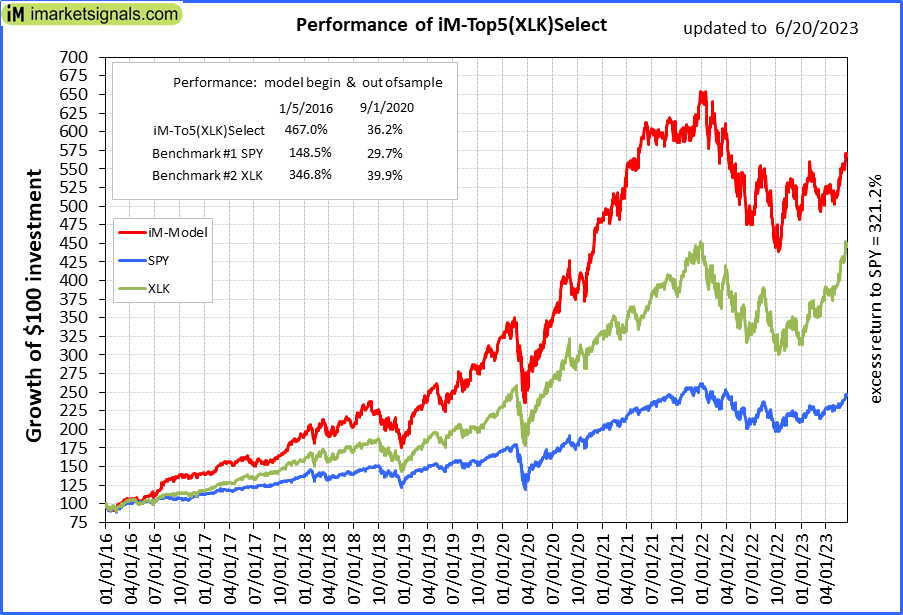 |
iM-Top5(XLK)Select: Since inception, on 1/5/2016, the model gained 466.24% while the benchmark SPY gained 145.05% over the same period. Over the previous week the market value of iM-Top5(XLK)Select gained 0.73% at a time when SPY gained 1.15%. A starting capital of $100,000 at inception on 1/5/2016 would have grown to $566,244 which includes $1,230 cash and excludes $1,799 spent on fees and slippage. |
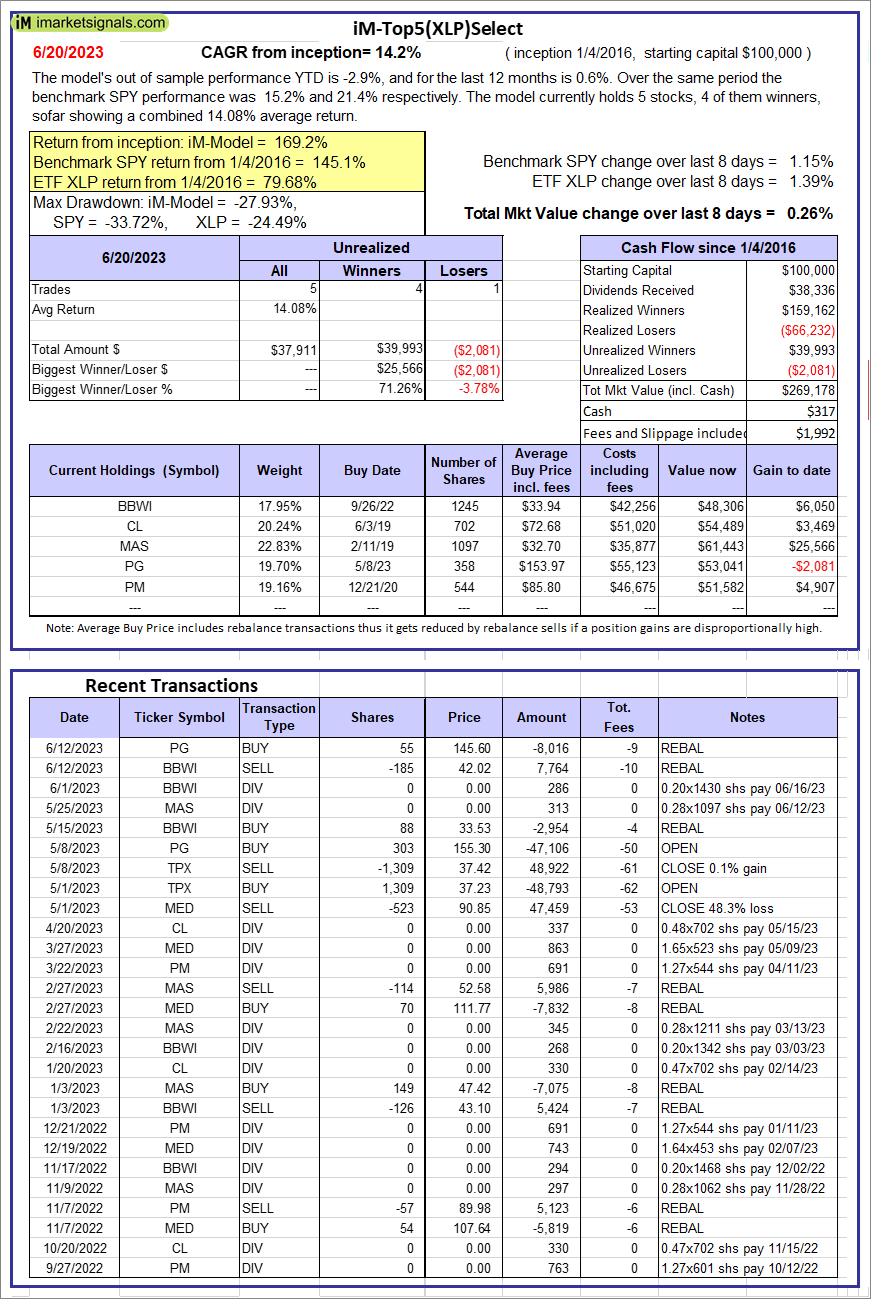 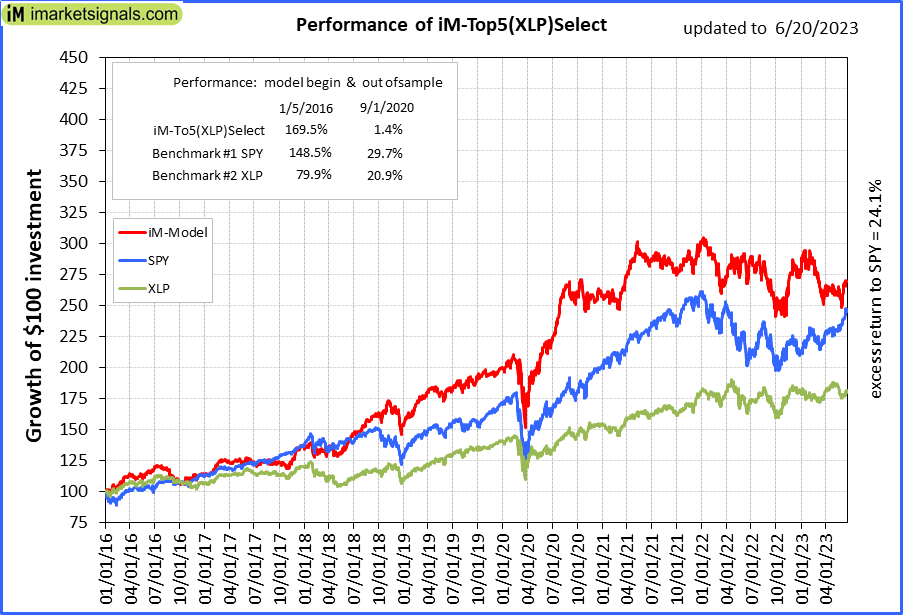 |
iM-Top5(XLP)Select: Since inception, on 1/5/2016, the model gained 169.18% while the benchmark SPY gained 145.05% over the same period. Over the previous week the market value of iM-Top5(XLP)Select gained 0.26% at a time when SPY gained 1.15%. A starting capital of $100,000 at inception on 1/5/2016 would have grown to $269,178 which includes $317 cash and excludes $1,992 spent on fees and slippage. |
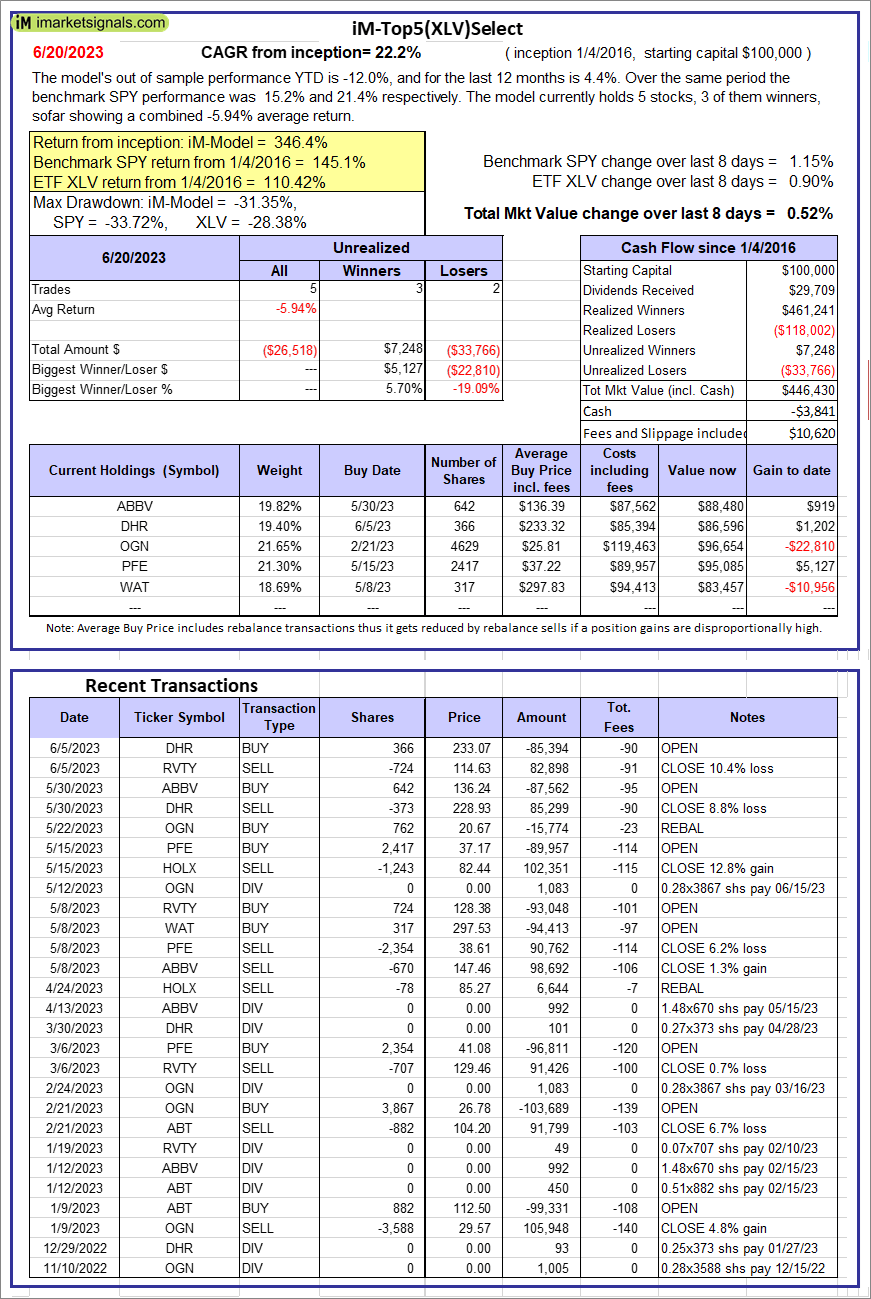 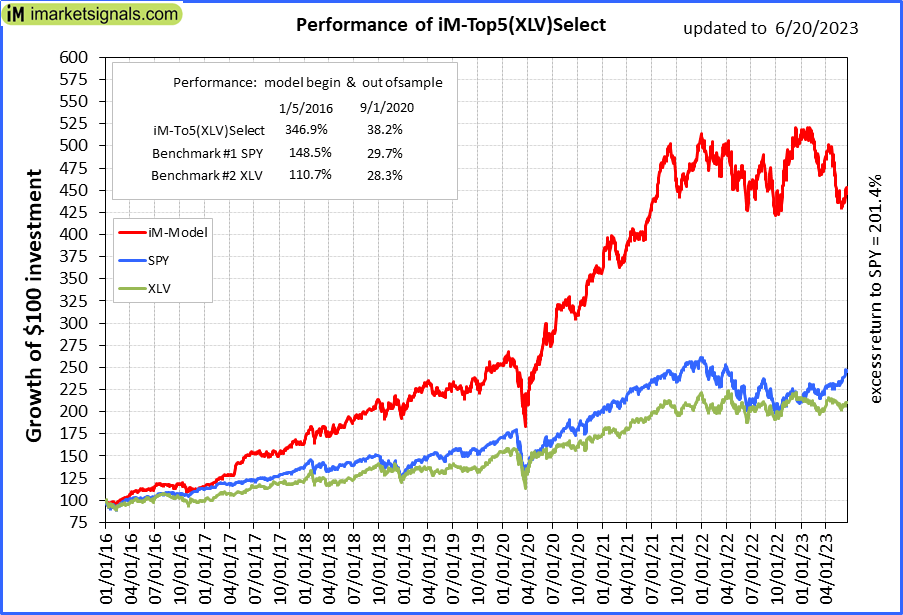 |
iM-Top5(XLV)Select: Since inception, on 1/5/2016, the model gained 346.43% while the benchmark SPY gained 145.05% over the same period. Over the previous week the market value of iM-Top5(XLV)Select gained 0.52% at a time when SPY gained 1.15%. A starting capital of $100,000 at inception on 1/5/2016 would have grown to $446,430 which includes -$3,841 cash and excludes $10,620 spent on fees and slippage. |
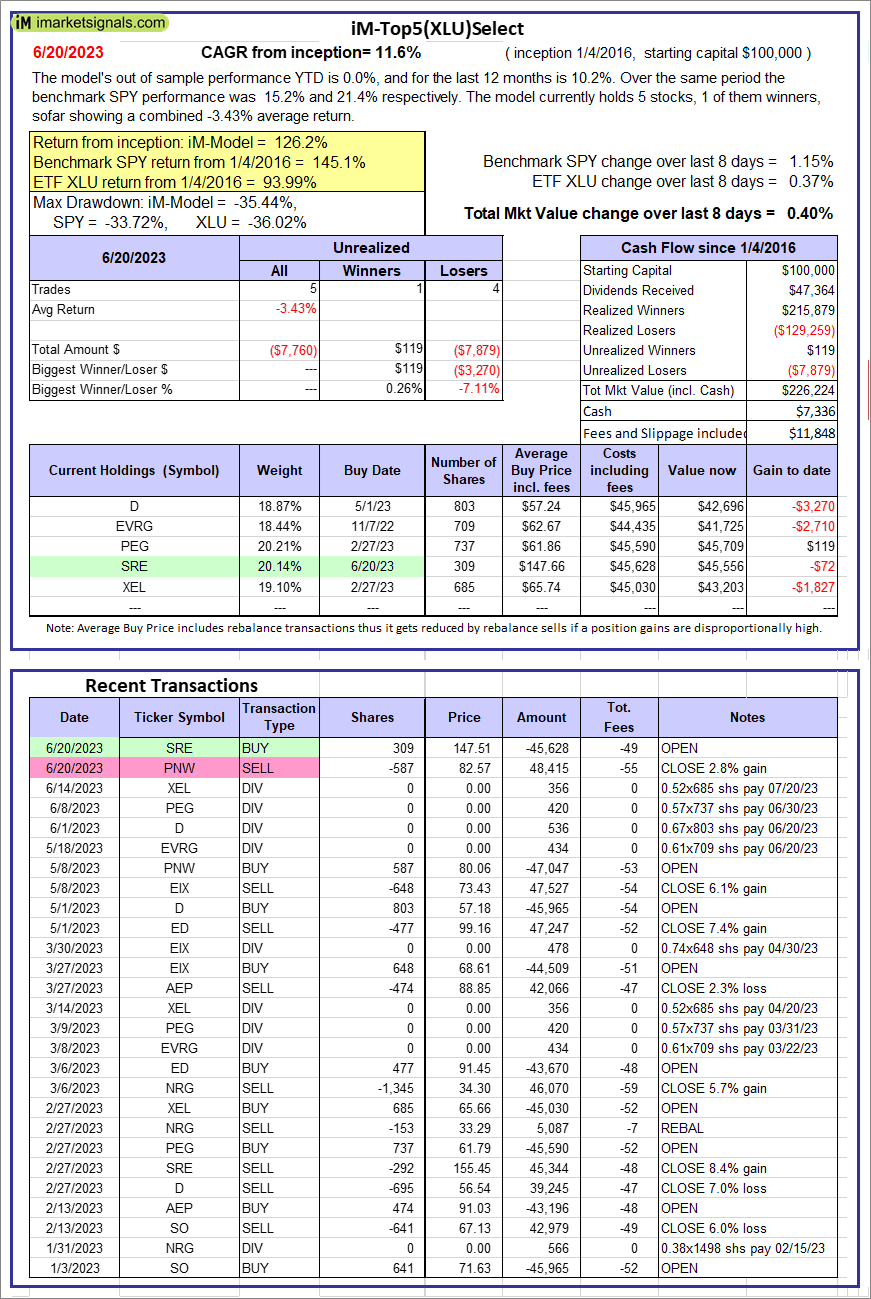 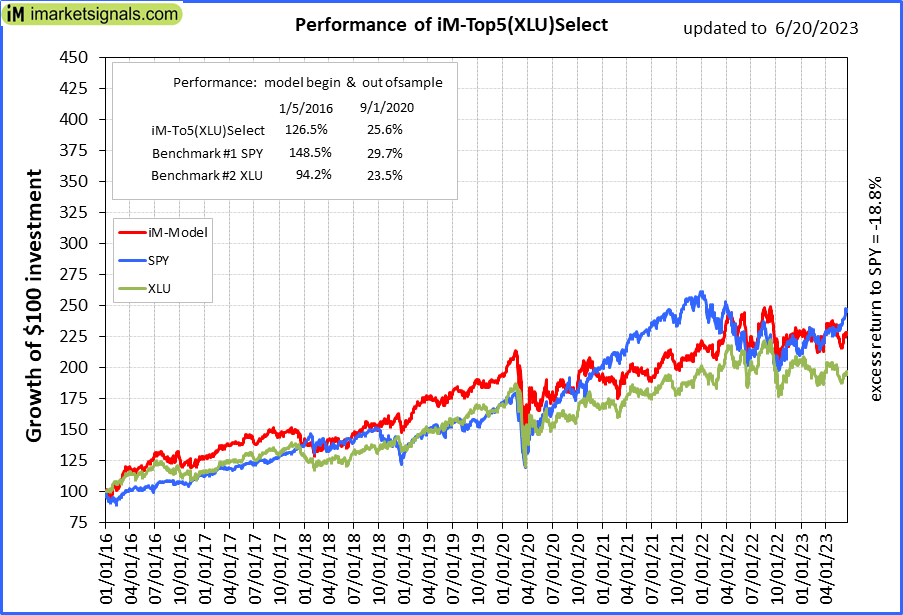 |
iM-Top5(XLU)Select: Since inception, on 1/5/2016, the model gained 126.22% while the benchmark SPY gained 145.05% over the same period. Over the previous week the market value of iM-Top5(XLU)Select gained 0.40% at a time when SPY gained 1.15%. A starting capital of $100,000 at inception on 1/5/2016 would have grown to $226,224 which includes $7,336 cash and excludes $11,848 spent on fees and slippage. |
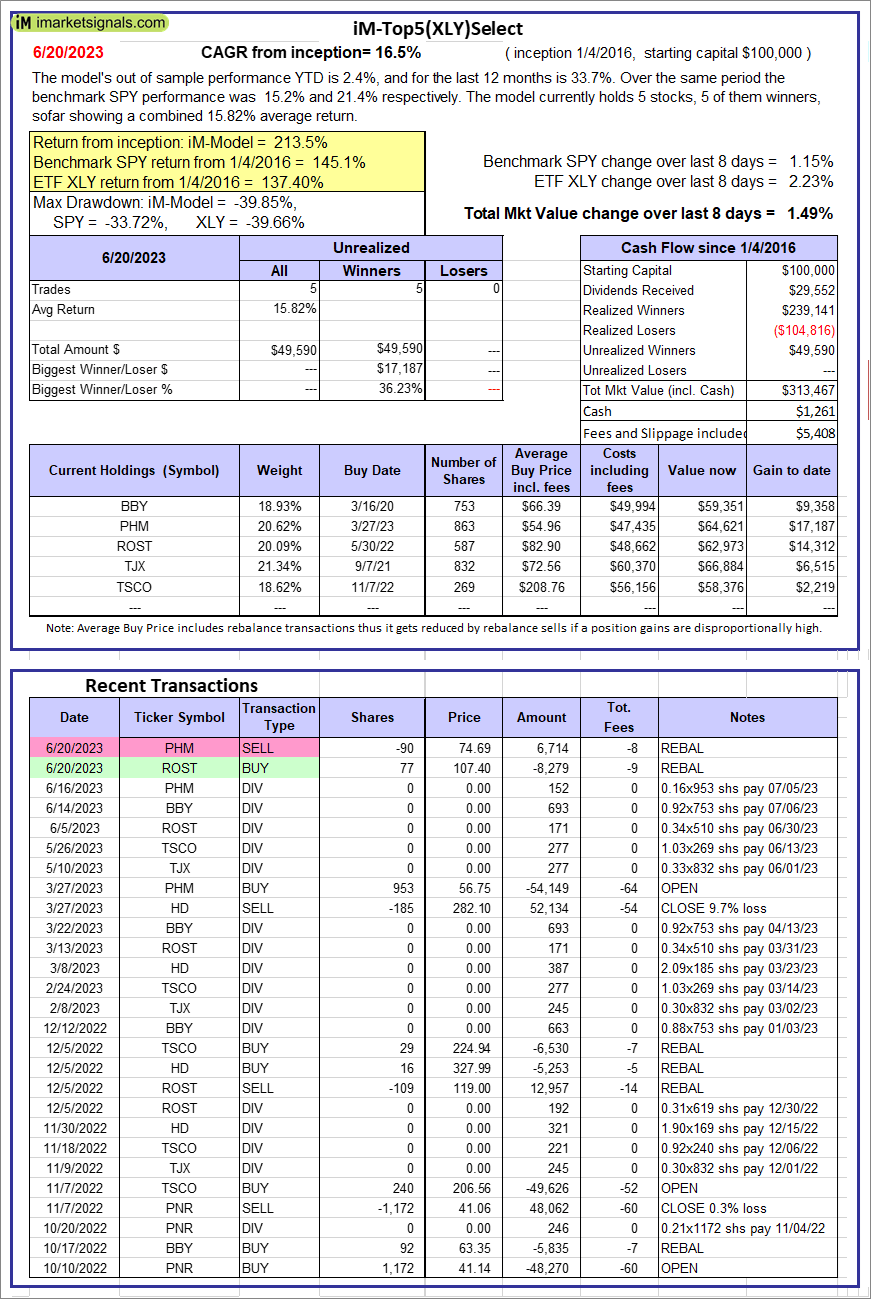 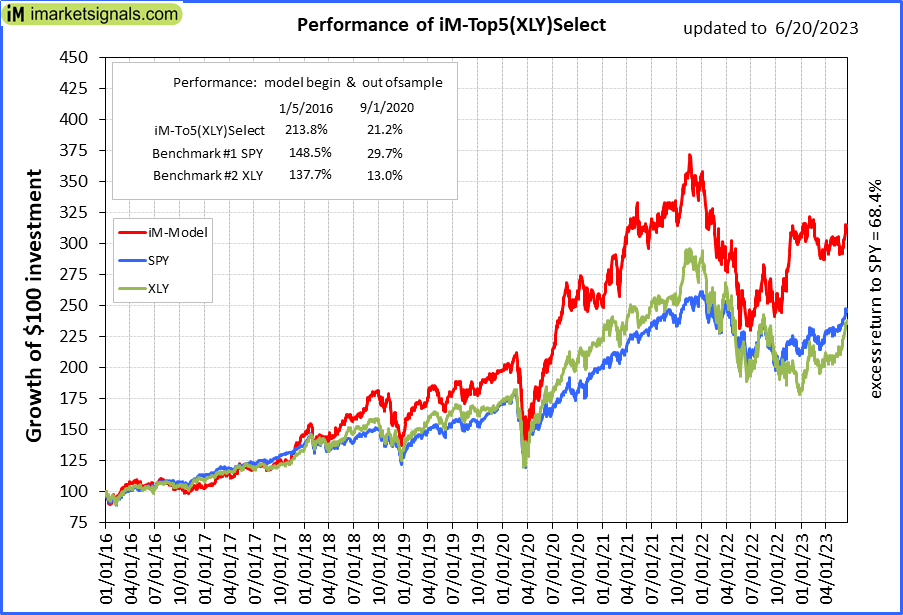 |
iM-Top5(XLY)Select: Since inception, on 1/5/2016, the model gained 213.47% while the benchmark SPY gained 145.05% over the same period. Over the previous week the market value of iM-Top5(XLY)Select gained 1.49% at a time when SPY gained 1.15%. A starting capital of $100,000 at inception on 1/5/2016 would have grown to $313,467 which includes $1,261 cash and excludes $5,408 spent on fees and slippage. |
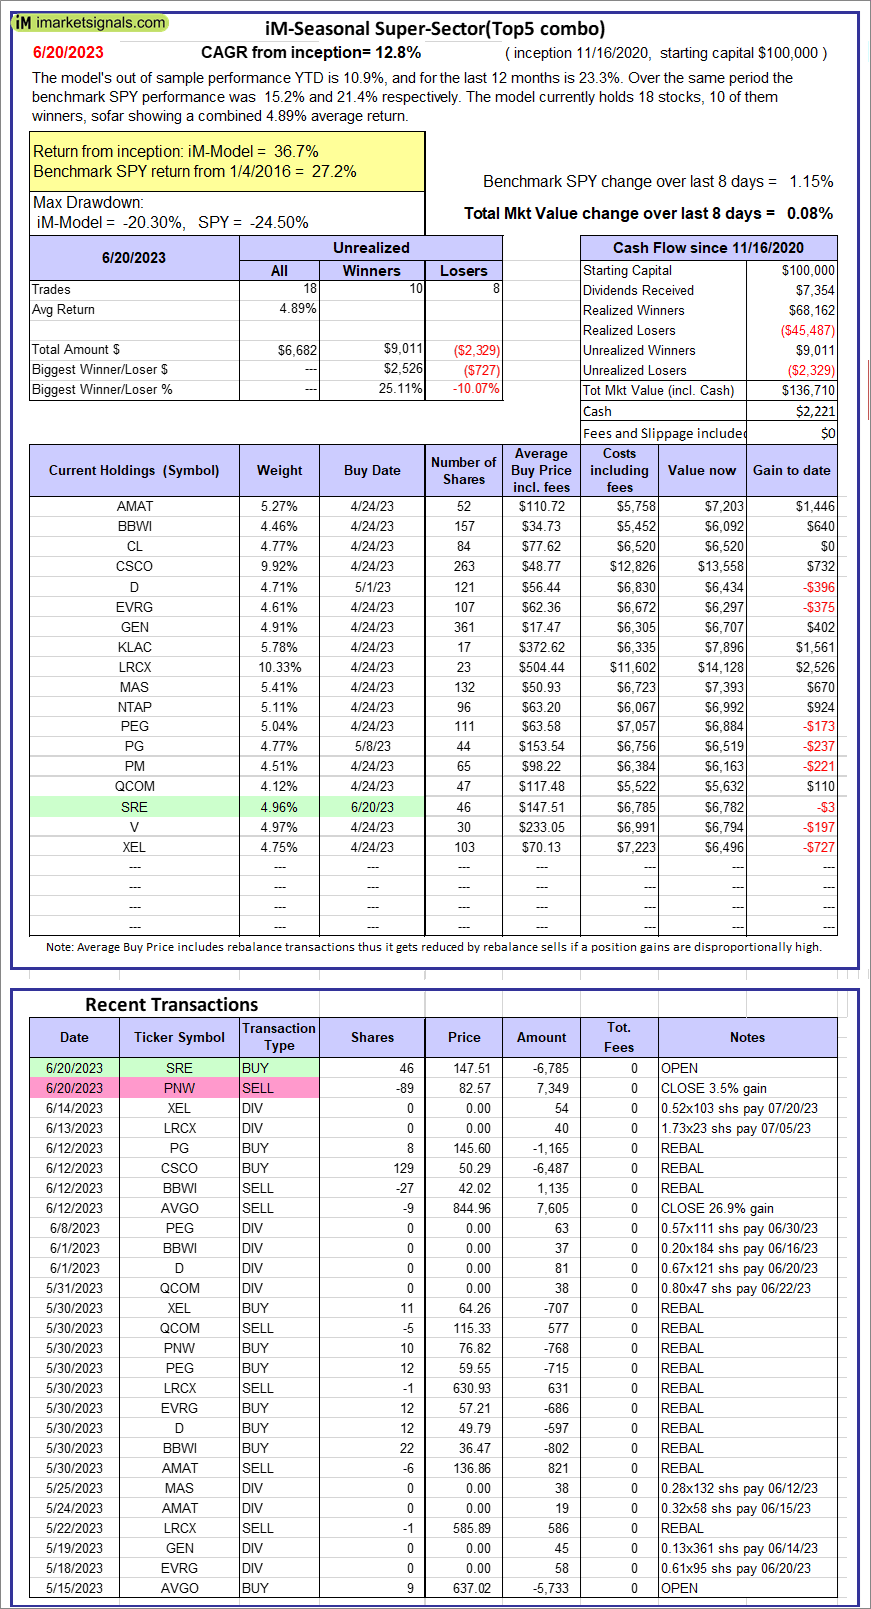 |
iM-Seasonal Super-Sectors (Top5 combo) : Since inception, on 11/17/2020, the model gained 36.71% while the benchmark SPY gained 27.21% over the same period. Over the previous week the market value of iM-Seasonal Super-Sectors (Top5 combo) gained 0.08% at a time when SPY gained 1.15%. A starting capital of $100,000 at inception on 11/17/2020 would have grown to $136,710 which includes $2,221 cash and excludes $00 spent on fees and slippage. |
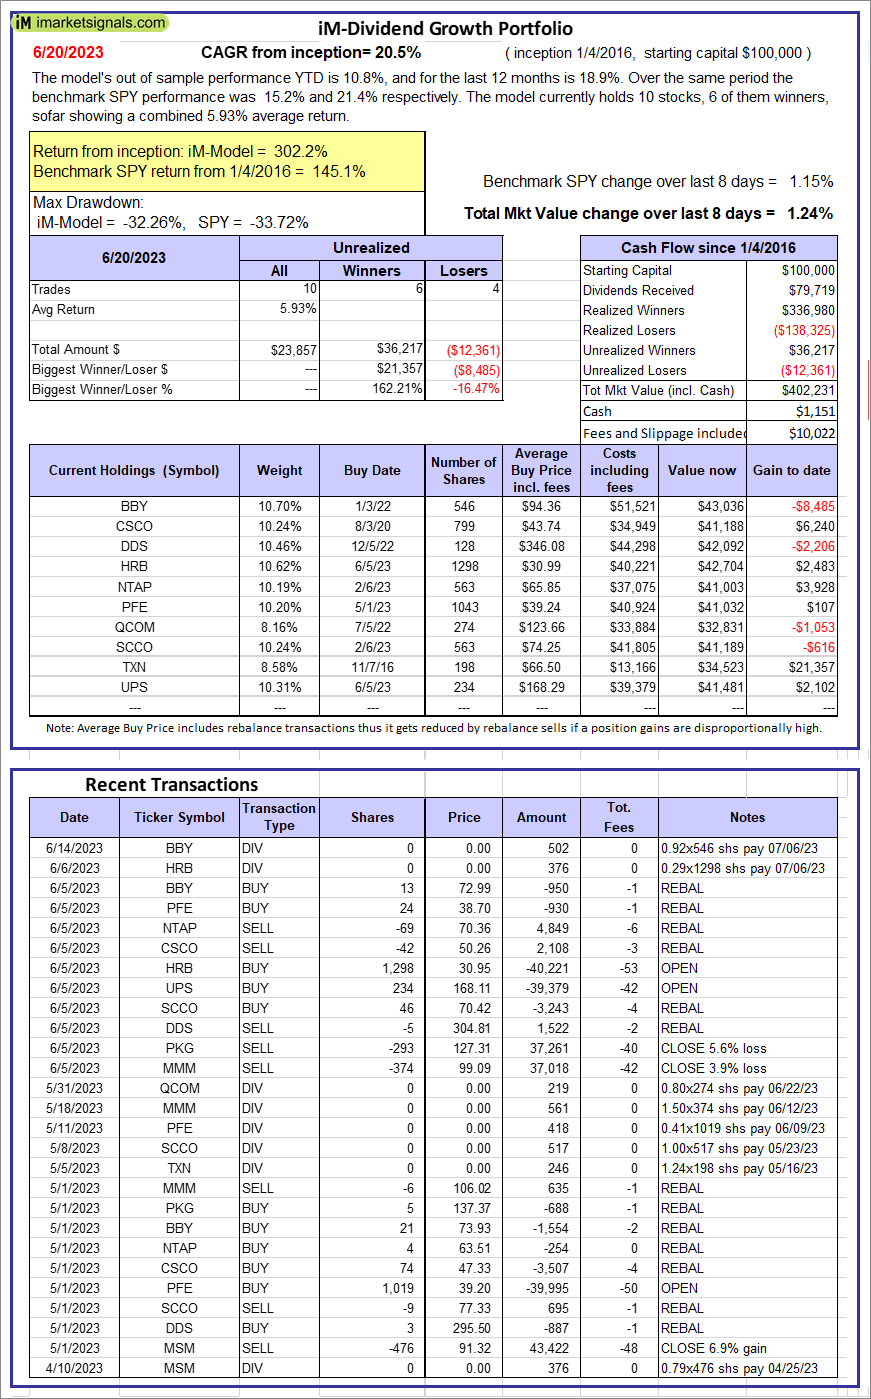 |
iM-Dividend Growth Portfolio: The model’s out of sample performance YTD is 10.8%, and for the last 12 months is 18.9%. Over the same period the benchmark SPY performance was 15.2% and 21.4% respectively. Over the previous week the market value of the iM-Dividend Growth Portfolio gained 1.24% at a time when SPY gained 1.15%. A starting capital of $100,000 at inception on 6/30/2016 would have grown to $402,231 which includes $1,151 cash and excludes $10,022 spent on fees and slippage. |
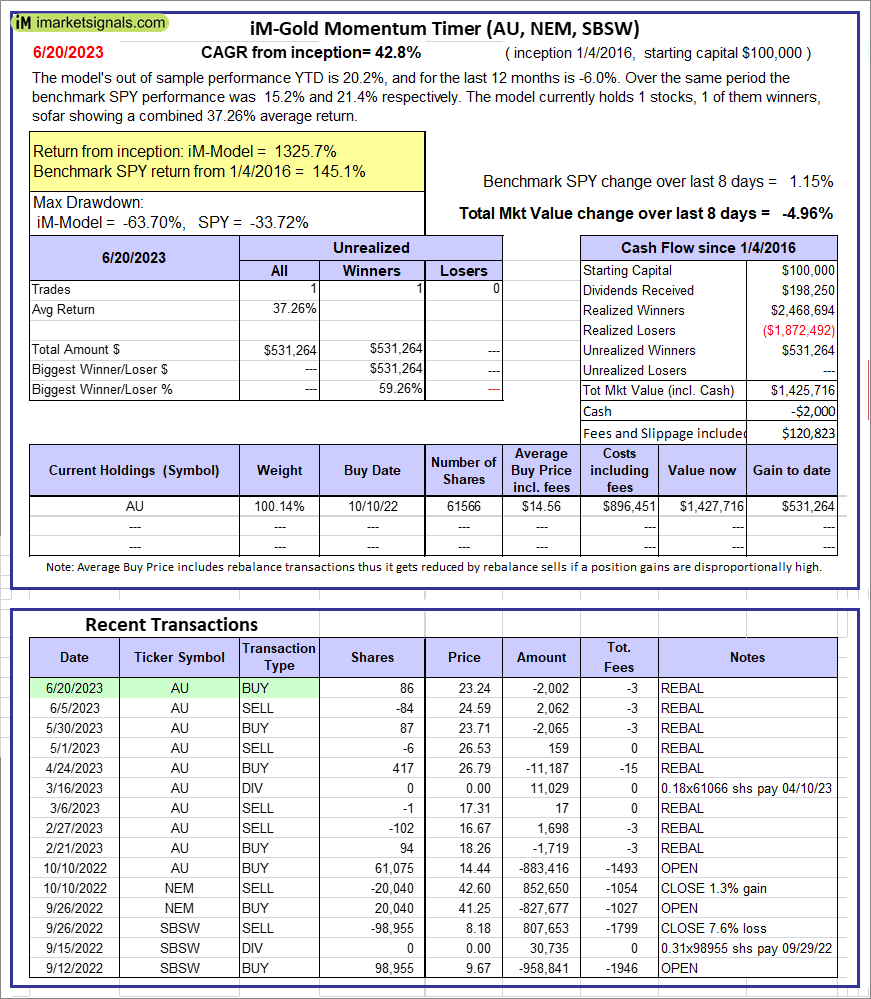 |
iM-Gold Momentum Timer (AU, NEM, SBSW): The model’s out of sample performance YTD is 20.2%, and for the last 12 months is -6.0%. Over the same period the benchmark SPY performance was 15.2% and 21.4% respectively. Over the previous week the market value of iM-Gold Momentum Timer (AU, NEM, SBSW) gained -4.96% at a time when SPY gained 1.15%. A starting capital of $100,000 at inception on 6/30/2016 would have grown to -$2,000 which includes $120,823 cash and excludes Gain to date spent on fees and slippage. |
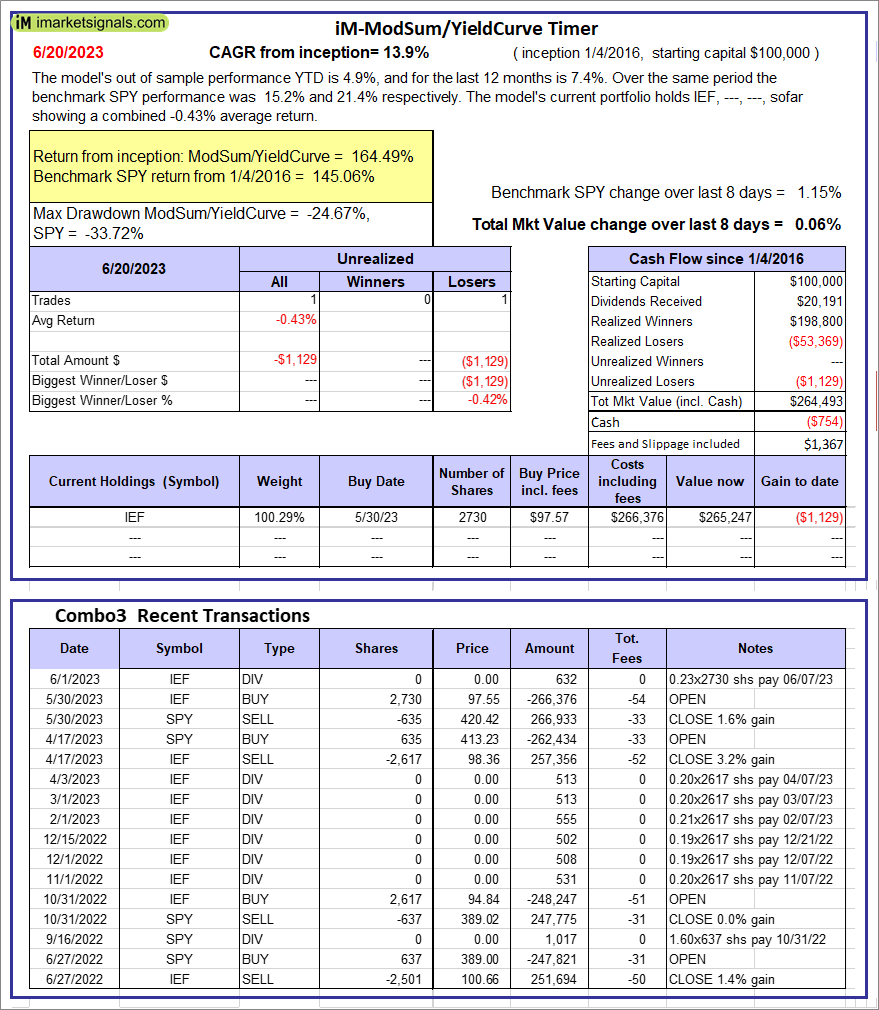 |
iM-ModSum/YieldCurve Timer: The model’s out of sample performance YTD is 4.9%, and for the last 12 months is 7.4%. Over the same period the benchmark SPY performance was 15.2% and 21.4% respectively. Over the previous week the market value of iM-PortSum/YieldCurve Timer gained 0.06% at a time when SPY gained 1.15%. A starting capital of $100,000 at inception on 1/1/2016 would have grown to $264,493 which includes -$754 cash and excludes $1,367 spent on fees and slippage. |
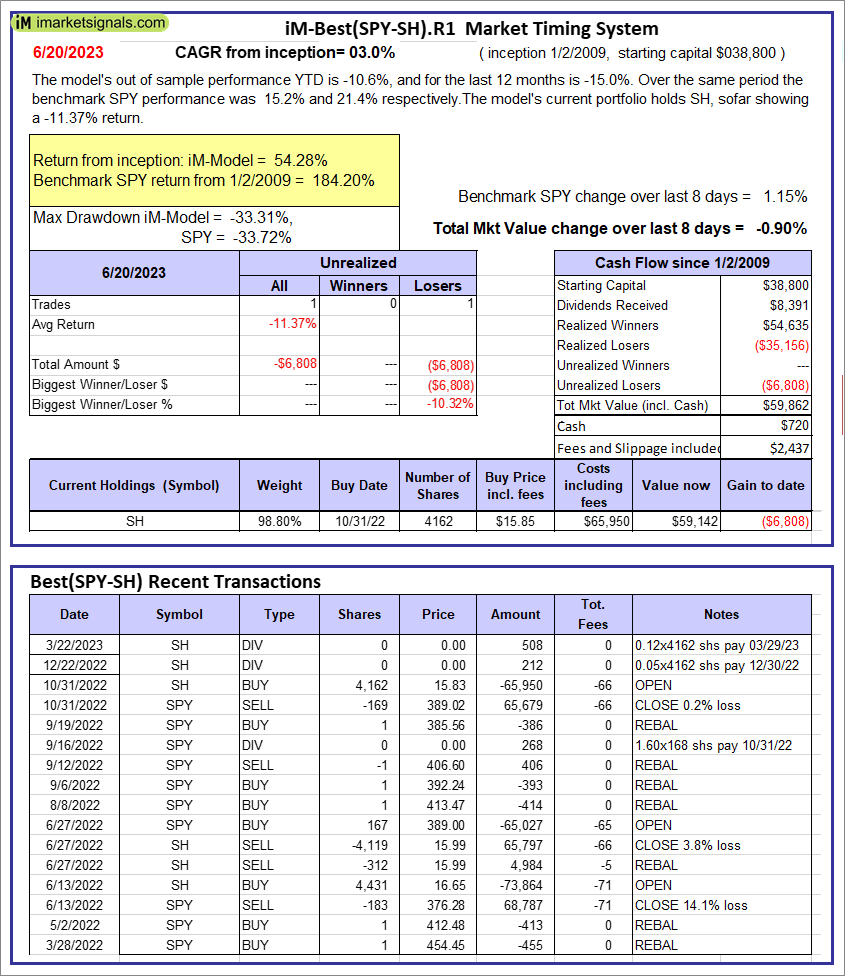 |
iM-Best(SPY-SH).R1: The model’s out of sample performance YTD is -10.6%, and for the last 12 months is -15.0%. Over the same period the benchmark SPY performance was 15.2% and 21.4% respectively. Over the previous week the market value of Best(SPY-SH) gained -0.90% at a time when SPY gained 1.15%. A starting capital of $100,000 at inception on 1/2/2009 would have grown to $59,862 which includes $720 cash and excludes $2,437 spent on fees and slippage. |
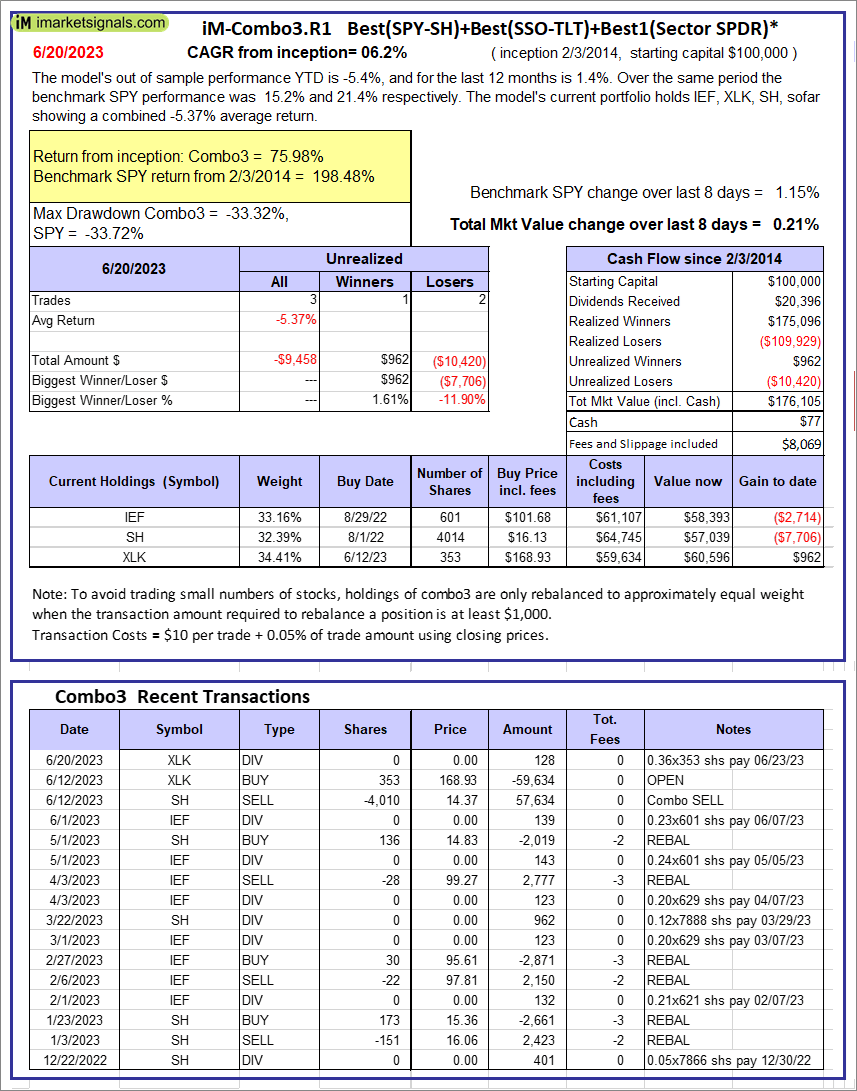 |
iM-Combo3.R1: The model’s out of sample performance YTD is -5.4%, and for the last 12 months is 1.4%. Over the same period the benchmark SPY performance was 15.2% and 21.4% respectively. Over the previous week the market value of iM-Combo3.R1 gained 0.21% at a time when SPY gained 1.15%. A starting capital of $100,000 at inception on 2/3/2014 would have grown to $176,105 which includes $77 cash and excludes $8,069 spent on fees and slippage. |
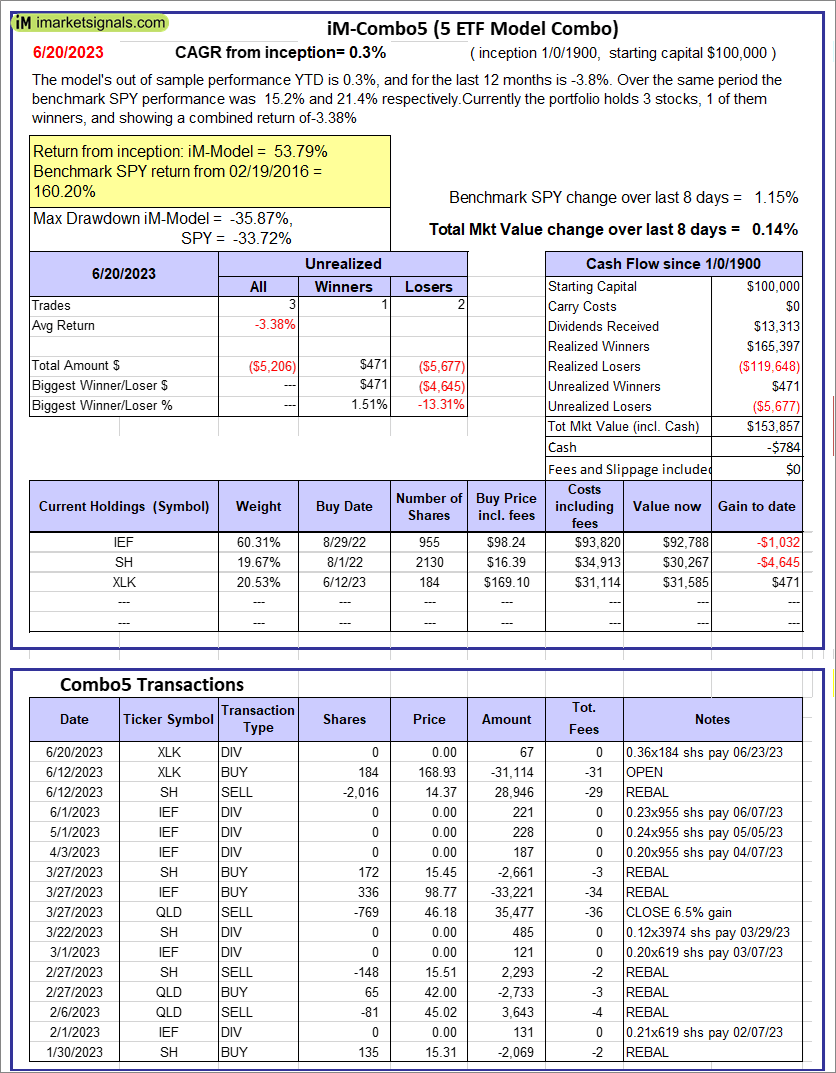 |
iM-Combo5: The model’s out of sample performance YTD is 0.3%, and for the last 12 months is -3.8%. Over the same period the benchmark SPY performance was 15.2% and 21.4% respectively. Over the previous week the market value of iM-Combo5 gained 0.14% at a time when SPY gained 1.15%. A starting capital of $100,000 at inception on 2/22/2016 would have grown to $153,857 which includes -$784 cash and excludes $0 spent on fees and slippage. |
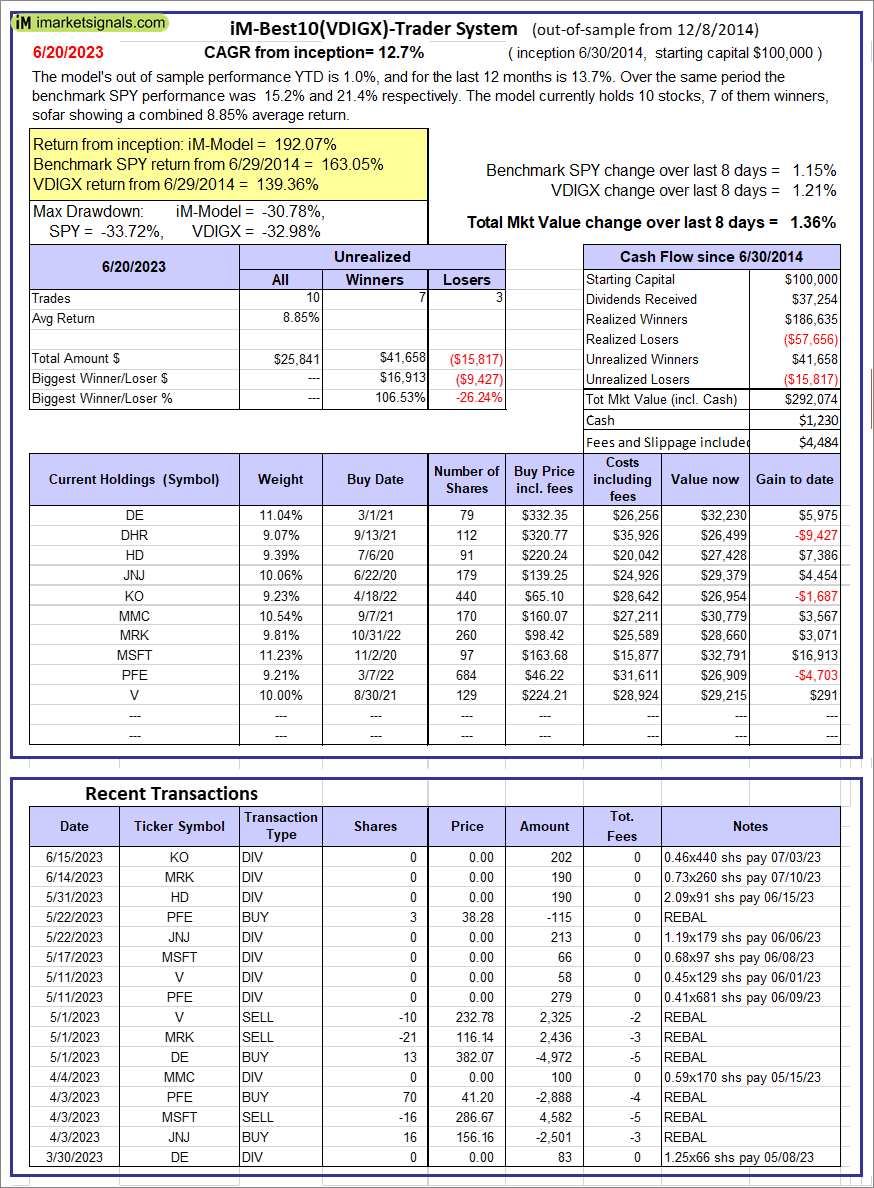 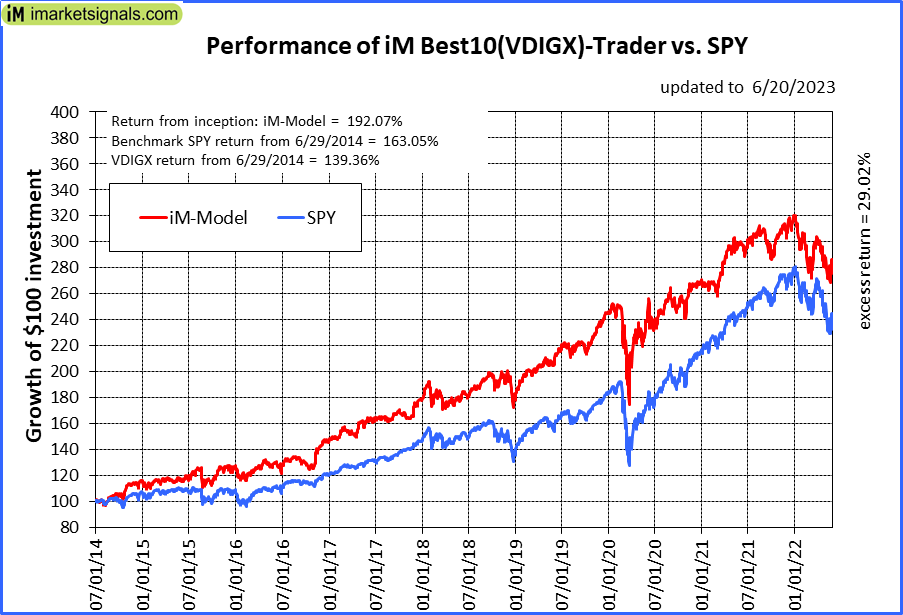 |
iM-Best10(VDIGX)-Trader: The model’s out of sample performance YTD is 1.0%, and for the last 12 months is 13.7%. Over the same period the benchmark SPY performance was 15.2% and 21.4% respectively. Since inception, on 7/1/2014, the model gained 192.07% while the benchmark SPY gained 163.05% and VDIGX gained 139.36% over the same period. Over the previous week the market value of iM-Best10(VDIGX) gained 1.36% at a time when SPY gained 1.15%. A starting capital of $100,000 at inception on 7/1/2014 would have grown to $292,074 which includes $1,230 cash and excludes $4,484 spent on fees and slippage. |
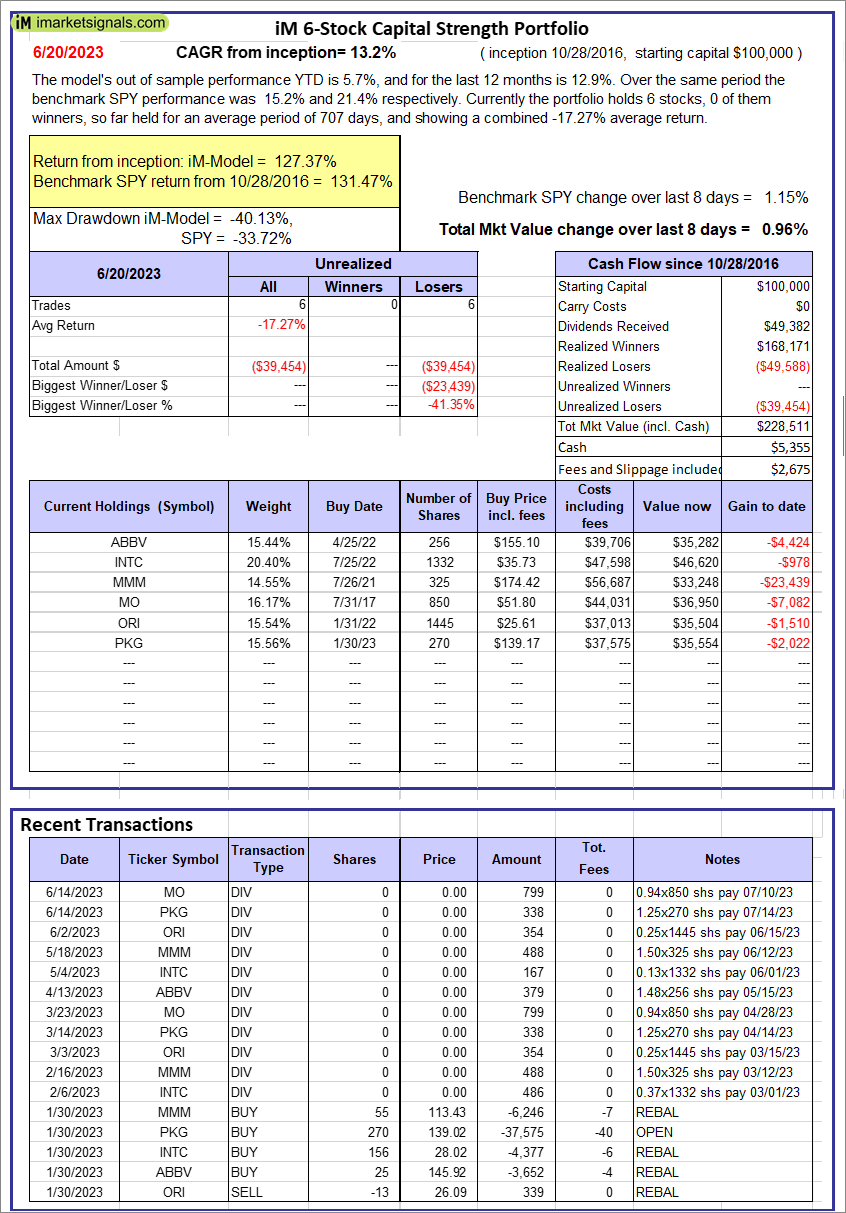 |
iM 6-Stock Capital Strength Portfolio: The model’s out of sample performance YTD is 5.7%, and for the last 12 months is 12.9%. Over the same period the benchmark SPY performance was 15.2% and 21.4% respectively. Over the previous week the market value of the iM 6-Stock Capital Strength Portfolio gained 0.96% at a time when SPY gained 1.15%. A starting capital of $100,000 at inception on 10/28/2016 would have grown to $228,511 which includes $5,355 cash and excludes $2,675 spent on fees and slippage. |
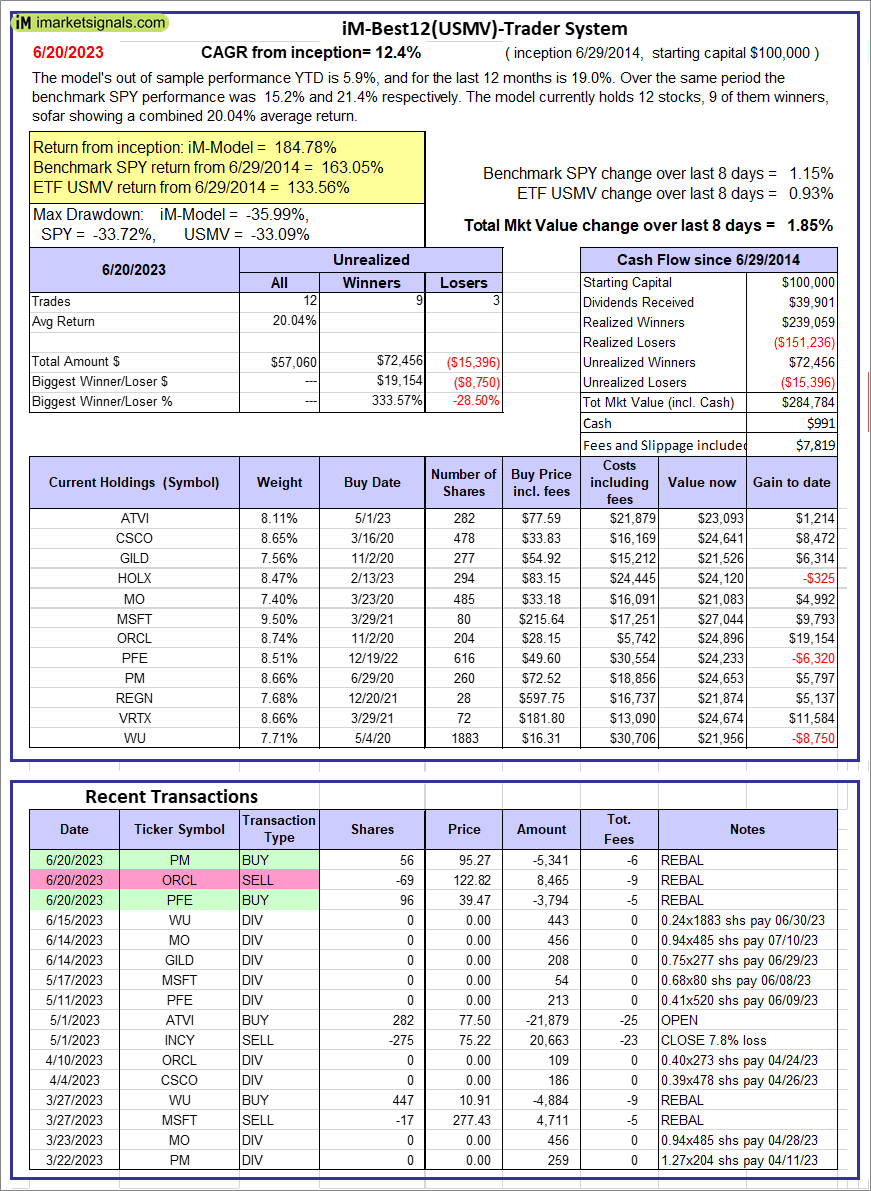 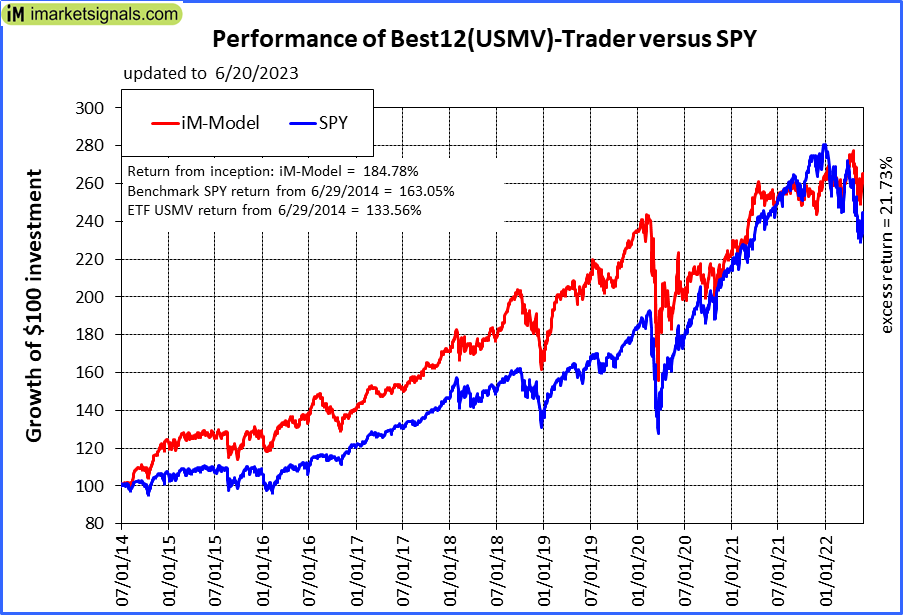 |
iM-Best12(USMV)-Trader: The model’s out of sample performance YTD is 5.9%, and for the last 12 months is 19.0%. Over the same period the benchmark SPY performance was 15.2% and 21.4% respectively. Since inception, on 6/30/2014, the model gained 184.78% while the benchmark SPY gained 163.05% and the ETF USMV gained 133.56% over the same period. Over the previous week the market value of iM-Best12(USMV)-Trader gained 1.85% at a time when SPY gained 1.15%. A starting capital of $100,000 at inception on 6/30/2014 would have grown to $284,784 which includes $991 cash and excludes $7,819 spent on fees and slippage. |
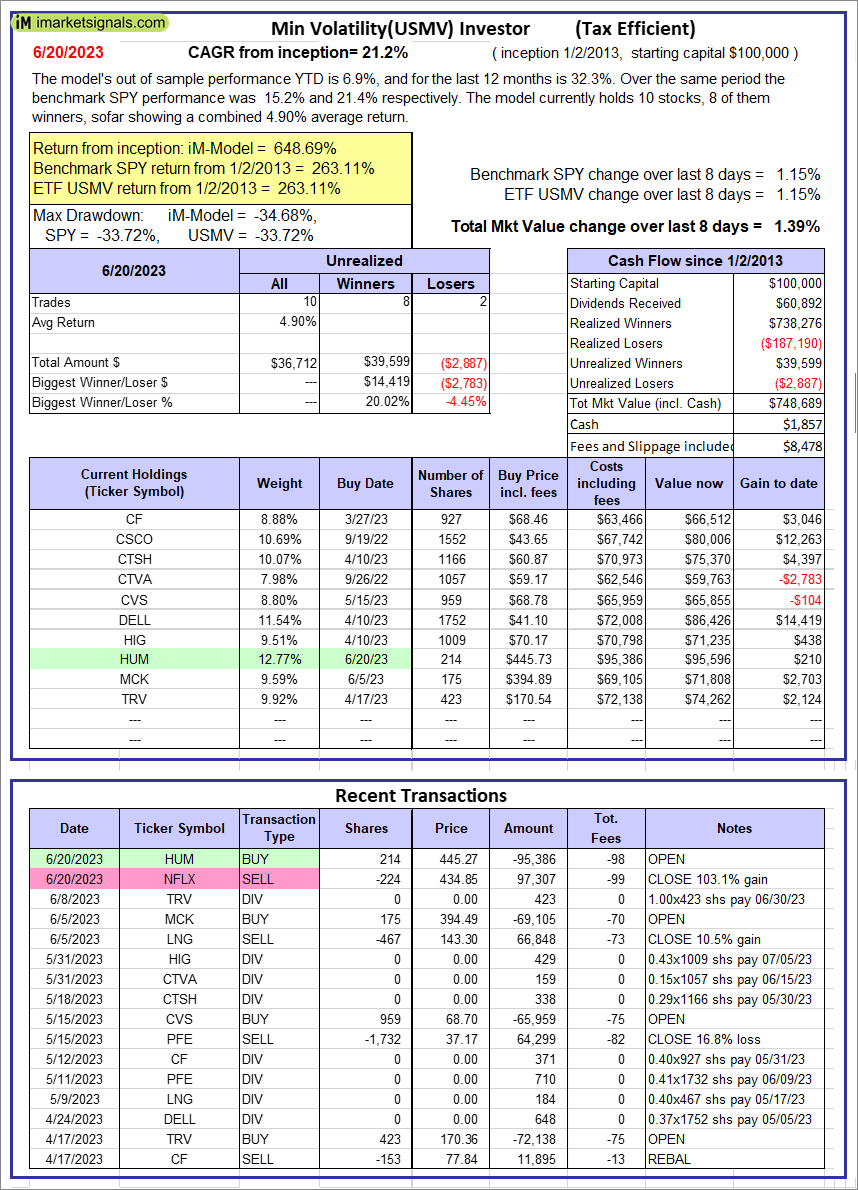 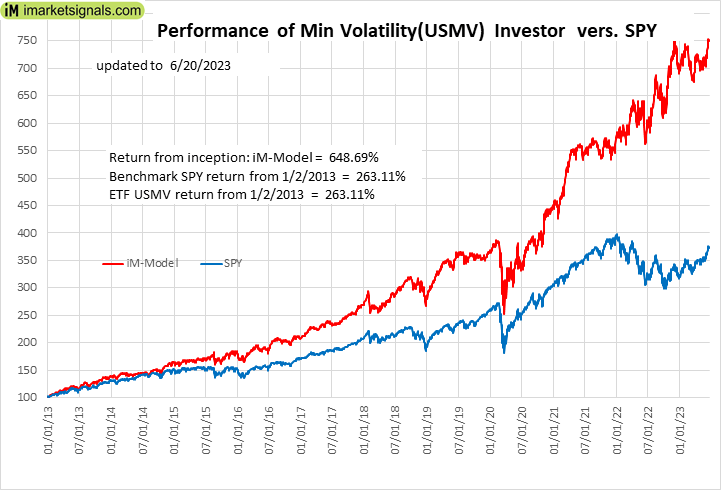 |
iM-Min Volatility(USMV) Investor (Tax Efficient): The model’s out of sample performance YTD is 6.9%, and for the last 12 months is 32.3%. Over the same period the benchmark SPY performance was 15.2% and 21.4% respectively. Since inception, on 1/3/2013, the model gained 648.69% while the benchmark SPY gained 263.11% and the ETF USMV gained 263.11% over the same period. Over the previous week the market value of iM-Best12(USMV)Q1 gained 1.39% at a time when SPY gained 1.15%. A starting capital of $100,000 at inception on 1/3/2013 would have grown to $748,689 which includes $1,857 cash and excludes $8,478 spent on fees and slippage. |
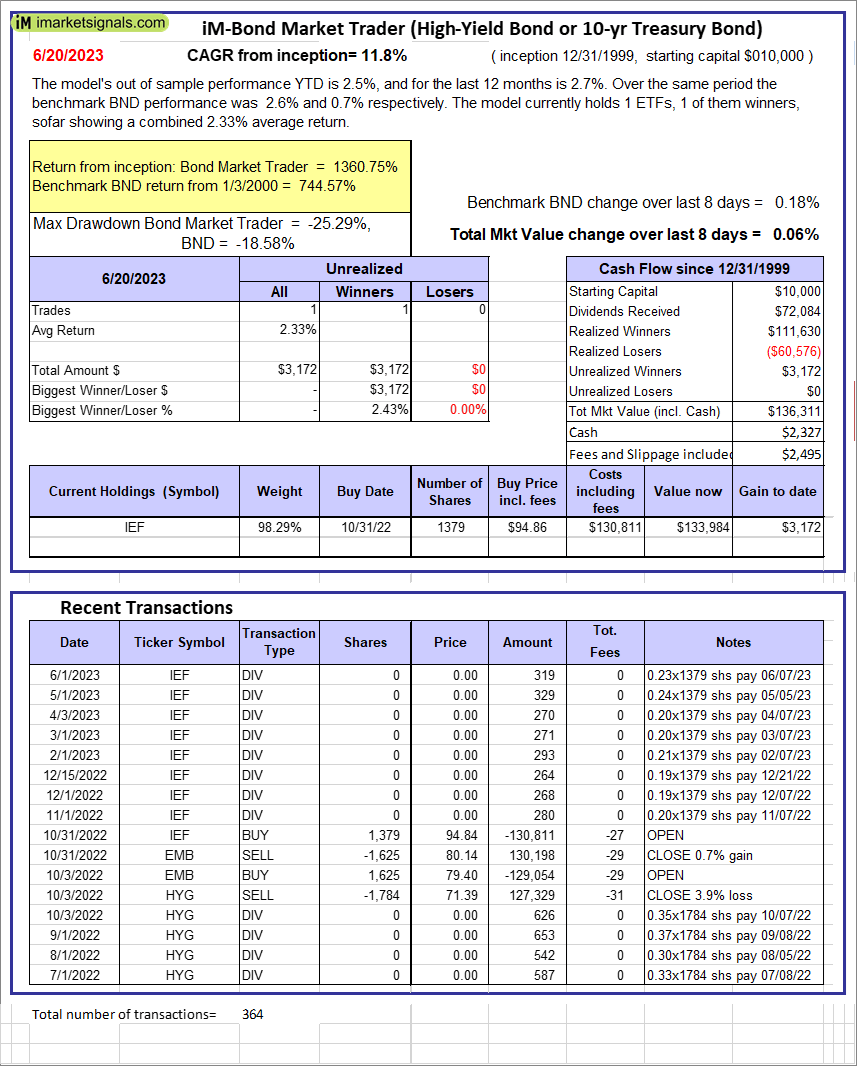 |
iM-Bond Market Trader (High-Yield Bond or 10-yr Treasury Bond): The model’s out of sample performance YTD is 2.5%, and for the last 12 months is 2.7%. Over the same period the benchmark BND performance was 2.6% and 0.7% respectively. Over the previous week the market value of the iM-Bond Market Trader (High-Yield Bond or 10-yr Treasury Bond) gained 0.06% at a time when BND gained 0.18%. A starting capital of $10,000 at inception on 1/3/2000 would have grown to $136,311 which includes $2,327 cash and excludes $2,495 spent on fees and slippage. |
|
|
iM-ModSum/YieldCurve Timer: The model’s out of sample performance YTD is 4.9%, and for the last 12 months is 7.4%. Over the same period the benchmark SPY performance was 15.2% and 21.4% respectively. Over the previous week the market value of iM-PortSum/YieldCurve Timer gained 0.06% at a time when SPY gained 1.15%. A starting capital of $100,000 at inception on 1/1/2016 would have grown to $264,493 which includes -$754 cash and excludes $1,367 spent on fees and slippage. |
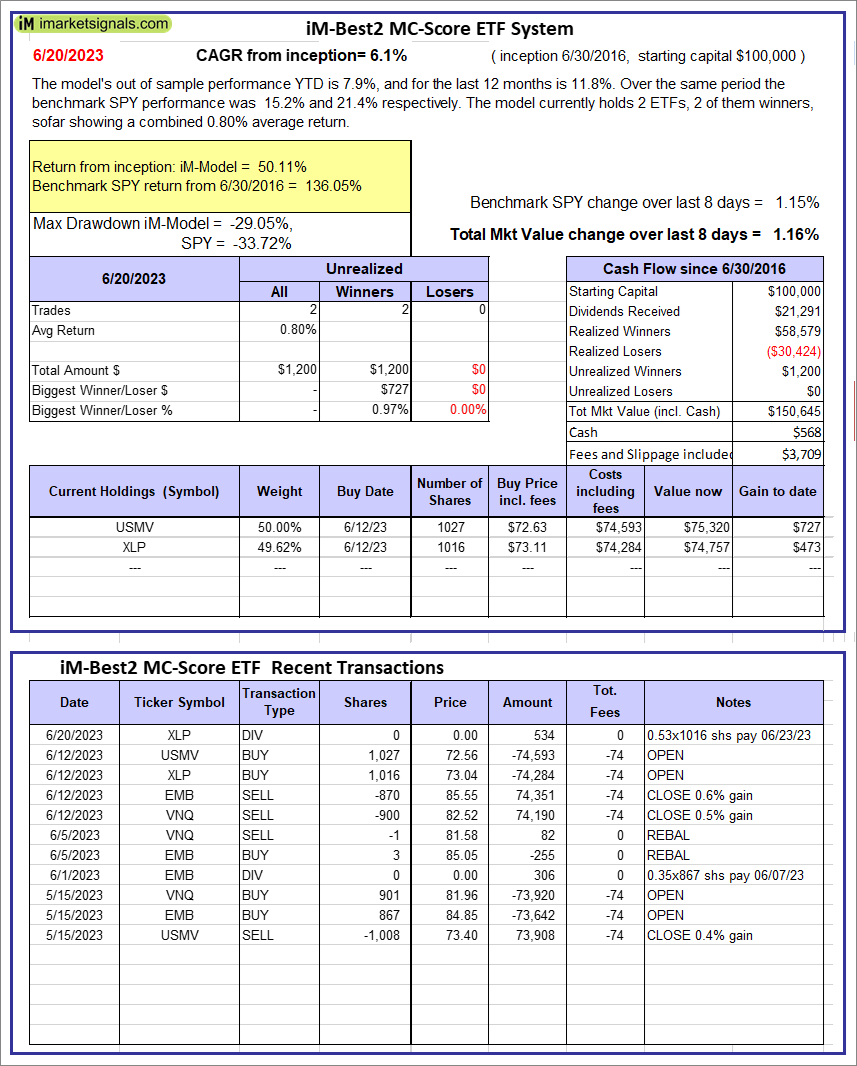 |
iM-Best2 MC-Score ETF System: The model’s out of sample performance YTD is 7.9%, and for the last 12 months is 11.8%. Over the same period the benchmark SPY performance was 15.2% and 21.4% respectively. Over the previous week the market value of the iM-Best2 MC-Score ETF System gained 1.16% at a time when SPY gained 1.15%. A starting capital of $100,000 at inception on 6/30/2016 would have grown to $150,645 which includes $568 cash and excludes $3,709 spent on fees and slippage. |
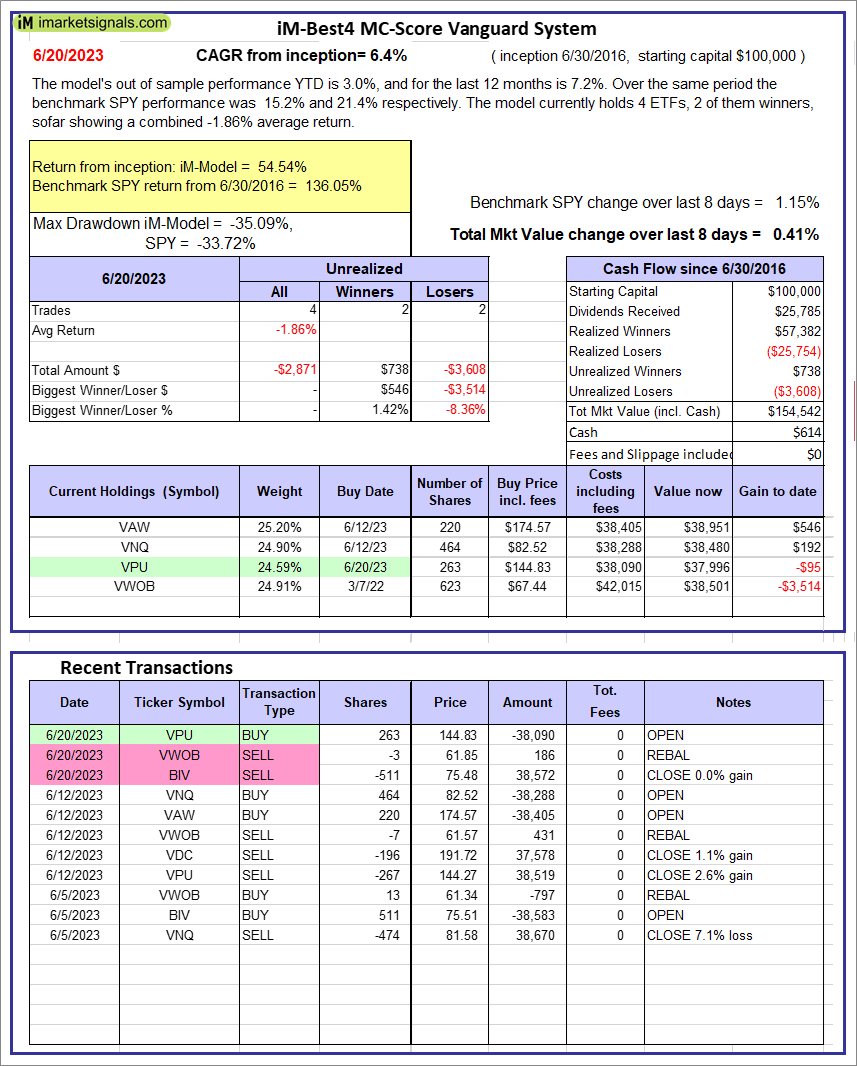 |
iM-Best4 MC-Score Vanguard System: The model’s out of sample performance YTD is 3.0%, and for the last 12 months is 7.2%. Over the same period the benchmark SPY performance was 15.2% and 21.4% respectively. Over the previous week the market value of the iM-Best4 MC-Score Vanguard System gained 0.41% at a time when SPY gained 1.15%. A starting capital of $100,000 at inception on 6/30/2016 would have grown to $154,542 which includes $614 cash and excludes $00 spent on fees and slippage. |
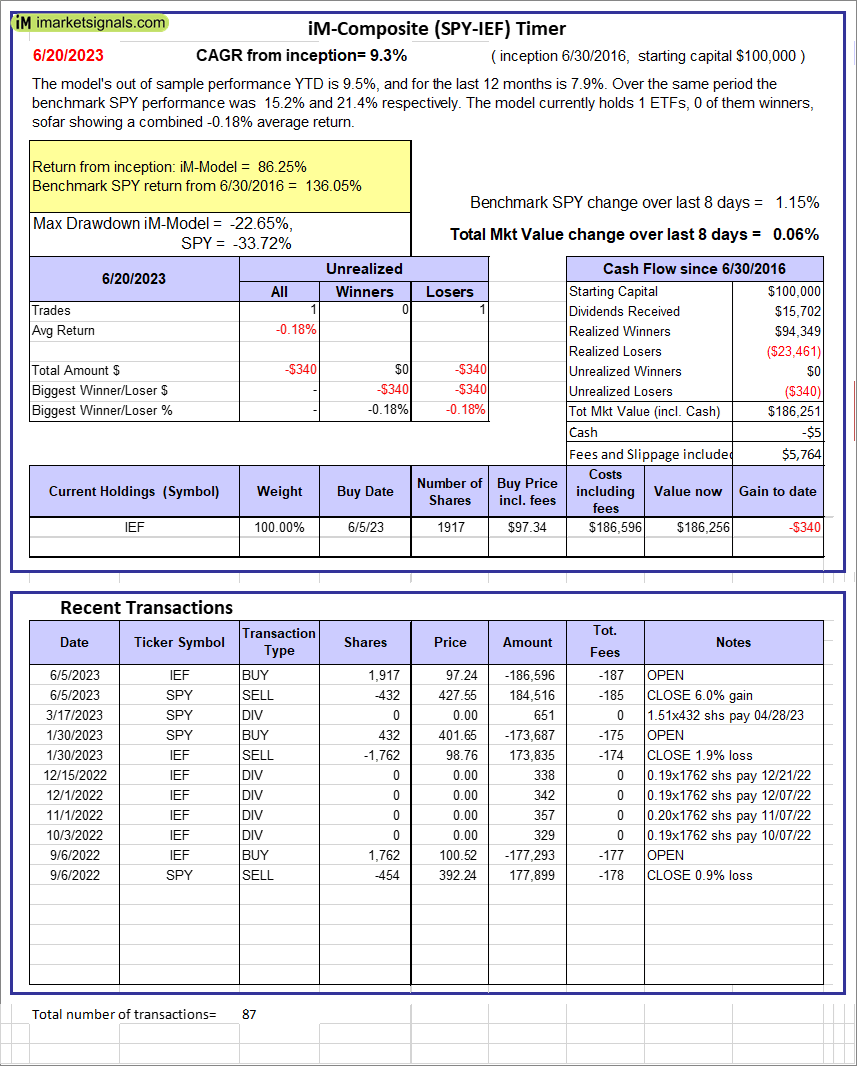 |
iM-Composite (SPY-IEF) Timer: The model’s out of sample performance YTD is 9.5%, and for the last 12 months is 7.9%. Over the same period the benchmark SPY performance was 15.2% and 21.4% respectively. Over the previous week the market value of the iM-Composite (SPY-IEF) Timer gained 0.06% at a time when SPY gained 1.15%. A starting capital of $100,000 at inception on 6/30/2016 would have grown to $186,251 which includes -$5 cash and excludes $5,764 spent on fees and slippage. |
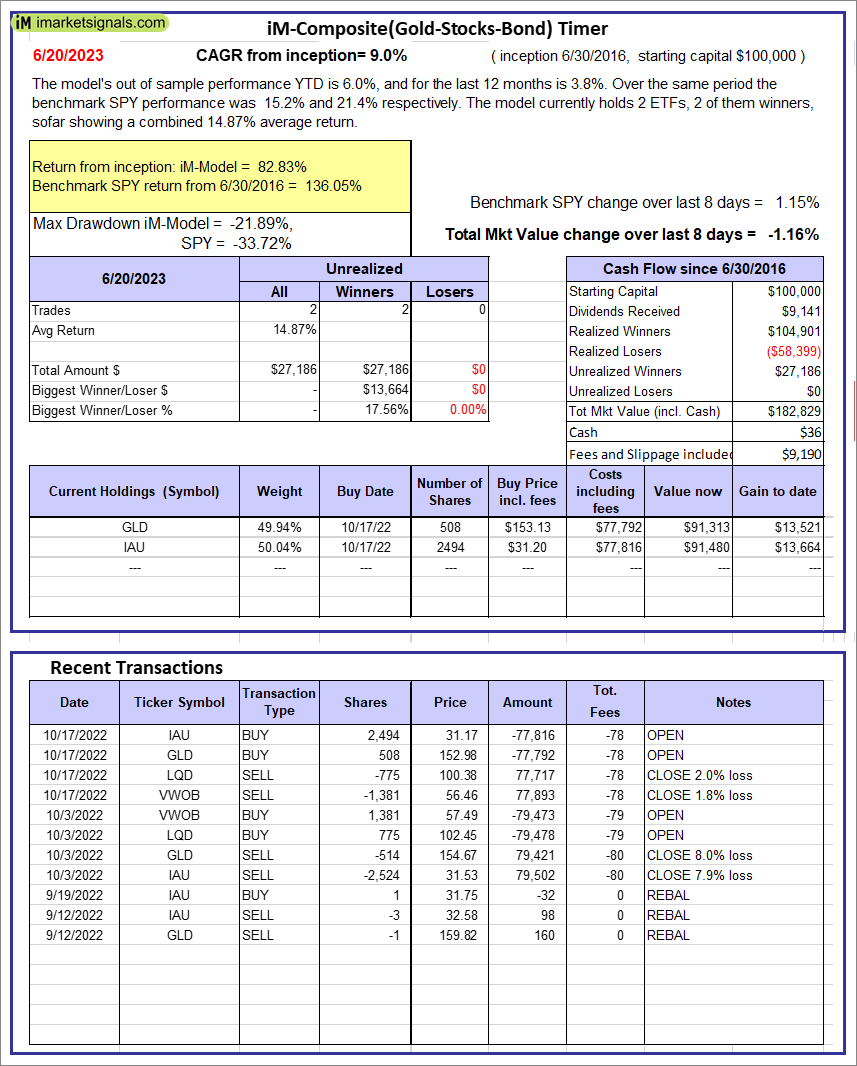 |
iM-Composite(Gold-Stocks-Bond) Timer: The model’s out of sample performance YTD is 6.0%, and for the last 12 months is 3.8%. Over the same period the benchmark SPY performance was 15.2% and 21.4% respectively. Over the previous week the market value of the iM-Composite(Gold-Stocks-Bond) Timer gained -1.16% at a time when SPY gained 1.15%. A starting capital of $100,000 at inception on 6/30/2016 would have grown to $182,829 which includes $36 cash and excludes $9,190 spent on fees and slippage. |
iM-Best Reports – 6/20/2023
Posted in pmp SPY-SH
Leave a Reply
You must be logged in to post a comment.