
  |
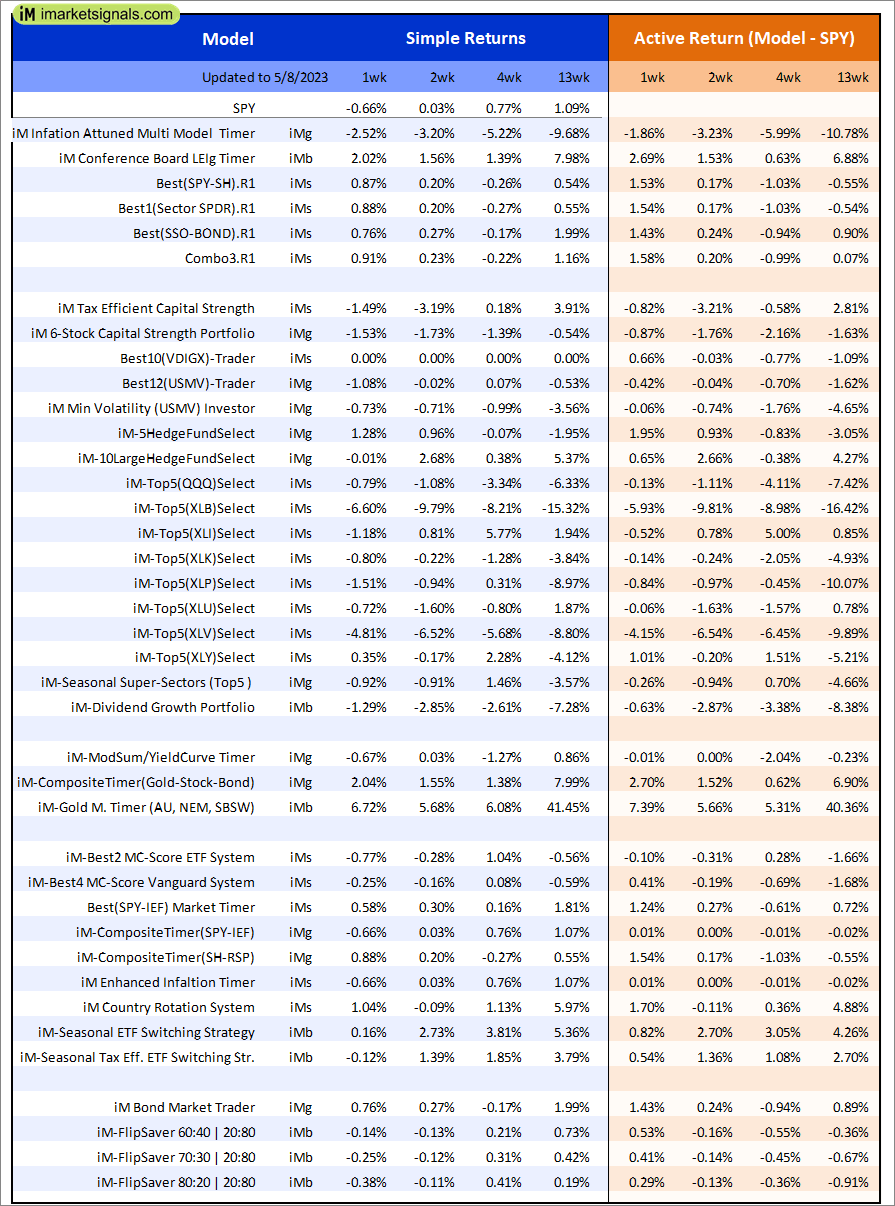
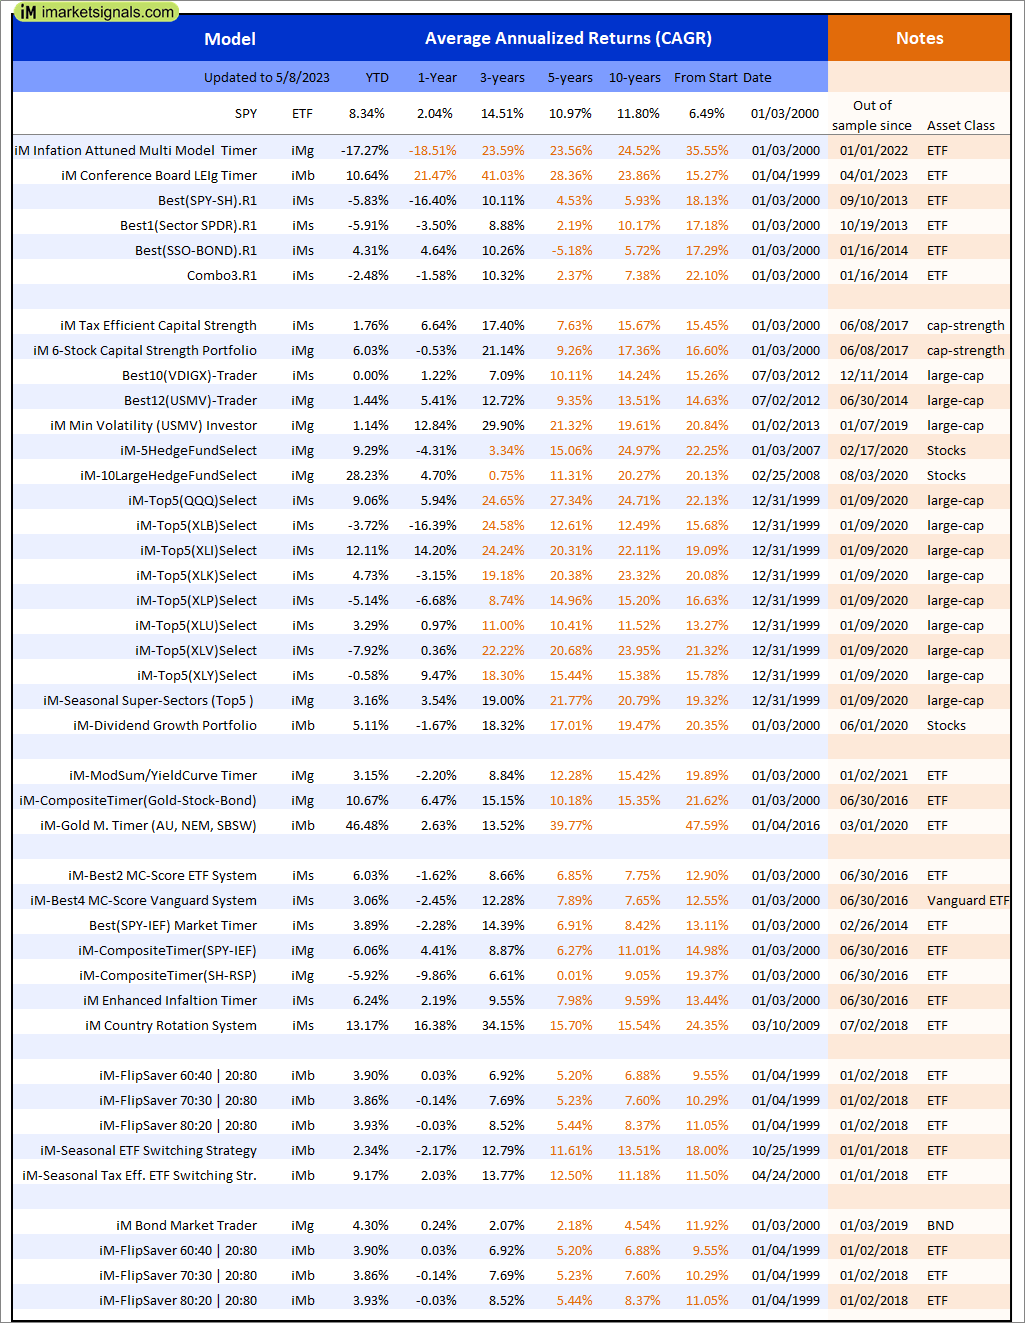
Out of sample performance summary of our models for the past 1, 2, 4 and 13 week periods. The active active return indicates how the models over- or underperformed the benchmark ETF SPY. Also the YTD, and the 1-, 3-, 5- and 10-year annualized returns are shown in the second table |
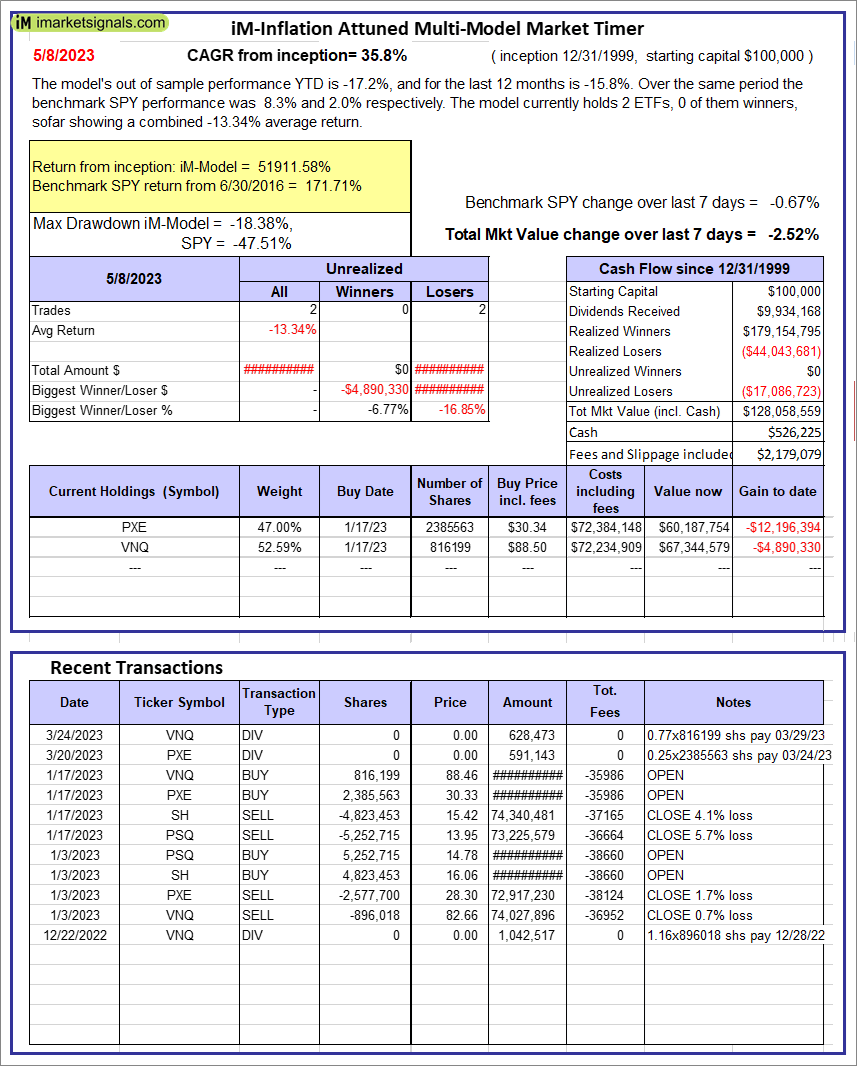 |
iM-Inflation Attuned Multi-Model Market Timer: The model’s out of sample performance YTD is -17.2%, and for the last 12 months is -15.8%. Over the same period the benchmark SPY performance was 8.3% and 2.0% respectively. Over the previous week the market value of the iM-Inflation Attuned Multi-Model Market Timer gained -2.52% at a time when SPY gained -0.67%. A starting capital of $100,000 at inception on 3/24/2017 would have grown to $128,058,559 which includes $526,225 cash and excludes $2,179,079 spent on fees and slippage. |
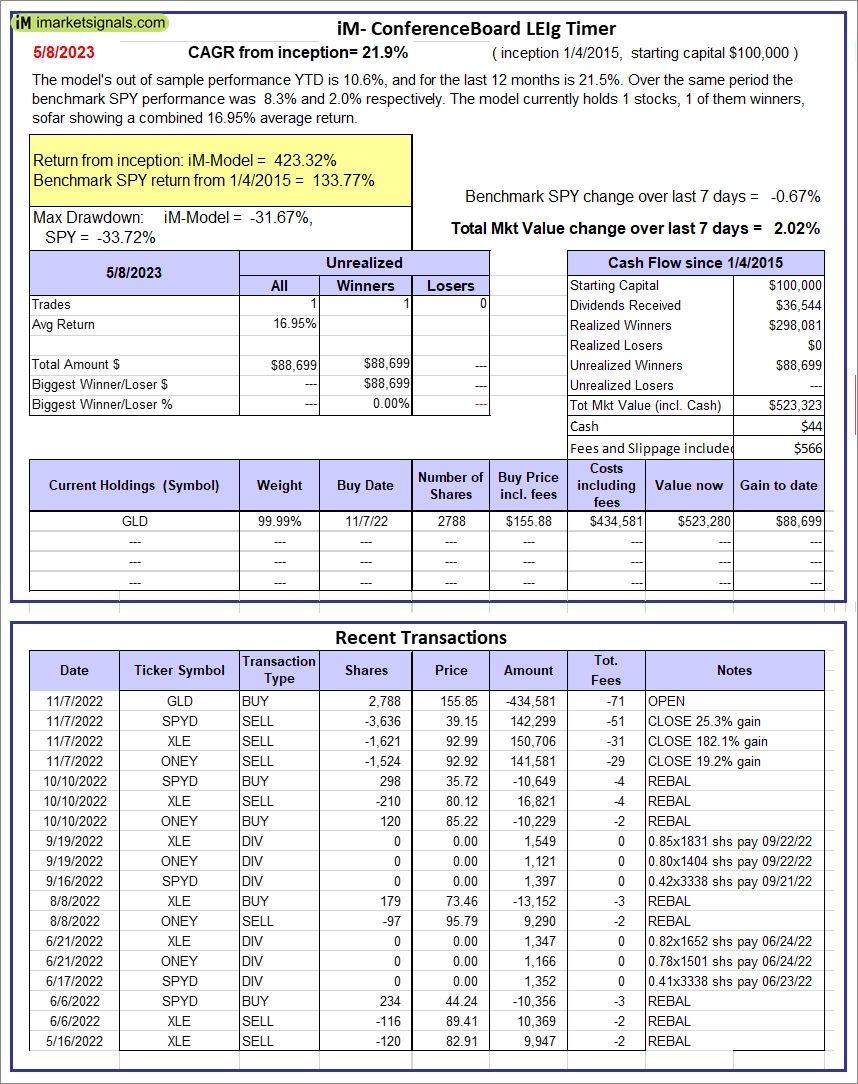 |
iM-Conference Board LEIg Timer: The model’s performance YTD is 14.3%, and for the last 12 months is 7.3%. Over the same period the benchmark SPY performance was 20.1% and 9.4% respectively. Over the previous week the market value of the iM-Conference Board LEIg Timer gained 2.02% at a time when SPY gained -0.67%. A starting capital of $100,000 at inception on 4/5/2017 would have grown to $523,323 which includes $44 cash and excludes $566 spent on fees and slippage. |
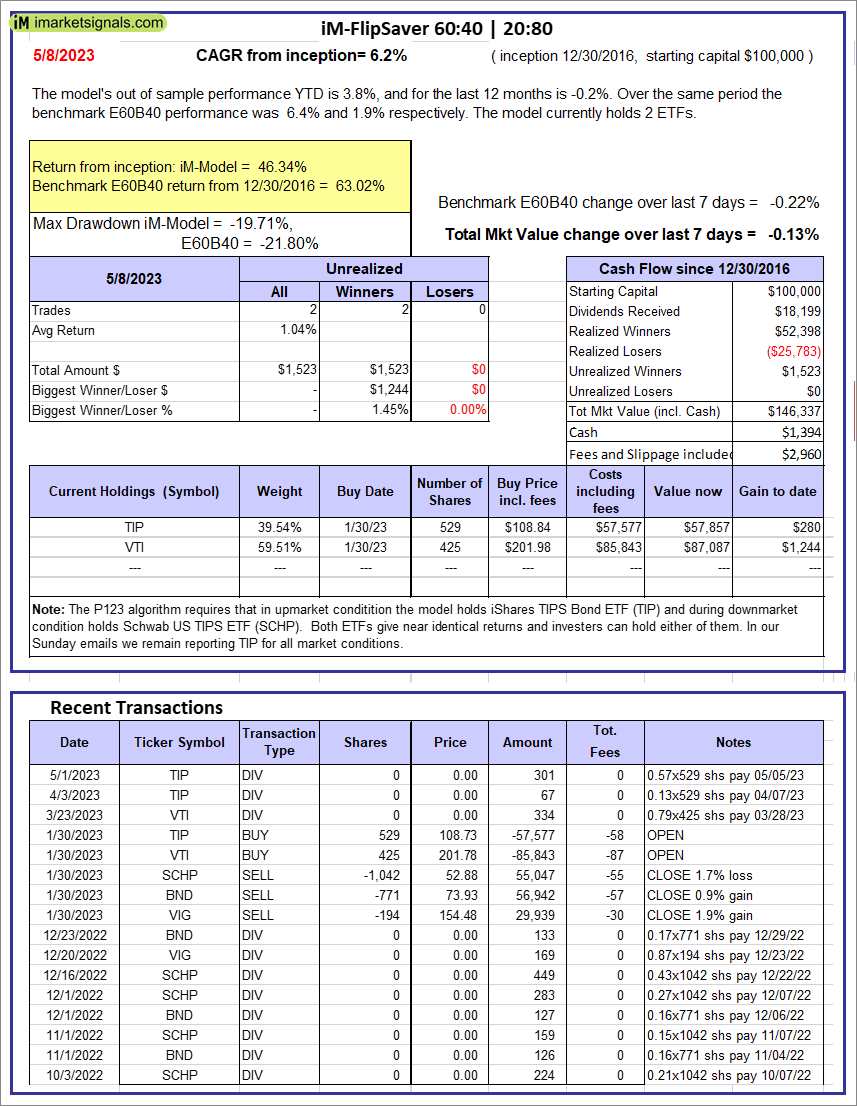 |
iM-FlipSaver 60:40 | 20:80 – 2017: The model’s out of sample performance YTD is 3.8%, and for the last 12 months is -0.2%. Over the same period the benchmark E60B40 performance was 6.4% and 1.9% respectively. Over the previous week the market value of iM-FlipSaver 80:20 | 20:80 gained -0.13% at a time when SPY gained -0.22%. A starting capital of $100,000 at inception on 7/16/2015 would have grown to $146,337 which includes $1,394 cash and excludes $2,960 spent on fees and slippage. |
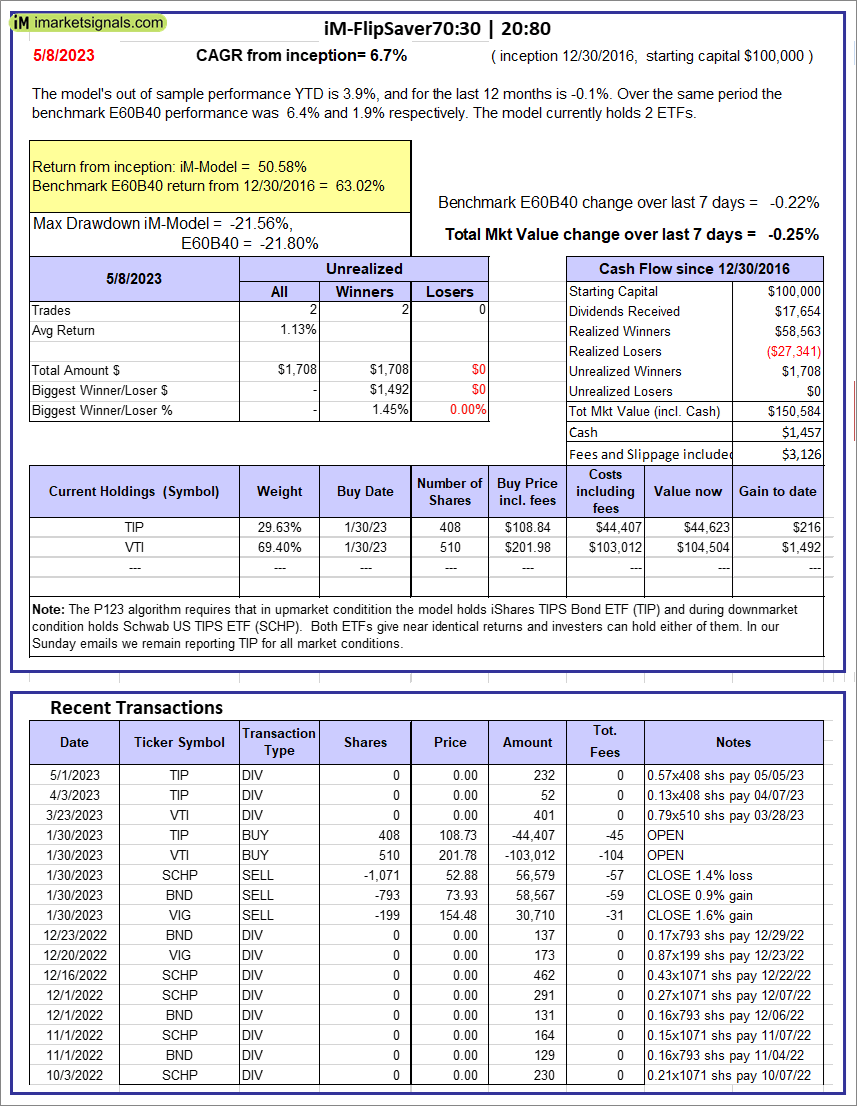 |
iM-FlipSaver 70:30 | 20:80 – 2017: The model’s out of sample performance YTD is 3.9%, and for the last 12 months is -0.1%. Over the same period the benchmark E60B40 performance was 6.4% and 1.9% respectively. Over the previous week the market value of iM-FlipSaver 70:30 | 20:80 gained -0.25% at a time when SPY gained -0.22%. A starting capital of $100,000 at inception on 7/15/2015 would have grown to $150,584 which includes $1,457 cash and excludes $3,126 spent on fees and slippage. |
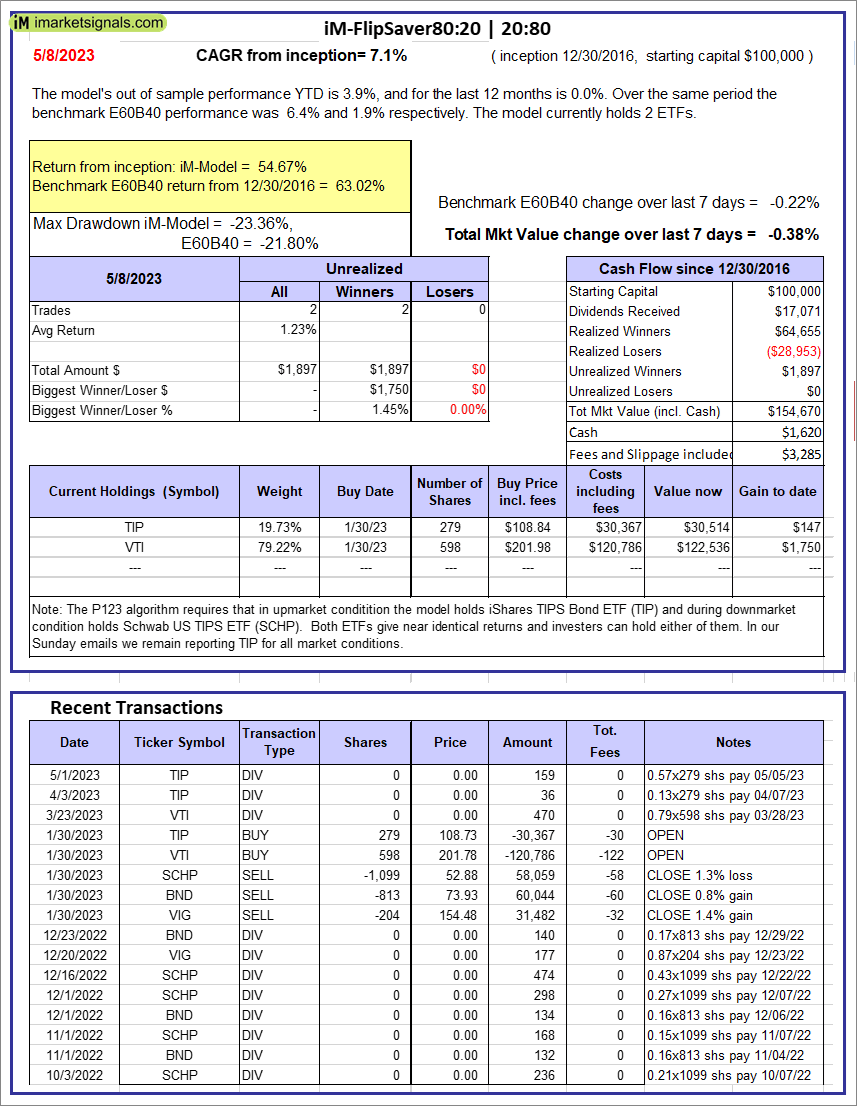 |
iM-FlipSaver 80:20 | 20:80 – 2017: The model’s out of sample performance YTD is 3.9%, and for the last 12 months is 0.0%. Over the same period the benchmark E60B40 performance was 6.4% and 1.9% respectively. Over the previous week the market value of iM-FlipSaver 80:20 | 20:80 gained -0.38% at a time when SPY gained -0.22%. A starting capital of $100,000 at inception on 1/2/2017 would have grown to $154,670 which includes $1,620 cash and excludes $3,285 spent on fees and slippage. |
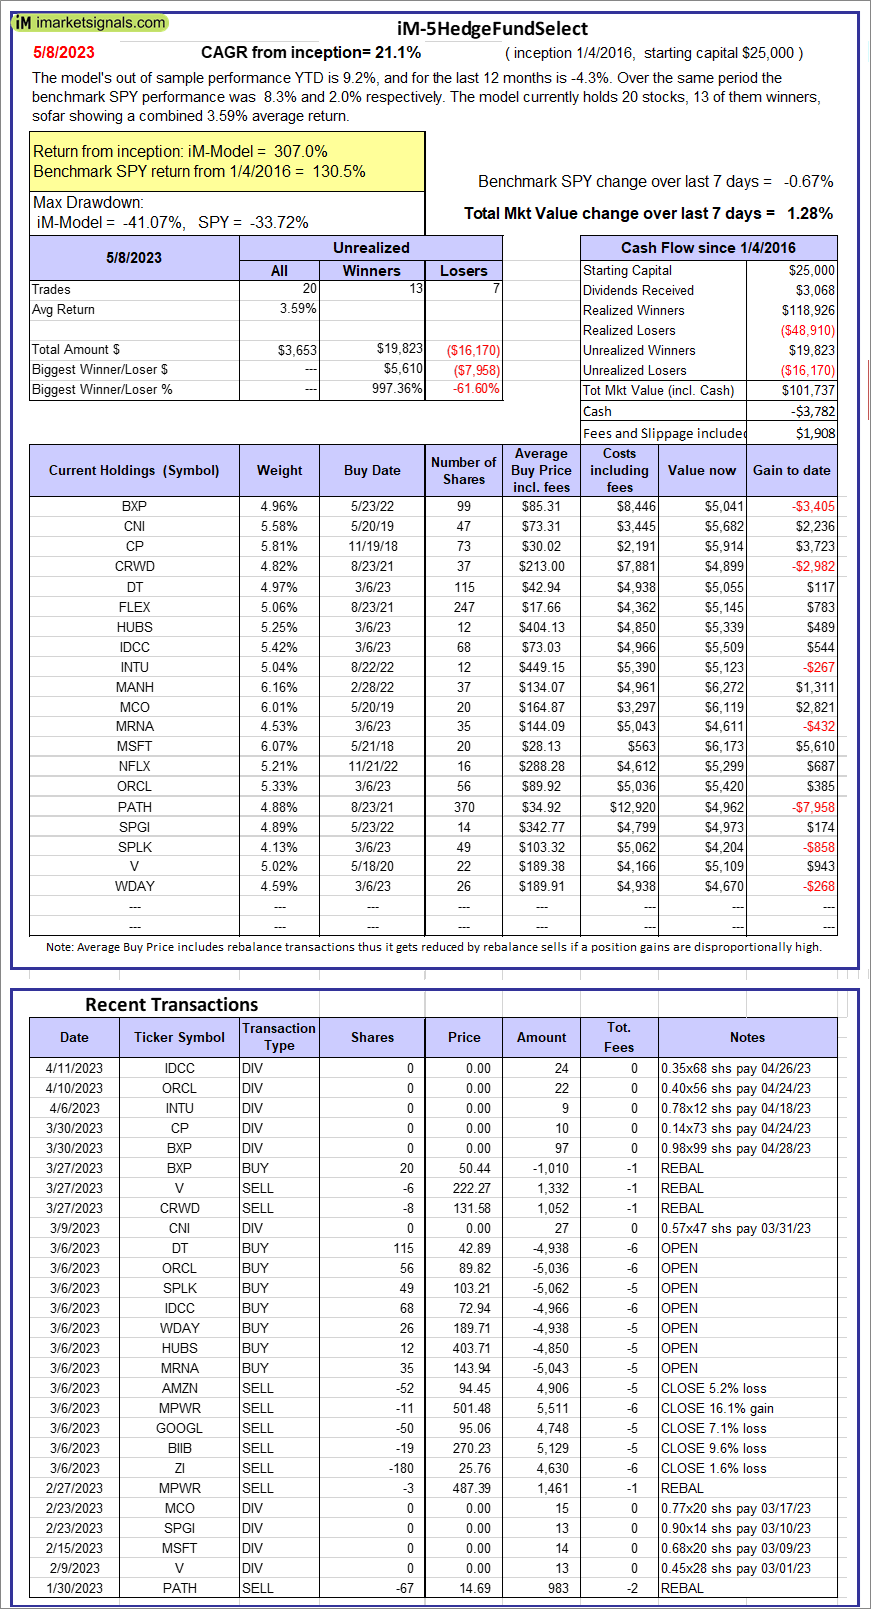 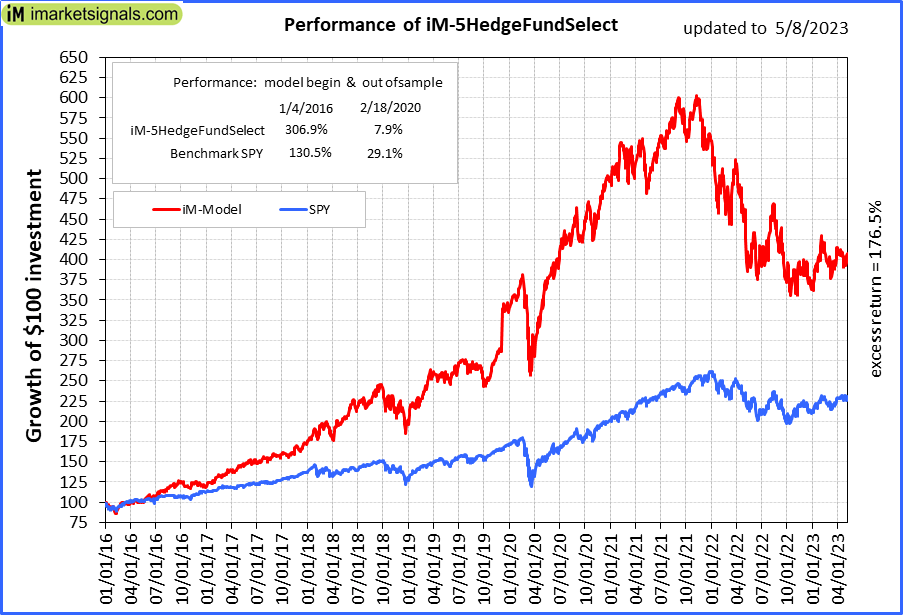 |
iM-5HedgeFundSelect: Since inception, on 1/5/2016, the model gained 306.95% while the benchmark SPY gained 130.50% over the same period. Over the previous week the market value of iM-5HedgeFundSelect gained 1.28% at a time when SPY gained -0.67%. A starting capital of $25,000 at inception on 1/5/2016 would have grown to $101,737 which includes -$3,782 cash and excludes $1,908 spent on fees and slippage. |
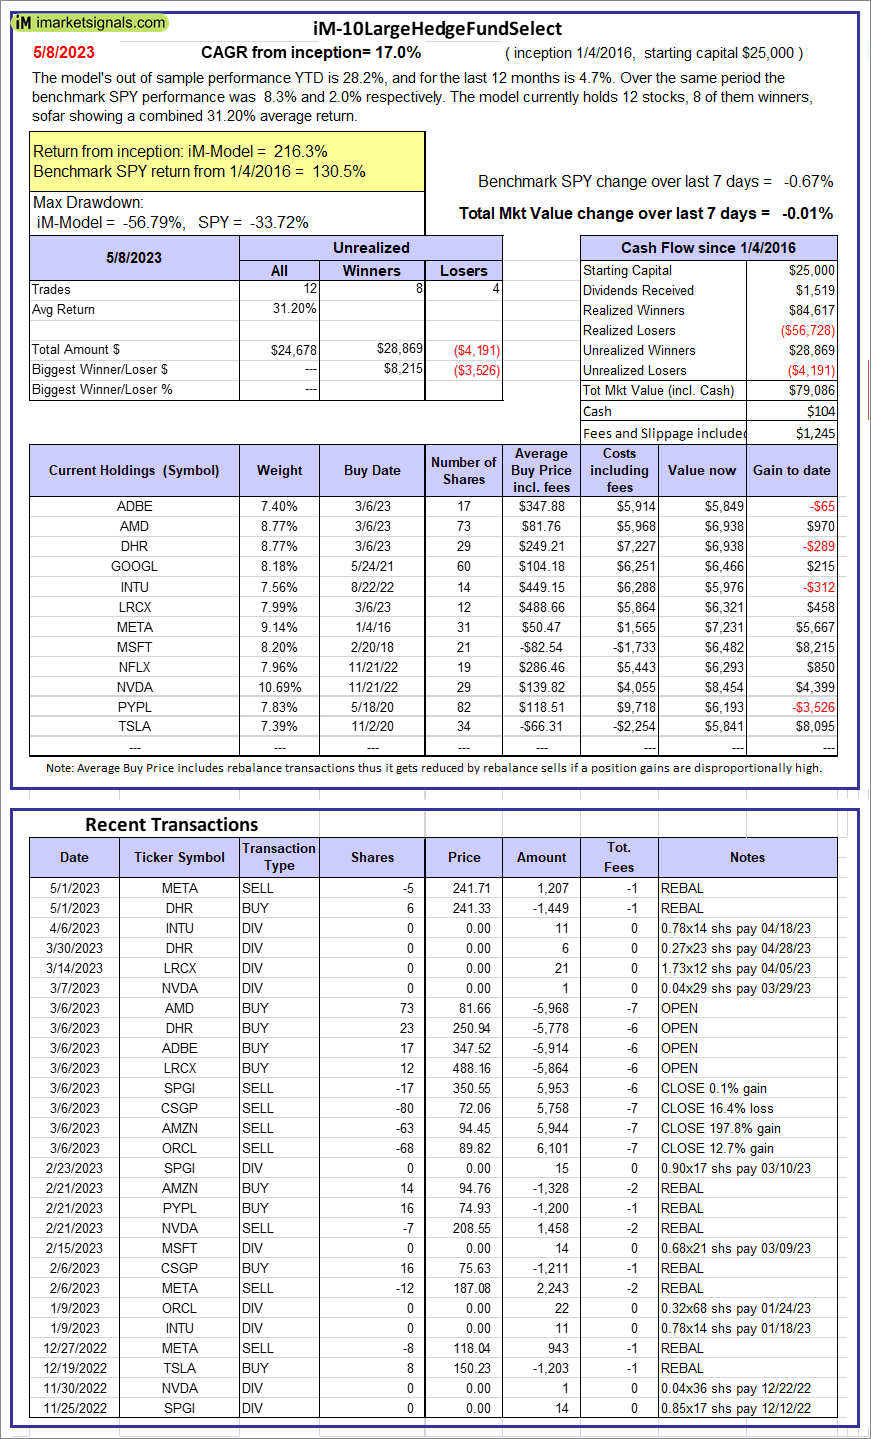 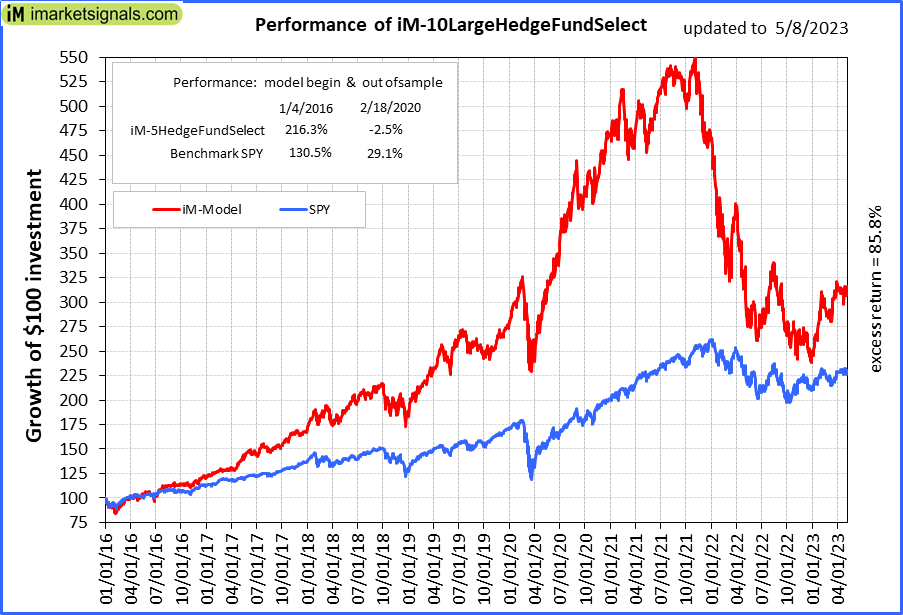 |
iM-10LargeHedgeFundSelect: Since inception, on 1/5/2016, the model gained 216.34% while the benchmark SPY gained 130.50% over the same period. Over the previous week the market value of iM-10LargeHedgeFundSelect gained -0.01% at a time when SPY gained -0.67%. A starting capital of $25,000 at inception on 1/5/2016 would have grown to $79,086 which includes $104 cash and excludes $1,245 spent on fees and slippage. |
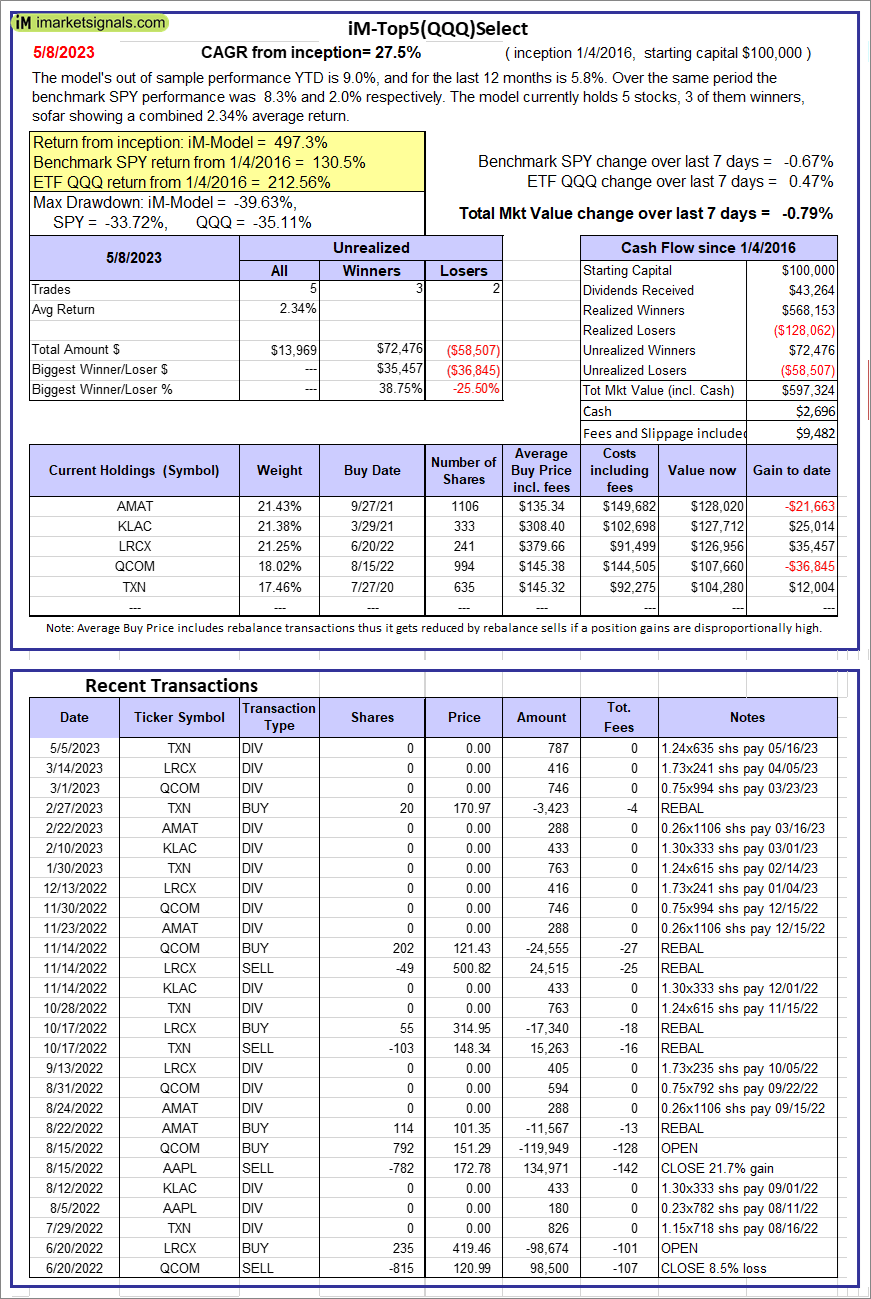 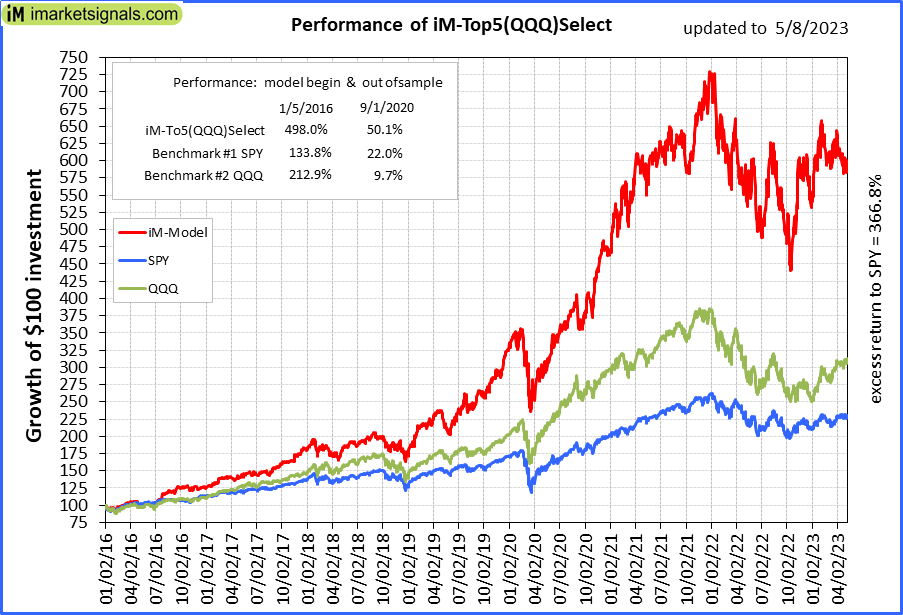 |
iM-Top5(QQQ)Select: Since inception, on 1/5/2016, the model gained 497.32% while the benchmark SPY gained 130.50% over the same period. Over the previous week the market value of iM-Top5(QQQ)Select gained -0.79% at a time when SPY gained -0.67%. A starting capital of $100,000 at inception on 1/5/2016 would have grown to $597,324 which includes $2,696 cash and excludes $9,482 spent on fees and slippage. |
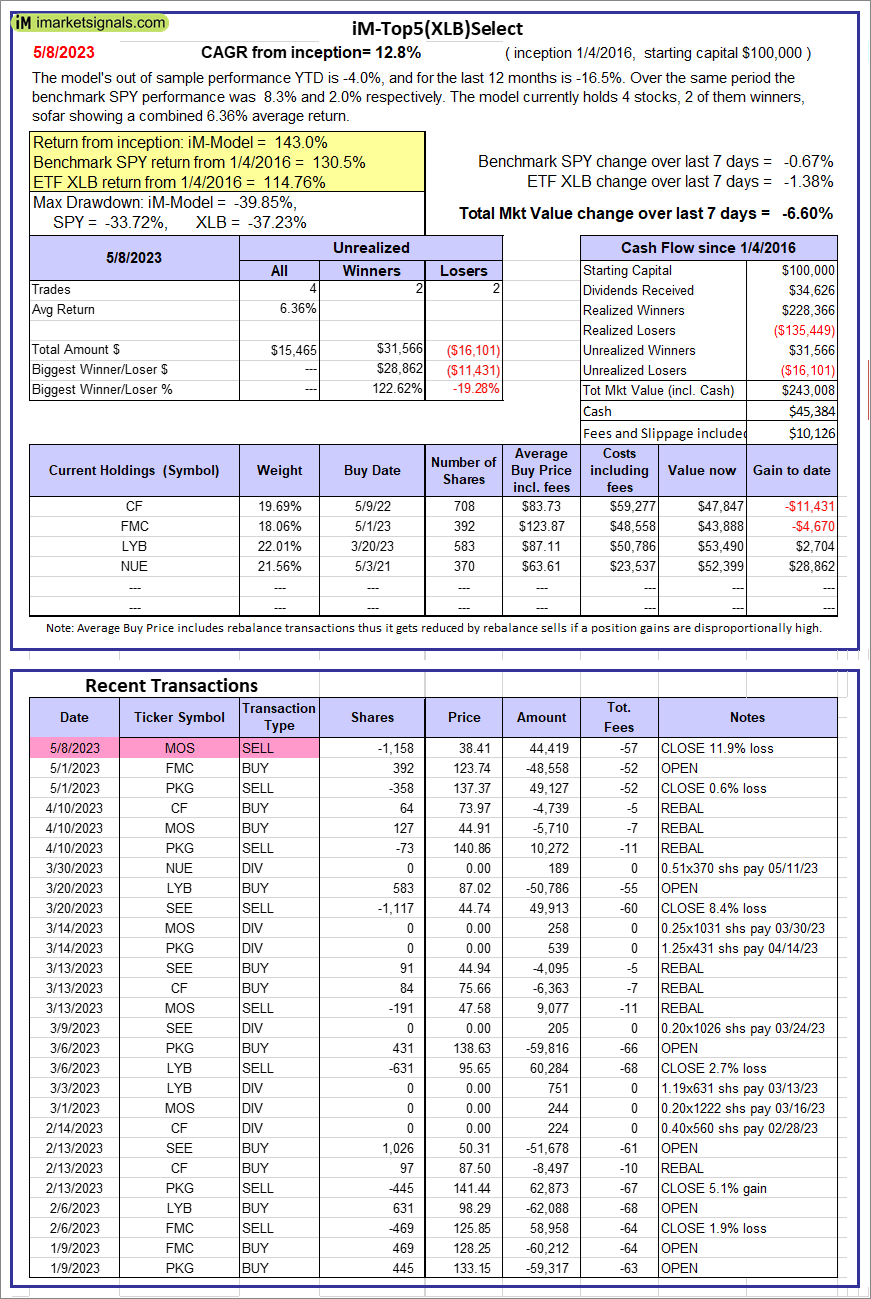 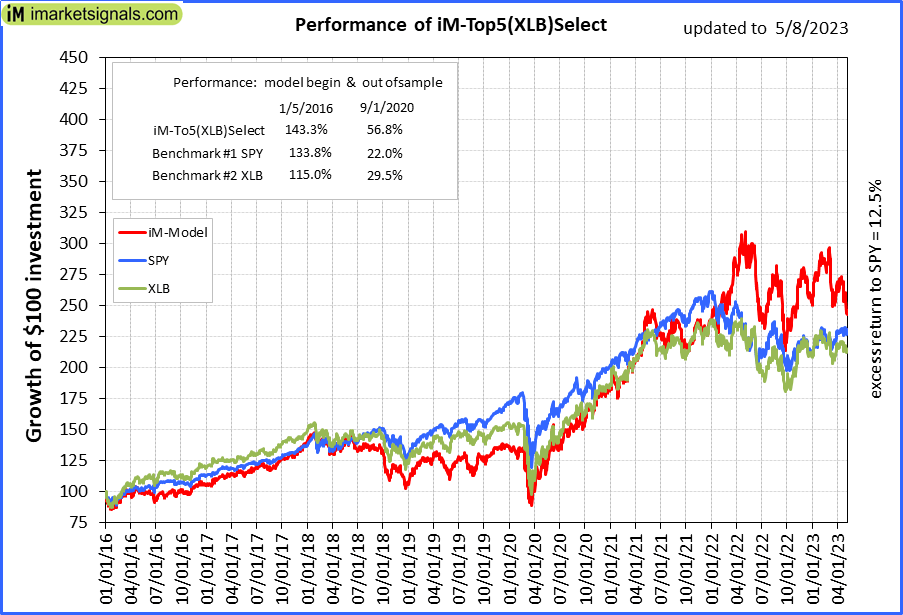 |
iM-Top5(XLB)Select: Since inception, on 1/5/2016, the model gained 143.01% while the benchmark SPY gained 130.50% over the same period. Over the previous week the market value of iM-Top5(XLB)Select gained -6.60% at a time when SPY gained -0.67%. A starting capital of $100,000 at inception on 1/5/2016 would have grown to $243,008 which includes $45,384 cash and excludes $10,126 spent on fees and slippage. |
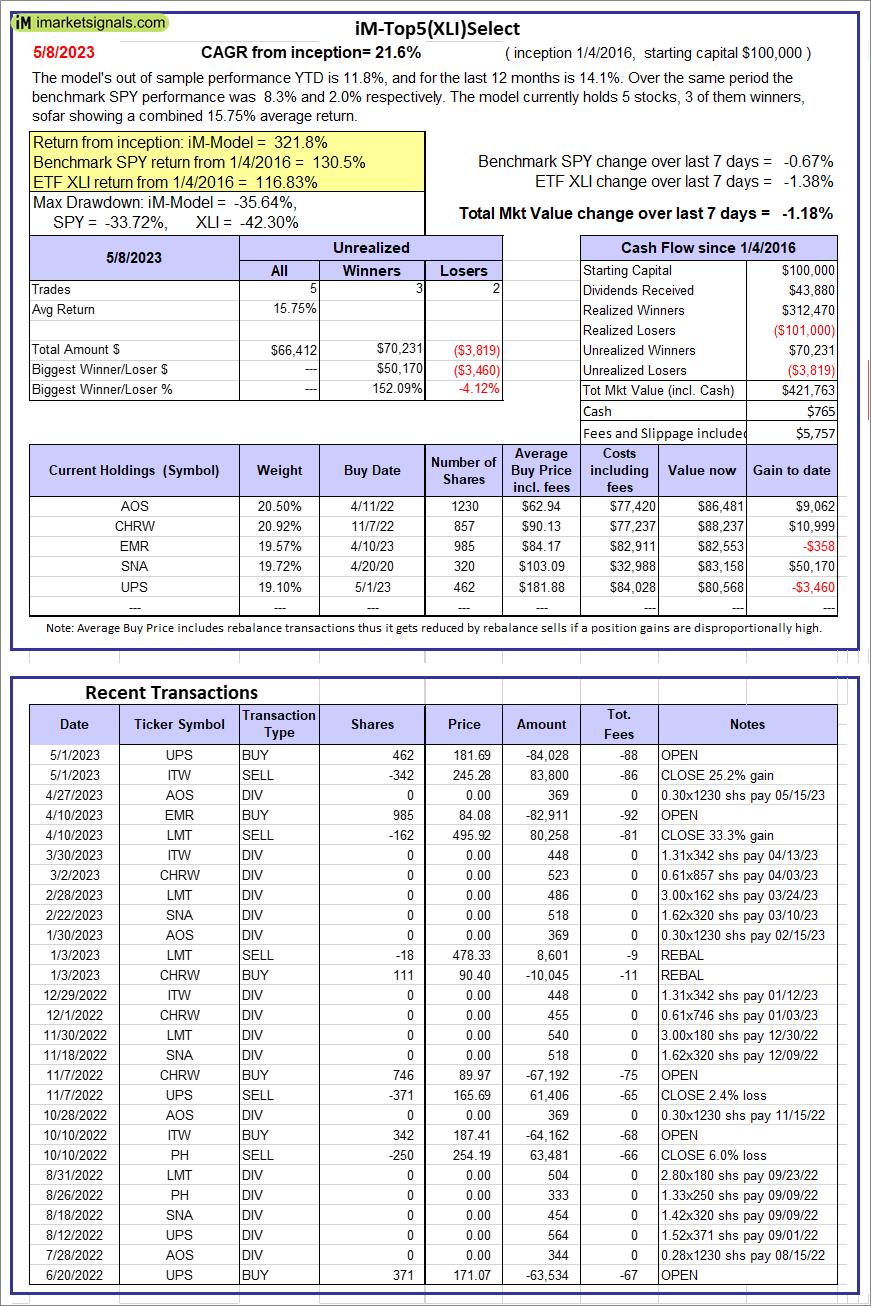 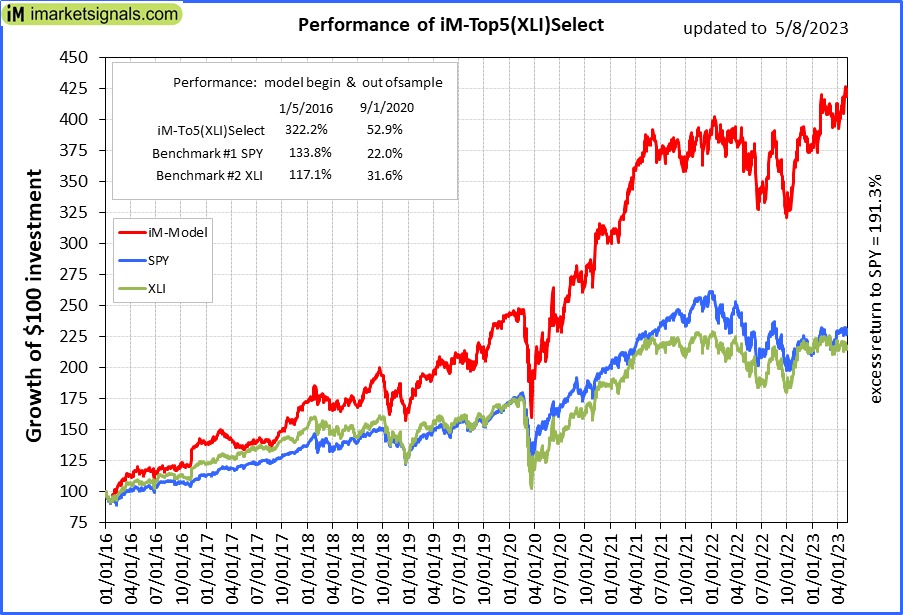 |
iM-Top5(XLI)Select: Since inception, on 1/5/2016, the model gained 321.76% while the benchmark SPY gained 130.50% over the same period. Over the previous week the market value of iM-Top5(XLI)Select gained -1.18% at a time when SPY gained -0.67%. A starting capital of $100,000 at inception on 1/5/2016 would have grown to $421,763 which includes $765 cash and excludes $5,757 spent on fees and slippage. |
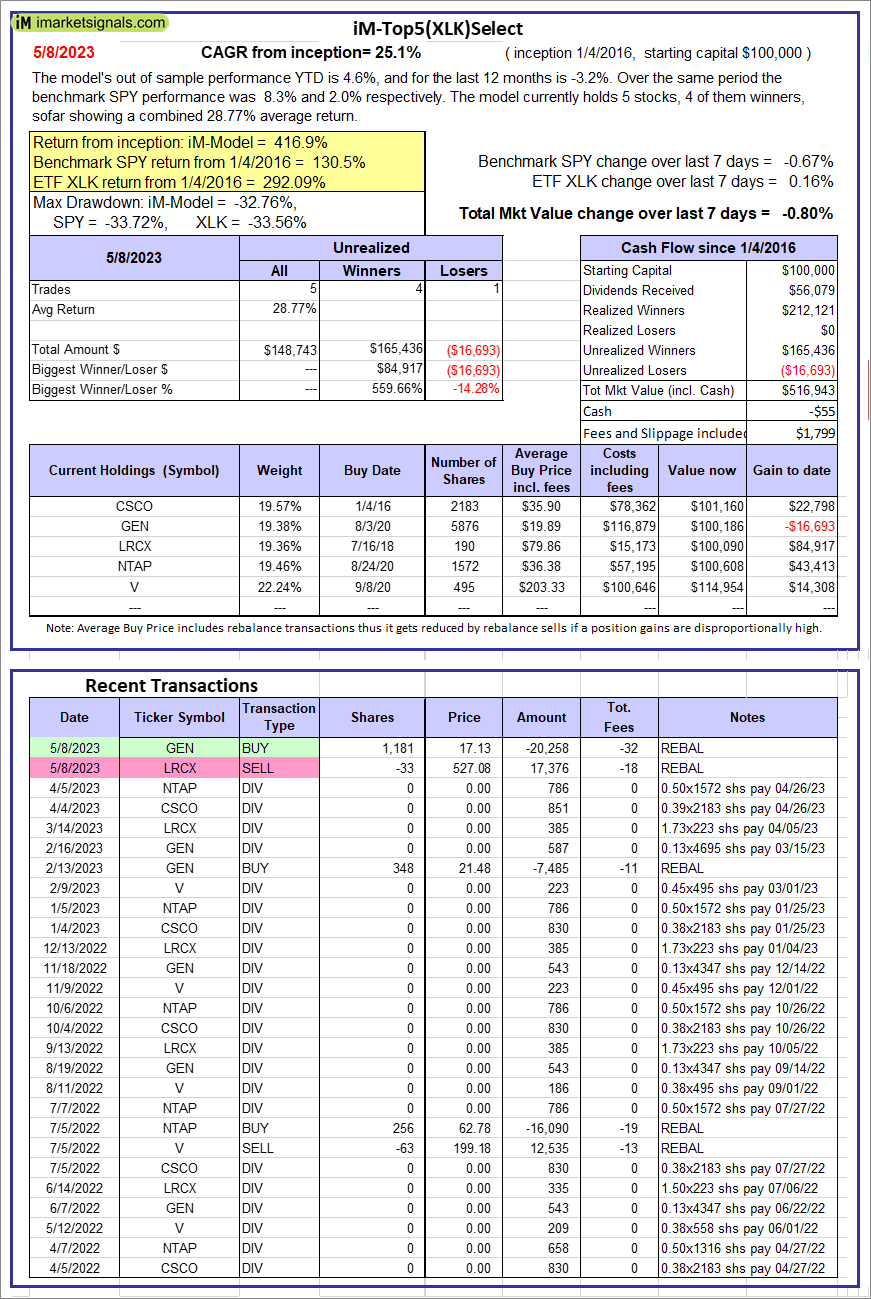 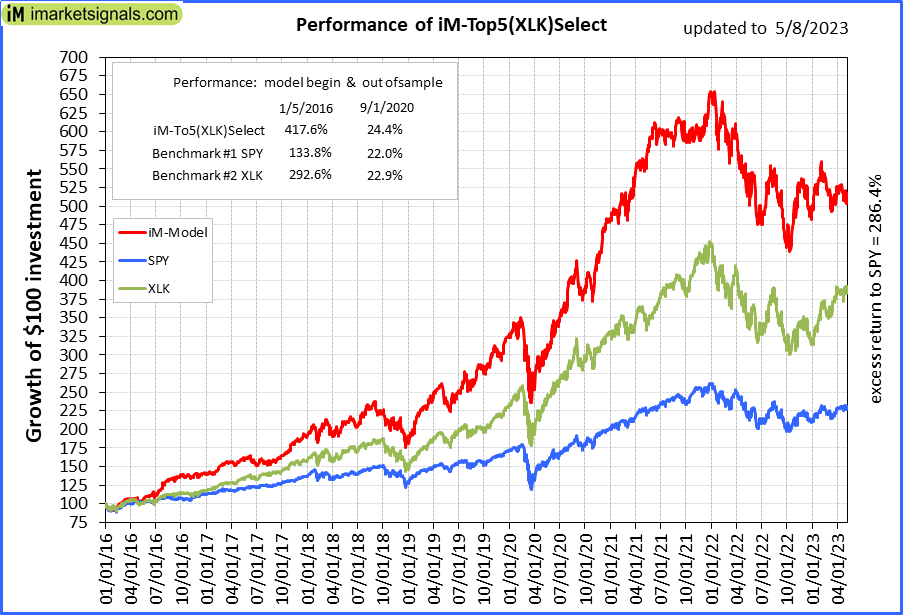 |
iM-Top5(XLK)Select: Since inception, on 1/5/2016, the model gained 416.94% while the benchmark SPY gained 130.50% over the same period. Over the previous week the market value of iM-Top5(XLK)Select gained -0.80% at a time when SPY gained -0.67%. A starting capital of $100,000 at inception on 1/5/2016 would have grown to $516,943 which includes -$55 cash and excludes $1,799 spent on fees and slippage. |
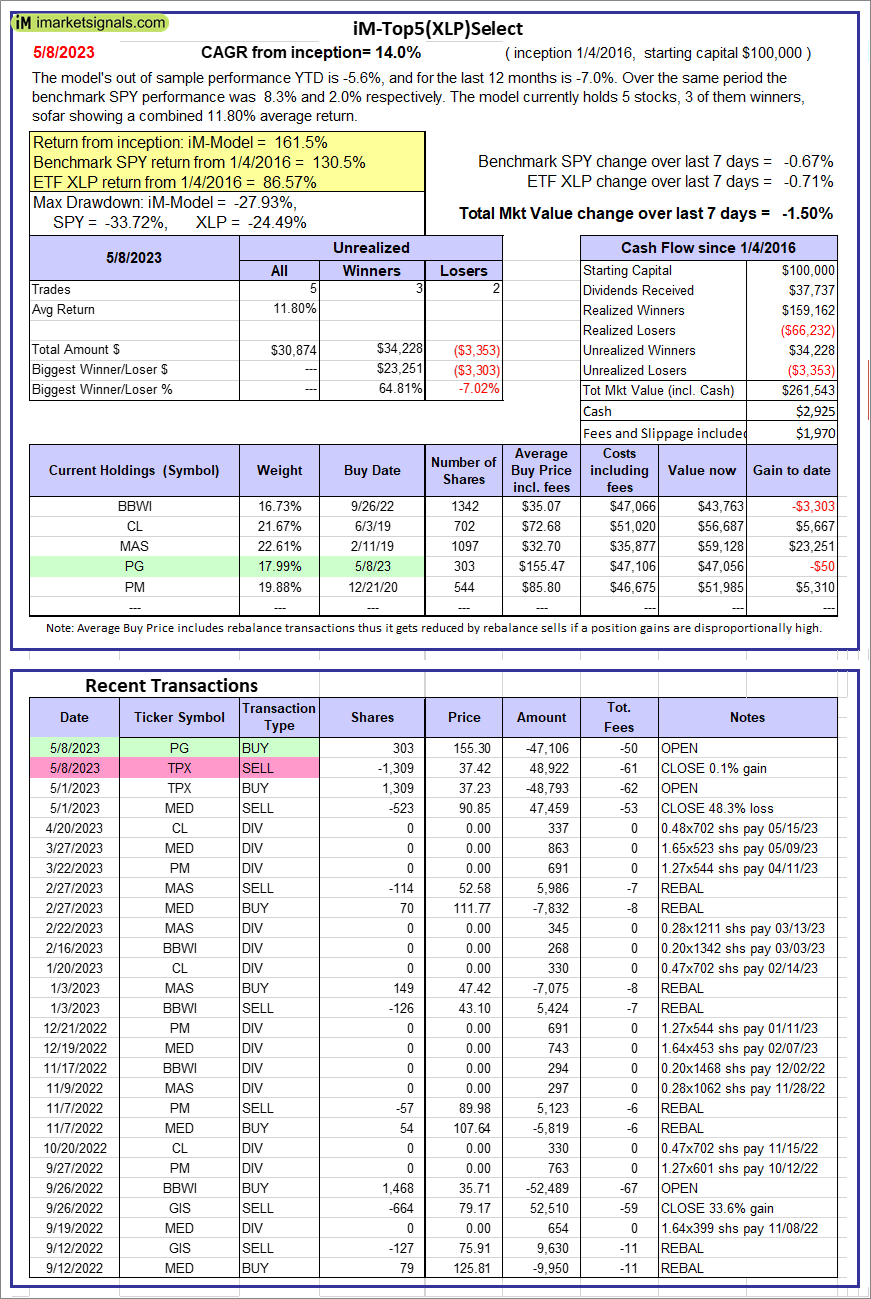 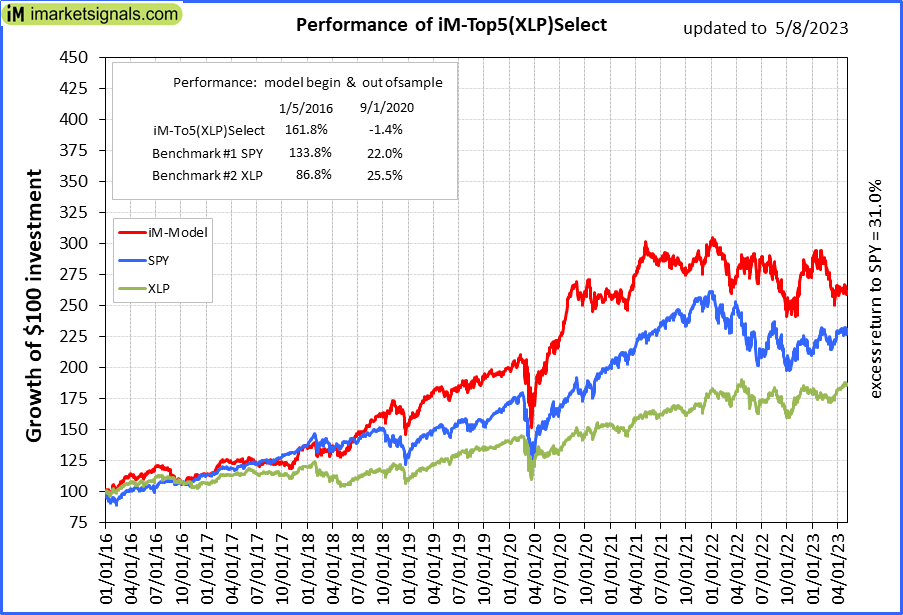 |
iM-Top5(XLP)Select: Since inception, on 1/5/2016, the model gained 161.54% while the benchmark SPY gained 130.50% over the same period. Over the previous week the market value of iM-Top5(XLP)Select gained -1.50% at a time when SPY gained -0.67%. A starting capital of $100,000 at inception on 1/5/2016 would have grown to $261,543 which includes $2,925 cash and excludes $1,970 spent on fees and slippage. |
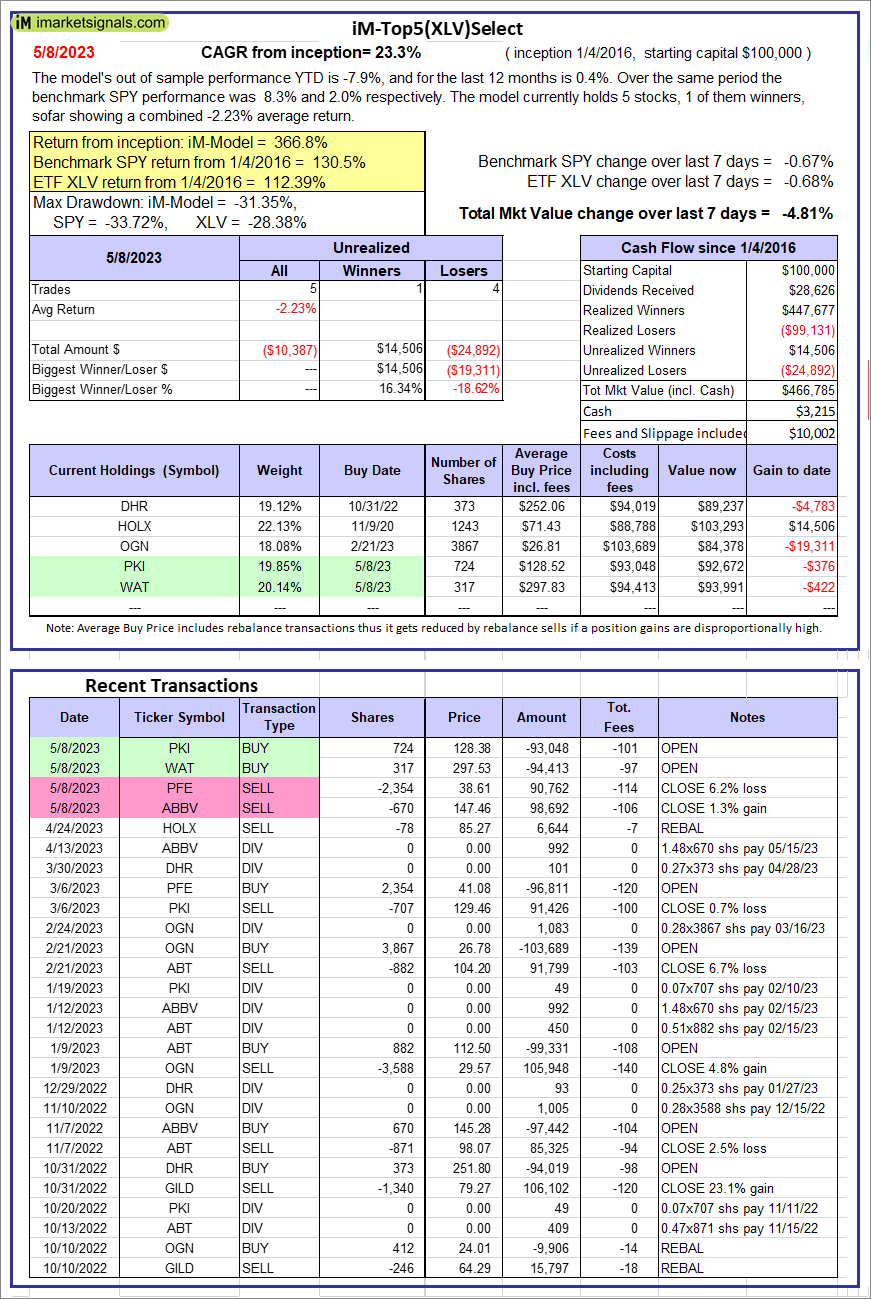 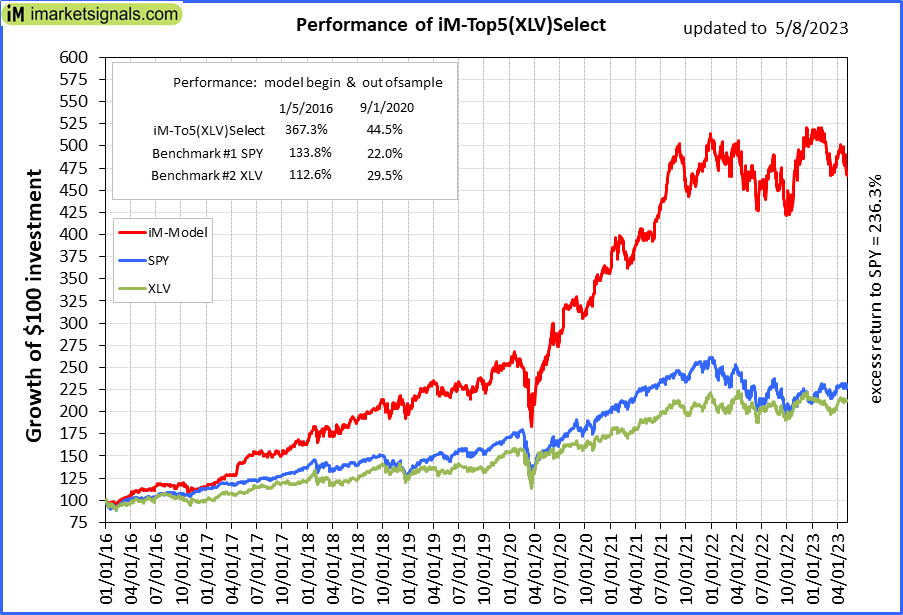 |
iM-Top5(XLV)Select: Since inception, on 1/5/2016, the model gained 366.79% while the benchmark SPY gained 130.50% over the same period. Over the previous week the market value of iM-Top5(XLV)Select gained -4.81% at a time when SPY gained -0.67%. A starting capital of $100,000 at inception on 1/5/2016 would have grown to $466,785 which includes $3,215 cash and excludes $10,002 spent on fees and slippage. |
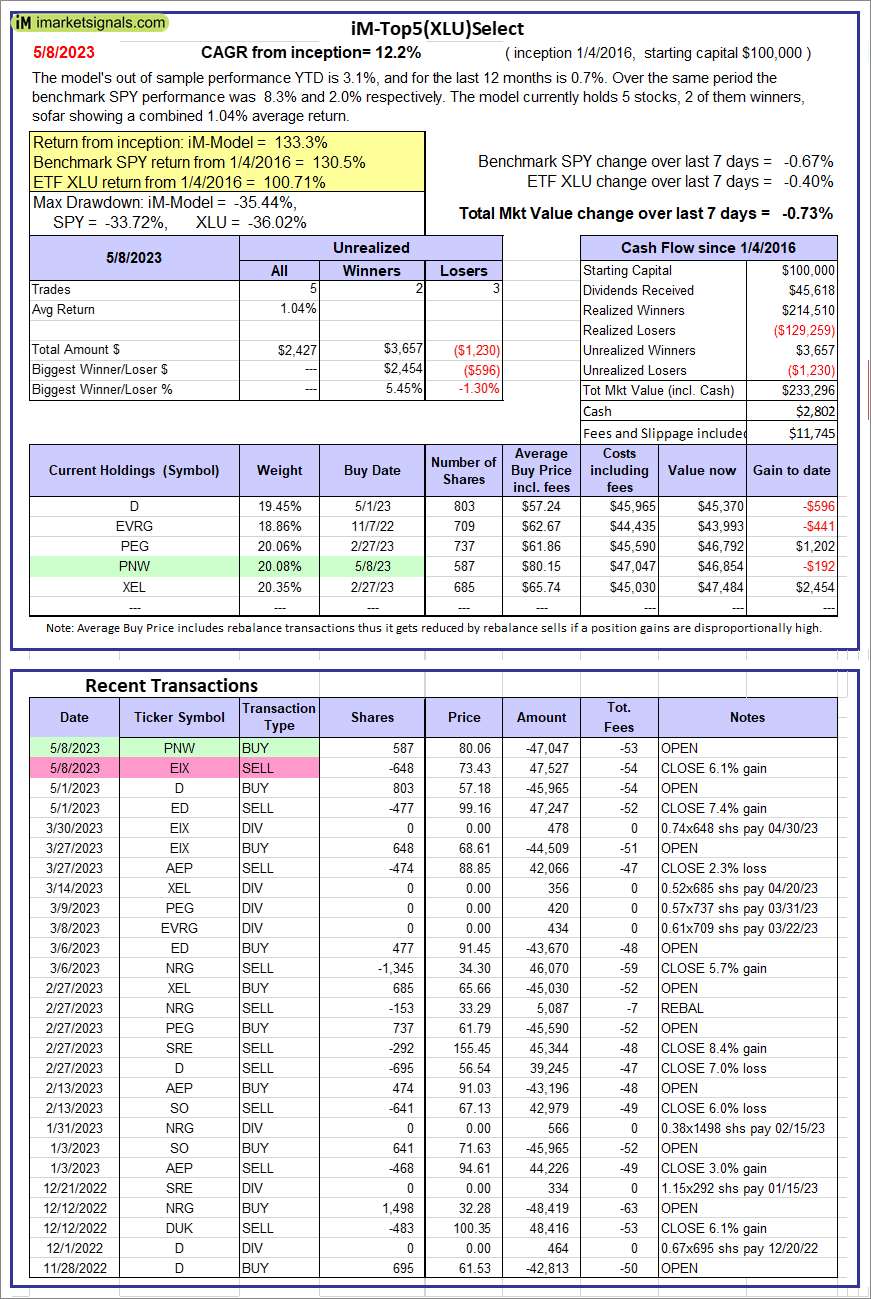 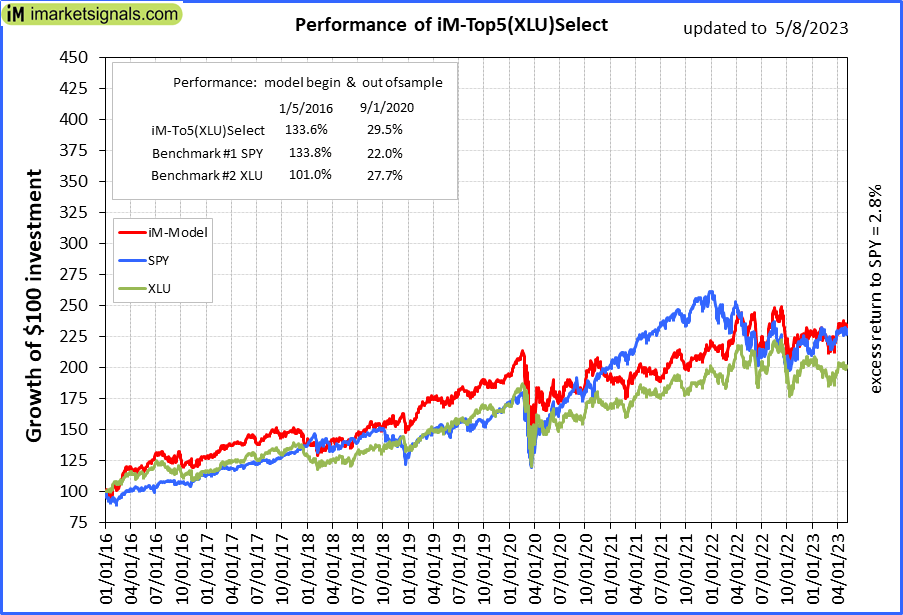 |
iM-Top5(XLU)Select: Since inception, on 1/5/2016, the model gained 133.30% while the benchmark SPY gained 130.50% over the same period. Over the previous week the market value of iM-Top5(XLU)Select gained -0.73% at a time when SPY gained -0.67%. A starting capital of $100,000 at inception on 1/5/2016 would have grown to $233,296 which includes $2,802 cash and excludes $11,745 spent on fees and slippage. |
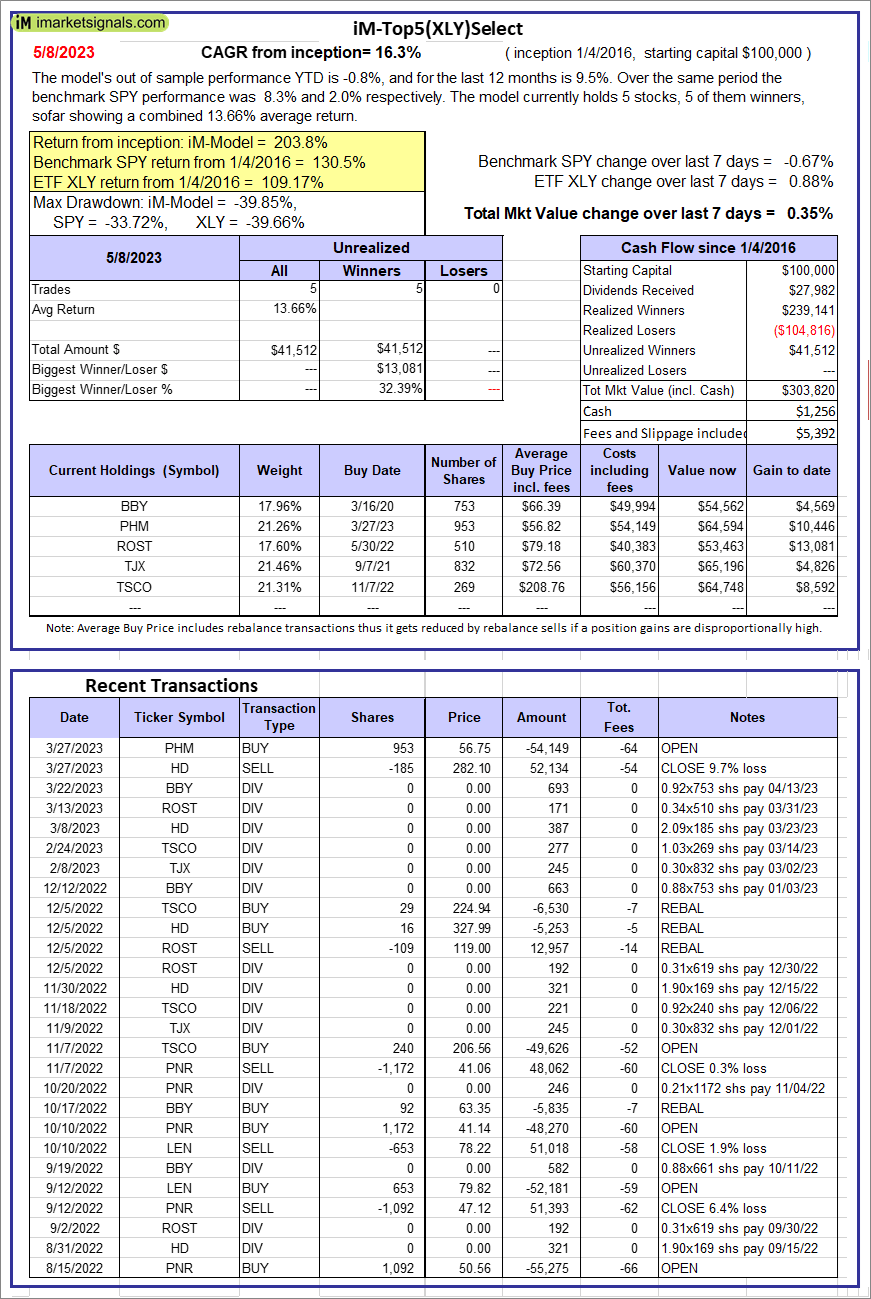 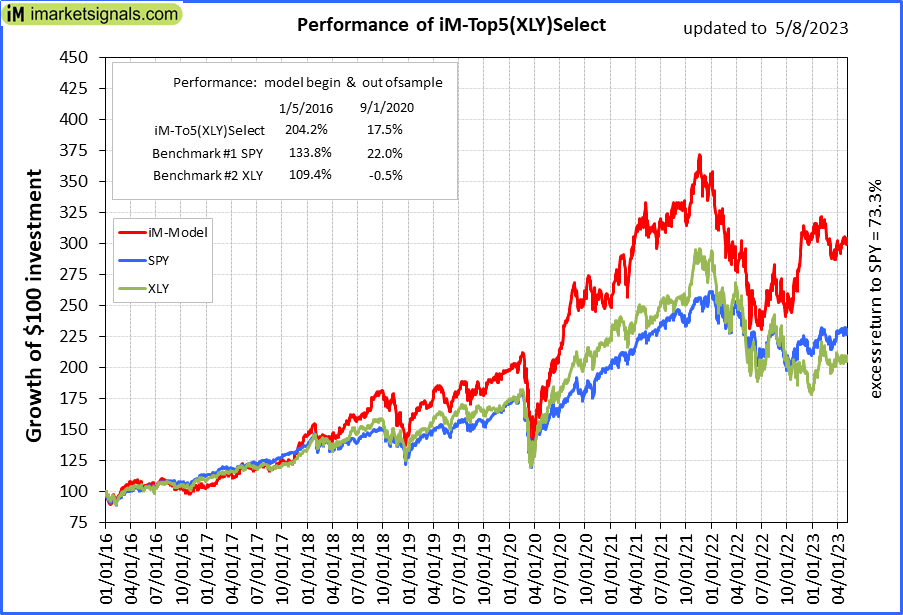 |
iM-Top5(XLY)Select: Since inception, on 1/5/2016, the model gained 203.82% while the benchmark SPY gained 130.50% over the same period. Over the previous week the market value of iM-Top5(XLY)Select gained 0.35% at a time when SPY gained -0.67%. A starting capital of $100,000 at inception on 1/5/2016 would have grown to $303,820 which includes $1,256 cash and excludes $5,392 spent on fees and slippage. |
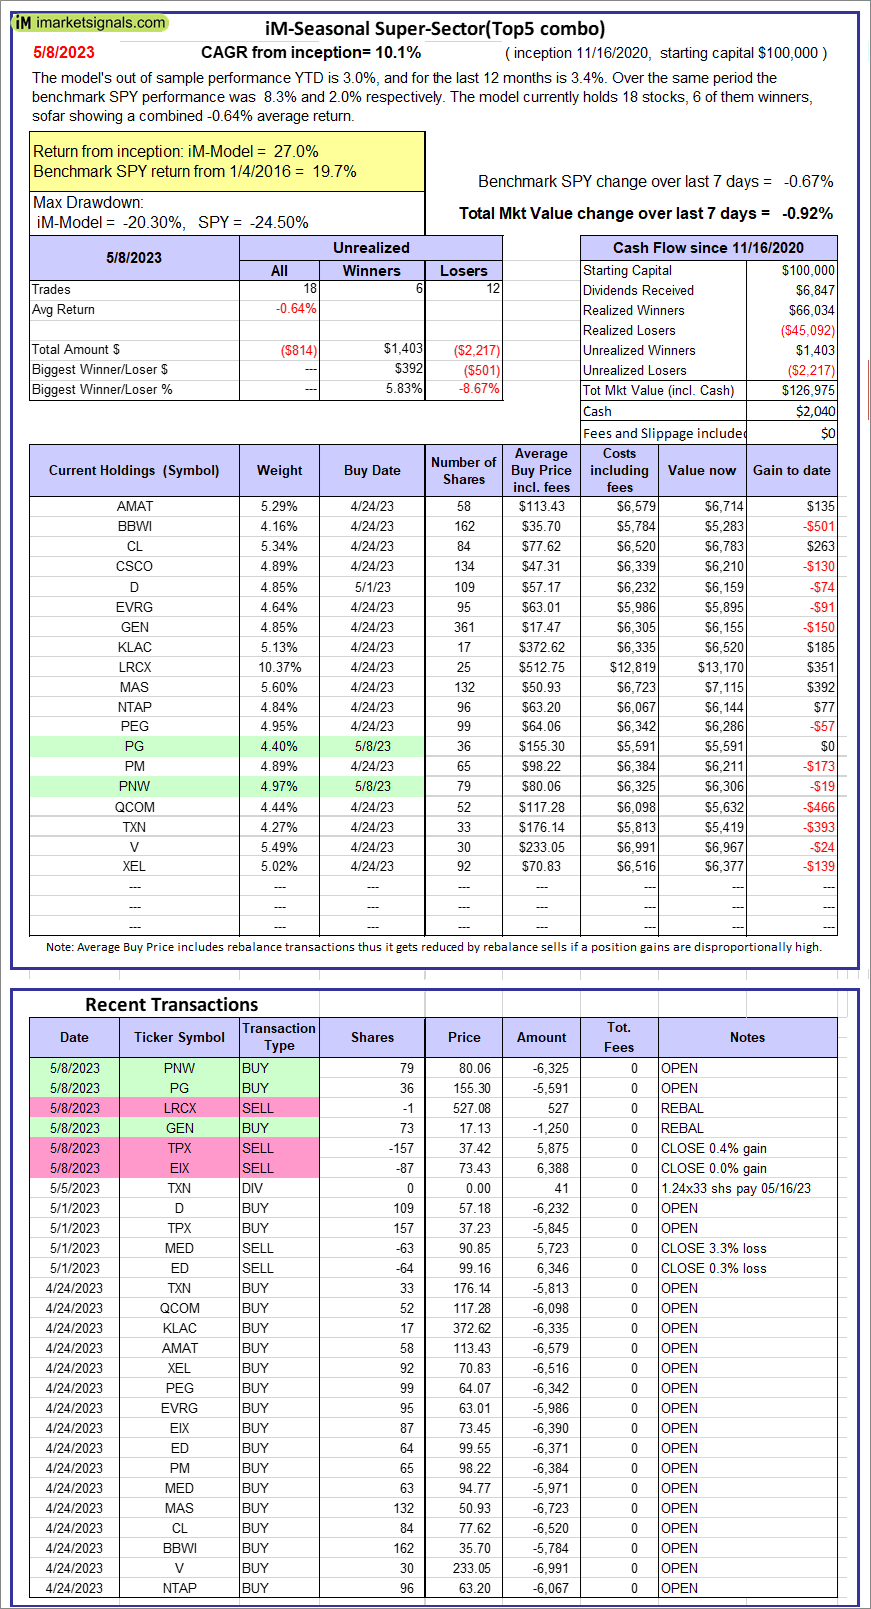 |
iM-Seasonal Super-Sectors (Top5 combo) : Since inception, on 11/17/2020, the model gained 26.98% while the benchmark SPY gained 19.65% over the same period. Over the previous week the market value of iM-Seasonal Super-Sectors (Top5 combo) gained -0.92% at a time when SPY gained -0.67%. A starting capital of $100,000 at inception on 11/17/2020 would have grown to $126,975 which includes $2,040 cash and excludes $00 spent on fees and slippage. |
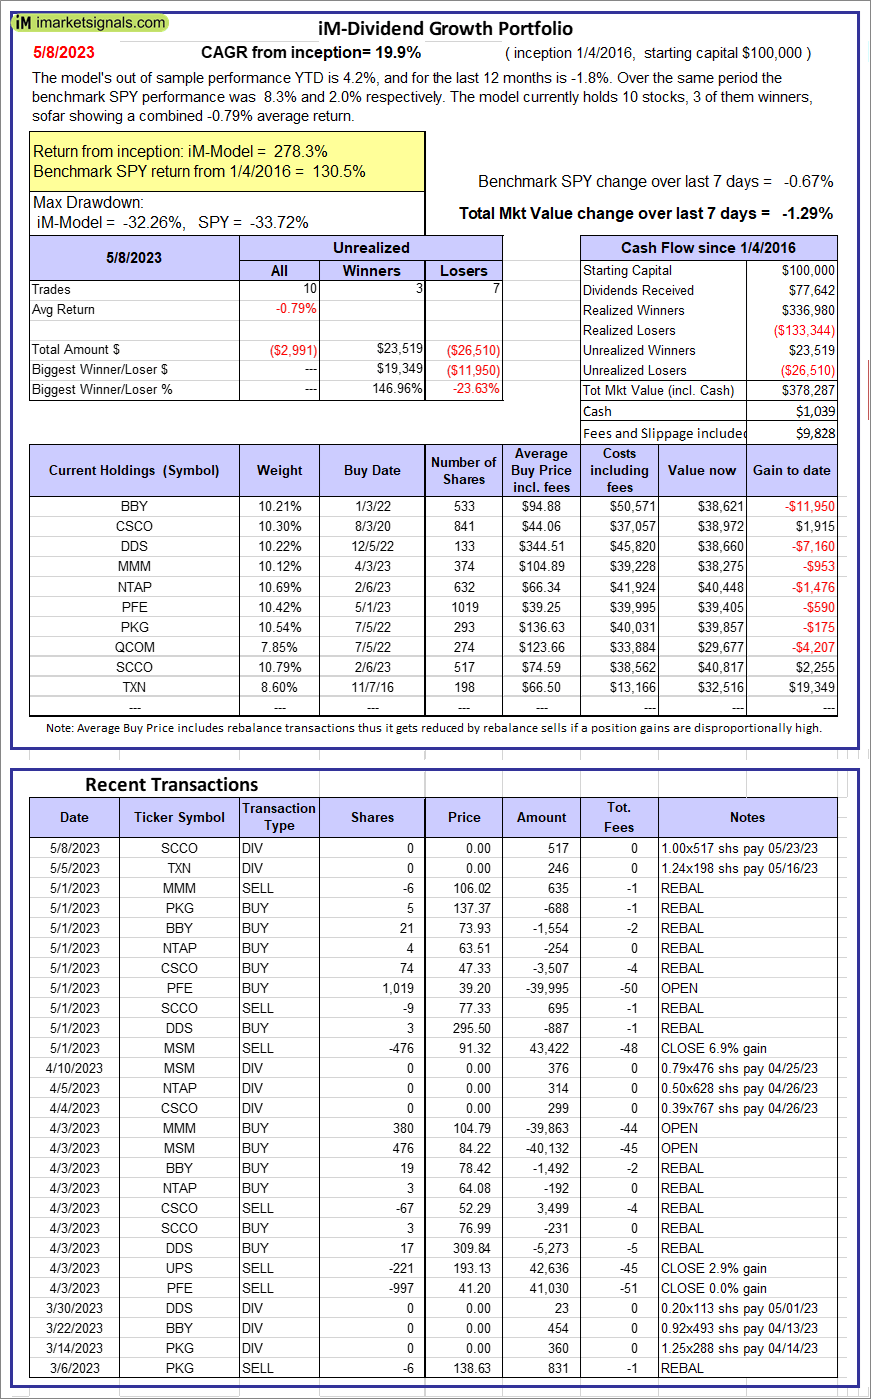 |
iM-Dividend Growth Portfolio: The model’s out of sample performance YTD is 4.2%, and for the last 12 months is -1.8%. Over the same period the benchmark SPY performance was 8.3% and 2.0% respectively. Over the previous week the market value of the iM-Dividend Growth Portfolio gained -1.29% at a time when SPY gained -0.67%. A starting capital of $100,000 at inception on 6/30/2016 would have grown to $378,287 which includes $1,039 cash and excludes $9,828 spent on fees and slippage. |
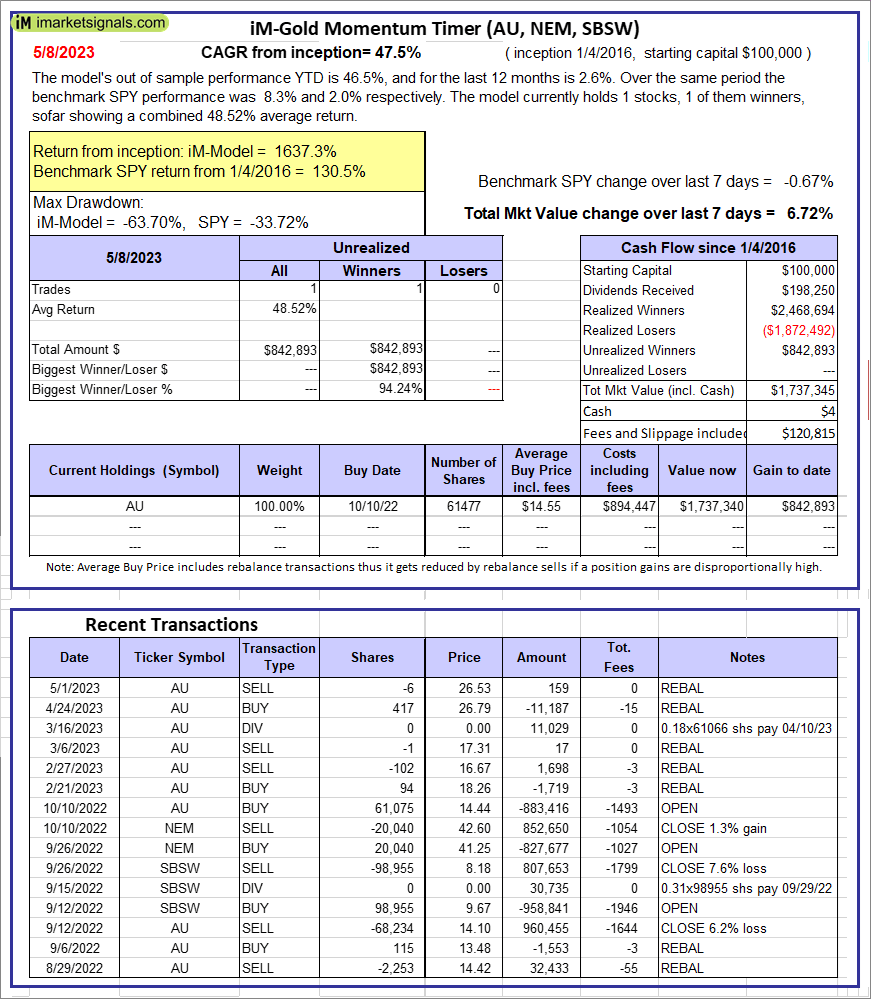 |
iM-Gold Momentum Timer (AU, NEM, SBSW): The model’s out of sample performance YTD is 46.5%, and for the last 12 months is 2.6%. Over the same period the benchmark SPY performance was 8.3% and 2.0% respectively. Over the previous week the market value of iM-Gold Momentum Timer (AU, NEM, SBSW) gained 6.72% at a time when SPY gained -0.67%. A starting capital of $100,000 at inception on 6/30/2016 would have grown to $04 which includes $120,815 cash and excludes Gain to date spent on fees and slippage. |
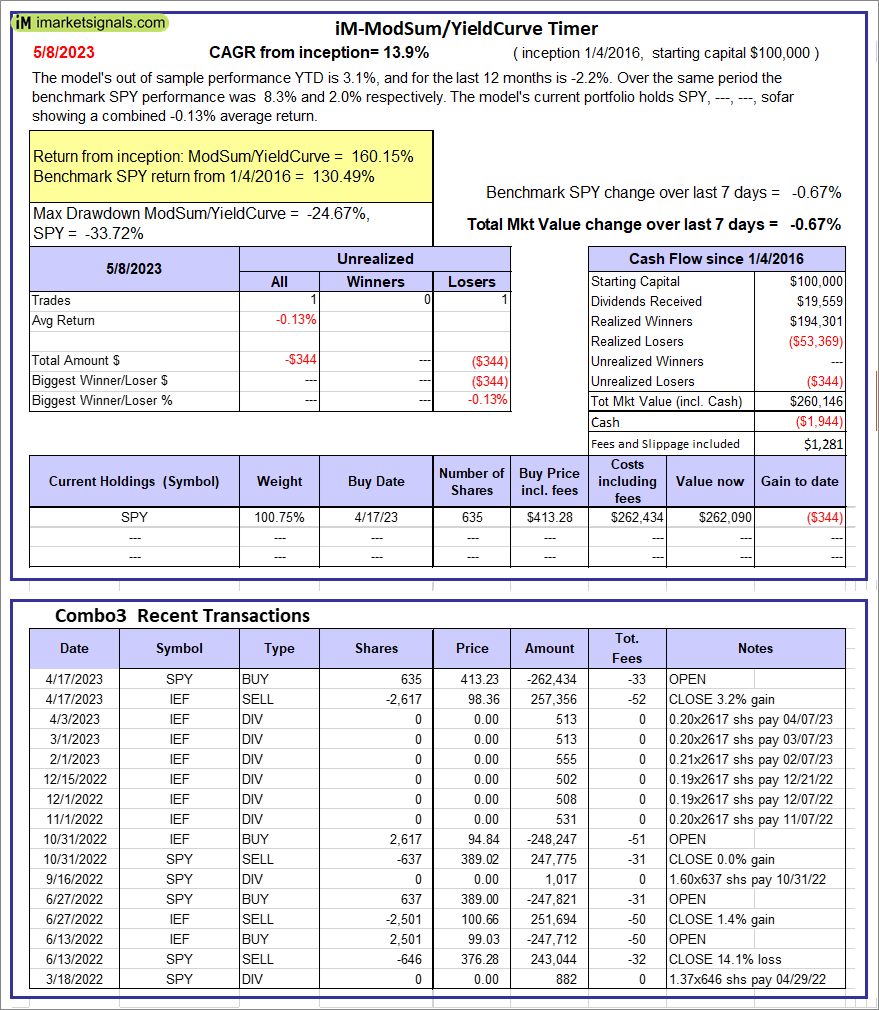 |
iM-ModSum/YieldCurve Timer: The model’s out of sample performance YTD is 3.1%, and for the last 12 months is -2.2%. Over the same period the benchmark SPY performance was 8.3% and 2.0% respectively. Over the previous week the market value of iM-PortSum/YieldCurve Timer gained -0.67% at a time when SPY gained -0.67%. A starting capital of $100,000 at inception on 1/1/2016 would have grown to $260,146 which includes -$1,944 cash and excludes $1,281 spent on fees and slippage. |
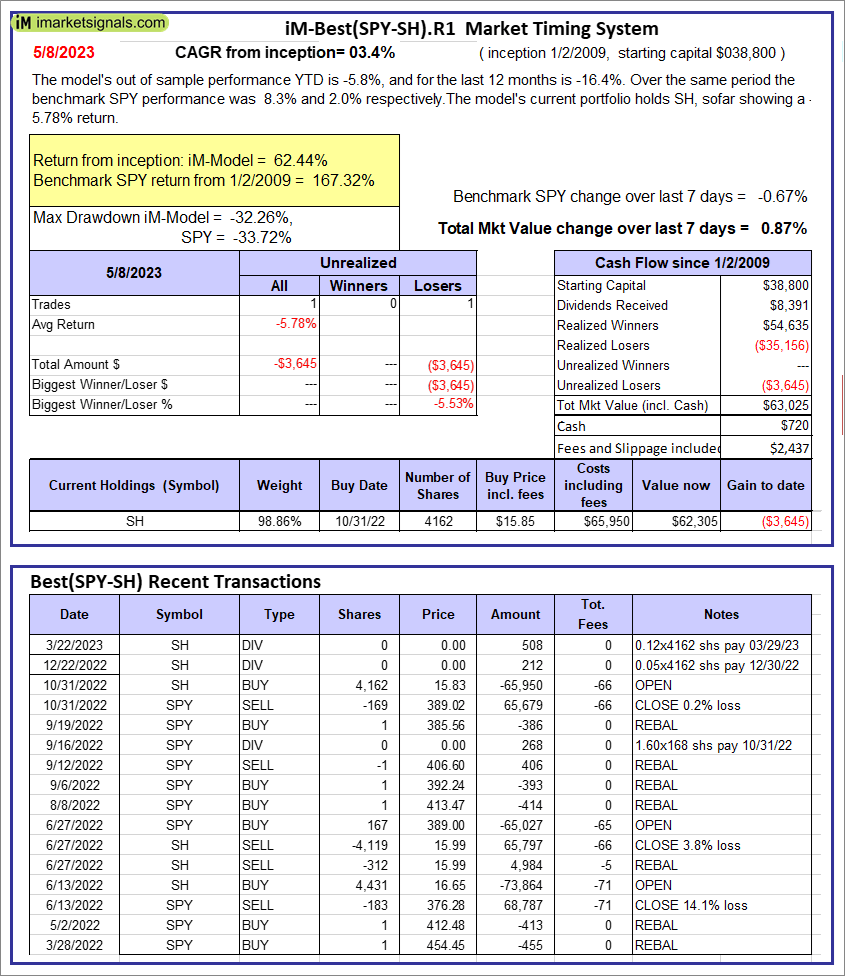 |
iM-Best(SPY-SH).R1: The model’s out of sample performance YTD is -5.8%, and for the last 12 months is -16.4%. Over the same period the benchmark SPY performance was 8.3% and 2.0% respectively. Over the previous week the market value of Best(SPY-SH) gained 0.87% at a time when SPY gained -0.67%. A starting capital of $100,000 at inception on 1/2/2009 would have grown to $63,025 which includes $720 cash and excludes $2,437 spent on fees and slippage. |
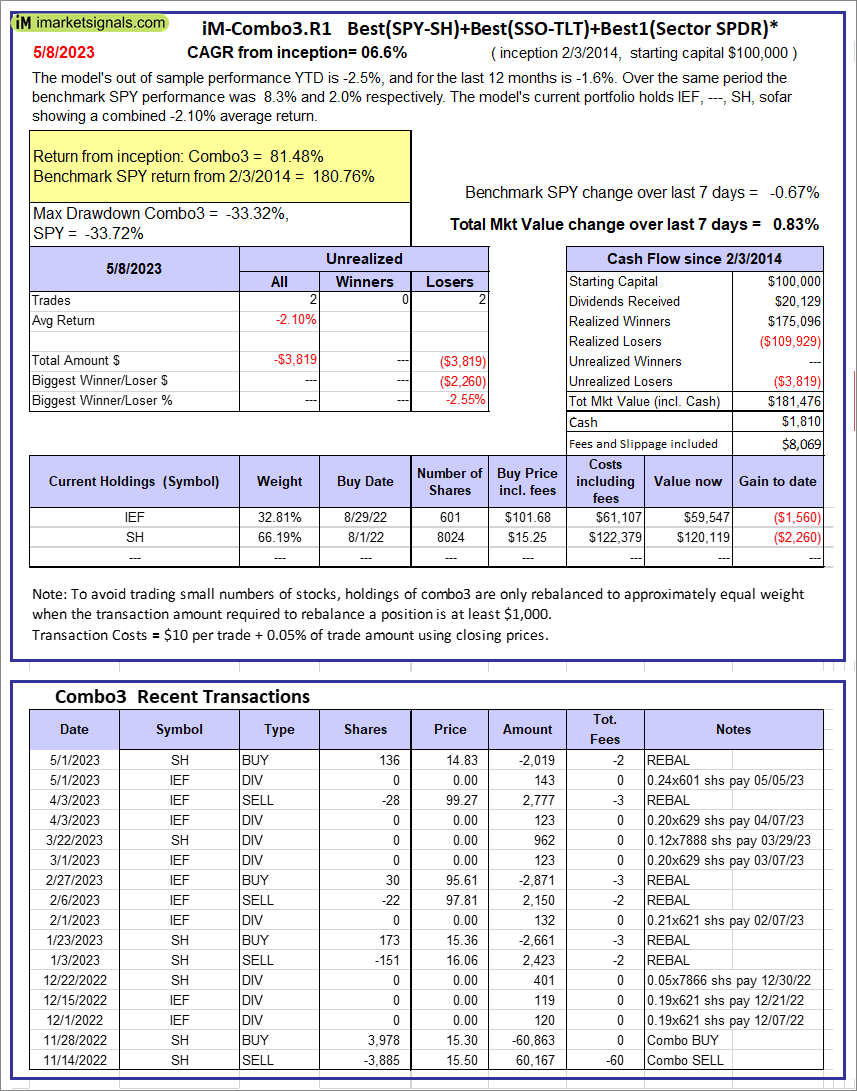 |
iM-Combo3.R1: The model’s out of sample performance YTD is -2.5%, and for the last 12 months is -1.6%. Over the same period the benchmark SPY performance was 8.3% and 2.0% respectively. Over the previous week the market value of iM-Combo3.R1 gained 0.83% at a time when SPY gained -0.67%. A starting capital of $100,000 at inception on 2/3/2014 would have grown to $181,476 which includes $1,810 cash and excludes $8,069 spent on fees and slippage. |
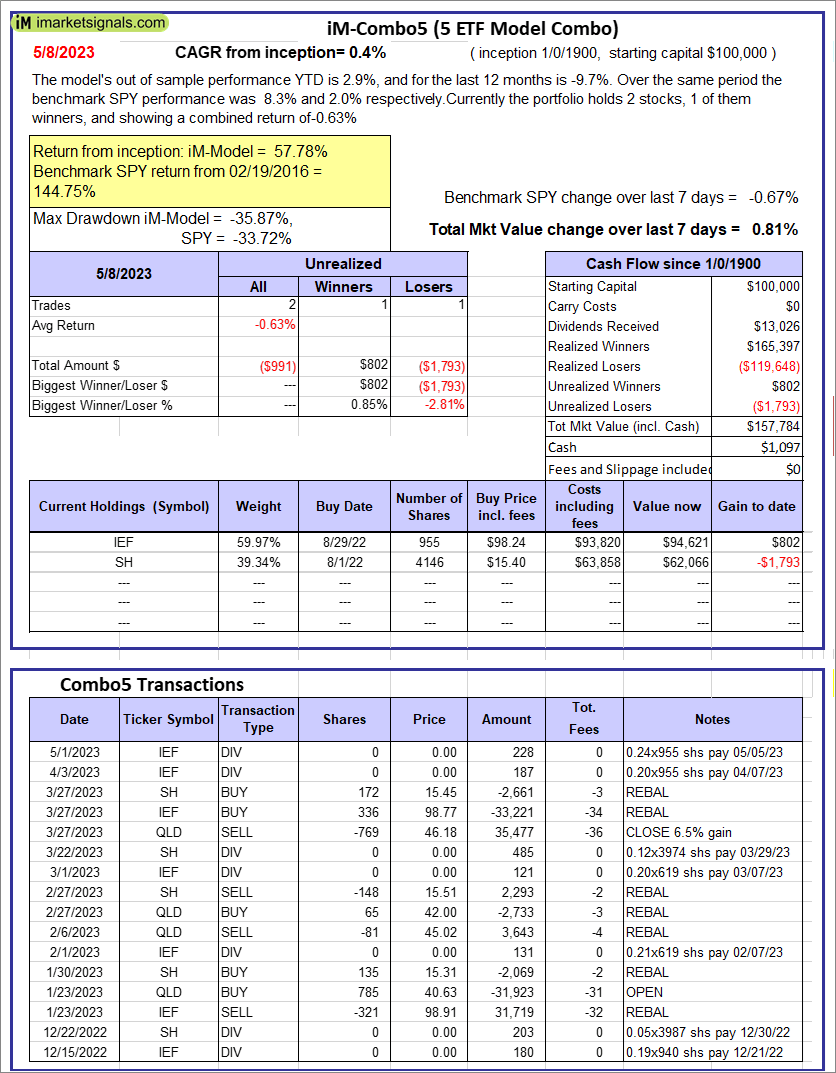 |
iM-Combo5: The model’s out of sample performance YTD is 2.9%, and for the last 12 months is -9.7%. Over the same period the benchmark SPY performance was 8.3% and 2.0% respectively. Over the previous week the market value of iM-Combo5 gained 0.81% at a time when SPY gained -0.67%. A starting capital of $100,000 at inception on 2/22/2016 would have grown to $157,784 which includes $1,097 cash and excludes $0 spent on fees and slippage. |
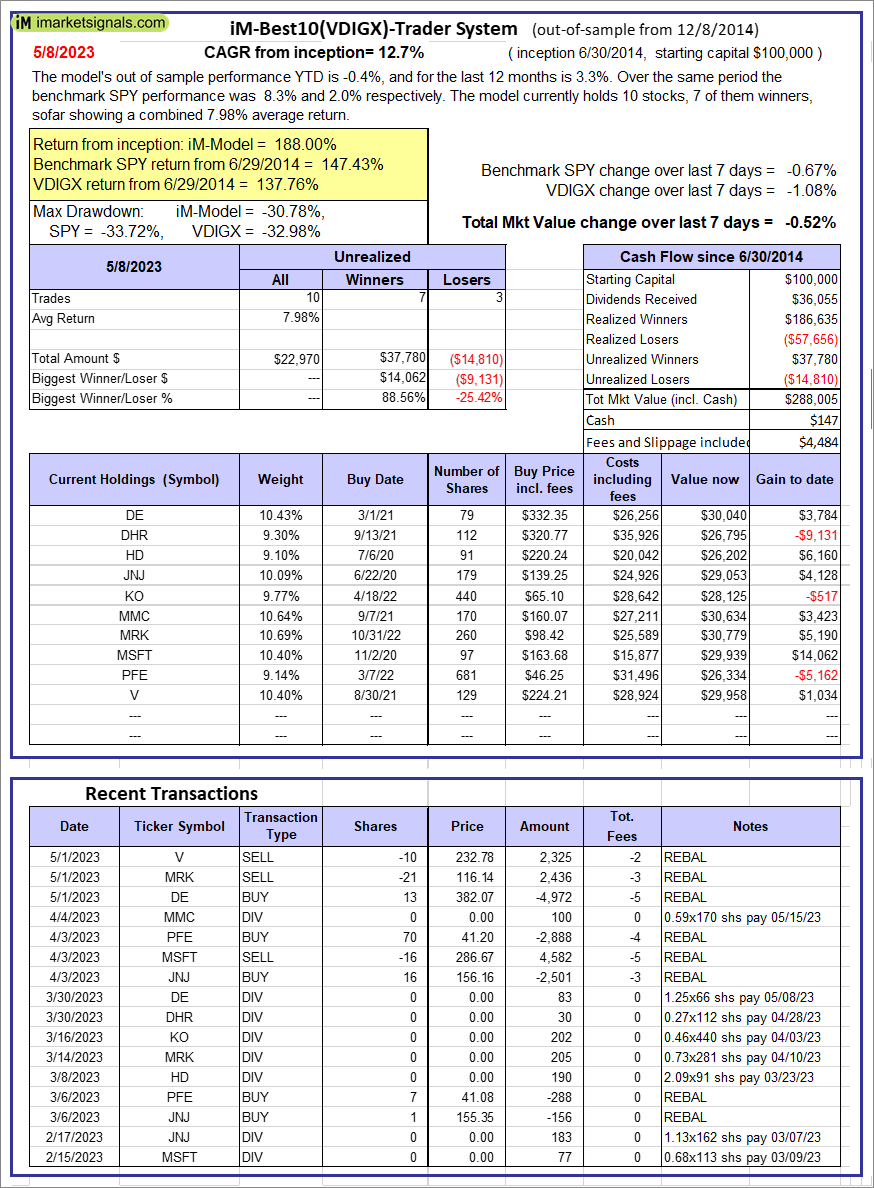 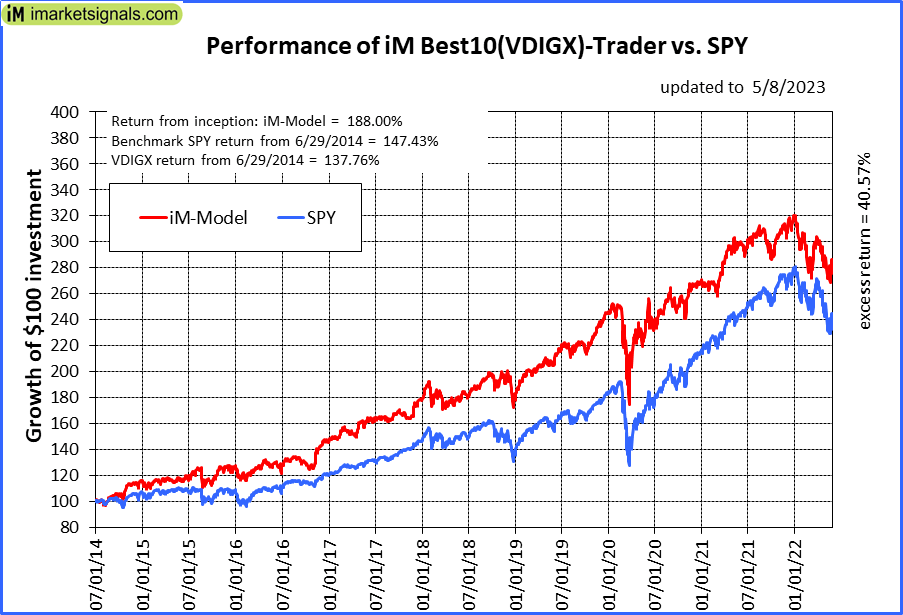 |
iM-Best10(VDIGX)-Trader: The model’s out of sample performance YTD is -0.4%, and for the last 12 months is 3.3%. Over the same period the benchmark SPY performance was 8.3% and 2.0% respectively. Since inception, on 7/1/2014, the model gained 188.00% while the benchmark SPY gained 147.43% and VDIGX gained 137.76% over the same period. Over the previous week the market value of iM-Best10(VDIGX) gained -0.52% at a time when SPY gained -0.67%. A starting capital of $100,000 at inception on 7/1/2014 would have grown to $288,005 which includes $147 cash and excludes $4,484 spent on fees and slippage. |
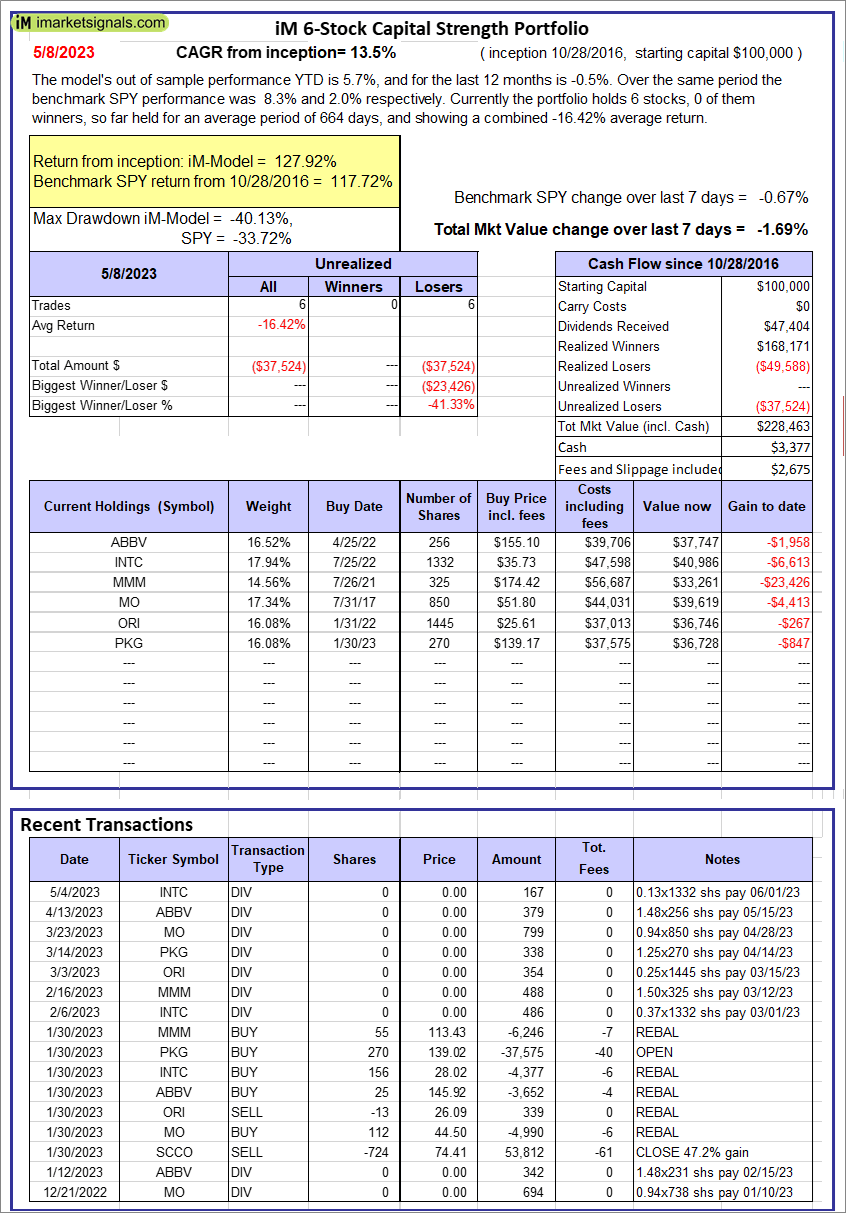 |
iM 6-Stock Capital Strength Portfolio: The model’s out of sample performance YTD is 5.7%, and for the last 12 months is -0.5%. Over the same period the benchmark SPY performance was 8.3% and 2.0% respectively. Over the previous week the market value of the iM 6-Stock Capital Strength Portfolio gained -1.69% at a time when SPY gained -0.67%. A starting capital of $100,000 at inception on 10/28/2016 would have grown to $228,463 which includes $3,377 cash and excludes $2,675 spent on fees and slippage. |
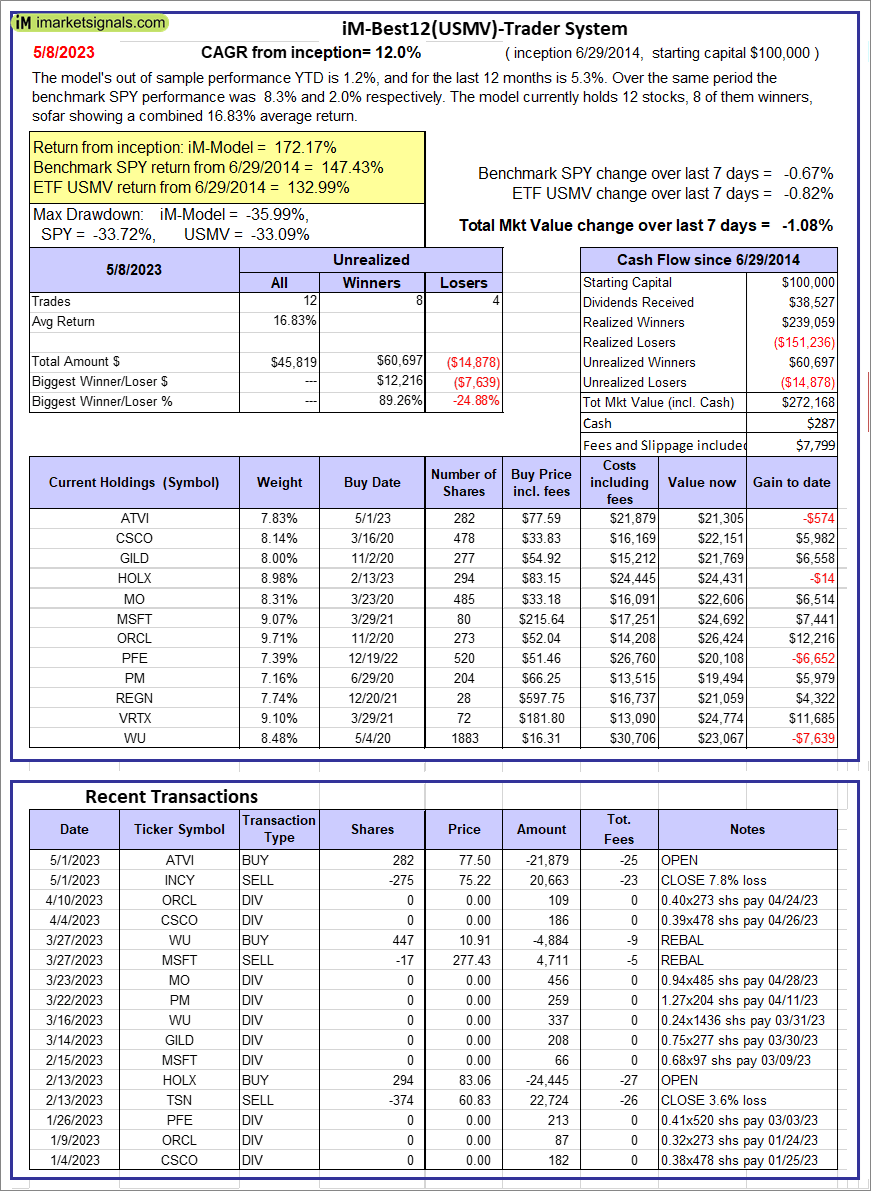 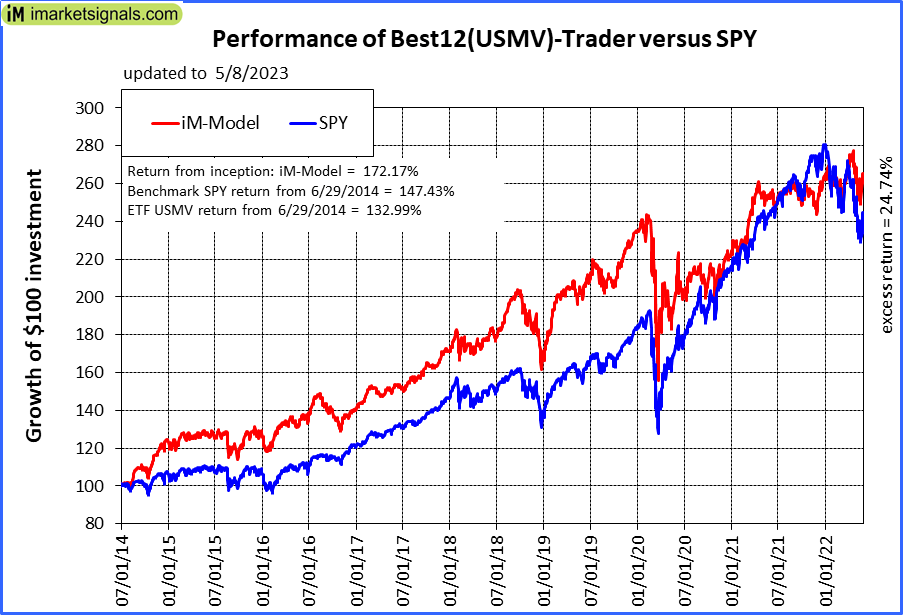 |
iM-Best12(USMV)-Trader: The model’s out of sample performance YTD is 1.2%, and for the last 12 months is 5.3%. Over the same period the benchmark SPY performance was 8.3% and 2.0% respectively. Since inception, on 6/30/2014, the model gained 172.17% while the benchmark SPY gained 147.43% and the ETF USMV gained 132.99% over the same period. Over the previous week the market value of iM-Best12(USMV)-Trader gained -1.08% at a time when SPY gained -0.67%. A starting capital of $100,000 at inception on 6/30/2014 would have grown to $272,168 which includes $287 cash and excludes $7,799 spent on fees and slippage. |
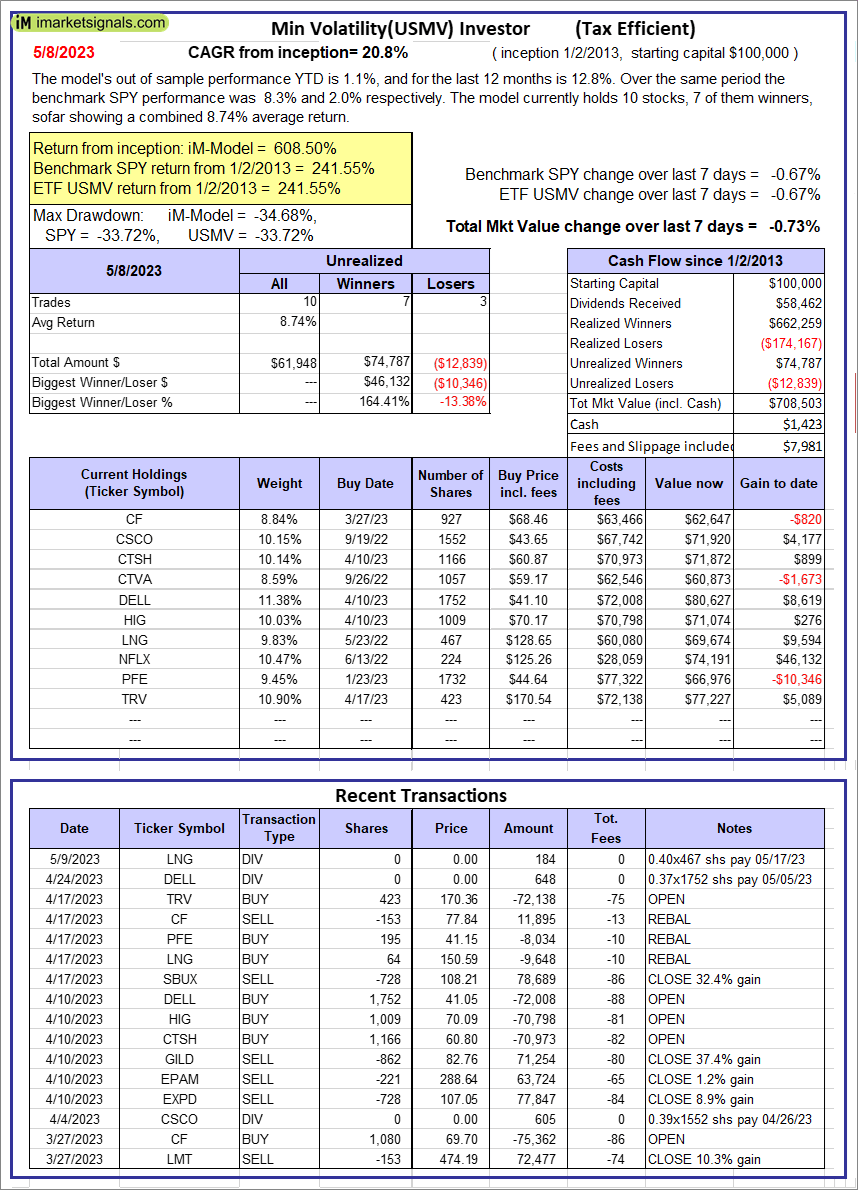 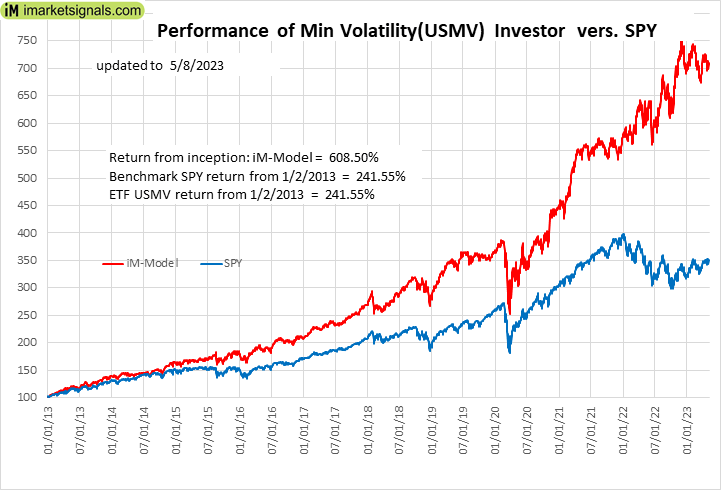 |
iM-Min Volatility(USMV) Investor (Tax Efficient): The model’s out of sample performance YTD is 1.1%, and for the last 12 months is 12.8%. Over the same period the benchmark SPY performance was 8.3% and 2.0% respectively. Since inception, on 1/3/2013, the model gained 608.50% while the benchmark SPY gained 241.55% and the ETF USMV gained 241.55% over the same period. Over the previous week the market value of iM-Best12(USMV)Q1 gained -0.73% at a time when SPY gained -0.67%. A starting capital of $100,000 at inception on 1/3/2013 would have grown to $708,503 which includes $1,423 cash and excludes $7,981 spent on fees and slippage. |
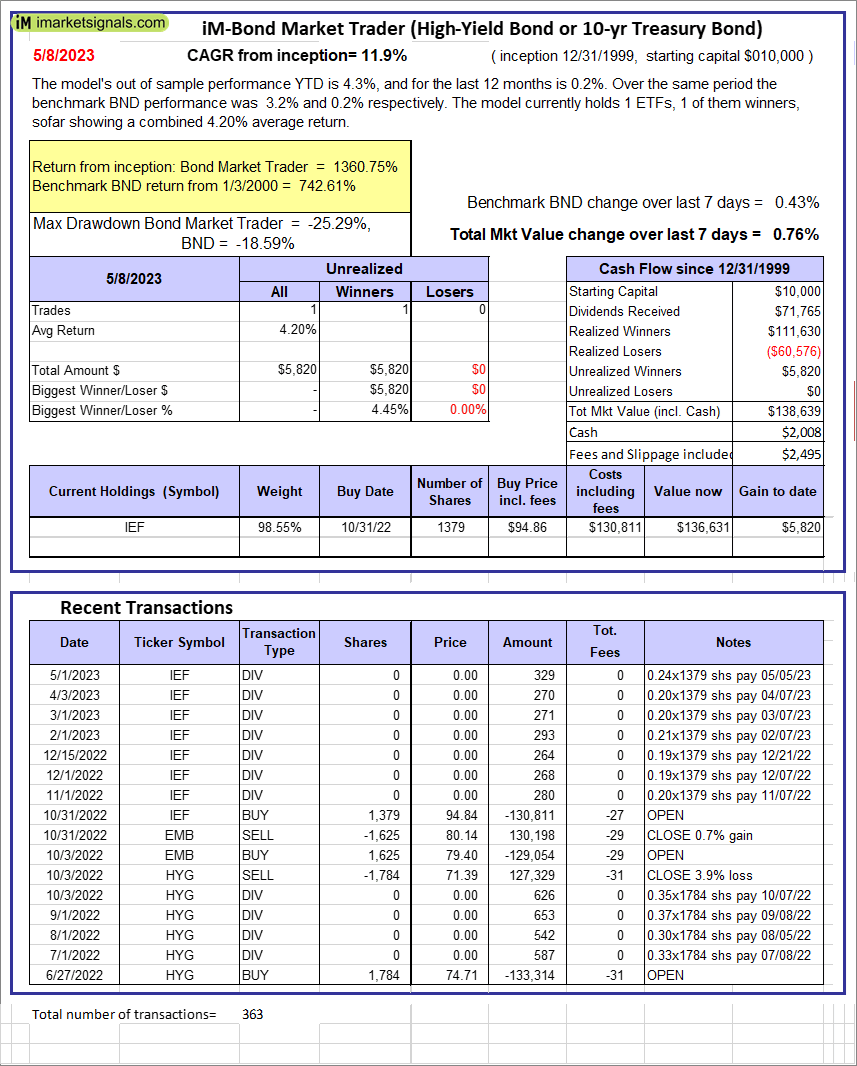 |
iM-Bond Market Trader (High-Yield Bond or 10-yr Treasury Bond): The model’s out of sample performance YTD is 4.3%, and for the last 12 months is 0.2%. Over the same period the benchmark BND performance was 3.2% and 0.2% respectively. Over the previous week the market value of the iM-Bond Market Trader (High-Yield Bond or 10-yr Treasury Bond) gained 0.76% at a time when BND gained 0.43%. A starting capital of $10,000 at inception on 1/3/2000 would have grown to $138,639 which includes $2,008 cash and excludes $2,495 spent on fees and slippage. |
|
|
iM-ModSum/YieldCurve Timer: The model’s out of sample performance YTD is 3.1%, and for the last 12 months is -2.2%. Over the same period the benchmark SPY performance was 8.3% and 2.0% respectively. Over the previous week the market value of iM-PortSum/YieldCurve Timer gained -0.67% at a time when SPY gained -0.67%. A starting capital of $100,000 at inception on 1/1/2016 would have grown to $260,146 which includes -$1,944 cash and excludes $1,281 spent on fees and slippage. |
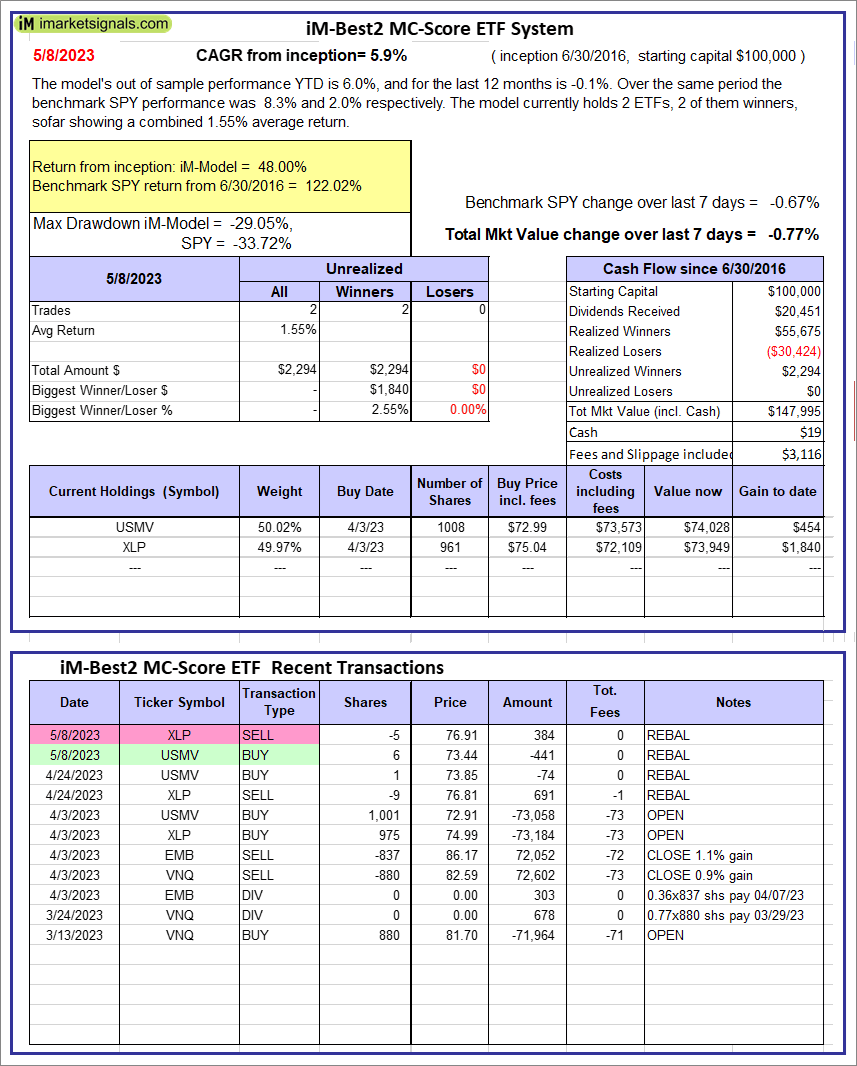 |
iM-Best2 MC-Score ETF System: The model’s out of sample performance YTD is 6.0%, and for the last 12 months is -0.1%. Over the same period the benchmark SPY performance was 8.3% and 2.0% respectively. Over the previous week the market value of the iM-Best2 MC-Score ETF System gained -0.77% at a time when SPY gained -0.67%. A starting capital of $100,000 at inception on 6/30/2016 would have grown to $147,995 which includes $19 cash and excludes $3,116 spent on fees and slippage. |
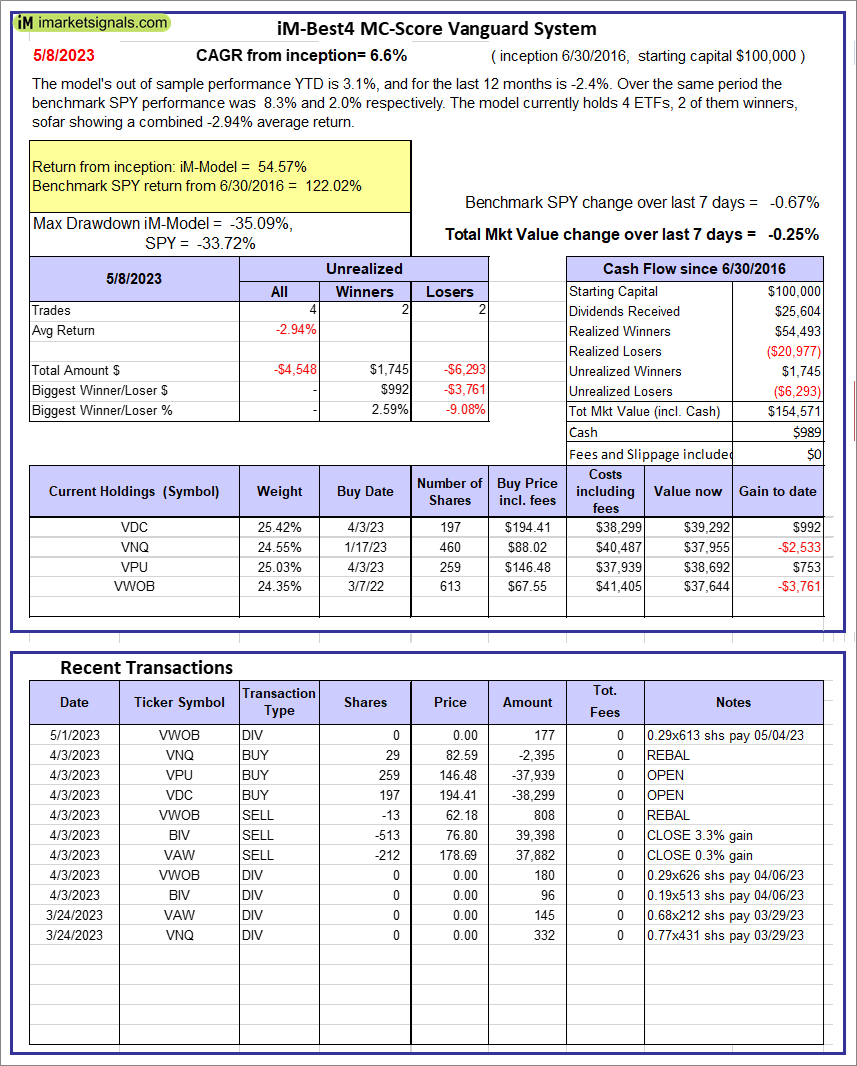 |
iM-Best4 MC-Score Vanguard System: The model’s out of sample performance YTD is 3.1%, and for the last 12 months is -2.4%. Over the same period the benchmark SPY performance was 8.3% and 2.0% respectively. Over the previous week the market value of the iM-Best4 MC-Score Vanguard System gained -0.25% at a time when SPY gained -0.67%. A starting capital of $100,000 at inception on 6/30/2016 would have grown to $154,571 which includes $989 cash and excludes $00 spent on fees and slippage. |
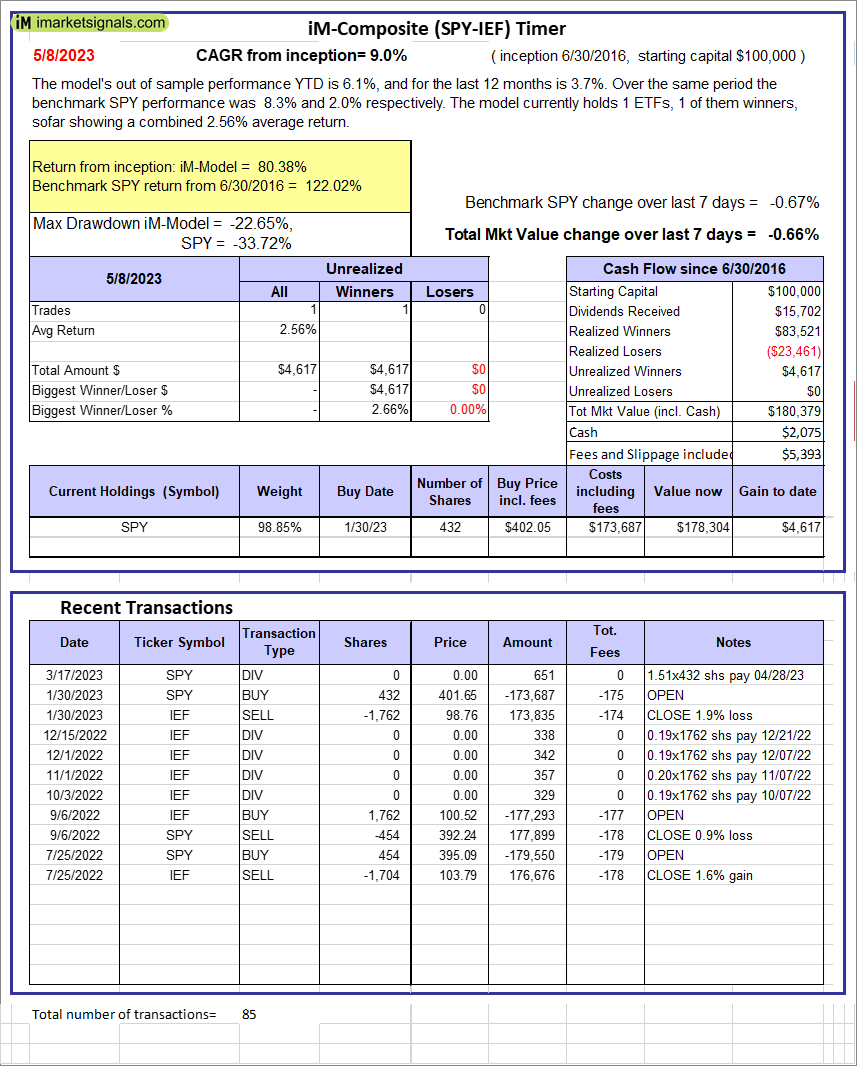 |
iM-Composite (SPY-IEF) Timer: The model’s out of sample performance YTD is 6.1%, and for the last 12 months is 3.7%. Over the same period the benchmark SPY performance was 8.3% and 2.0% respectively. Over the previous week the market value of the iM-Composite (SPY-IEF) Timer gained -0.66% at a time when SPY gained -0.67%. A starting capital of $100,000 at inception on 6/30/2016 would have grown to $180,379 which includes $2,075 cash and excludes $5,393 spent on fees and slippage. |
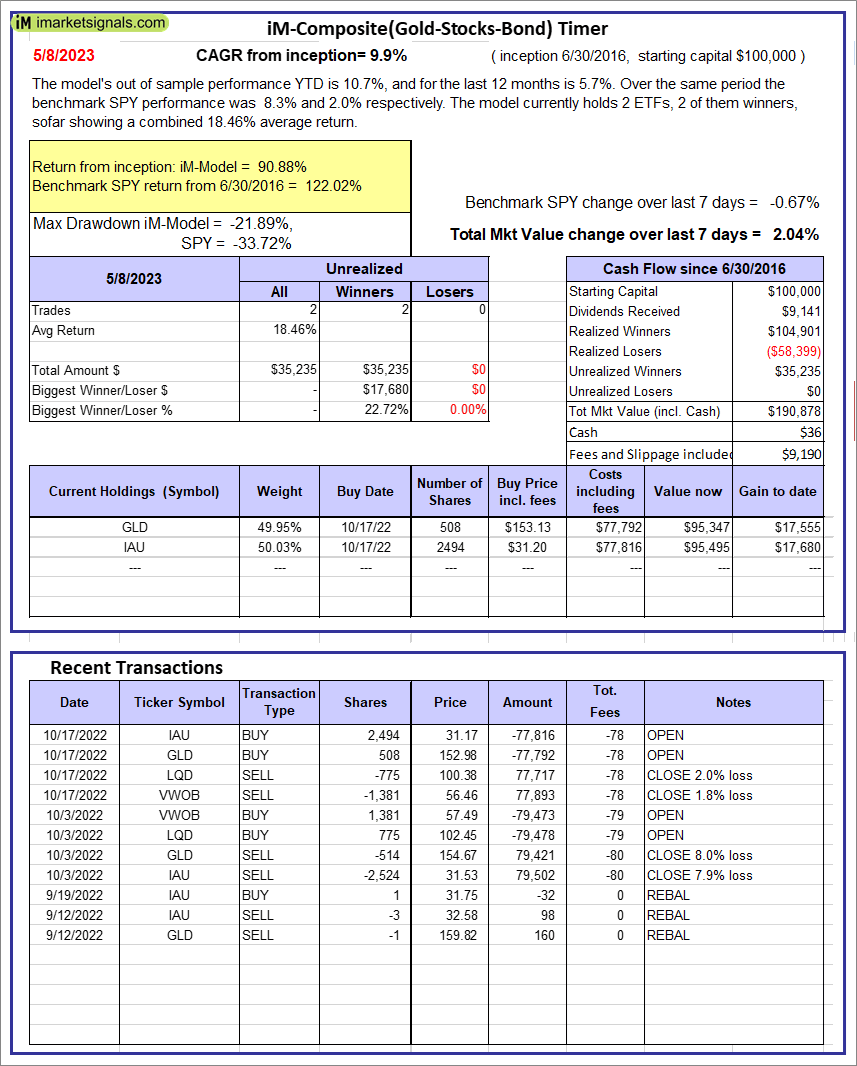 |
iM-Composite(Gold-Stocks-Bond) Timer: The model’s out of sample performance YTD is 10.7%, and for the last 12 months is 5.7%. Over the same period the benchmark SPY performance was 8.3% and 2.0% respectively. Over the previous week the market value of the iM-Composite(Gold-Stocks-Bond) Timer gained 2.04% at a time when SPY gained -0.67%. A starting capital of $100,000 at inception on 6/30/2016 would have grown to $190,878 which includes $36 cash and excludes $9,190 spent on fees and slippage. |
iM-Best Reports – 5/9/2023
Posted in pmp SPY-SH
Leave a Reply
You must be logged in to post a comment.