
  |
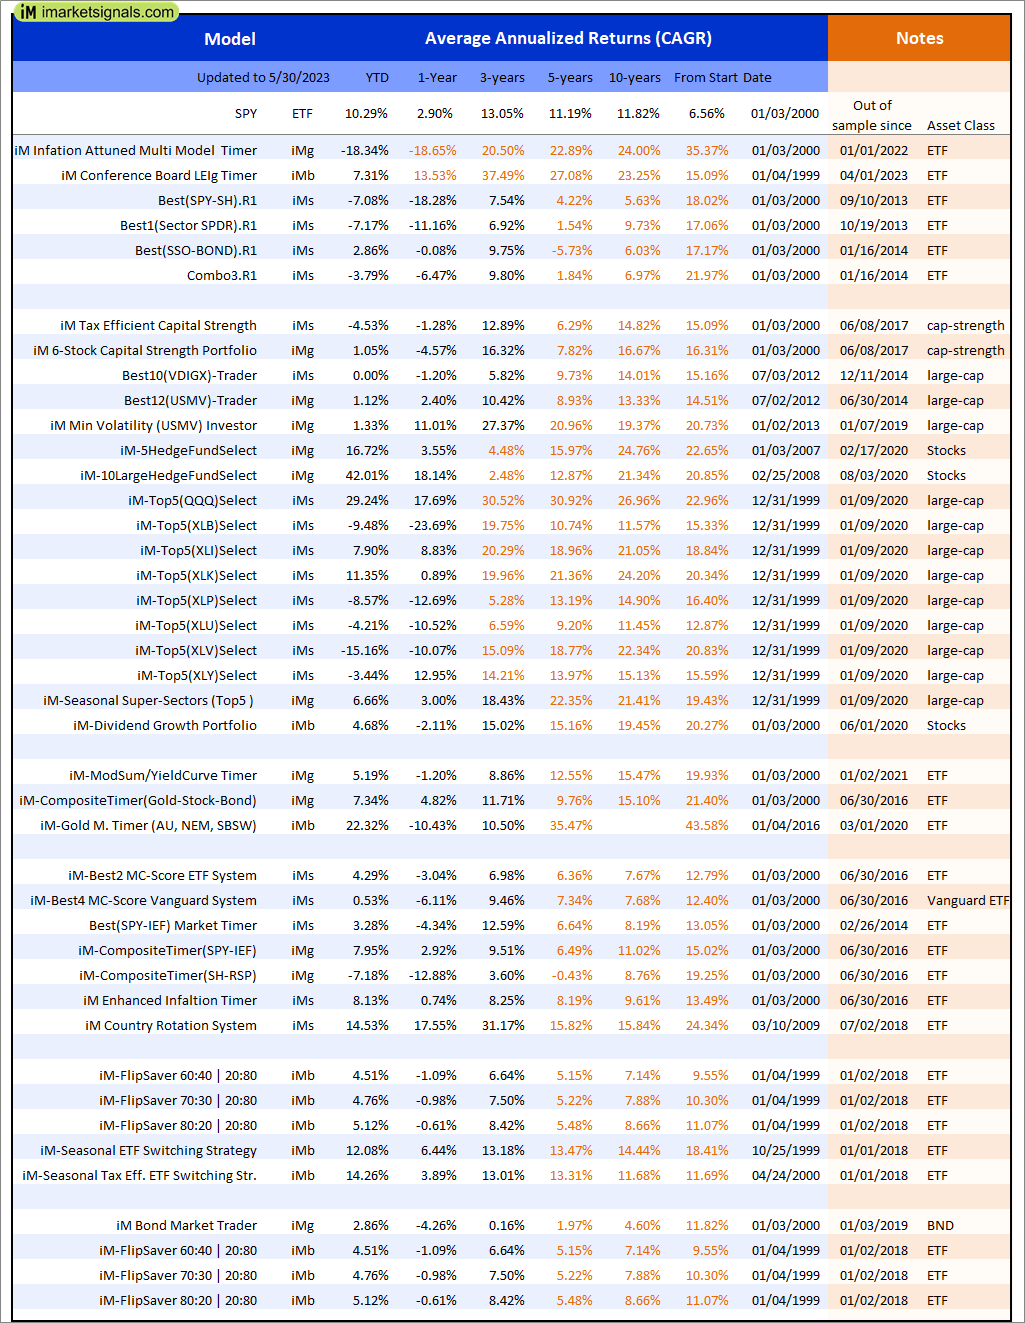
Out of sample performance summary of our models for the past 1, 2, 4 and 13 week periods. The active active return indicates how the models over- or underperformed the benchmark ETF SPY. Also the YTD, and the 1-, 3-, 5- and 10-year annualized returns are shown in the second table |
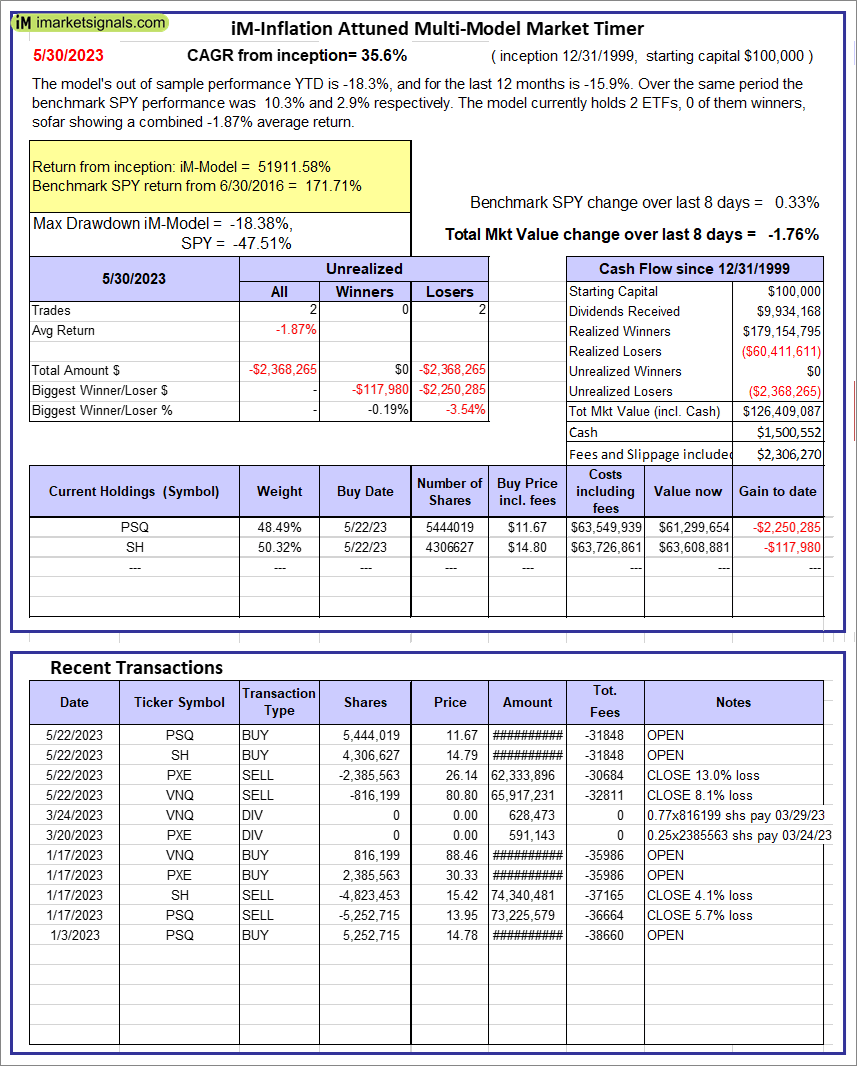 |
iM-Inflation Attuned Multi-Model Market Timer: The model’s out of sample performance YTD is -18.3%, and for the last 12 months is -15.9%. Over the same period the benchmark SPY performance was 10.3% and 2.9% respectively. Over the previous week the market value of the iM-Inflation Attuned Multi-Model Market Timer gained -1.76% at a time when SPY gained 0.33%. A starting capital of $100,000 at inception on 3/24/2017 would have grown to $126,409,087 which includes $1,500,552 cash and excludes $2,306,270 spent on fees and slippage. |
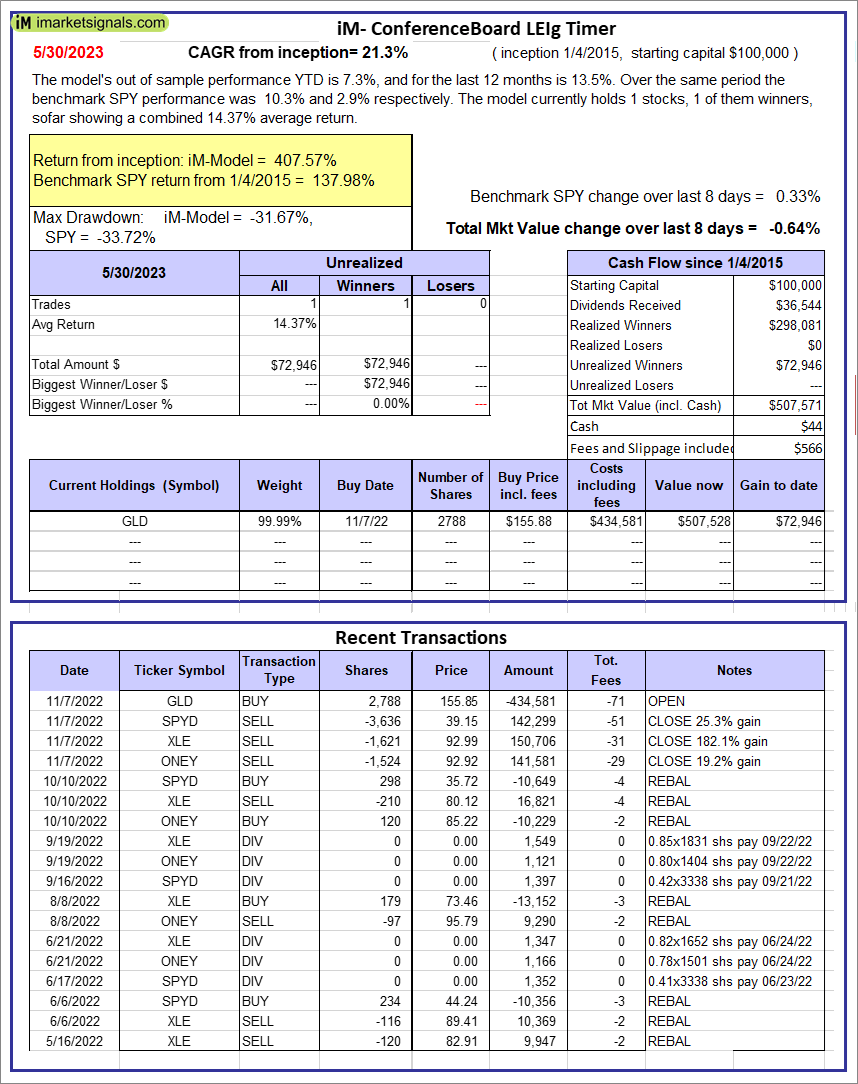 |
iM-Conference Board LEIg Timer: The model’s performance YTD is 14.3%, and for the last 12 months is 7.3%. Over the same period the benchmark SPY performance was 20.1% and 9.4% respectively. Over the previous week the market value of the iM-Conference Board LEIg Timer gained -0.64% at a time when SPY gained 0.33%. A starting capital of $100,000 at inception on 4/5/2017 would have grown to $507,571 which includes $44 cash and excludes $566 spent on fees and slippage. |
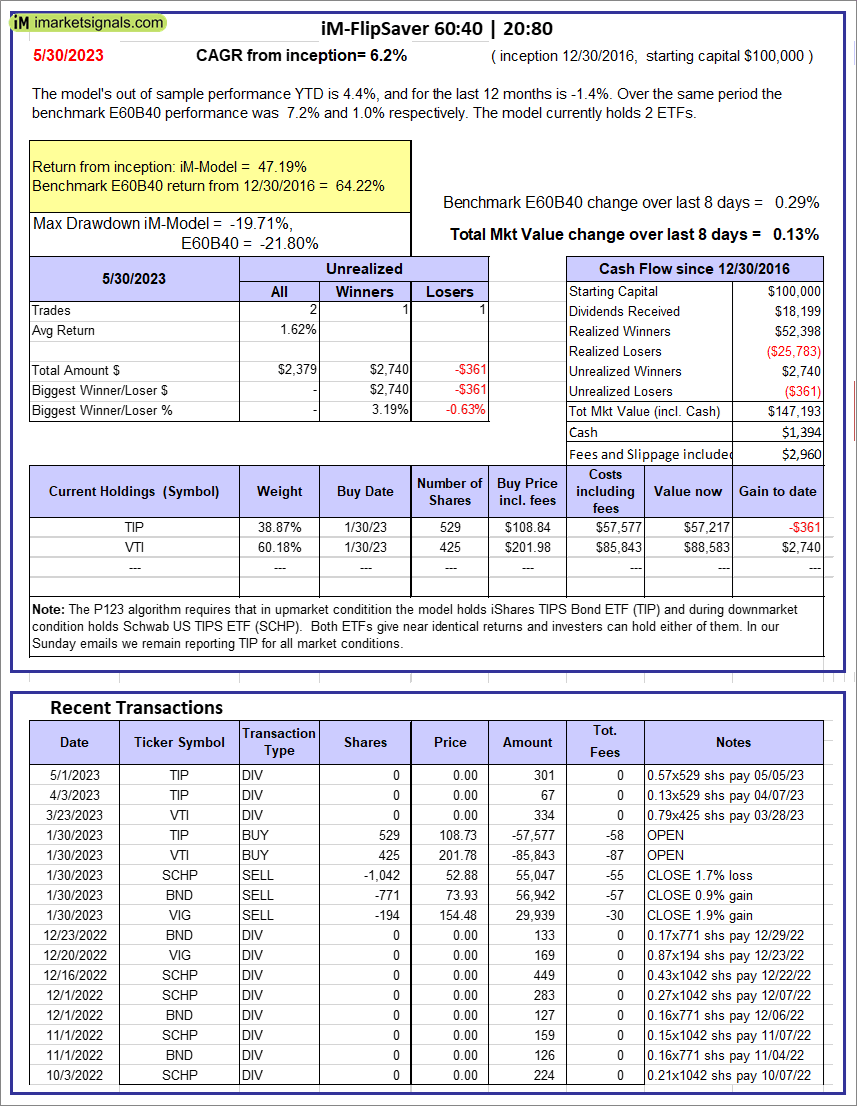 |
iM-FlipSaver 60:40 | 20:80 – 2017: The model’s out of sample performance YTD is 4.4%, and for the last 12 months is -1.4%. Over the same period the benchmark E60B40 performance was 7.2% and 1.0% respectively. Over the previous week the market value of iM-FlipSaver 80:20 | 20:80 gained 0.13% at a time when SPY gained 0.29%. A starting capital of $100,000 at inception on 7/16/2015 would have grown to $147,193 which includes $1,394 cash and excludes $2,960 spent on fees and slippage. |
 |
iM-FlipSaver 70:30 | 20:80 – 2017: The model’s out of sample performance YTD is 4.8%, and for the last 12 months is -1.0%. Over the same period the benchmark E60B40 performance was 7.2% and 1.0% respectively. Over the previous week the market value of iM-FlipSaver 70:30 | 20:80 gained 0.14% at a time when SPY gained 0.29%. A starting capital of $100,000 at inception on 7/15/2015 would have grown to $151,886 which includes $1,457 cash and excludes $3,126 spent on fees and slippage. |
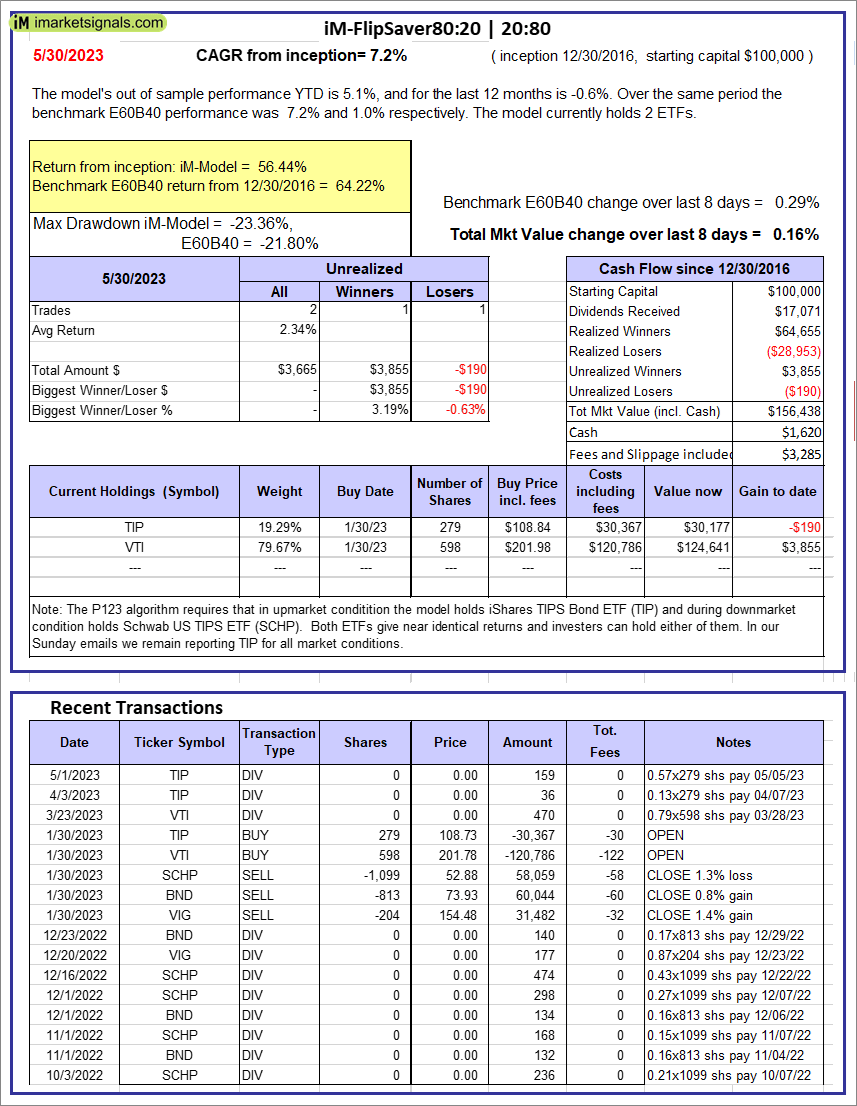 |
iM-FlipSaver 80:20 | 20:80 – 2017: The model’s out of sample performance YTD is 5.1%, and for the last 12 months is -0.6%. Over the same period the benchmark E60B40 performance was 7.2% and 1.0% respectively. Over the previous week the market value of iM-FlipSaver 80:20 | 20:80 gained 0.16% at a time when SPY gained 0.29%. A starting capital of $100,000 at inception on 1/2/2017 would have grown to $156,438 which includes $1,620 cash and excludes $3,285 spent on fees and slippage. |
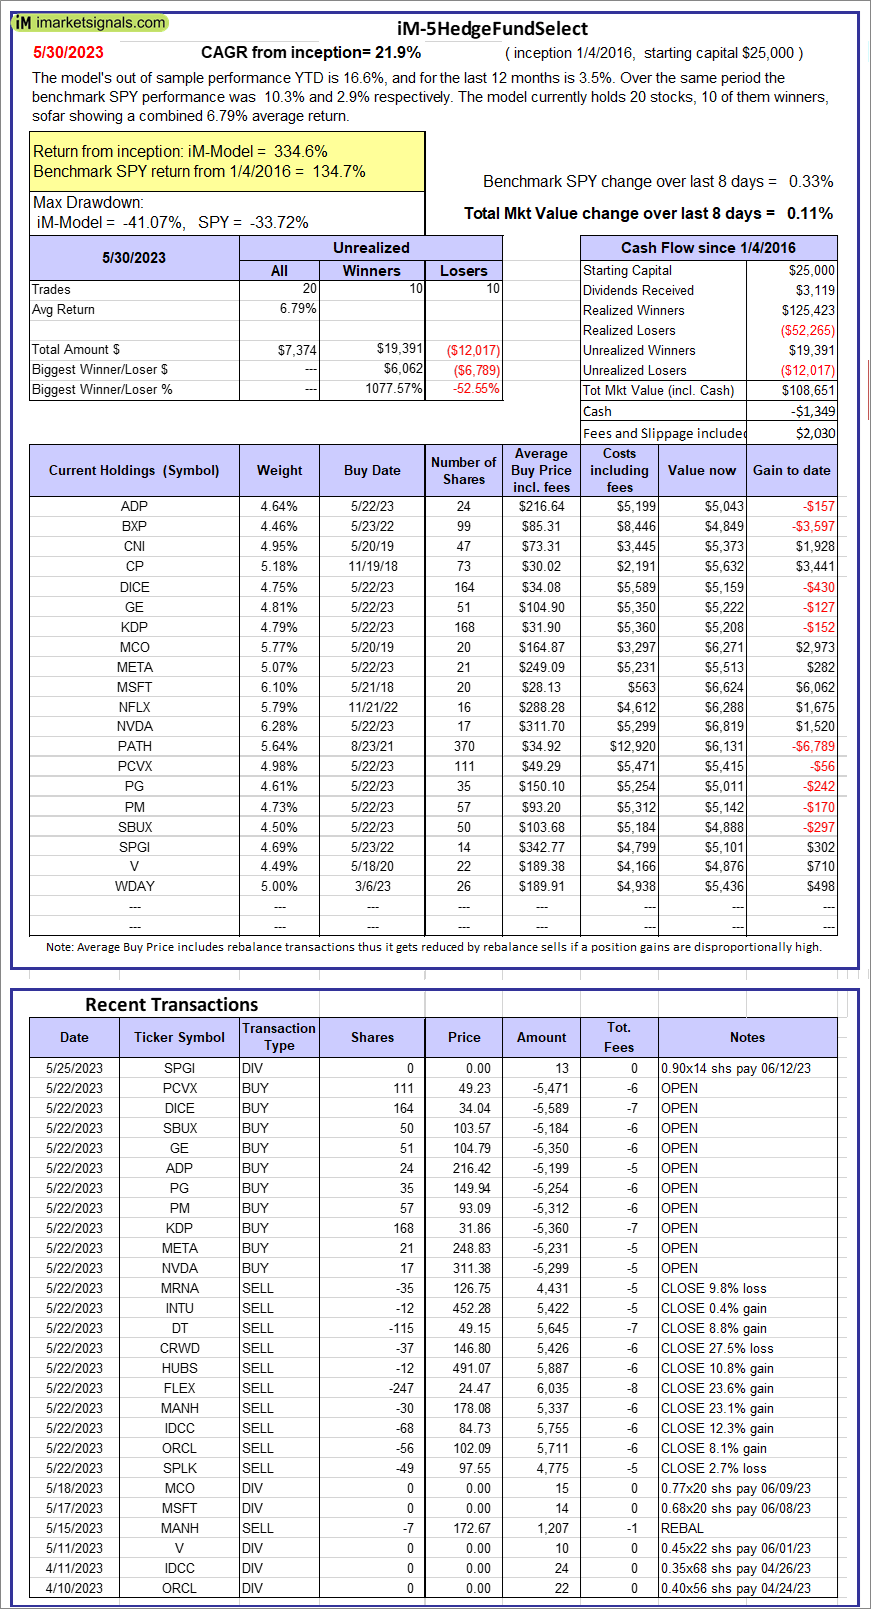 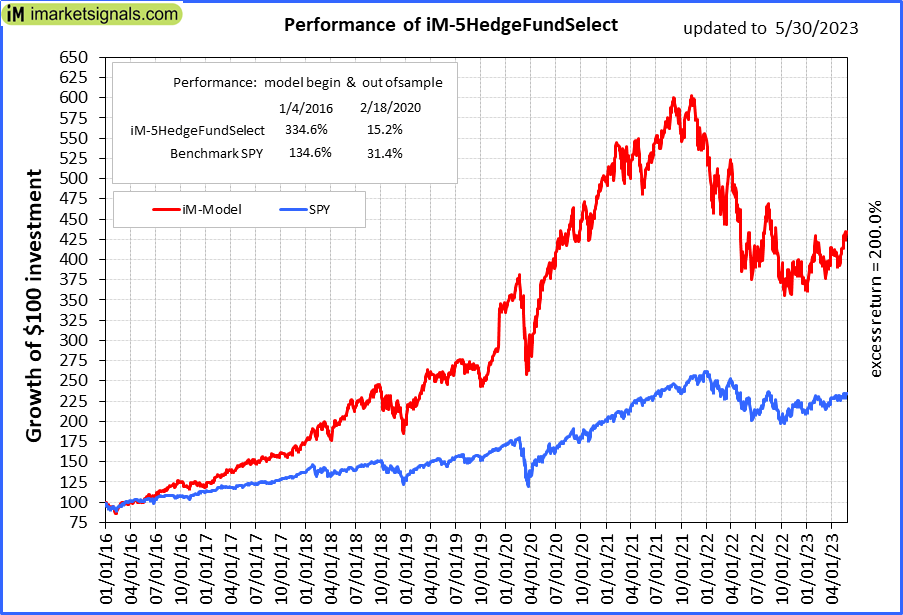 |
iM-5HedgeFundSelect: Since inception, on 1/5/2016, the model gained 334.60% while the benchmark SPY gained 134.65% over the same period. Over the previous week the market value of iM-5HedgeFundSelect gained 0.11% at a time when SPY gained 0.33%. A starting capital of $25,000 at inception on 1/5/2016 would have grown to $108,651 which includes -$1,349 cash and excludes $2,030 spent on fees and slippage. |
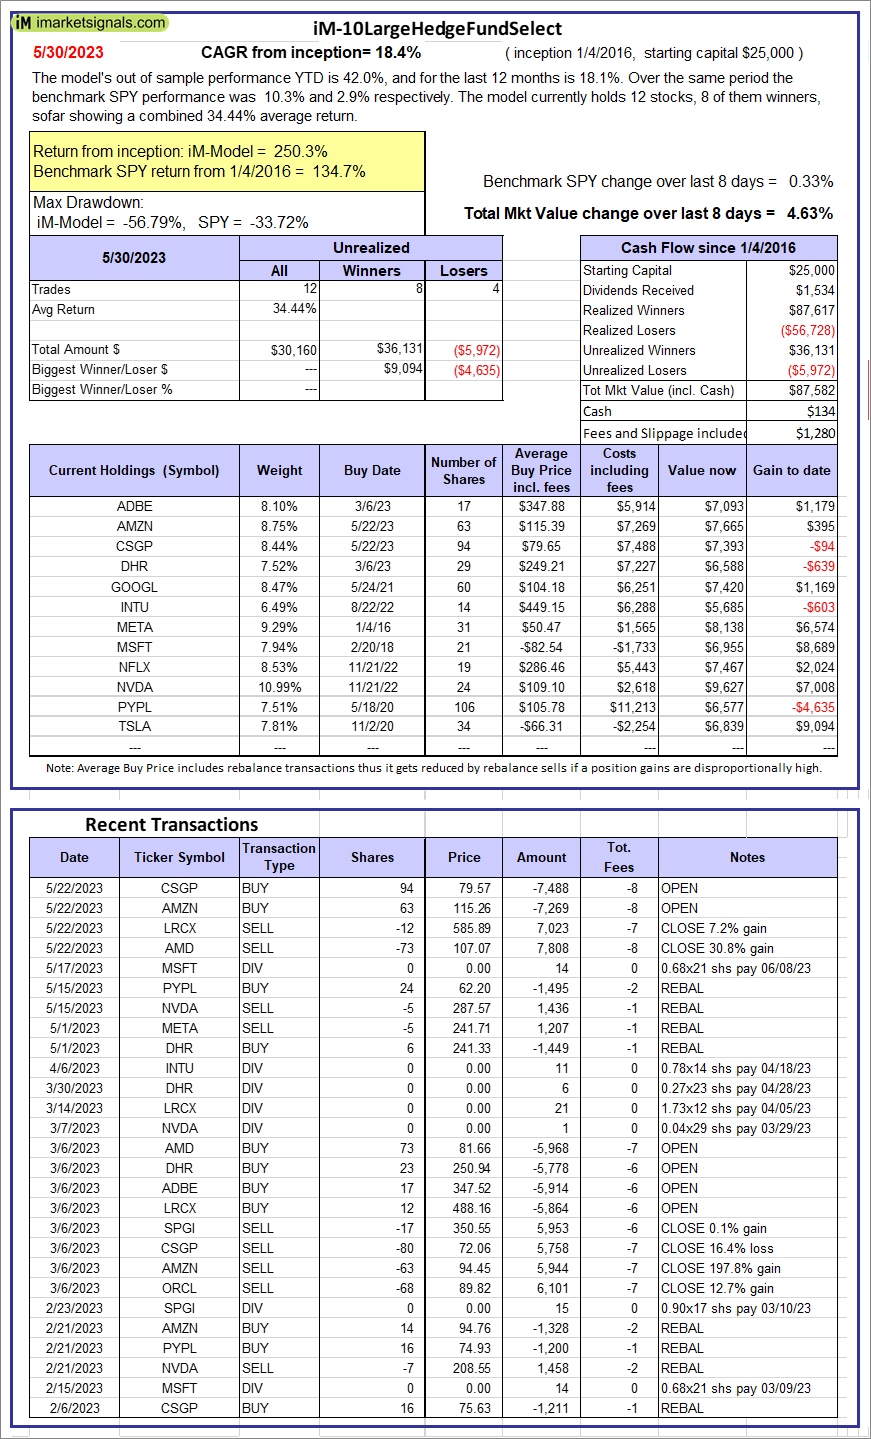 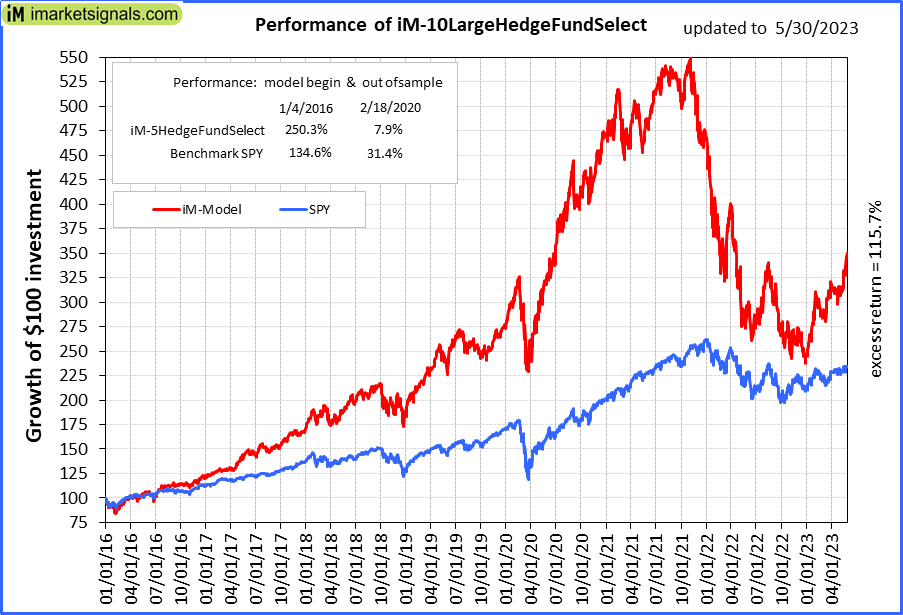 |
iM-10LargeHedgeFundSelect: Since inception, on 1/5/2016, the model gained 250.33% while the benchmark SPY gained 134.65% over the same period. Over the previous week the market value of iM-10LargeHedgeFundSelect gained 4.63% at a time when SPY gained 0.33%. A starting capital of $25,000 at inception on 1/5/2016 would have grown to $87,582 which includes $134 cash and excludes $1,280 spent on fees and slippage. |
 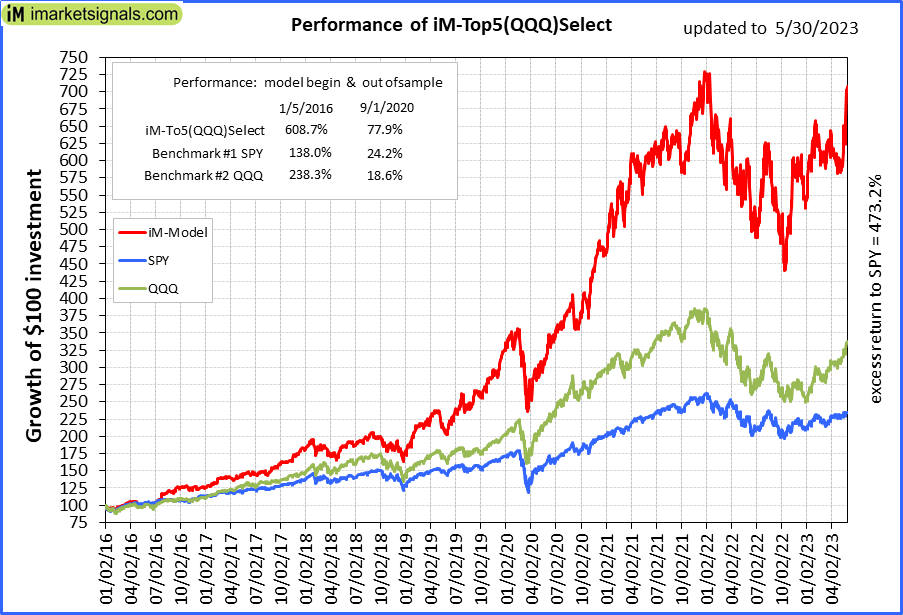 |
iM-Top5(QQQ)Select: Since inception, on 1/5/2016, the model gained 607.87% while the benchmark SPY gained 134.65% over the same period. Over the previous week the market value of iM-Top5(QQQ)Select gained 10.57% at a time when SPY gained 0.33%. A starting capital of $100,000 at inception on 1/5/2016 would have grown to $707,866 which includes -$4,458 cash and excludes $9,704 spent on fees and slippage. |
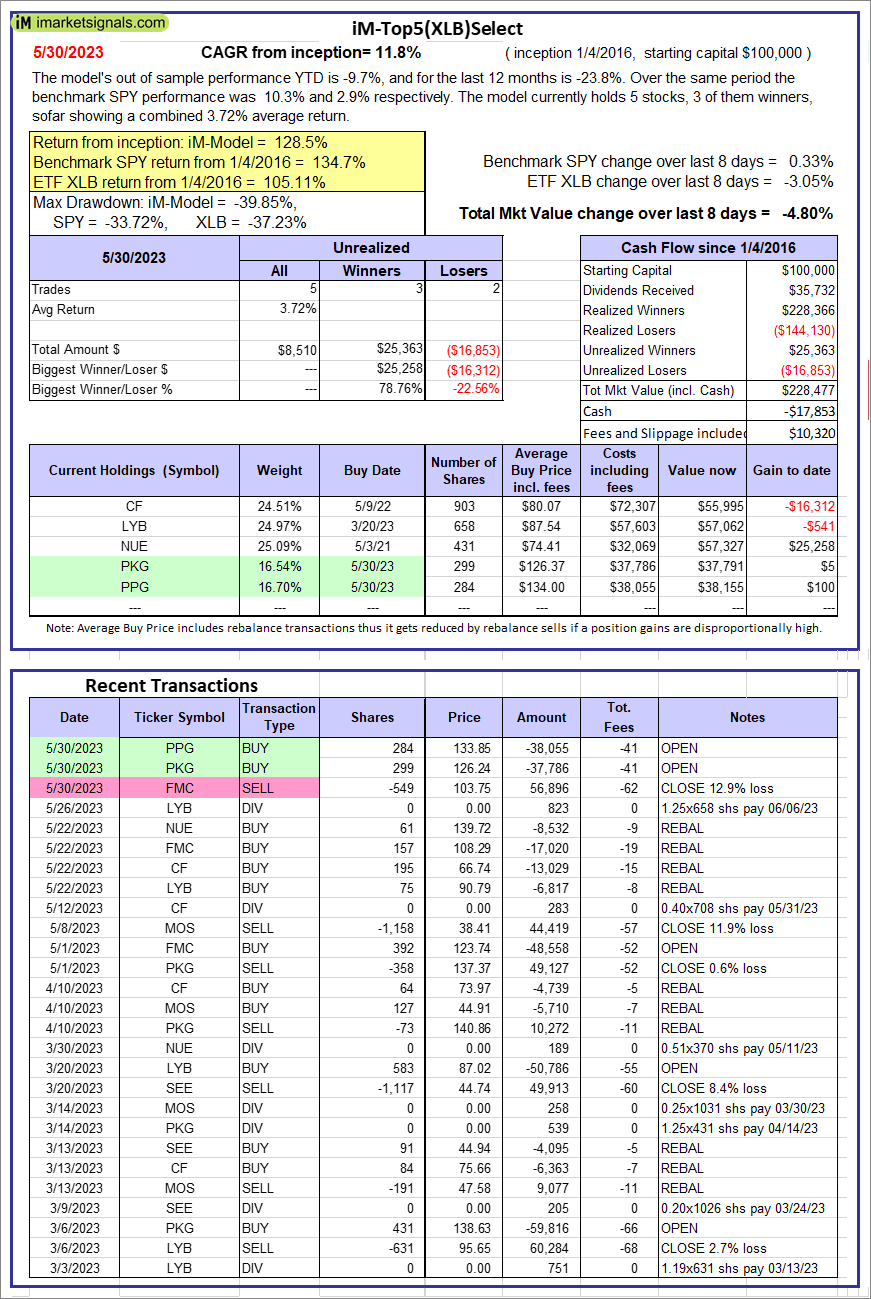 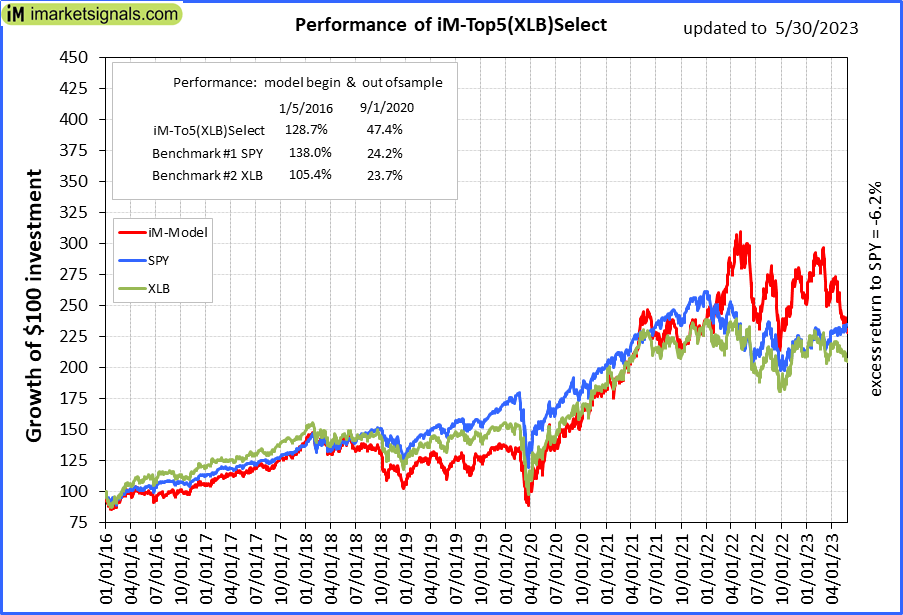 |
iM-Top5(XLB)Select: Since inception, on 1/5/2016, the model gained 128.48% while the benchmark SPY gained 134.65% over the same period. Over the previous week the market value of iM-Top5(XLB)Select gained -4.80% at a time when SPY gained 0.33%. A starting capital of $100,000 at inception on 1/5/2016 would have grown to $228,477 which includes -$17,853 cash and excludes $10,320 spent on fees and slippage. |
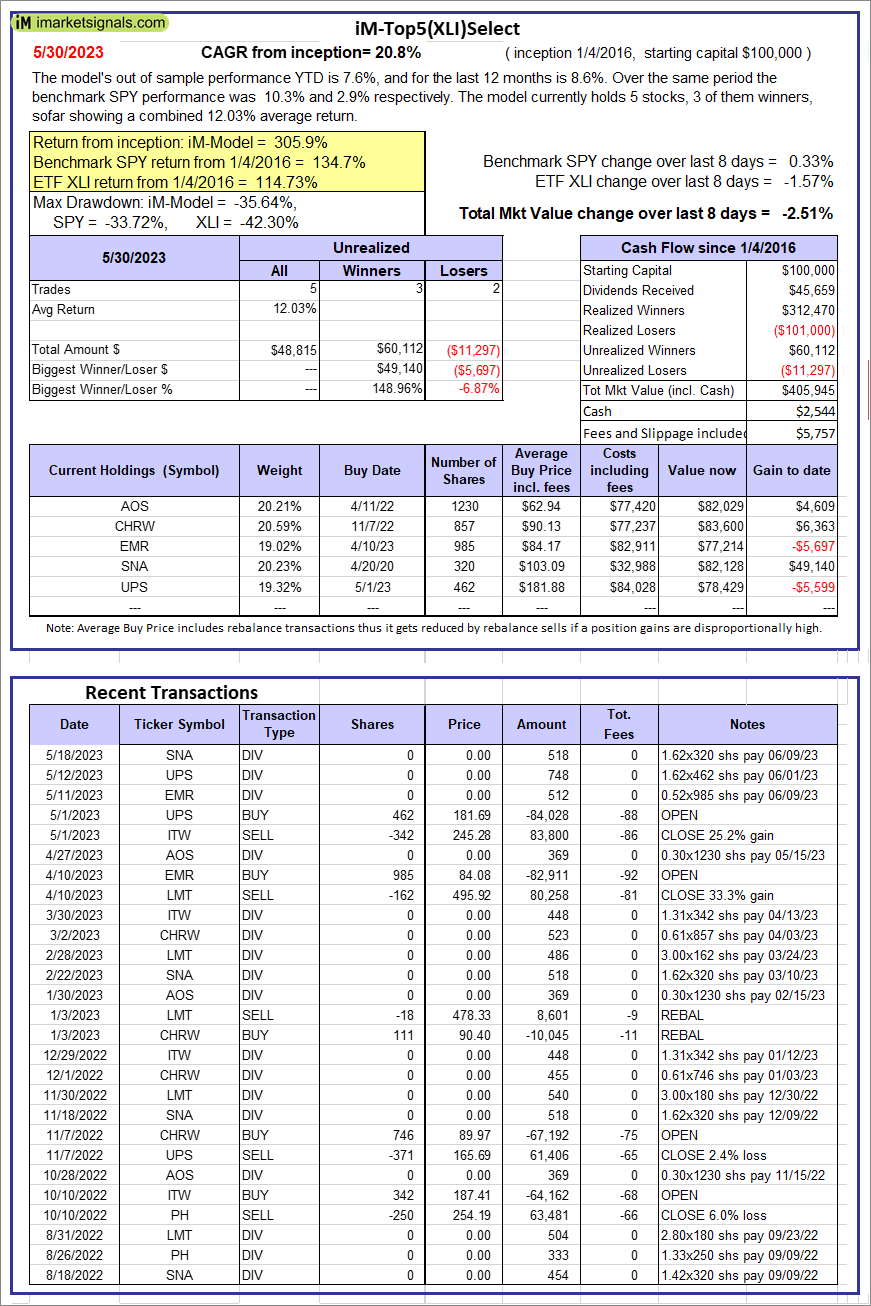 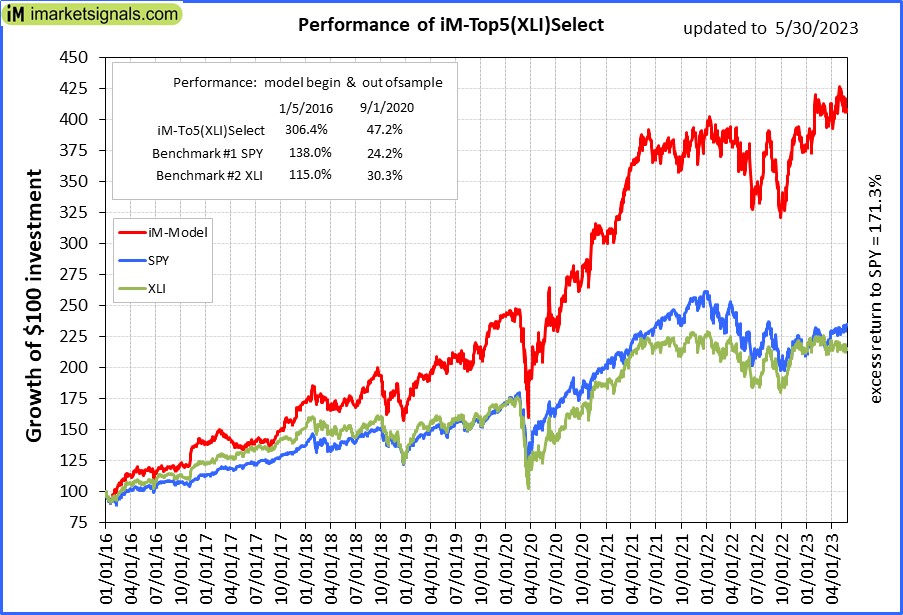 |
iM-Top5(XLI)Select: Since inception, on 1/5/2016, the model gained 305.94% while the benchmark SPY gained 134.65% over the same period. Over the previous week the market value of iM-Top5(XLI)Select gained -2.51% at a time when SPY gained 0.33%. A starting capital of $100,000 at inception on 1/5/2016 would have grown to $405,945 which includes $2,544 cash and excludes $5,757 spent on fees and slippage. |
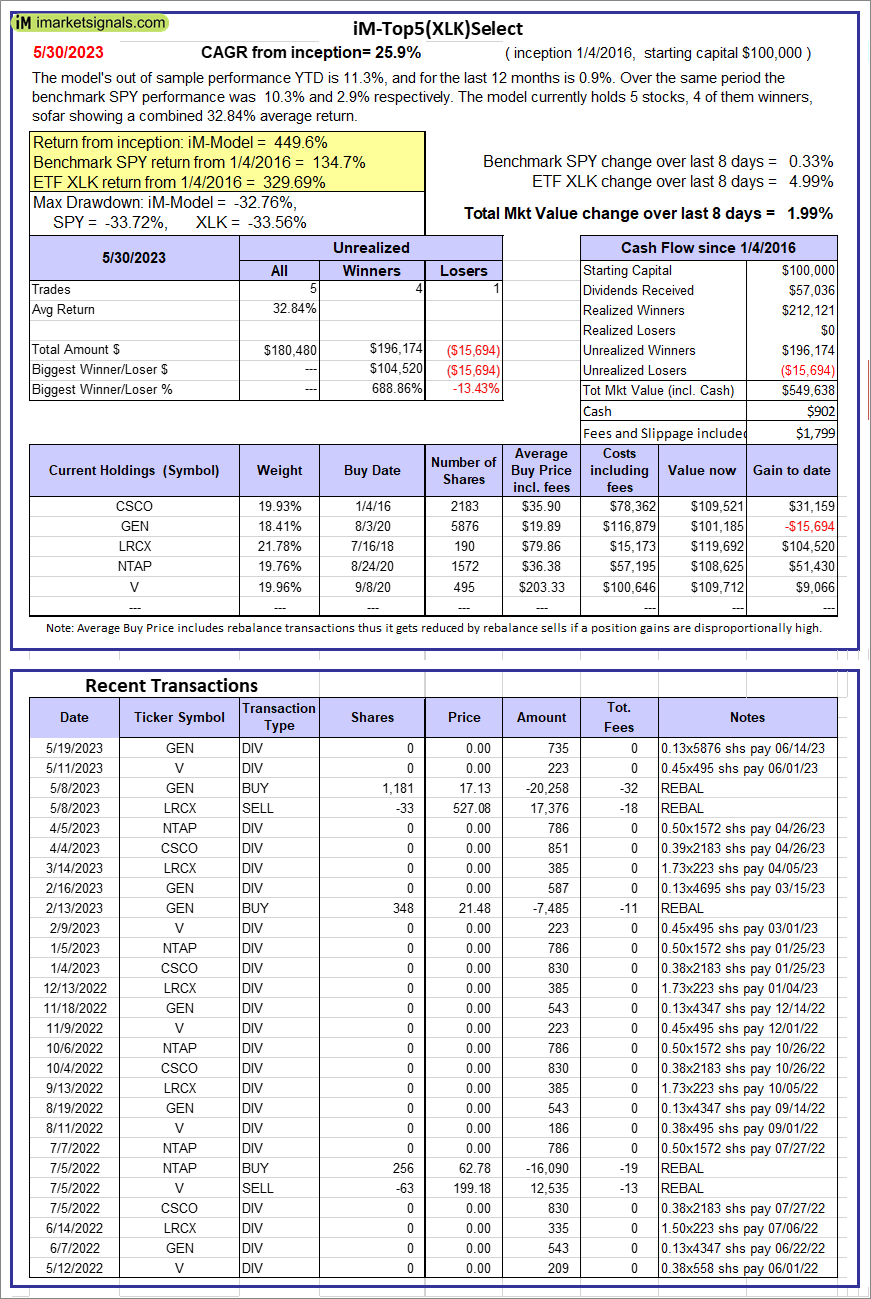 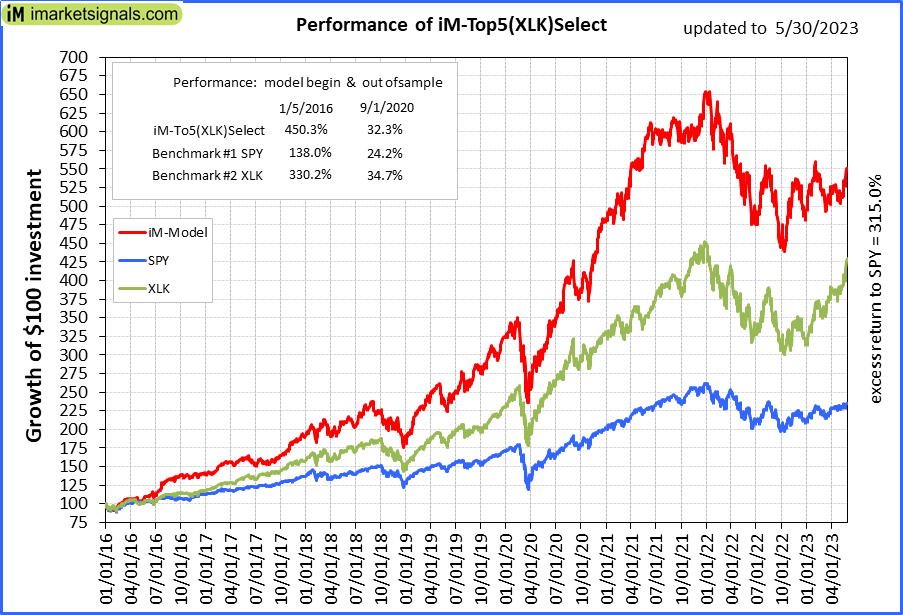 |
iM-Top5(XLK)Select: Since inception, on 1/5/2016, the model gained 449.64% while the benchmark SPY gained 134.65% over the same period. Over the previous week the market value of iM-Top5(XLK)Select gained 1.99% at a time when SPY gained 0.33%. A starting capital of $100,000 at inception on 1/5/2016 would have grown to $549,638 which includes $902 cash and excludes $1,799 spent on fees and slippage. |
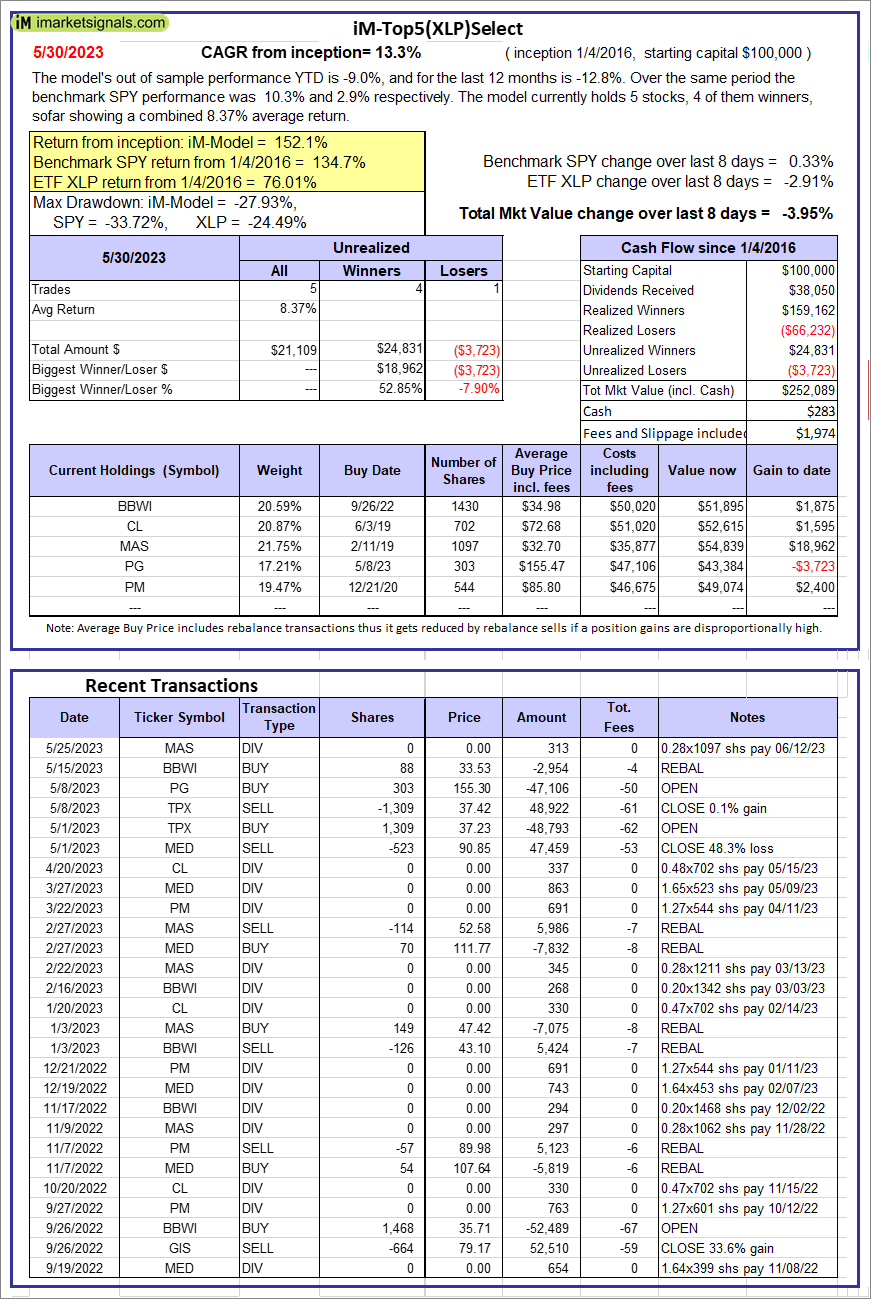 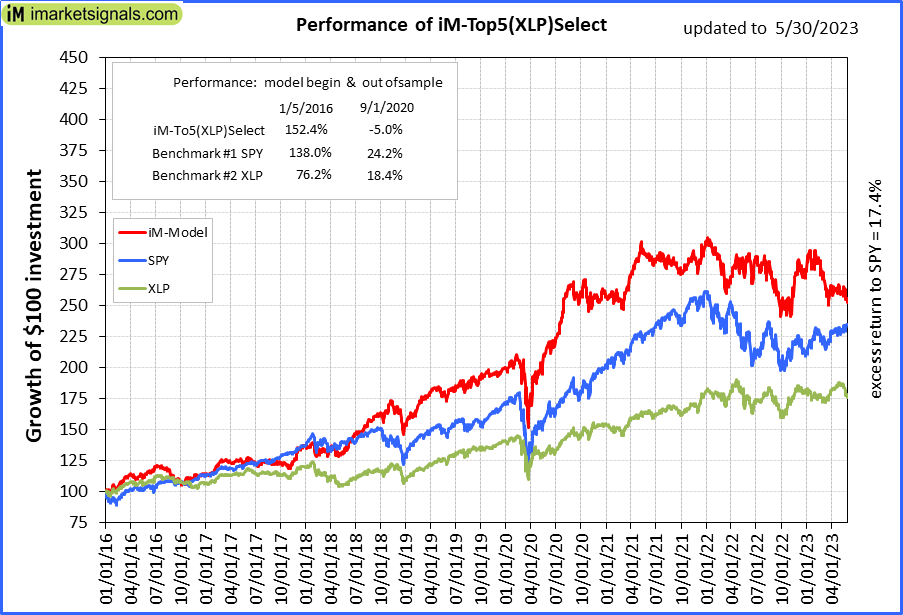 |
iM-Top5(XLP)Select: Since inception, on 1/5/2016, the model gained 152.09% while the benchmark SPY gained 134.65% over the same period. Over the previous week the market value of iM-Top5(XLP)Select gained -3.95% at a time when SPY gained 0.33%. A starting capital of $100,000 at inception on 1/5/2016 would have grown to $252,089 which includes $283 cash and excludes $1,974 spent on fees and slippage. |
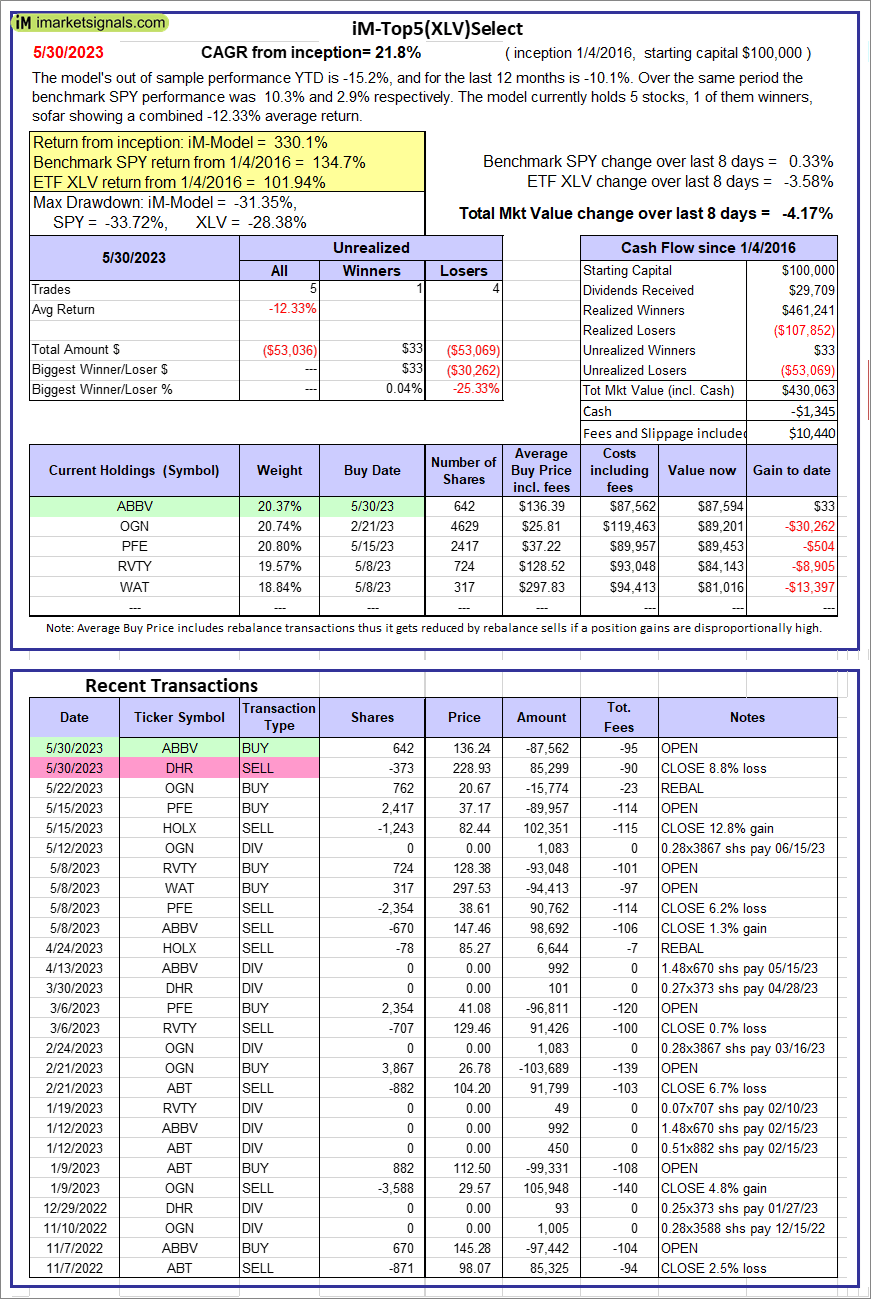 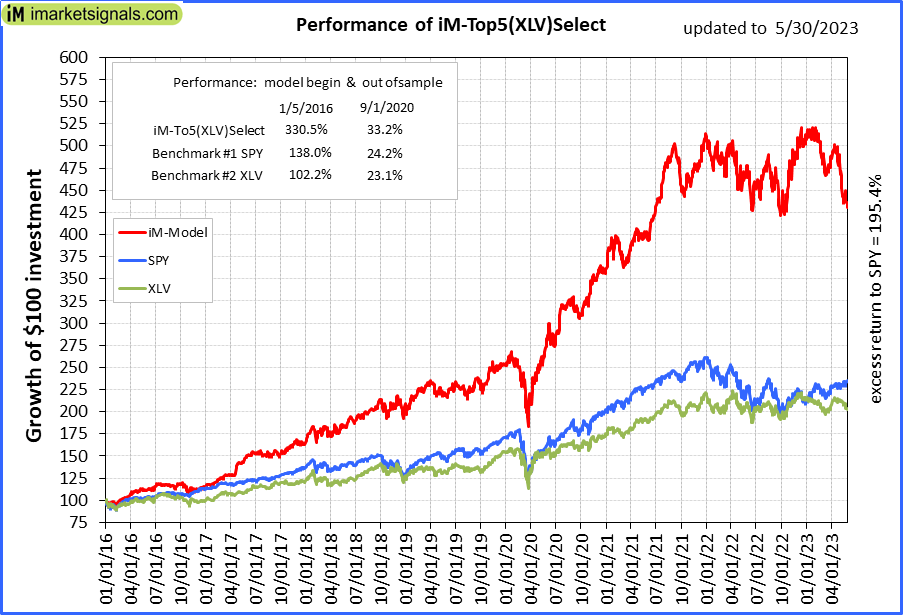 |
iM-Top5(XLV)Select: Since inception, on 1/5/2016, the model gained 330.06% while the benchmark SPY gained 134.65% over the same period. Over the previous week the market value of iM-Top5(XLV)Select gained -4.17% at a time when SPY gained 0.33%. A starting capital of $100,000 at inception on 1/5/2016 would have grown to $430,063 which includes -$1,345 cash and excludes $10,440 spent on fees and slippage. |
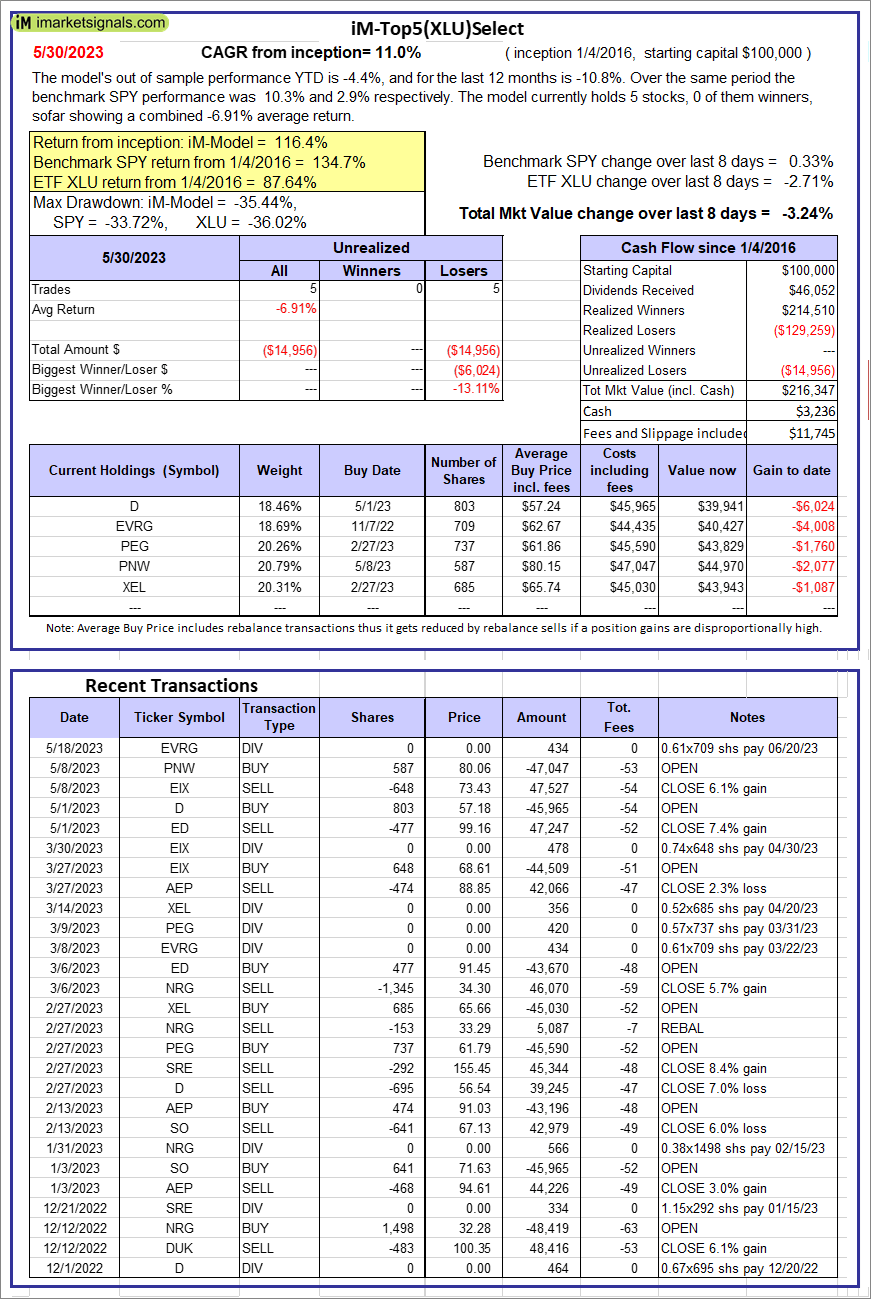 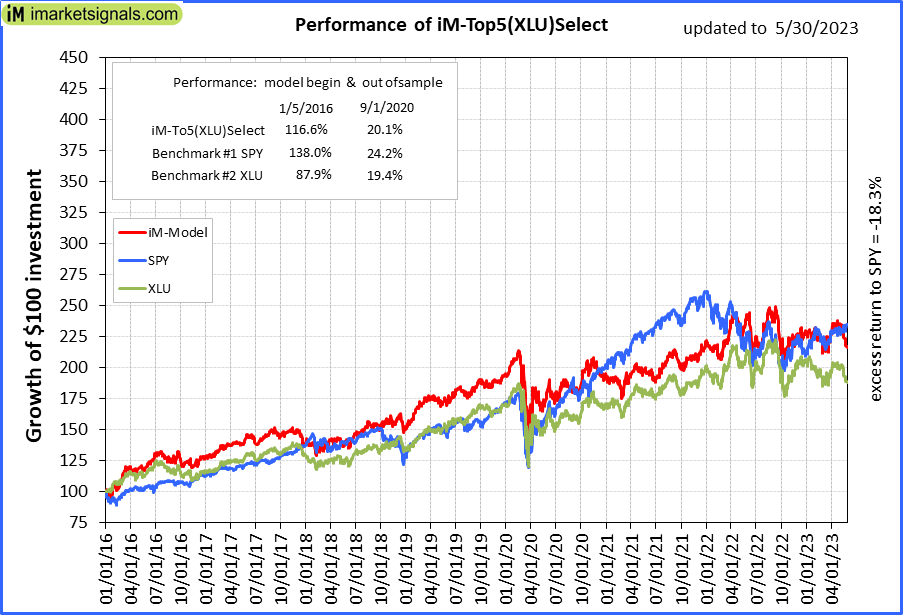 |
iM-Top5(XLU)Select: Since inception, on 1/5/2016, the model gained 116.35% while the benchmark SPY gained 134.65% over the same period. Over the previous week the market value of iM-Top5(XLU)Select gained -3.24% at a time when SPY gained 0.33%. A starting capital of $100,000 at inception on 1/5/2016 would have grown to $216,347 which includes $3,236 cash and excludes $11,745 spent on fees and slippage. |
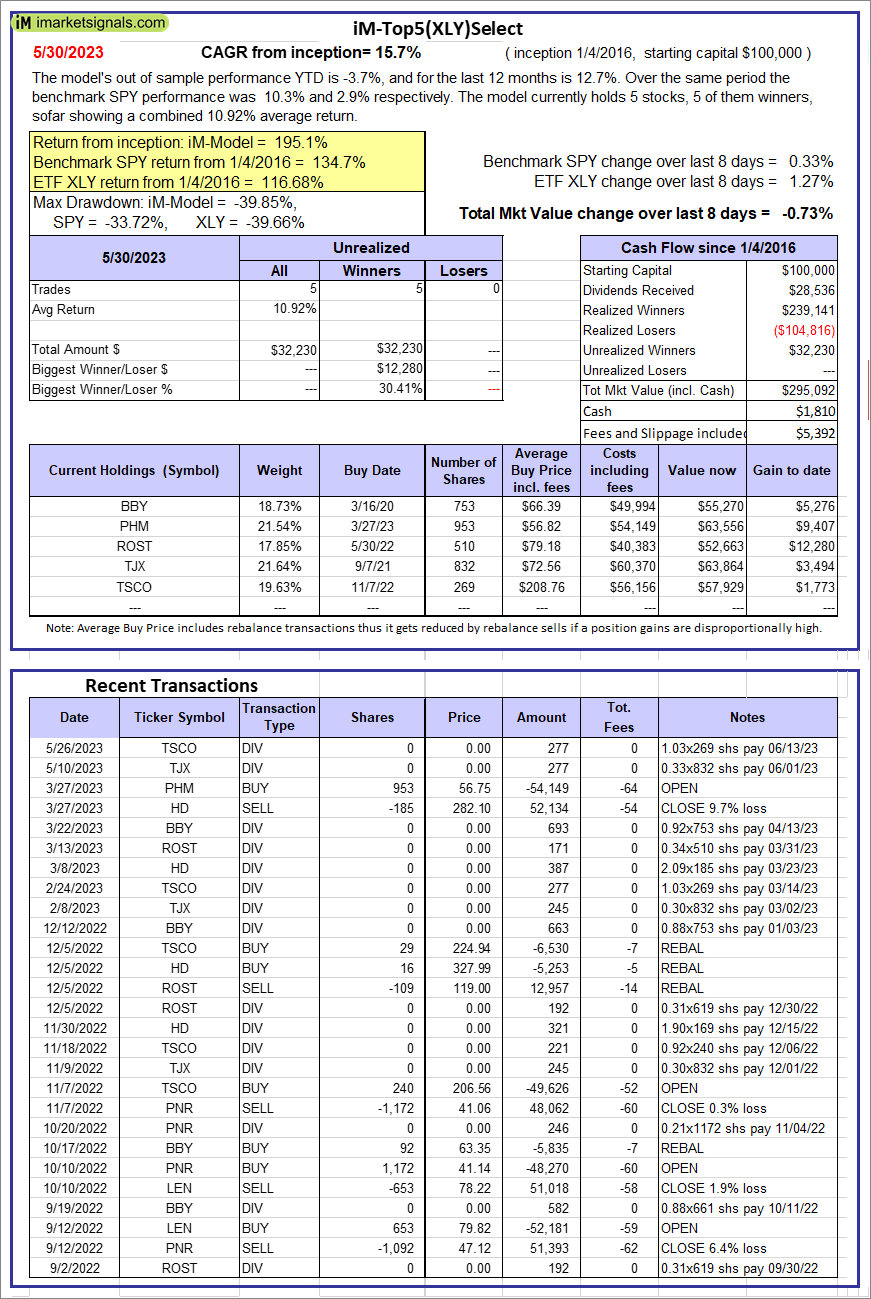 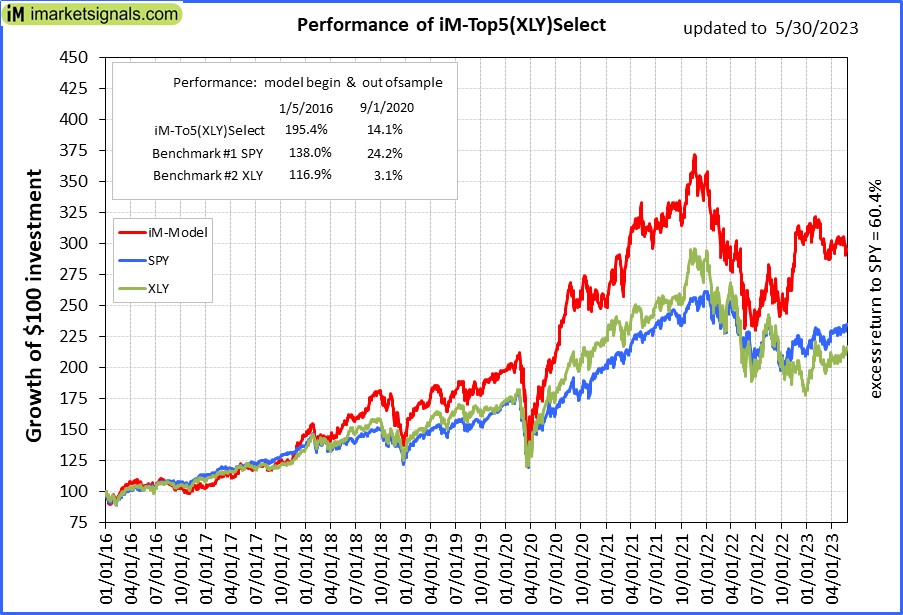 |
iM-Top5(XLY)Select: Since inception, on 1/5/2016, the model gained 195.09% while the benchmark SPY gained 134.65% over the same period. Over the previous week the market value of iM-Top5(XLY)Select gained -0.73% at a time when SPY gained 0.33%. A starting capital of $100,000 at inception on 1/5/2016 would have grown to $295,092 which includes $1,810 cash and excludes $5,392 spent on fees and slippage. |
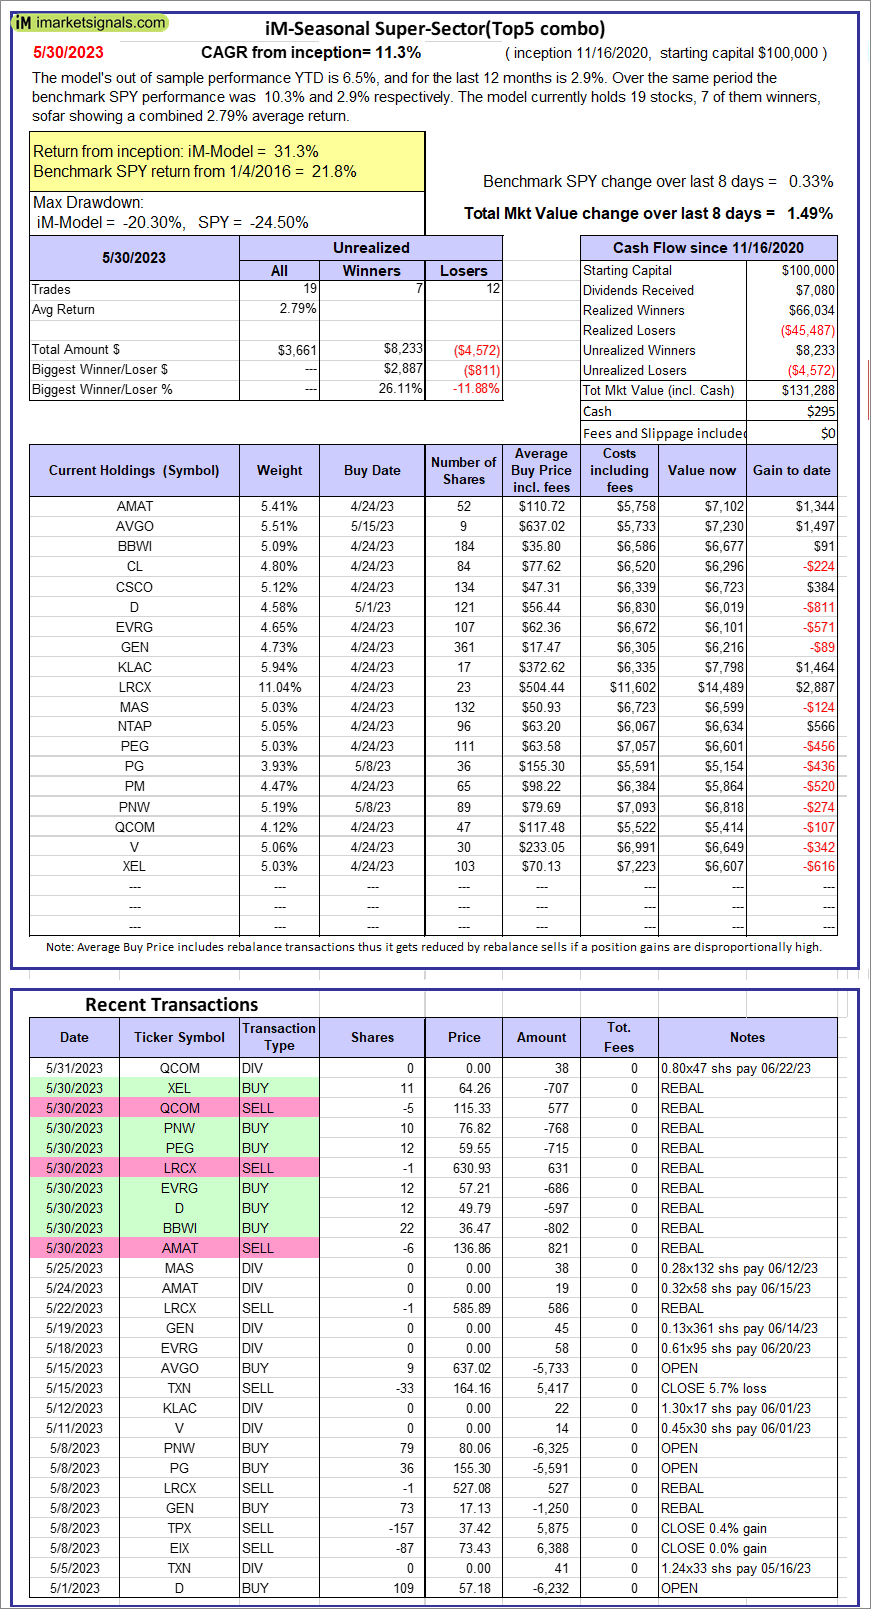 |
iM-Seasonal Super-Sectors (Top5 combo) : Since inception, on 11/17/2020, the model gained 31.29% while the benchmark SPY gained 21.81% over the same period. Over the previous week the market value of iM-Seasonal Super-Sectors (Top5 combo) gained 1.49% at a time when SPY gained 0.33%. A starting capital of $100,000 at inception on 11/17/2020 would have grown to $131,288 which includes $295 cash and excludes $00 spent on fees and slippage. |
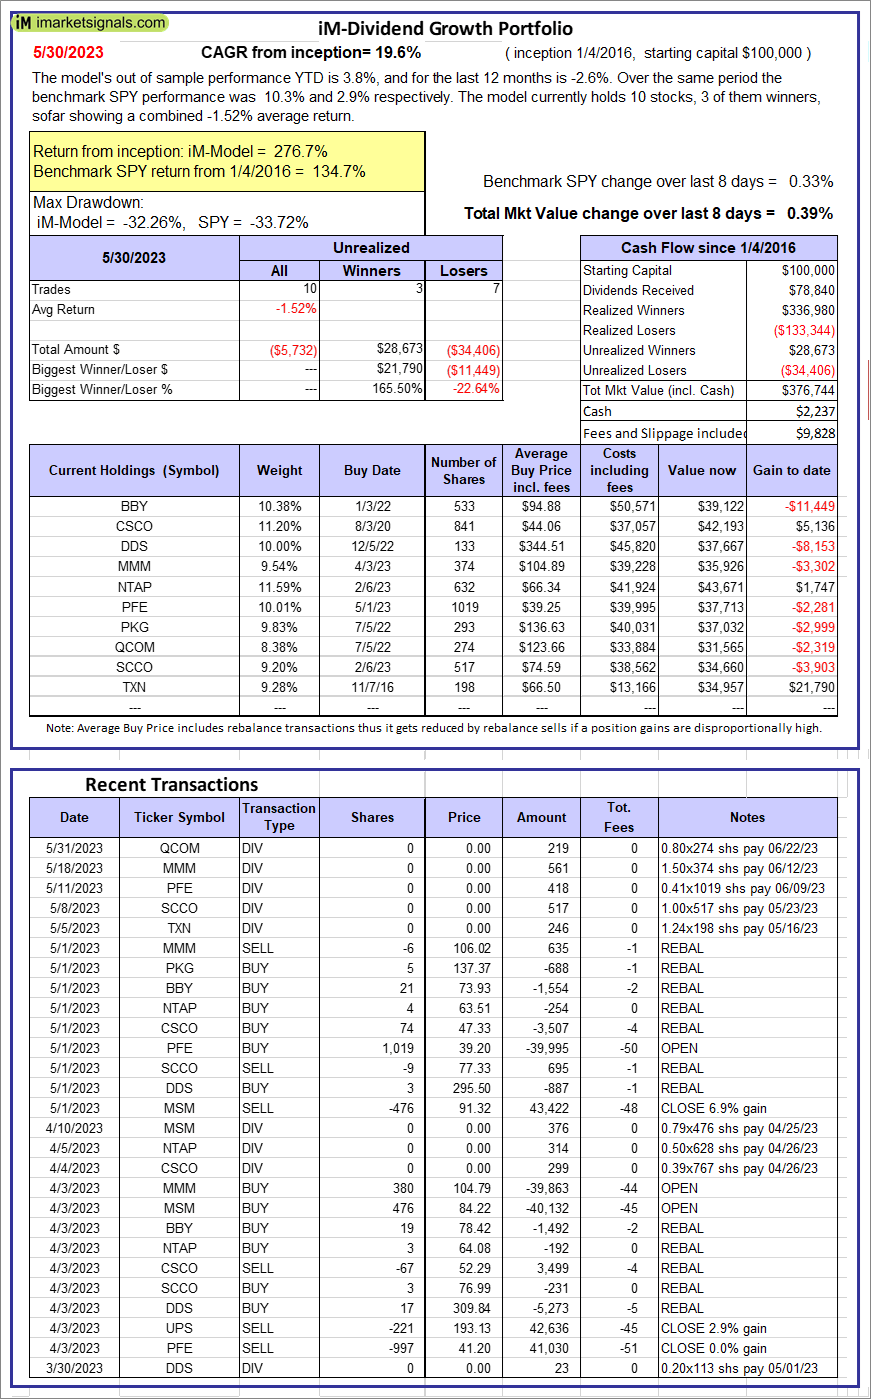 |
iM-Dividend Growth Portfolio: The model’s out of sample performance YTD is 3.8%, and for the last 12 months is -2.6%. Over the same period the benchmark SPY performance was 10.3% and 2.9% respectively. Over the previous week the market value of the iM-Dividend Growth Portfolio gained 0.39% at a time when SPY gained 0.33%. A starting capital of $100,000 at inception on 6/30/2016 would have grown to $376,744 which includes $2,237 cash and excludes $9,828 spent on fees and slippage. |
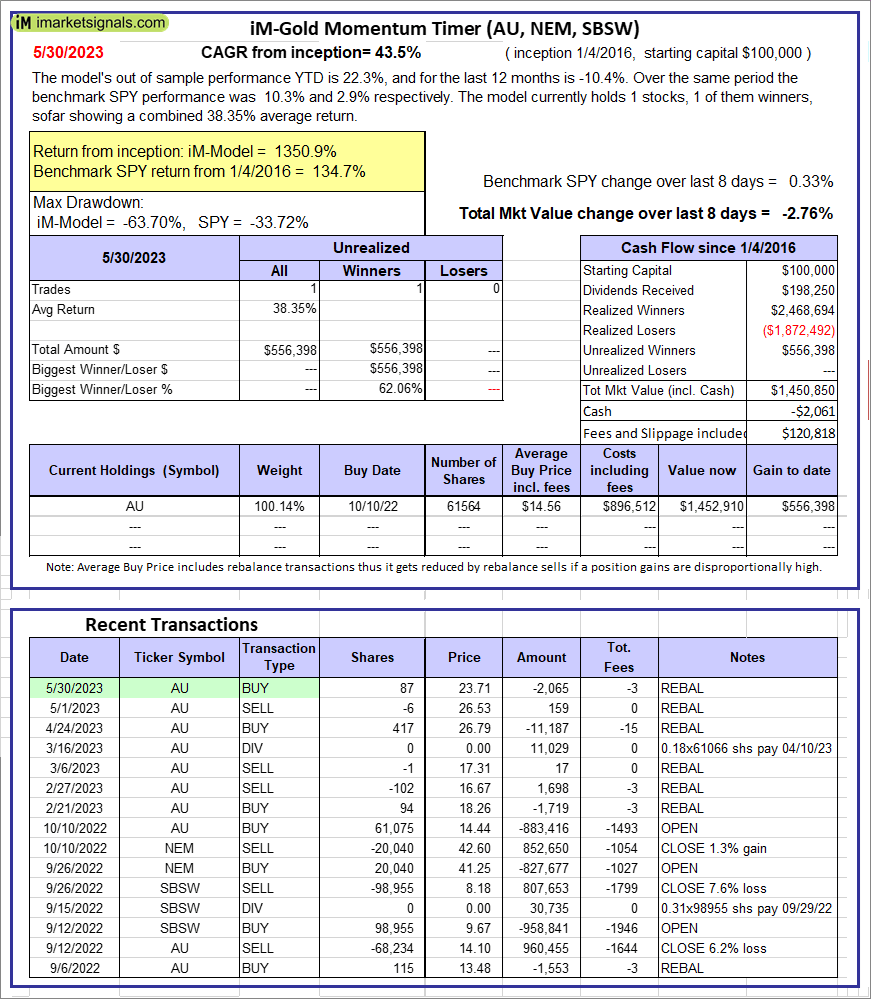 |
iM-Gold Momentum Timer (AU, NEM, SBSW): The model’s out of sample performance YTD is 22.3%, and for the last 12 months is -10.4%. Over the same period the benchmark SPY performance was 10.3% and 2.9% respectively. Over the previous week the market value of iM-Gold Momentum Timer (AU, NEM, SBSW) gained -2.76% at a time when SPY gained 0.33%. A starting capital of $100,000 at inception on 6/30/2016 would have grown to -$2,061 which includes $120,818 cash and excludes Gain to date spent on fees and slippage. |
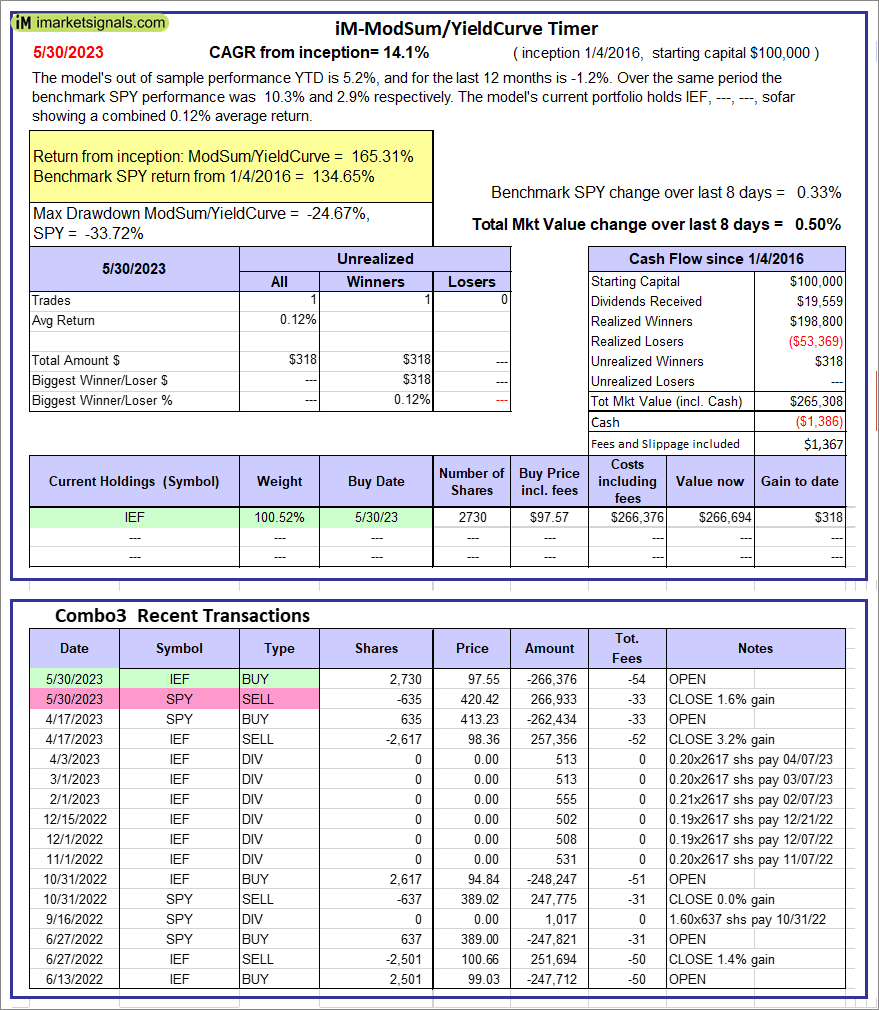 |
iM-ModSum/YieldCurve Timer: The model’s out of sample performance YTD is 5.2%, and for the last 12 months is -1.2%. Over the same period the benchmark SPY performance was 10.3% and 2.9% respectively. Over the previous week the market value of iM-PortSum/YieldCurve Timer gained 0.50% at a time when SPY gained 0.33%. A starting capital of $100,000 at inception on 1/1/2016 would have grown to $265,308 which includes -$1,386 cash and excludes $1,367 spent on fees and slippage. |
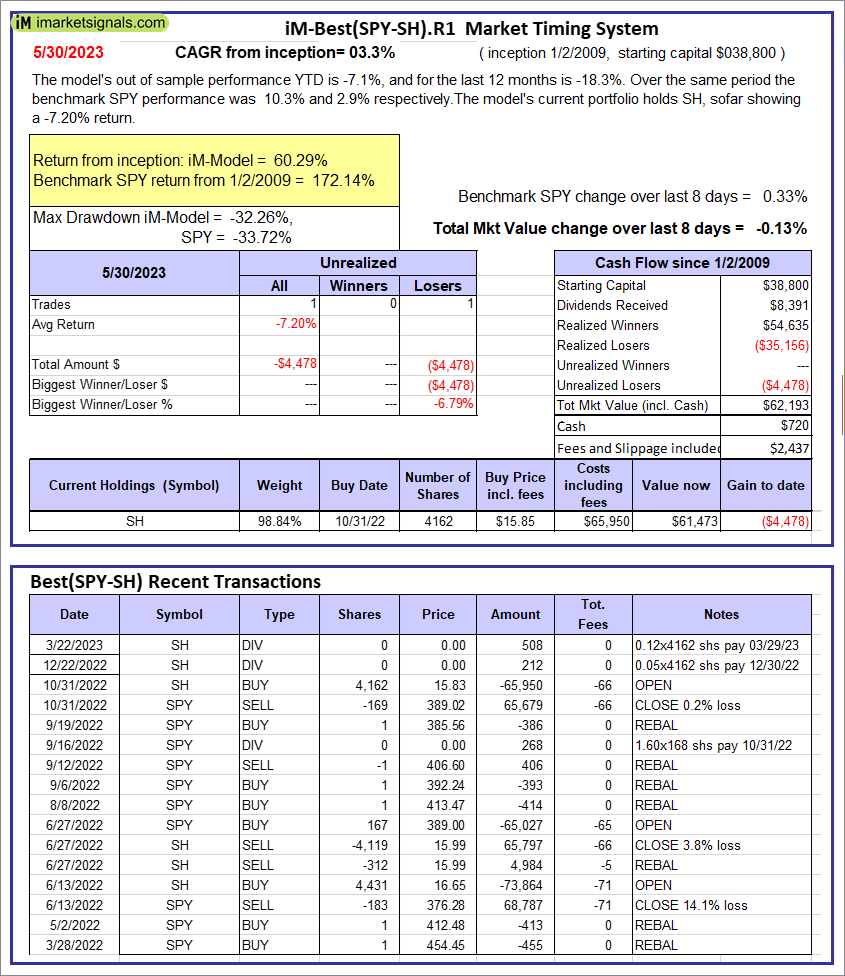 |
iM-Best(SPY-SH).R1: The model’s out of sample performance YTD is -7.1%, and for the last 12 months is -18.3%. Over the same period the benchmark SPY performance was 10.3% and 2.9% respectively. Over the previous week the market value of Best(SPY-SH) gained -0.13% at a time when SPY gained 0.33%. A starting capital of $100,000 at inception on 1/2/2009 would have grown to $62,193 which includes $720 cash and excludes $2,437 spent on fees and slippage. |
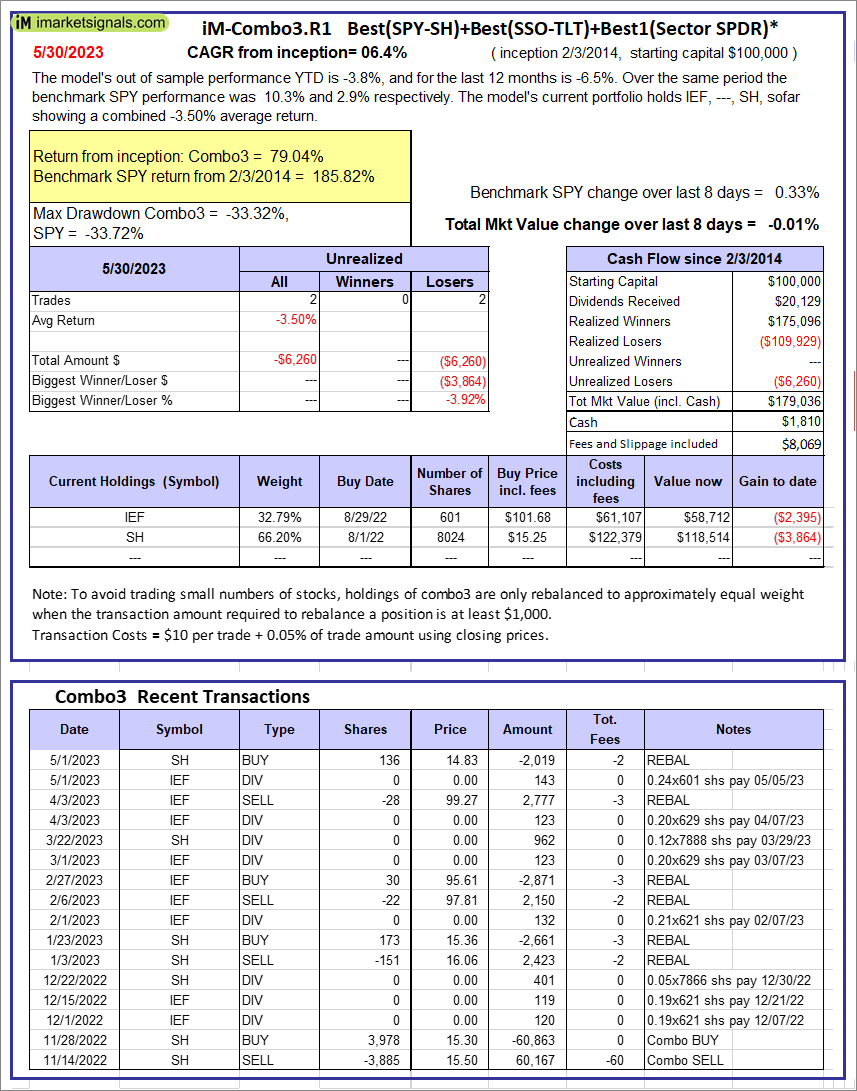 |
iM-Combo3.R1: The model’s out of sample performance YTD is -3.8%, and for the last 12 months is -6.5%. Over the same period the benchmark SPY performance was 10.3% and 2.9% respectively. Over the previous week the market value of iM-Combo3.R1 gained -0.01% at a time when SPY gained 0.33%. A starting capital of $100,000 at inception on 2/3/2014 would have grown to $179,036 which includes $1,810 cash and excludes $8,069 spent on fees and slippage. |
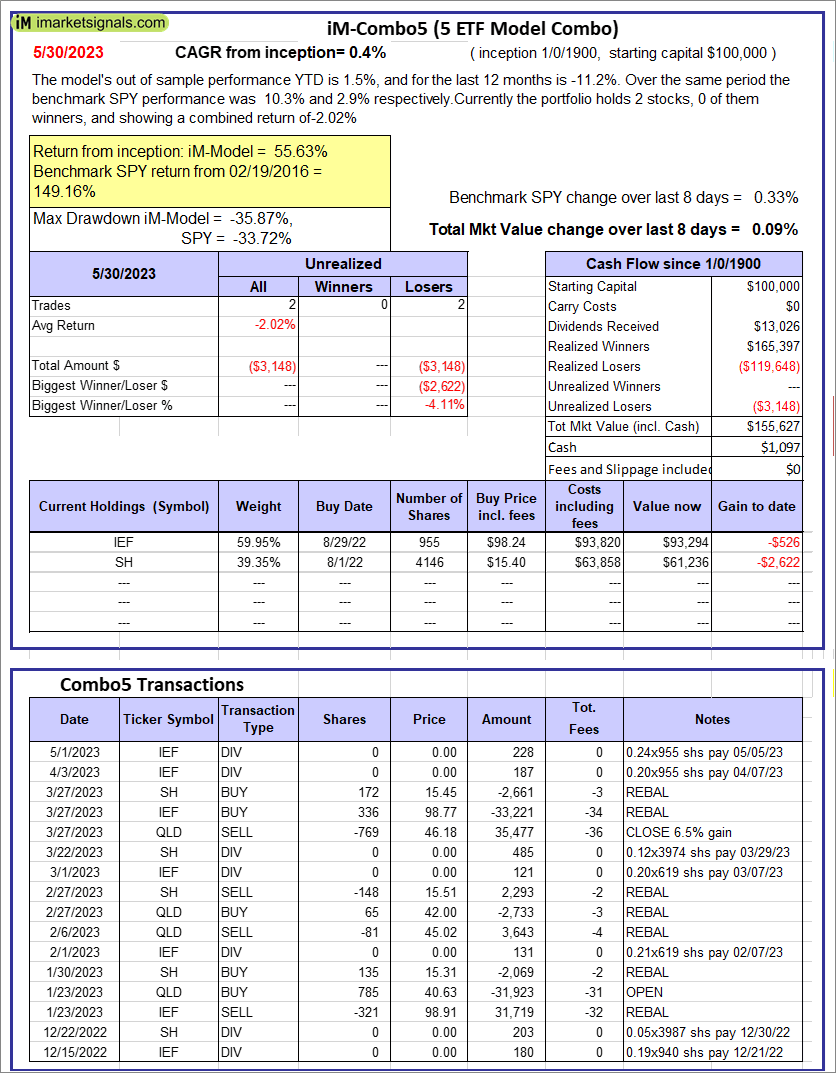 |
iM-Combo5: The model’s out of sample performance YTD is 1.5%, and for the last 12 months is -11.2%. Over the same period the benchmark SPY performance was 10.3% and 2.9% respectively. Over the previous week the market value of iM-Combo5 gained 0.09% at a time when SPY gained 0.33%. A starting capital of $100,000 at inception on 2/22/2016 would have grown to $155,627 which includes $1,097 cash and excludes $0 spent on fees and slippage. |
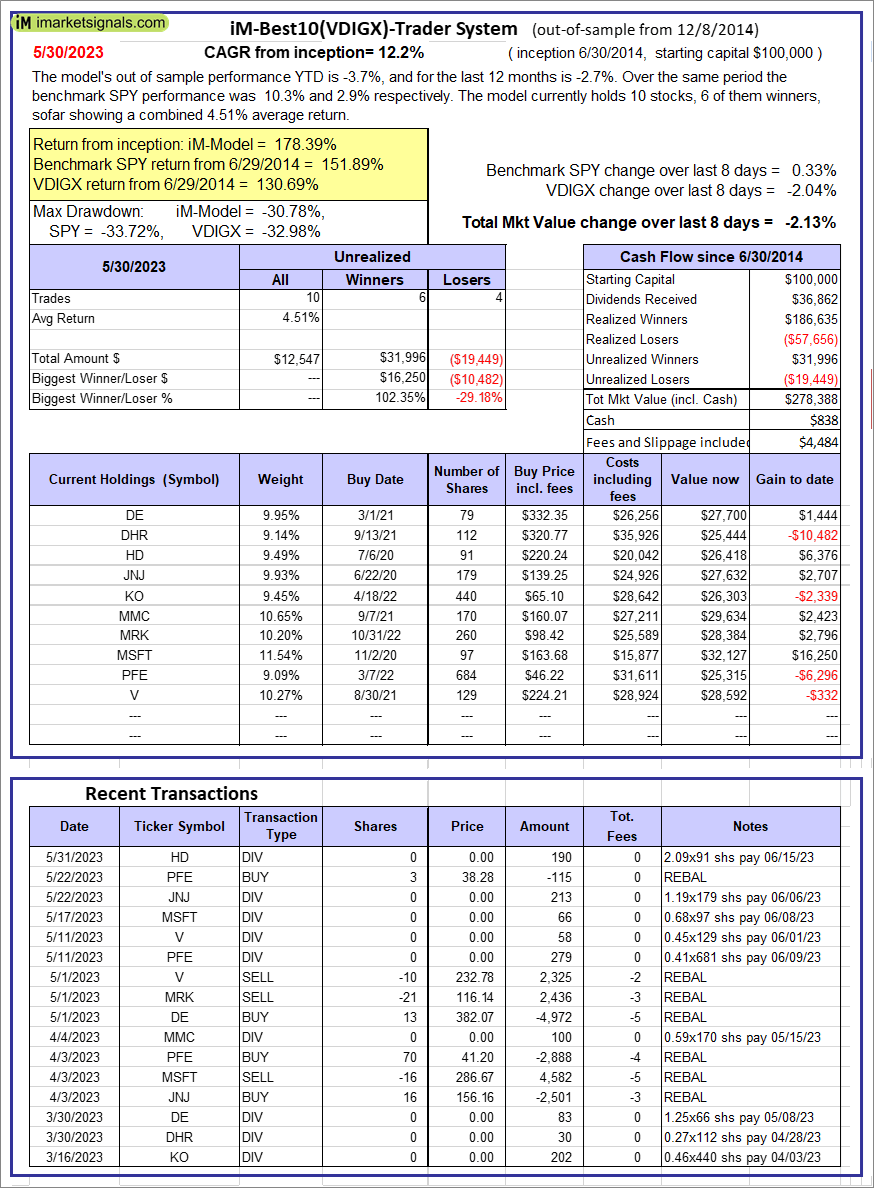 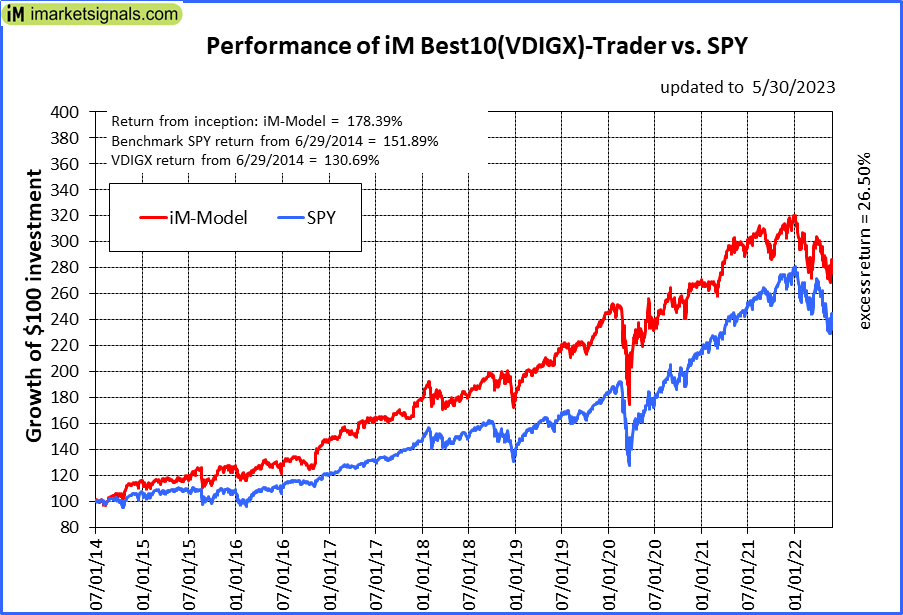 |
iM-Best10(VDIGX)-Trader: The model’s out of sample performance YTD is -3.7%, and for the last 12 months is -2.7%. Over the same period the benchmark SPY performance was 10.3% and 2.9% respectively. Since inception, on 7/1/2014, the model gained 178.39% while the benchmark SPY gained 151.89% and VDIGX gained 130.69% over the same period. Over the previous week the market value of iM-Best10(VDIGX) gained -2.13% at a time when SPY gained 0.33%. A starting capital of $100,000 at inception on 7/1/2014 would have grown to $278,388 which includes $838 cash and excludes $4,484 spent on fees and slippage. |
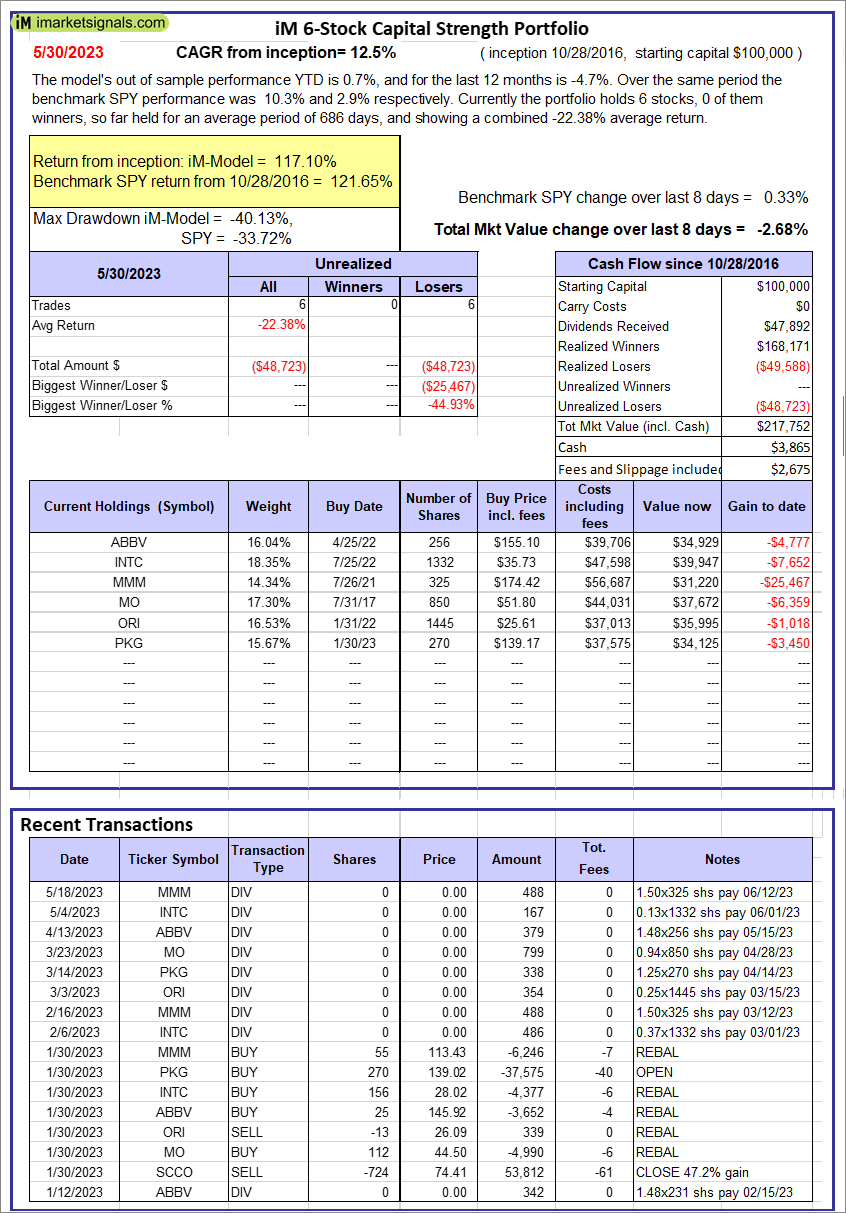 |
iM 6-Stock Capital Strength Portfolio: The model’s out of sample performance YTD is 0.7%, and for the last 12 months is -4.7%. Over the same period the benchmark SPY performance was 10.3% and 2.9% respectively. Over the previous week the market value of the iM 6-Stock Capital Strength Portfolio gained -2.68% at a time when SPY gained 0.33%. A starting capital of $100,000 at inception on 10/28/2016 would have grown to $217,752 which includes $3,865 cash and excludes $2,675 spent on fees and slippage. |
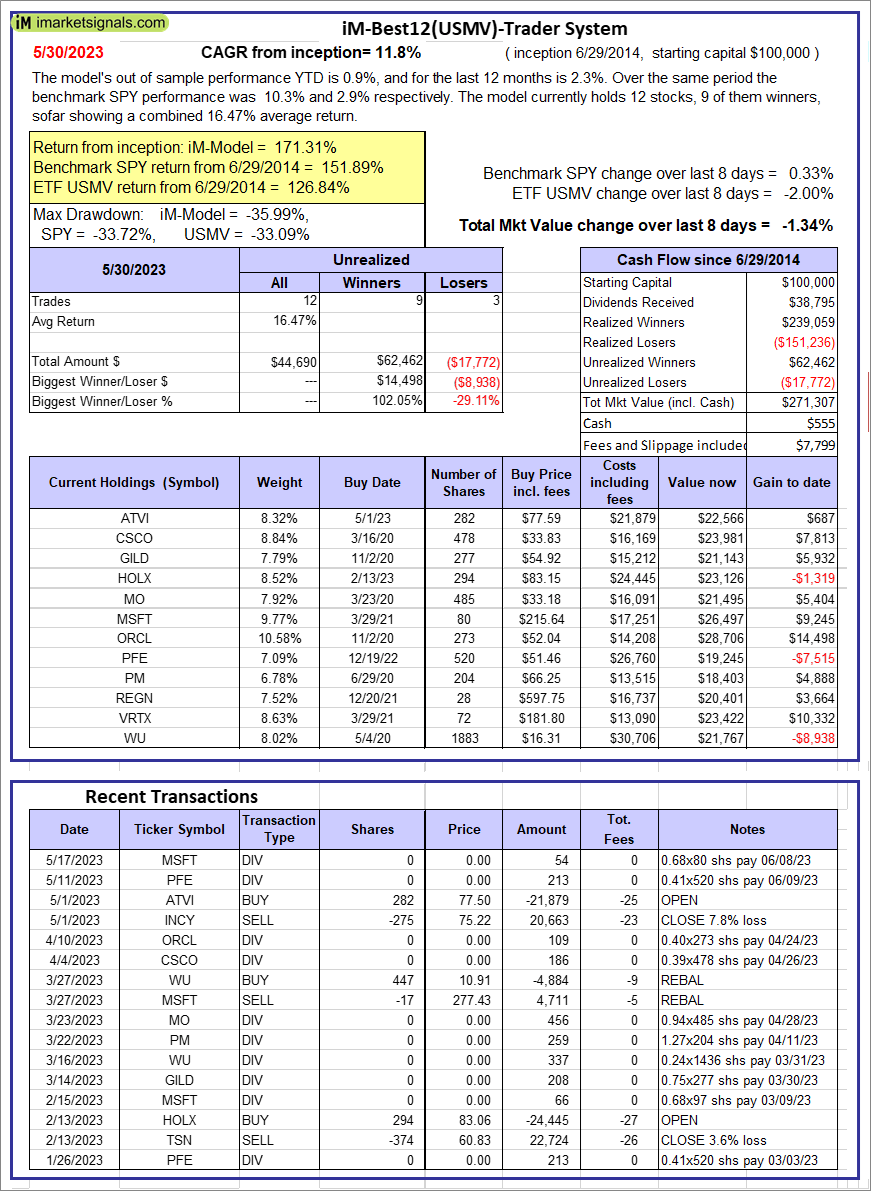 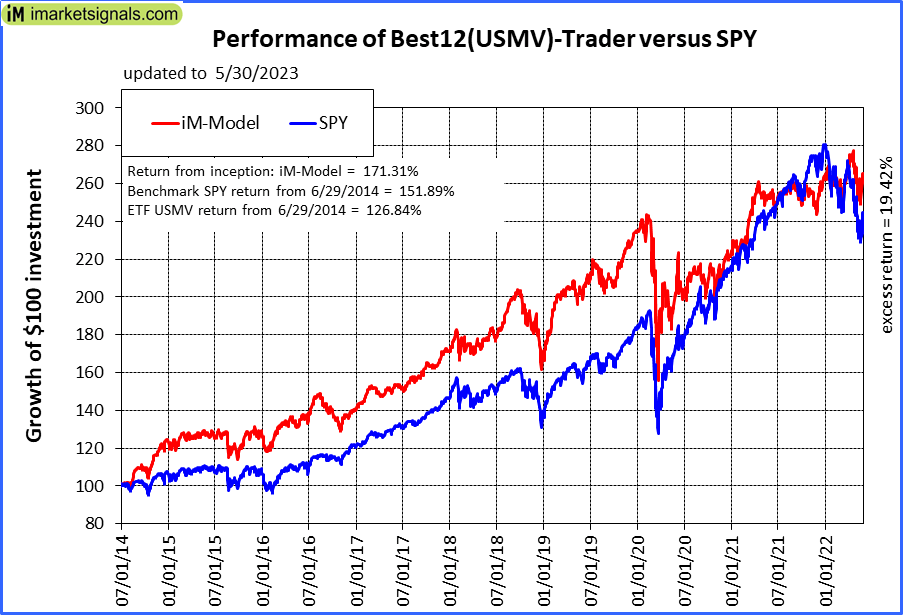 |
iM-Best12(USMV)-Trader: The model’s out of sample performance YTD is 0.9%, and for the last 12 months is 2.3%. Over the same period the benchmark SPY performance was 10.3% and 2.9% respectively. Since inception, on 6/30/2014, the model gained 171.31% while the benchmark SPY gained 151.89% and the ETF USMV gained 126.84% over the same period. Over the previous week the market value of iM-Best12(USMV)-Trader gained -1.34% at a time when SPY gained 0.33%. A starting capital of $100,000 at inception on 6/30/2014 would have grown to $271,307 which includes $555 cash and excludes $7,799 spent on fees and slippage. |
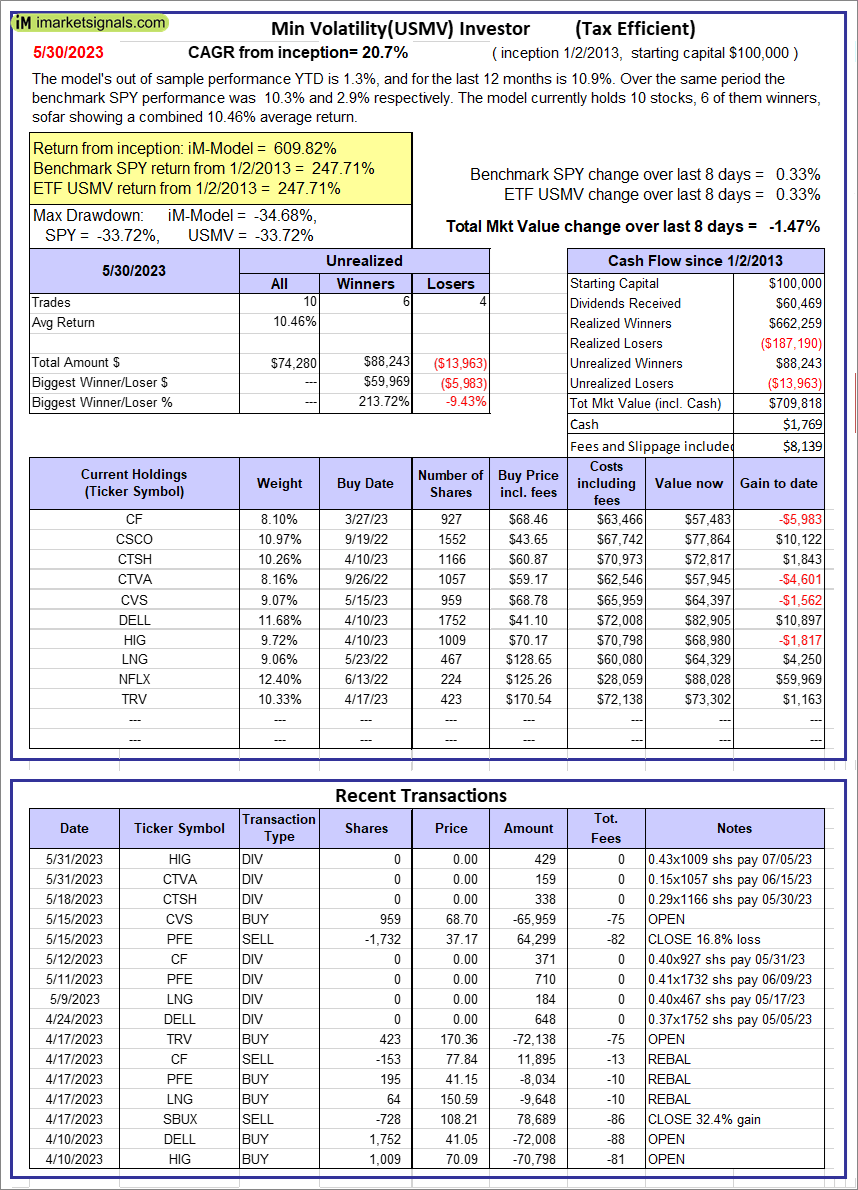 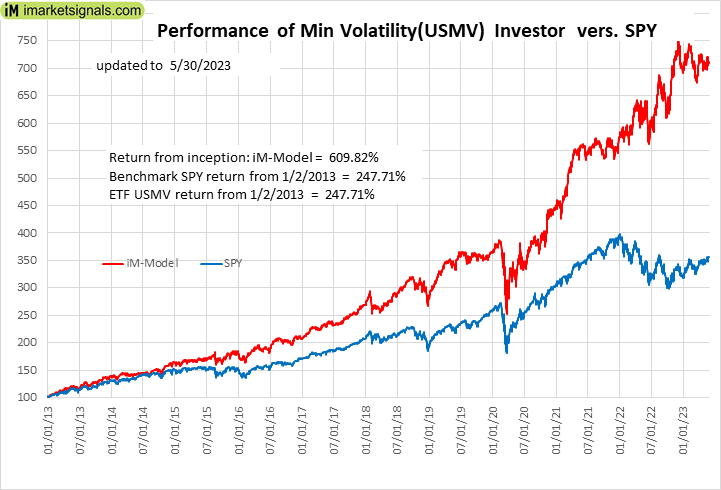 |
iM-Min Volatility(USMV) Investor (Tax Efficient): The model’s out of sample performance YTD is 1.3%, and for the last 12 months is 10.9%. Over the same period the benchmark SPY performance was 10.3% and 2.9% respectively. Since inception, on 1/3/2013, the model gained 609.82% while the benchmark SPY gained 247.71% and the ETF USMV gained 247.71% over the same period. Over the previous week the market value of iM-Best12(USMV)Q1 gained -1.47% at a time when SPY gained 0.33%. A starting capital of $100,000 at inception on 1/3/2013 would have grown to $709,818 which includes $1,769 cash and excludes $8,139 spent on fees and slippage. |
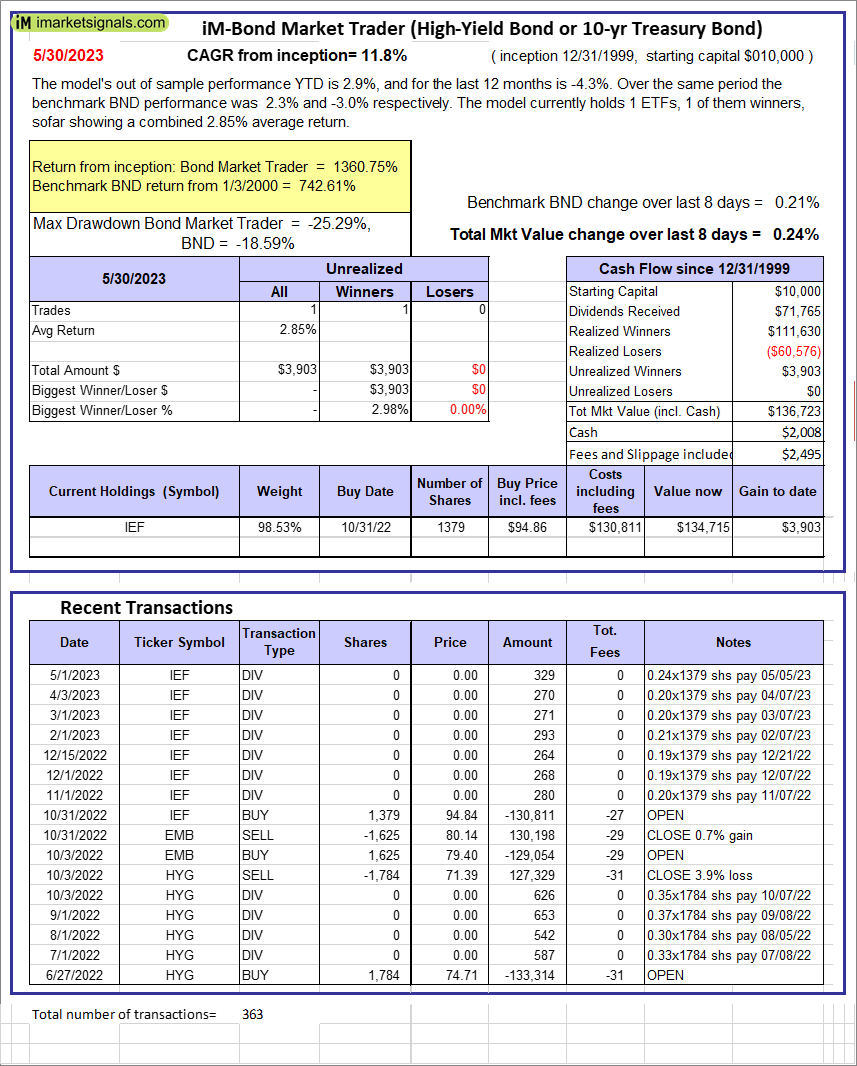 |
iM-Bond Market Trader (High-Yield Bond or 10-yr Treasury Bond): The model’s out of sample performance YTD is 2.9%, and for the last 12 months is -4.3%. Over the same period the benchmark BND performance was 2.3% and -3.0% respectively. Over the previous week the market value of the iM-Bond Market Trader (High-Yield Bond or 10-yr Treasury Bond) gained 0.24% at a time when BND gained 0.21%. A starting capital of $10,000 at inception on 1/3/2000 would have grown to $136,723 which includes $2,008 cash and excludes $2,495 spent on fees and slippage. |
|
|
iM-ModSum/YieldCurve Timer: The model’s out of sample performance YTD is 5.2%, and for the last 12 months is -1.2%. Over the same period the benchmark SPY performance was 10.3% and 2.9% respectively. Over the previous week the market value of iM-PortSum/YieldCurve Timer gained 0.50% at a time when SPY gained 0.33%. A starting capital of $100,000 at inception on 1/1/2016 would have grown to $265,308 which includes -$1,386 cash and excludes $1,367 spent on fees and slippage. |
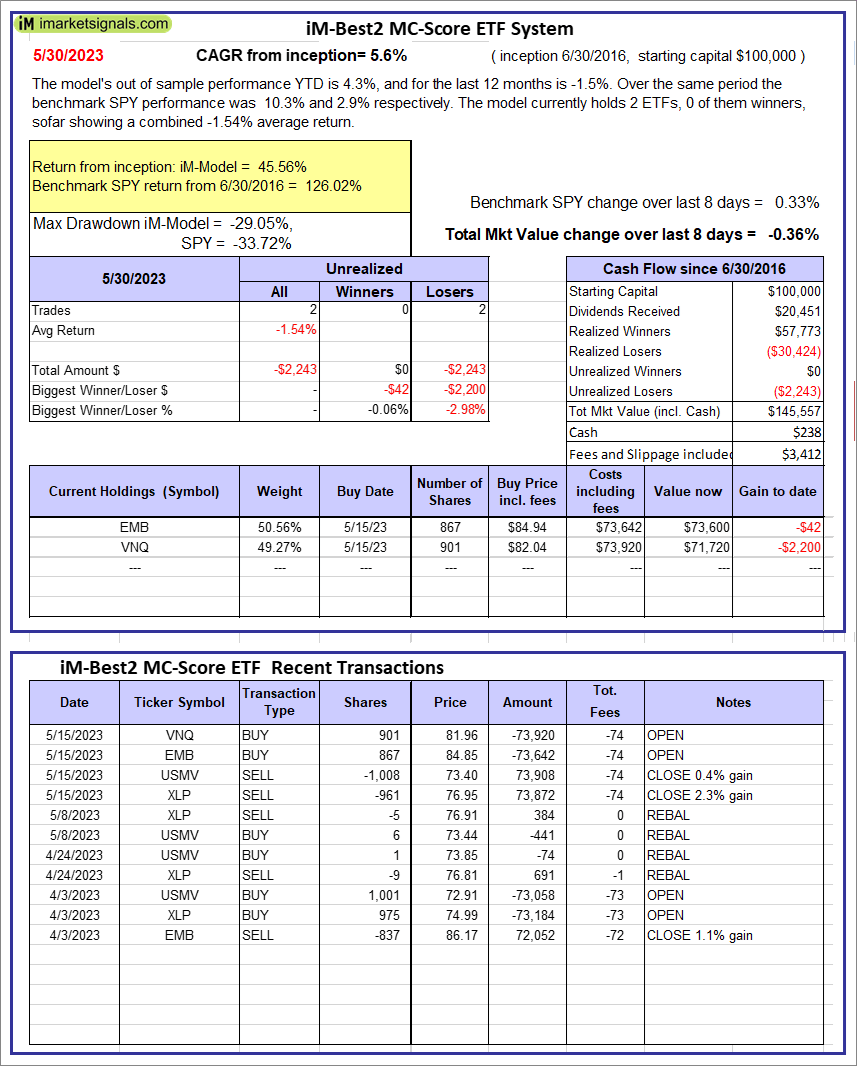 |
iM-Best2 MC-Score ETF System: The model’s out of sample performance YTD is 4.3%, and for the last 12 months is -1.5%. Over the same period the benchmark SPY performance was 10.3% and 2.9% respectively. Over the previous week the market value of the iM-Best2 MC-Score ETF System gained -0.36% at a time when SPY gained 0.33%. A starting capital of $100,000 at inception on 6/30/2016 would have grown to $145,557 which includes $238 cash and excludes $3,412 spent on fees and slippage. |
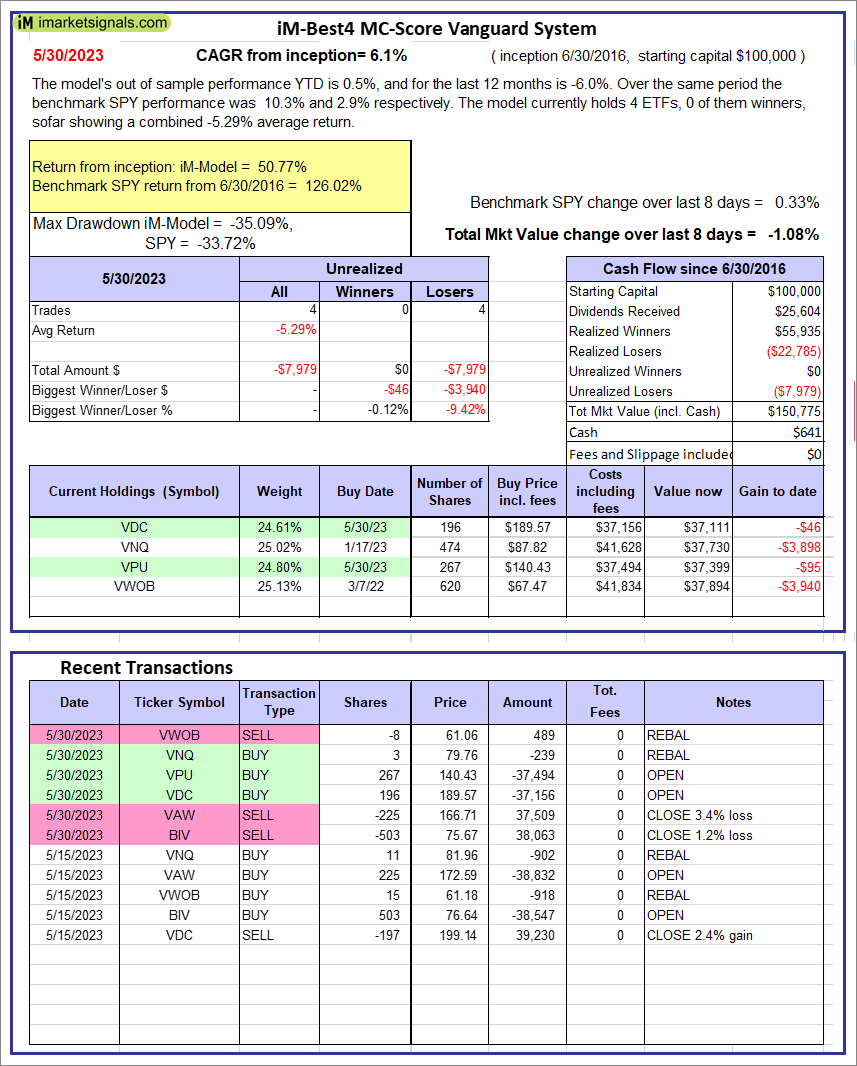 |
iM-Best4 MC-Score Vanguard System: The model’s out of sample performance YTD is 0.5%, and for the last 12 months is -6.0%. Over the same period the benchmark SPY performance was 10.3% and 2.9% respectively. Over the previous week the market value of the iM-Best4 MC-Score Vanguard System gained -1.08% at a time when SPY gained 0.33%. A starting capital of $100,000 at inception on 6/30/2016 would have grown to $150,775 which includes $641 cash and excludes $00 spent on fees and slippage. |
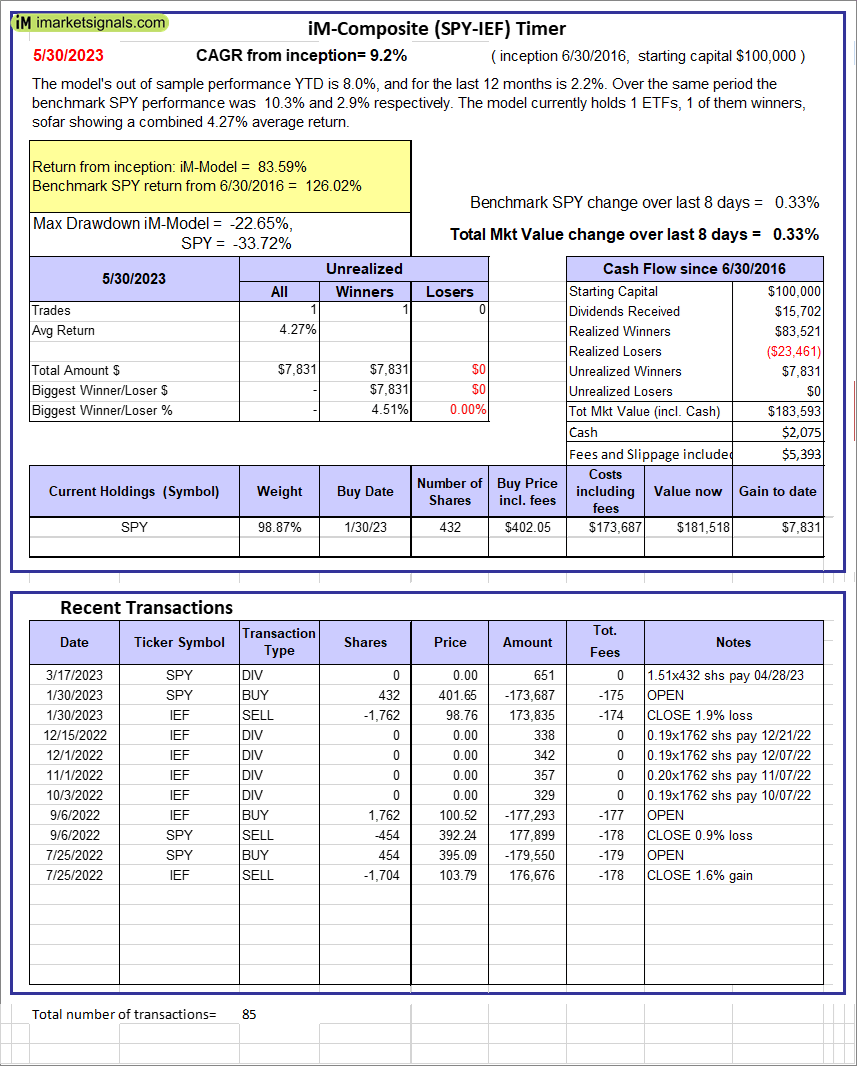 |
iM-Composite (SPY-IEF) Timer: The model’s out of sample performance YTD is 8.0%, and for the last 12 months is 2.2%. Over the same period the benchmark SPY performance was 10.3% and 2.9% respectively. Over the previous week the market value of the iM-Composite (SPY-IEF) Timer gained 0.33% at a time when SPY gained 0.33%. A starting capital of $100,000 at inception on 6/30/2016 would have grown to $183,593 which includes $2,075 cash and excludes $5,393 spent on fees and slippage. |
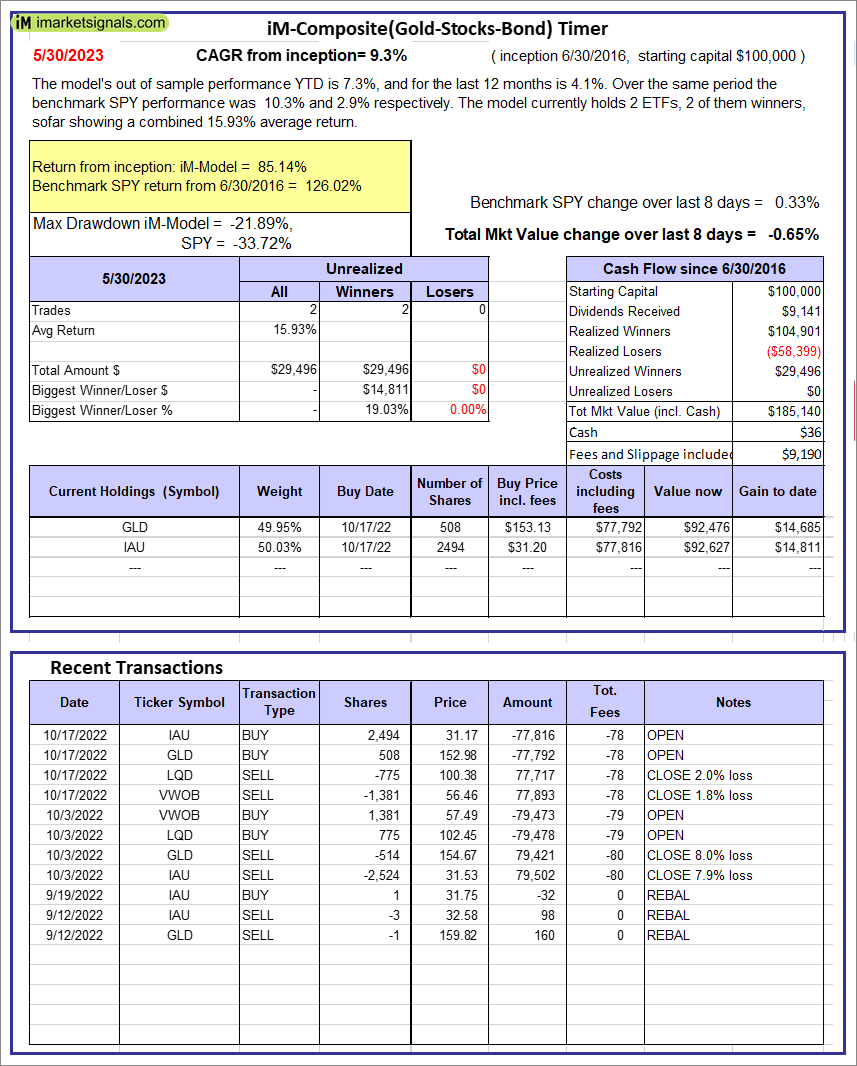 |
iM-Composite(Gold-Stocks-Bond) Timer: The model’s out of sample performance YTD is 7.3%, and for the last 12 months is 4.1%. Over the same period the benchmark SPY performance was 10.3% and 2.9% respectively. Over the previous week the market value of the iM-Composite(Gold-Stocks-Bond) Timer gained -0.65% at a time when SPY gained 0.33%. A starting capital of $100,000 at inception on 6/30/2016 would have grown to $185,140 which includes $36 cash and excludes $9,190 spent on fees and slippage. |
iM-Best Reports – 5/30/2023
Posted in pmp SPY-SH
Leave a Reply
You must be logged in to post a comment.