
  |
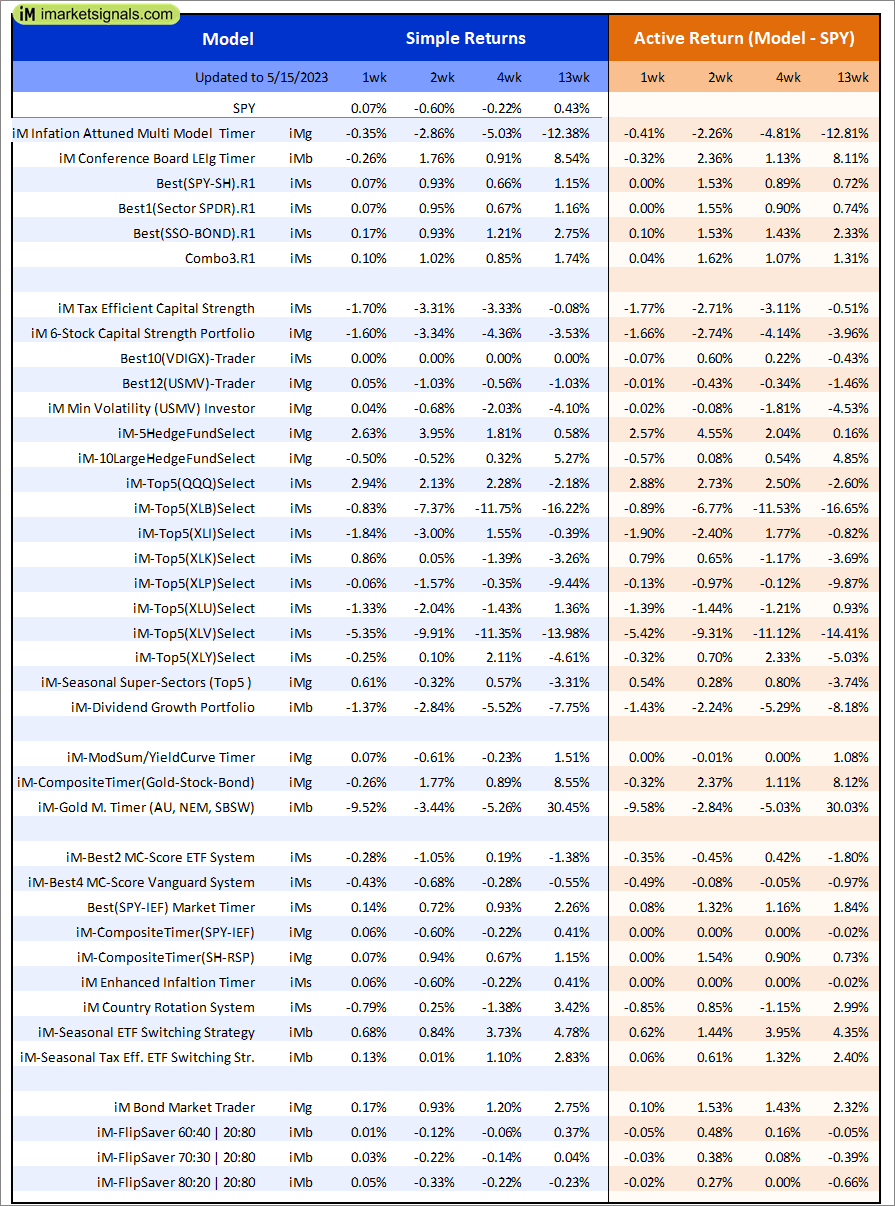
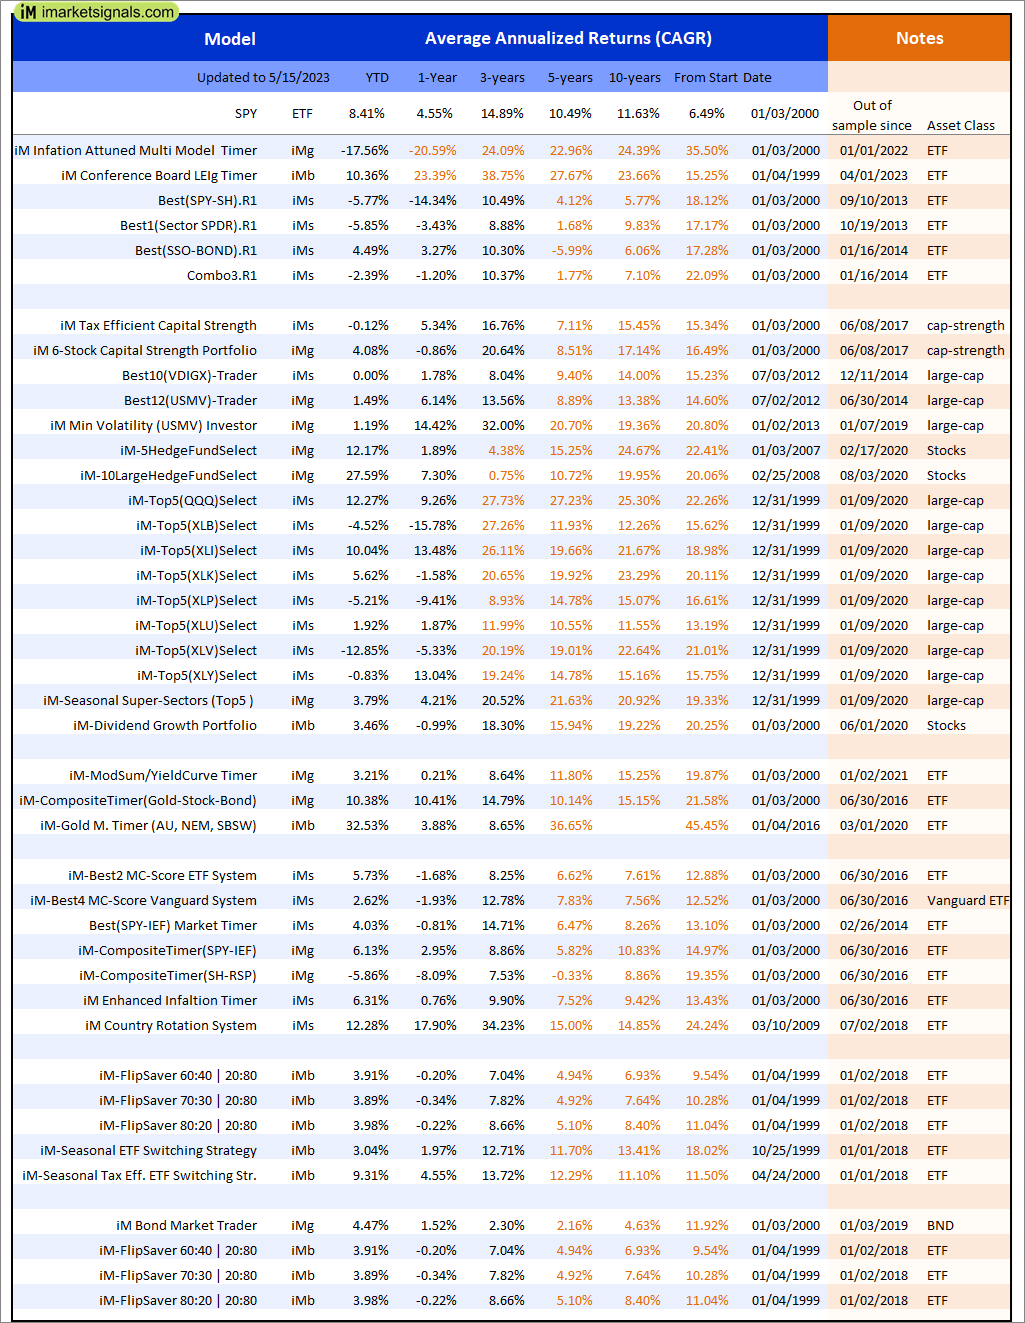
Out of sample performance summary of our models for the past 1, 2, 4 and 13 week periods. The active active return indicates how the models over- or underperformed the benchmark ETF SPY. Also the YTD, and the 1-, 3-, 5- and 10-year annualized returns are shown in the second table |
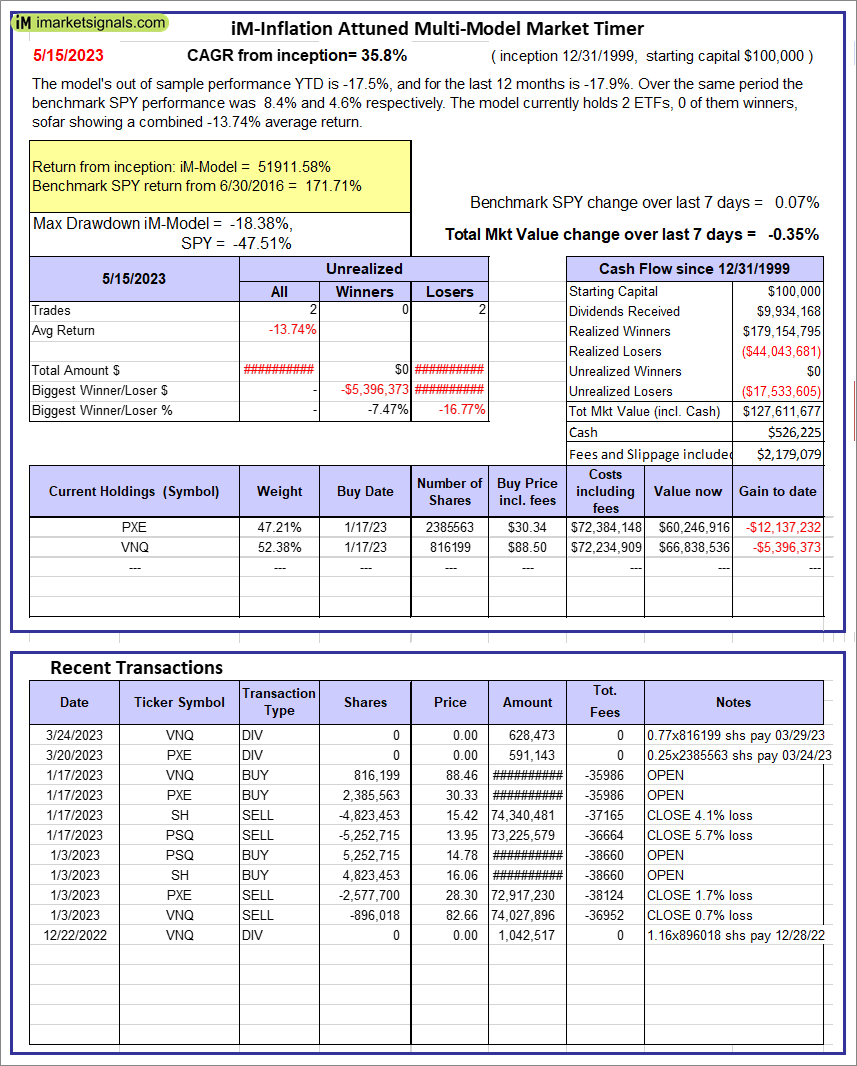 |
iM-Inflation Attuned Multi-Model Market Timer: The model’s out of sample performance YTD is -17.5%, and for the last 12 months is -17.9%. Over the same period the benchmark SPY performance was 8.4% and 4.6% respectively. Over the previous week the market value of the iM-Inflation Attuned Multi-Model Market Timer gained -0.35% at a time when SPY gained 0.07%. A starting capital of $100,000 at inception on 3/24/2017 would have grown to $127,611,677 which includes $526,225 cash and excludes $2,179,079 spent on fees and slippage. |
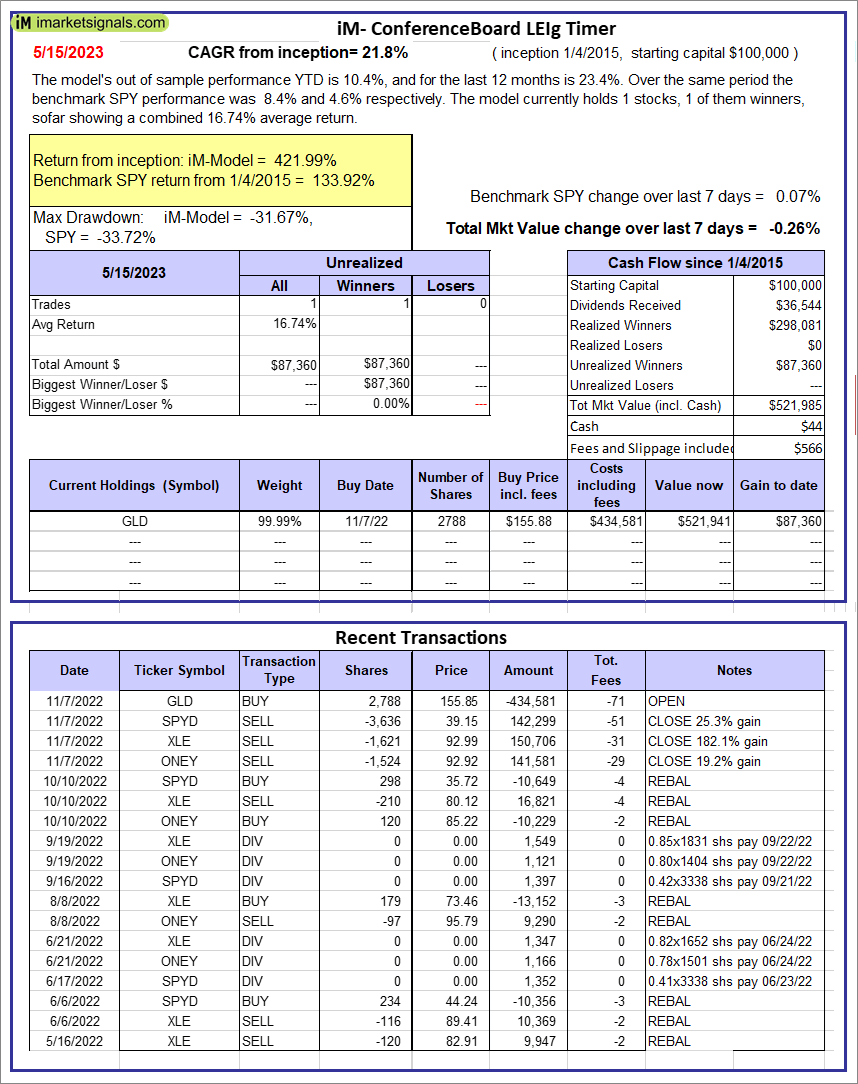 |
iM-Conference Board LEIg Timer: The model’s performance YTD is 14.3%, and for the last 12 months is 7.3%. Over the same period the benchmark SPY performance was 20.1% and 9.4% respectively. Over the previous week the market value of the iM-Conference Board LEIg Timer gained -0.26% at a time when SPY gained 0.07%. A starting capital of $100,000 at inception on 4/5/2017 would have grown to $521,985 which includes $44 cash and excludes $566 spent on fees and slippage. |
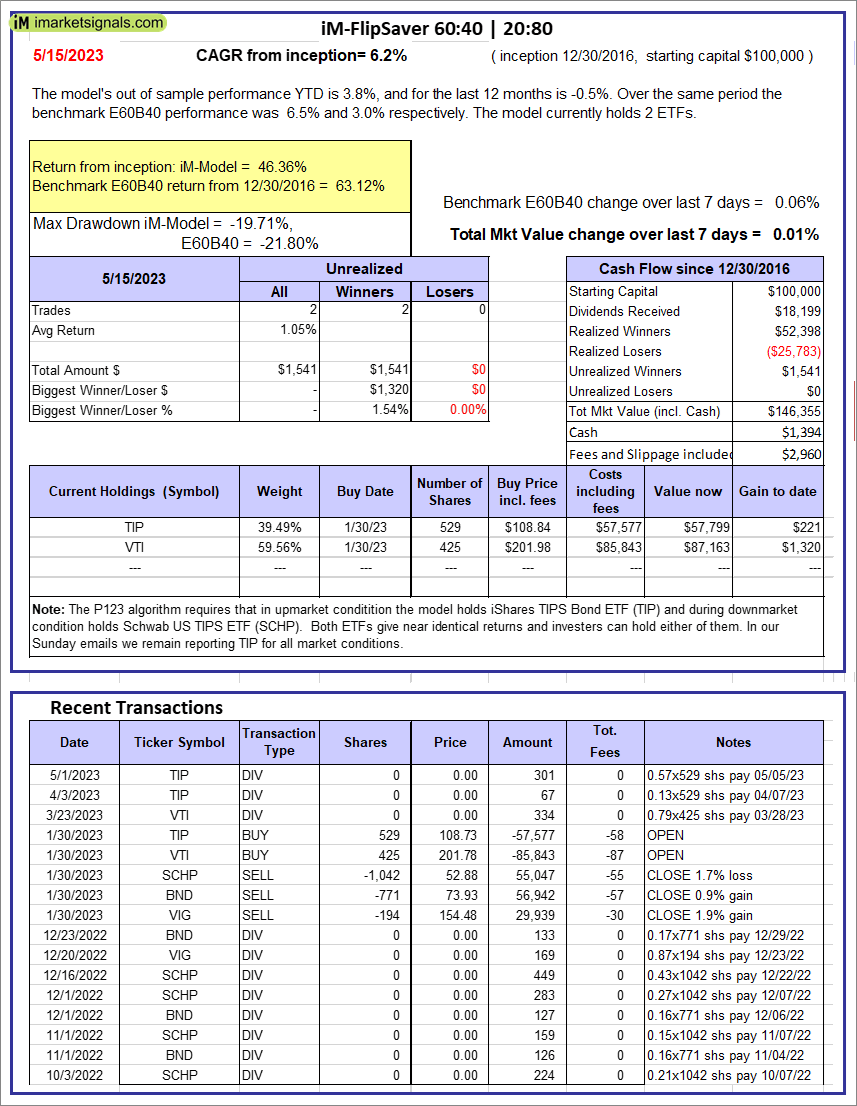 |
iM-FlipSaver 60:40 | 20:80 – 2017: The model’s out of sample performance YTD is 3.8%, and for the last 12 months is -0.5%. Over the same period the benchmark E60B40 performance was 6.5% and 3.0% respectively. Over the previous week the market value of iM-FlipSaver 80:20 | 20:80 gained 0.01% at a time when SPY gained 0.06%. A starting capital of $100,000 at inception on 7/16/2015 would have grown to $146,355 which includes $1,394 cash and excludes $2,960 spent on fees and slippage. |
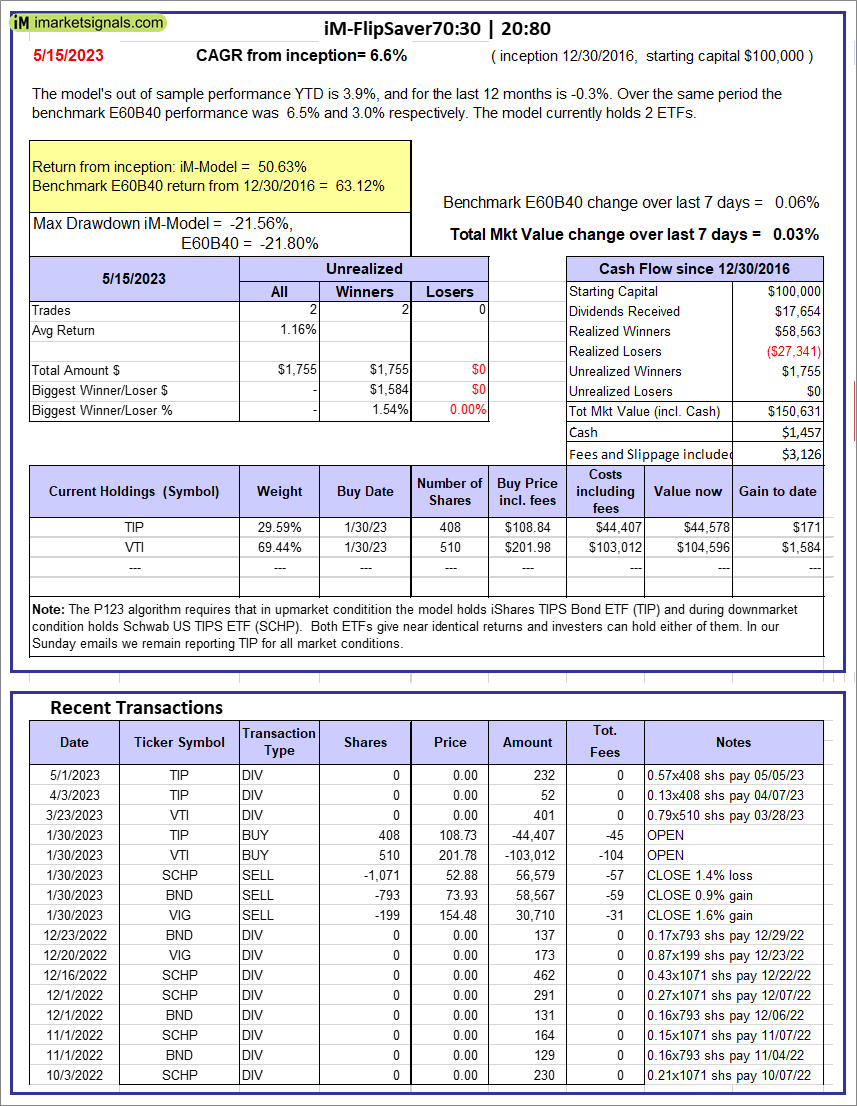 |
iM-FlipSaver 70:30 | 20:80 – 2017: The model’s out of sample performance YTD is 3.9%, and for the last 12 months is -0.3%. Over the same period the benchmark E60B40 performance was 6.5% and 3.0% respectively. Over the previous week the market value of iM-FlipSaver 70:30 | 20:80 gained 0.03% at a time when SPY gained 0.06%. A starting capital of $100,000 at inception on 7/15/2015 would have grown to $150,631 which includes $1,457 cash and excludes $3,126 spent on fees and slippage. |
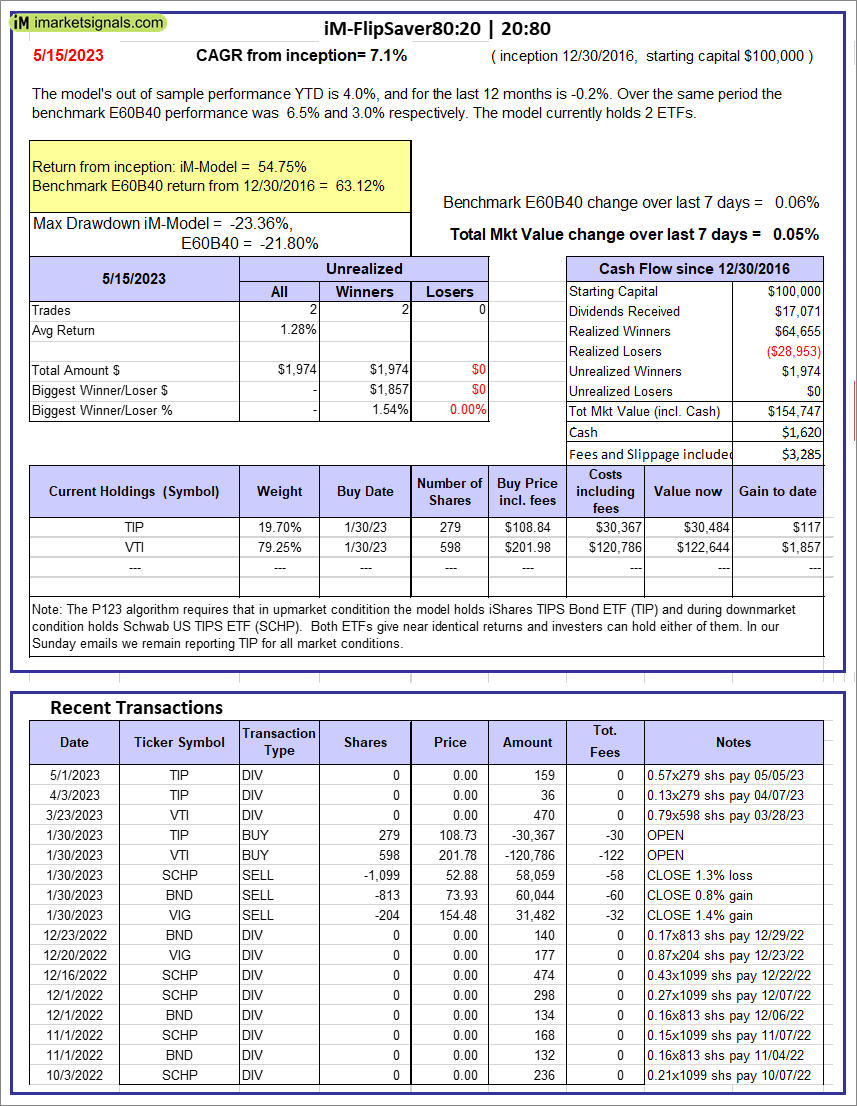 |
iM-FlipSaver 80:20 | 20:80 – 2017: The model’s out of sample performance YTD is 4.0%, and for the last 12 months is -0.2%. Over the same period the benchmark E60B40 performance was 6.5% and 3.0% respectively. Over the previous week the market value of iM-FlipSaver 80:20 | 20:80 gained 0.05% at a time when SPY gained 0.06%. A starting capital of $100,000 at inception on 1/2/2017 would have grown to $154,747 which includes $1,620 cash and excludes $3,285 spent on fees and slippage. |
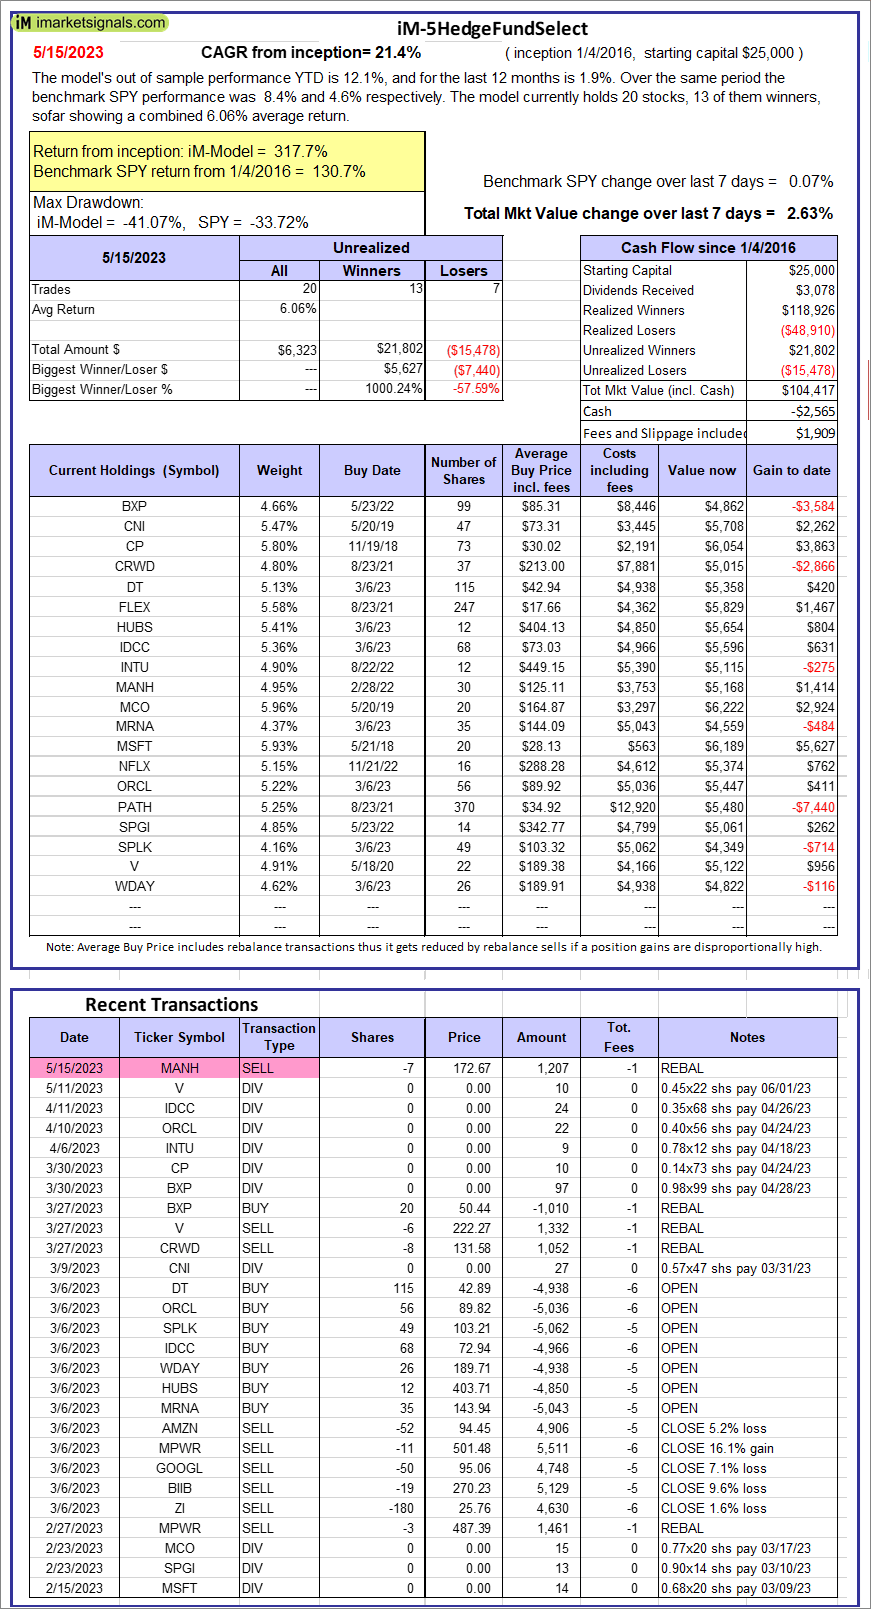 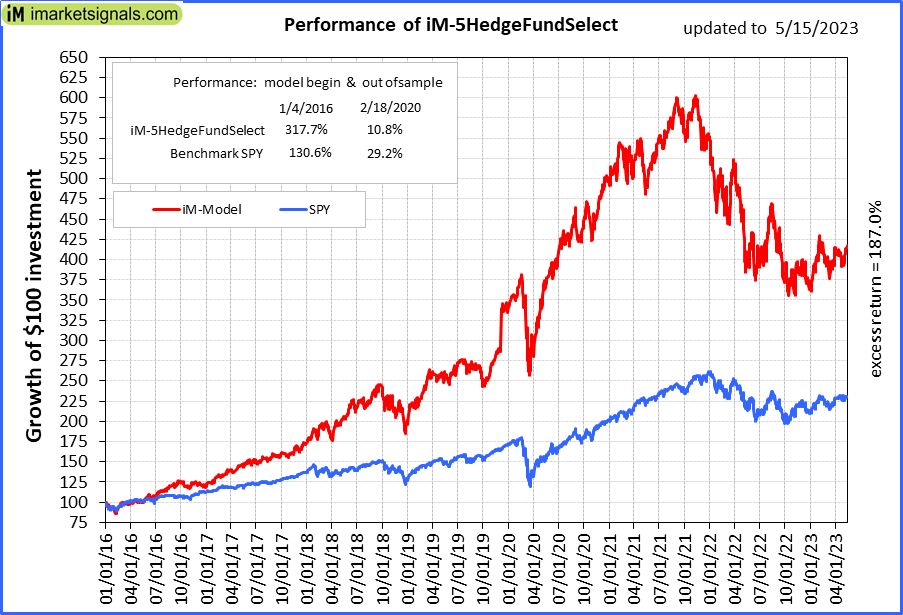 |
iM-5HedgeFundSelect: Since inception, on 1/5/2016, the model gained 317.67% while the benchmark SPY gained 130.65% over the same period. Over the previous week the market value of iM-5HedgeFundSelect gained 2.63% at a time when SPY gained 0.07%. A starting capital of $25,000 at inception on 1/5/2016 would have grown to $104,417 which includes -$2,565 cash and excludes $1,909 spent on fees and slippage. |
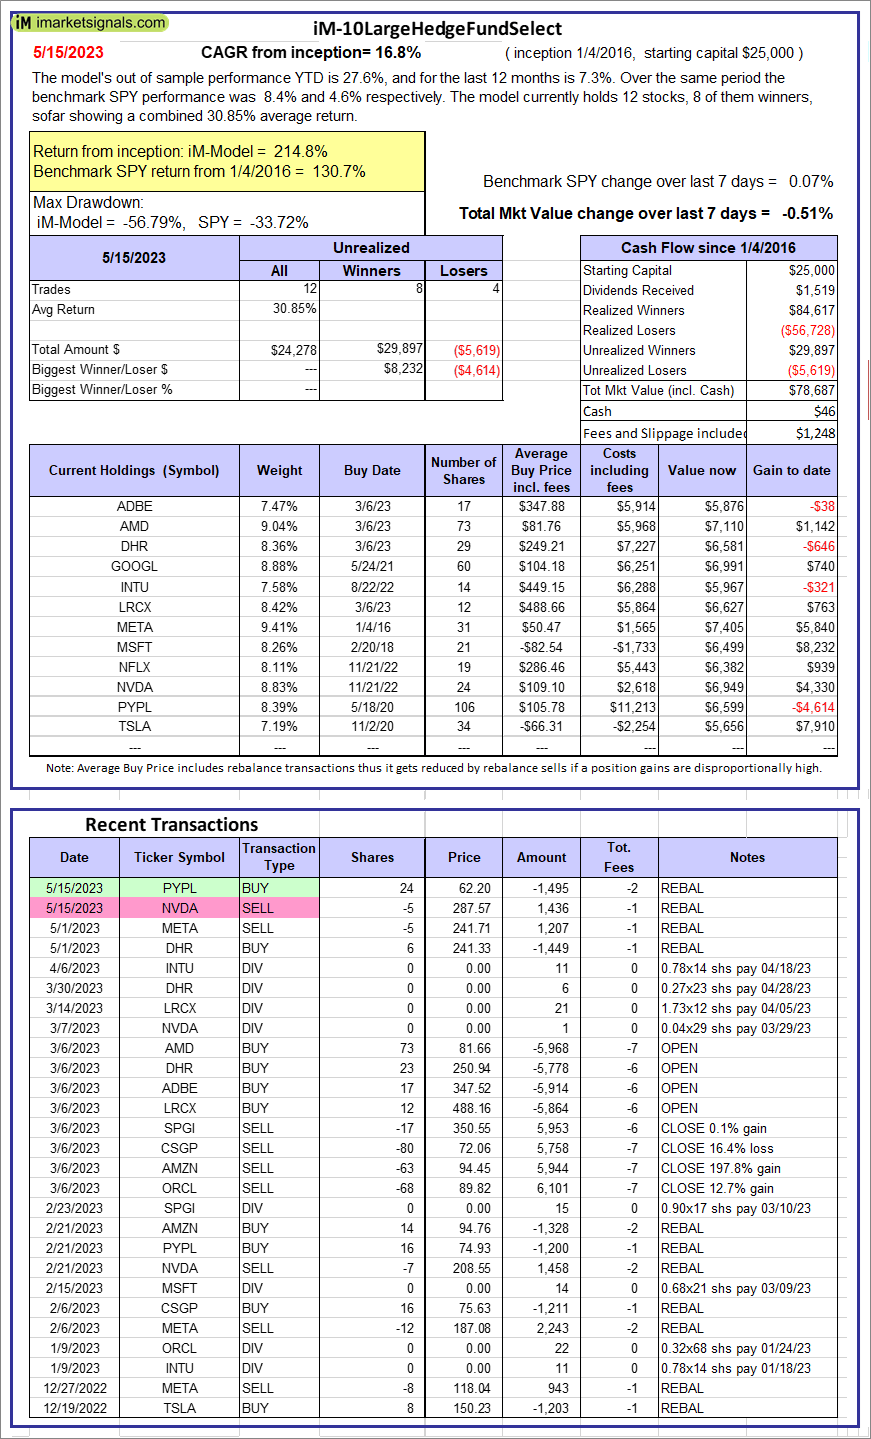 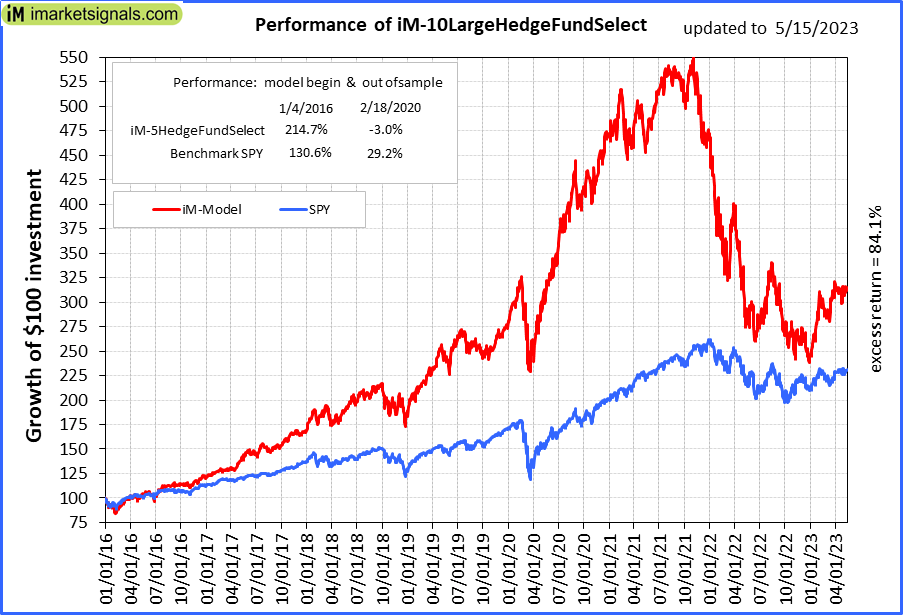 |
iM-10LargeHedgeFundSelect: Since inception, on 1/5/2016, the model gained 214.75% while the benchmark SPY gained 130.65% over the same period. Over the previous week the market value of iM-10LargeHedgeFundSelect gained -0.51% at a time when SPY gained 0.07%. A starting capital of $25,000 at inception on 1/5/2016 would have grown to $78,687 which includes $46 cash and excludes $1,248 spent on fees and slippage. |
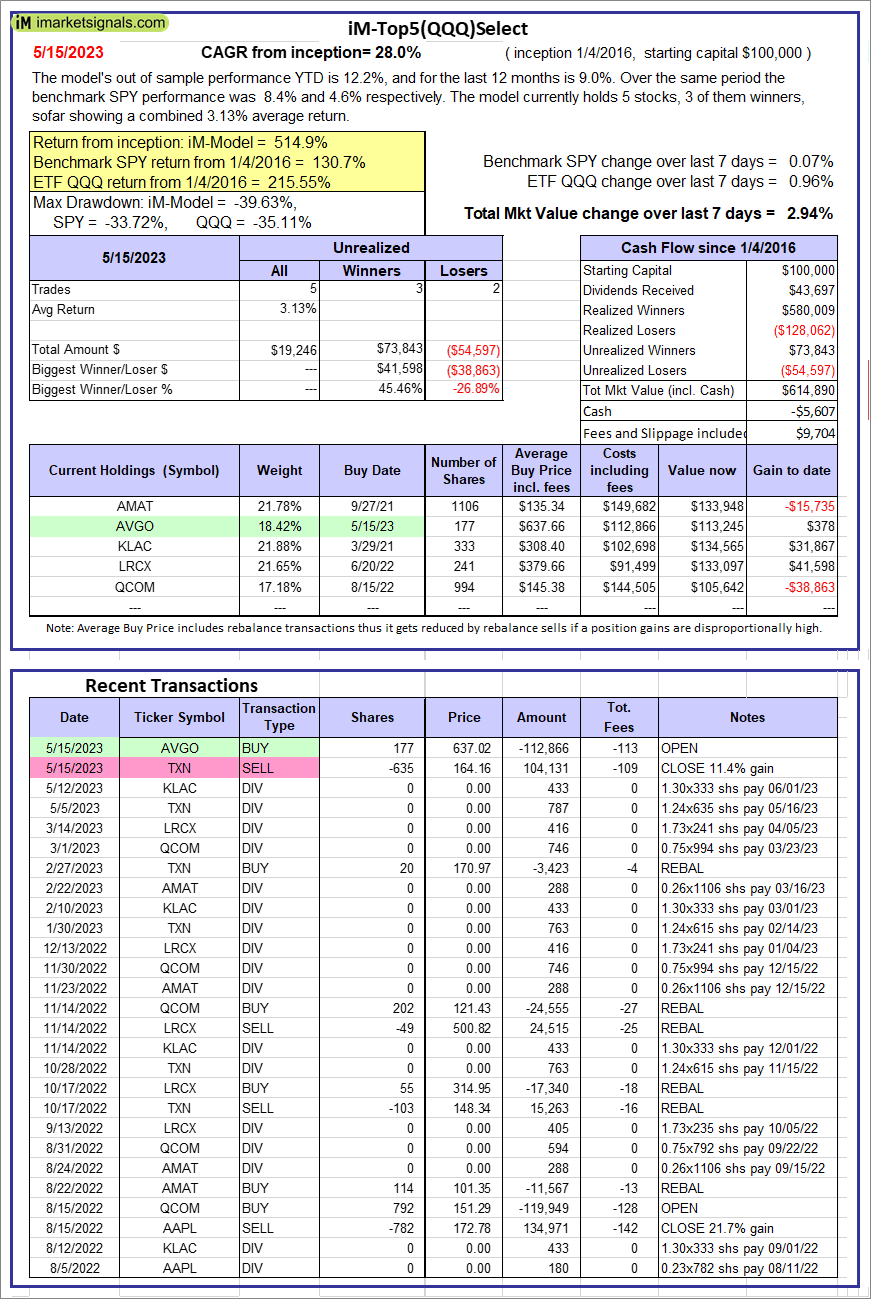 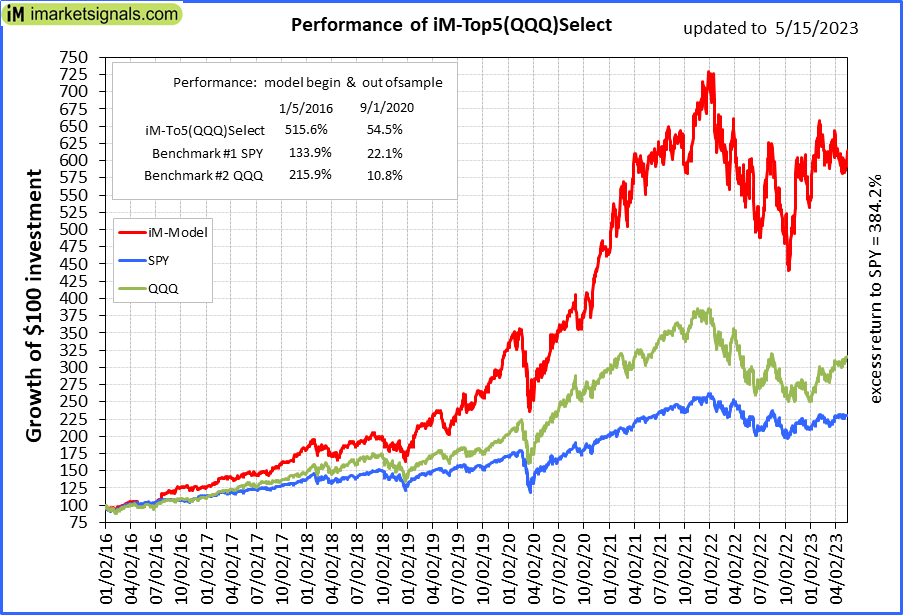 |
iM-Top5(QQQ)Select: Since inception, on 1/5/2016, the model gained 514.89% while the benchmark SPY gained 130.65% over the same period. Over the previous week the market value of iM-Top5(QQQ)Select gained 2.94% at a time when SPY gained 0.07%. A starting capital of $100,000 at inception on 1/5/2016 would have grown to $614,890 which includes -$5,607 cash and excludes $9,704 spent on fees and slippage. |
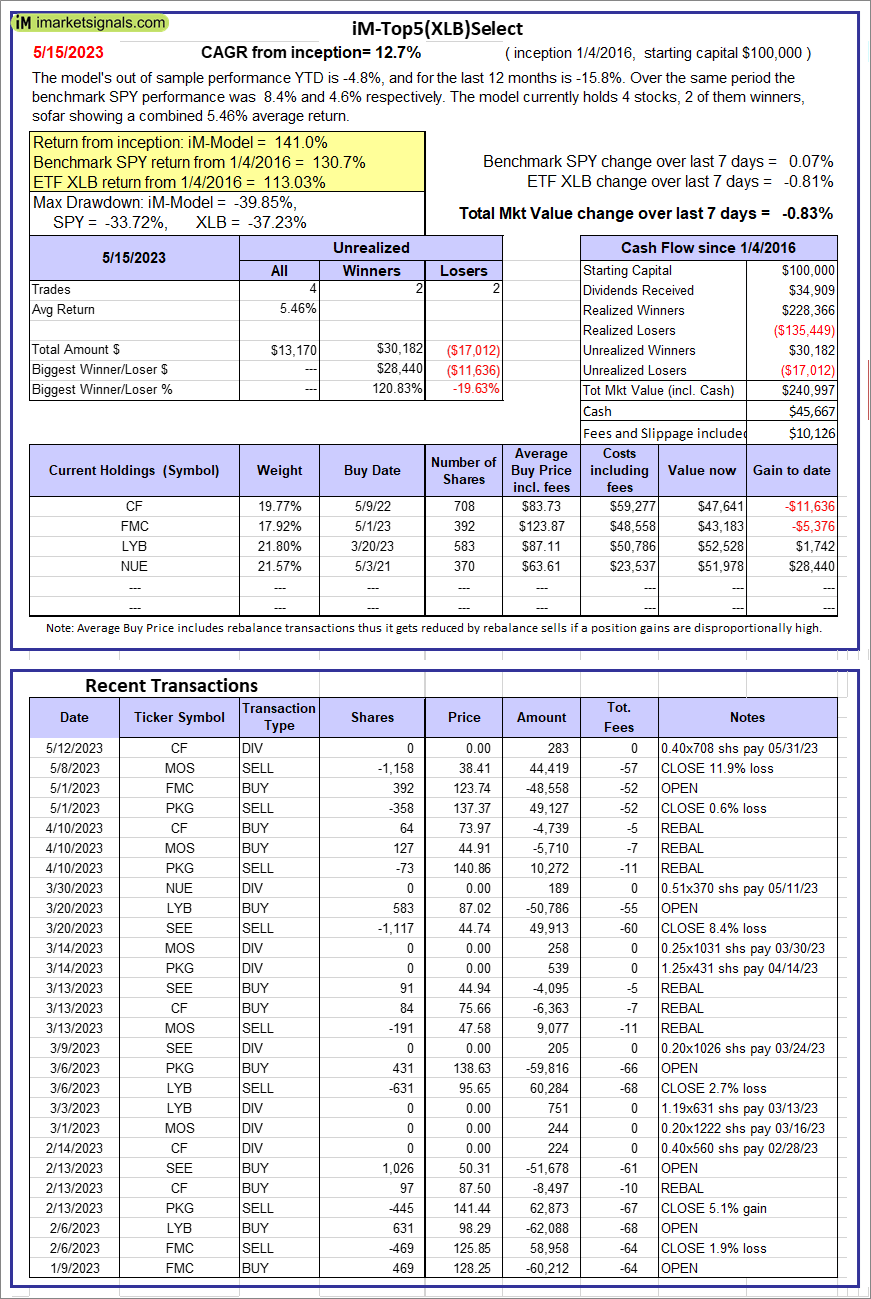 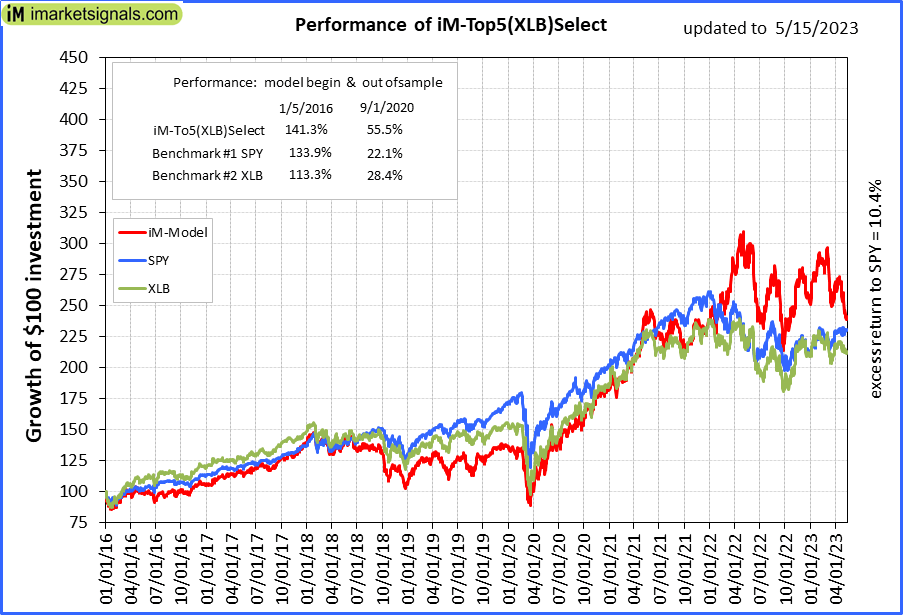 |
iM-Top5(XLB)Select: Since inception, on 1/5/2016, the model gained 141.00% while the benchmark SPY gained 130.65% over the same period. Over the previous week the market value of iM-Top5(XLB)Select gained -0.83% at a time when SPY gained 0.07%. A starting capital of $100,000 at inception on 1/5/2016 would have grown to $240,997 which includes $45,667 cash and excludes $10,126 spent on fees and slippage. |
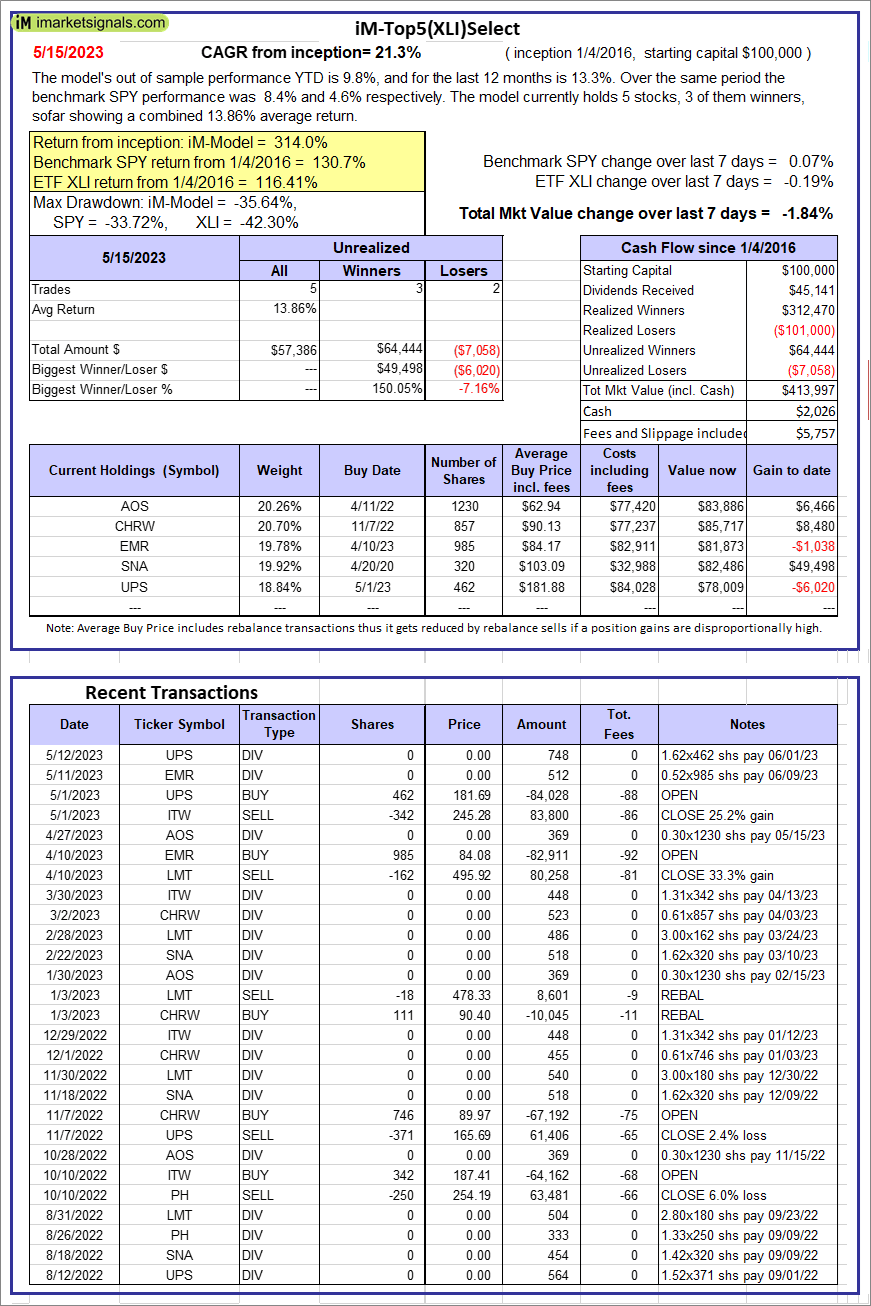 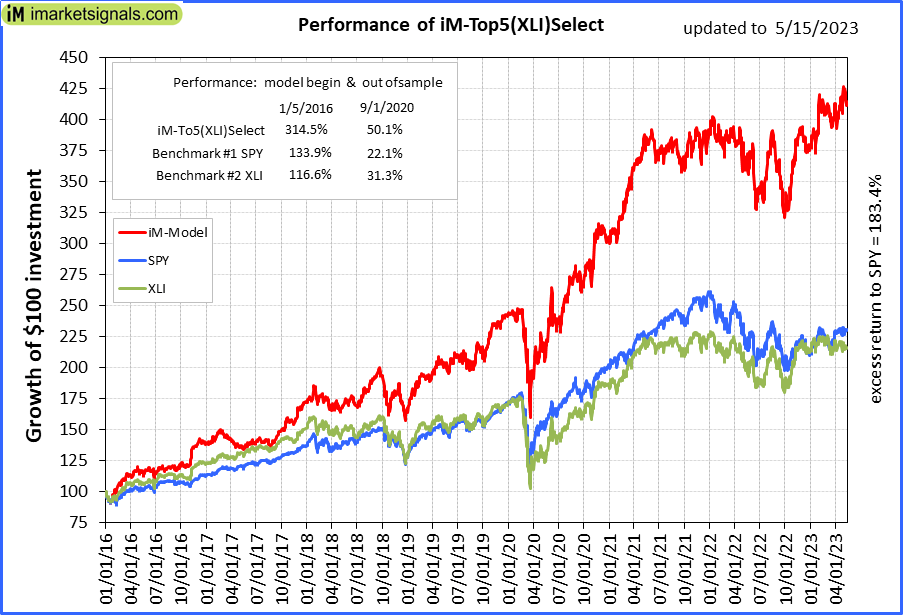 |
iM-Top5(XLI)Select: Since inception, on 1/5/2016, the model gained 314.00% while the benchmark SPY gained 130.65% over the same period. Over the previous week the market value of iM-Top5(XLI)Select gained -1.84% at a time when SPY gained 0.07%. A starting capital of $100,000 at inception on 1/5/2016 would have grown to $413,997 which includes $2,026 cash and excludes $5,757 spent on fees and slippage. |
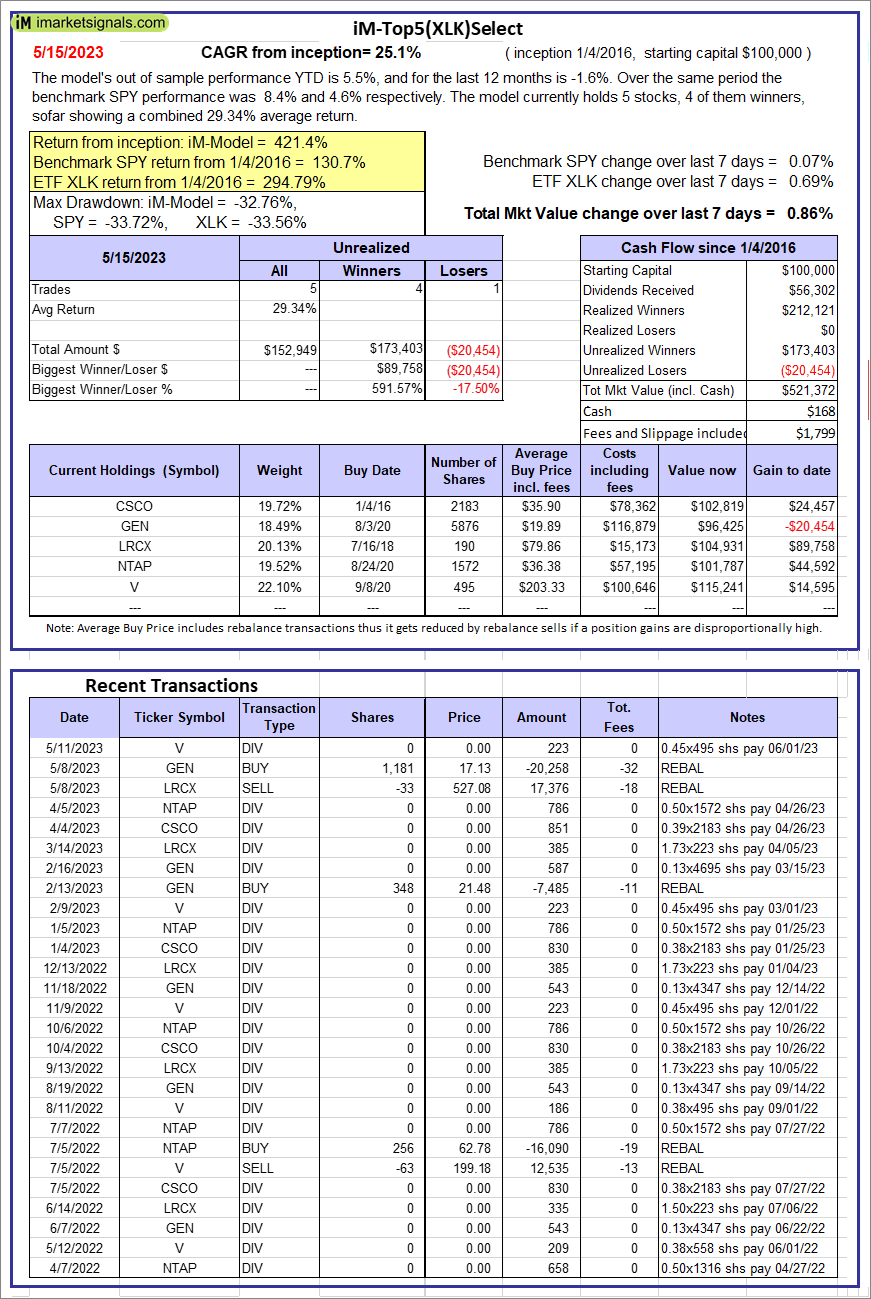 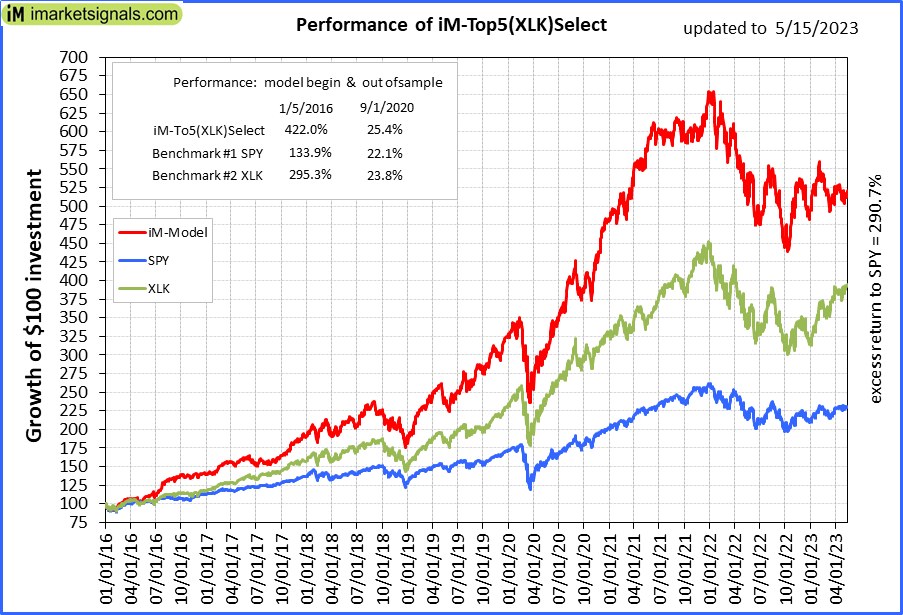 |
iM-Top5(XLK)Select: Since inception, on 1/5/2016, the model gained 421.37% while the benchmark SPY gained 130.65% over the same period. Over the previous week the market value of iM-Top5(XLK)Select gained 0.86% at a time when SPY gained 0.07%. A starting capital of $100,000 at inception on 1/5/2016 would have grown to $521,372 which includes $168 cash and excludes $1,799 spent on fees and slippage. |
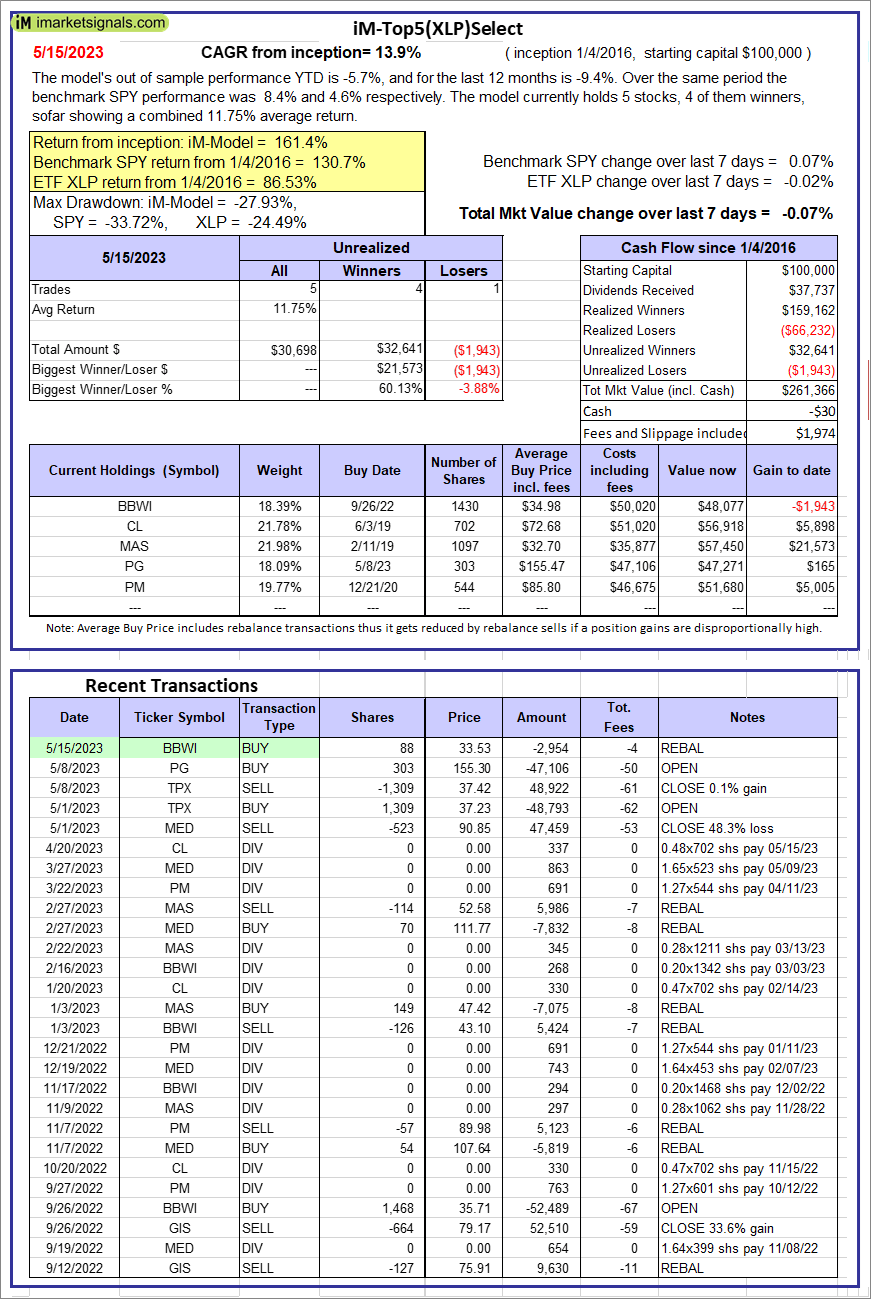 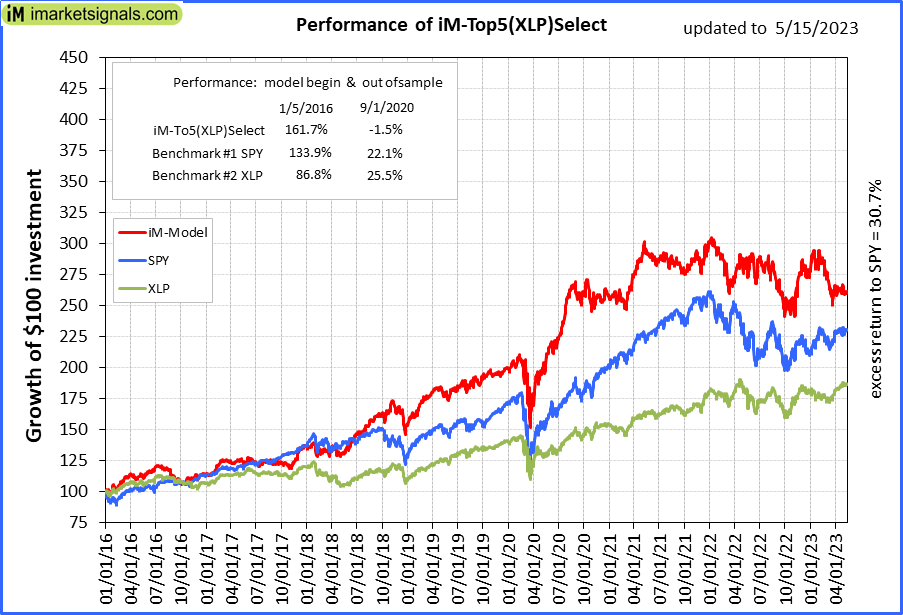 |
iM-Top5(XLP)Select: Since inception, on 1/5/2016, the model gained 161.37% while the benchmark SPY gained 130.65% over the same period. Over the previous week the market value of iM-Top5(XLP)Select gained -0.07% at a time when SPY gained 0.07%. A starting capital of $100,000 at inception on 1/5/2016 would have grown to $261,366 which includes -$30 cash and excludes $1,974 spent on fees and slippage. |
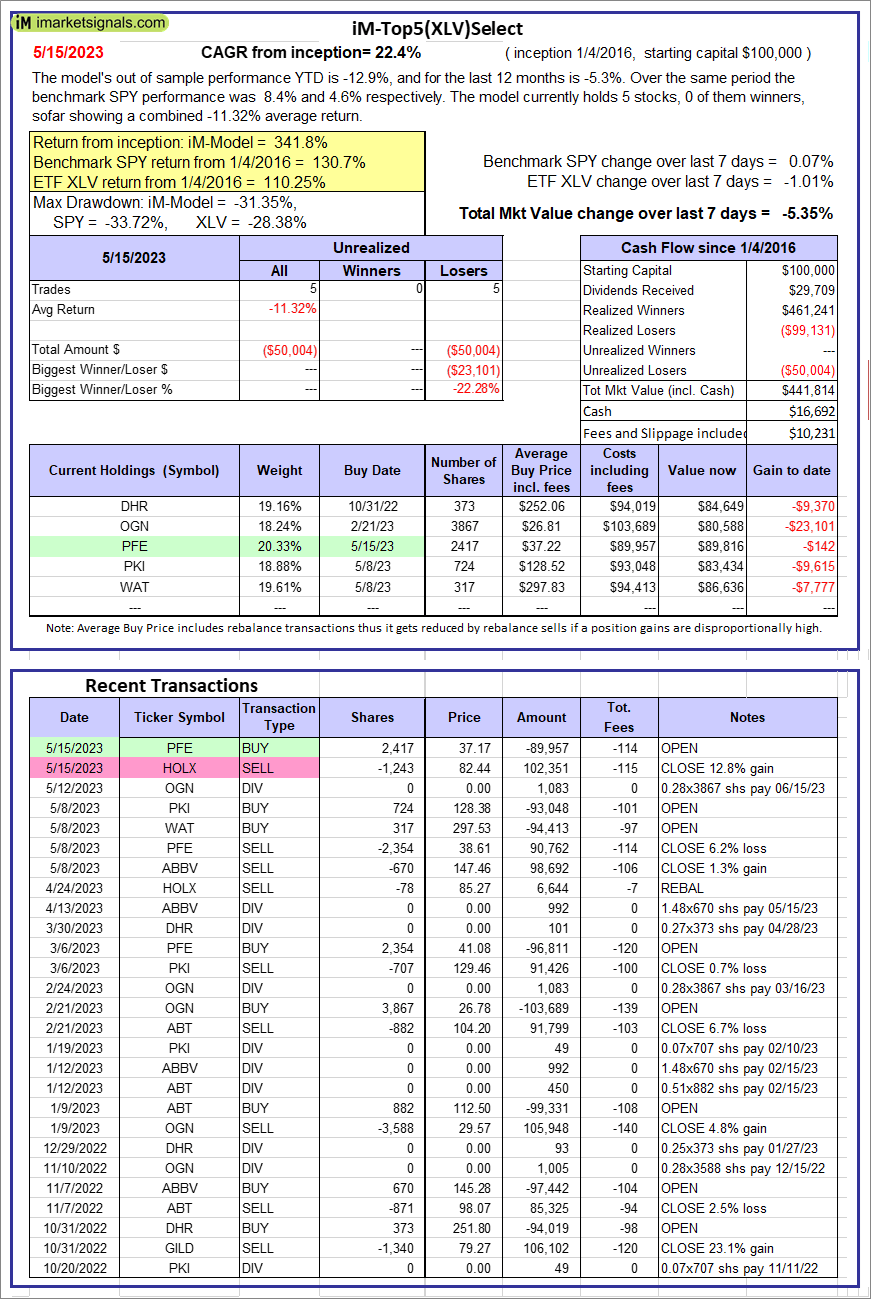 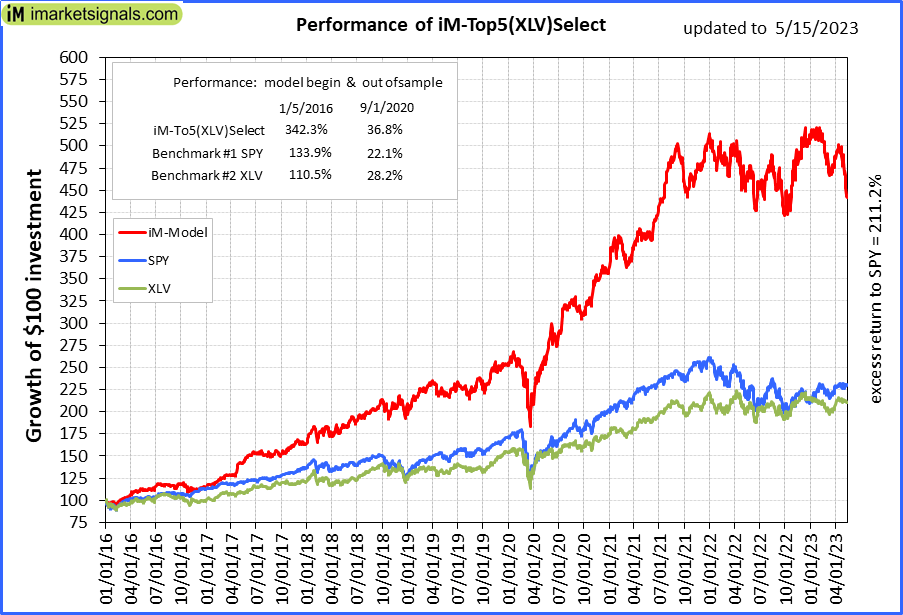 |
iM-Top5(XLV)Select: Since inception, on 1/5/2016, the model gained 341.81% while the benchmark SPY gained 130.65% over the same period. Over the previous week the market value of iM-Top5(XLV)Select gained -5.35% at a time when SPY gained 0.07%. A starting capital of $100,000 at inception on 1/5/2016 would have grown to $441,814 which includes $16,692 cash and excludes $10,231 spent on fees and slippage. |
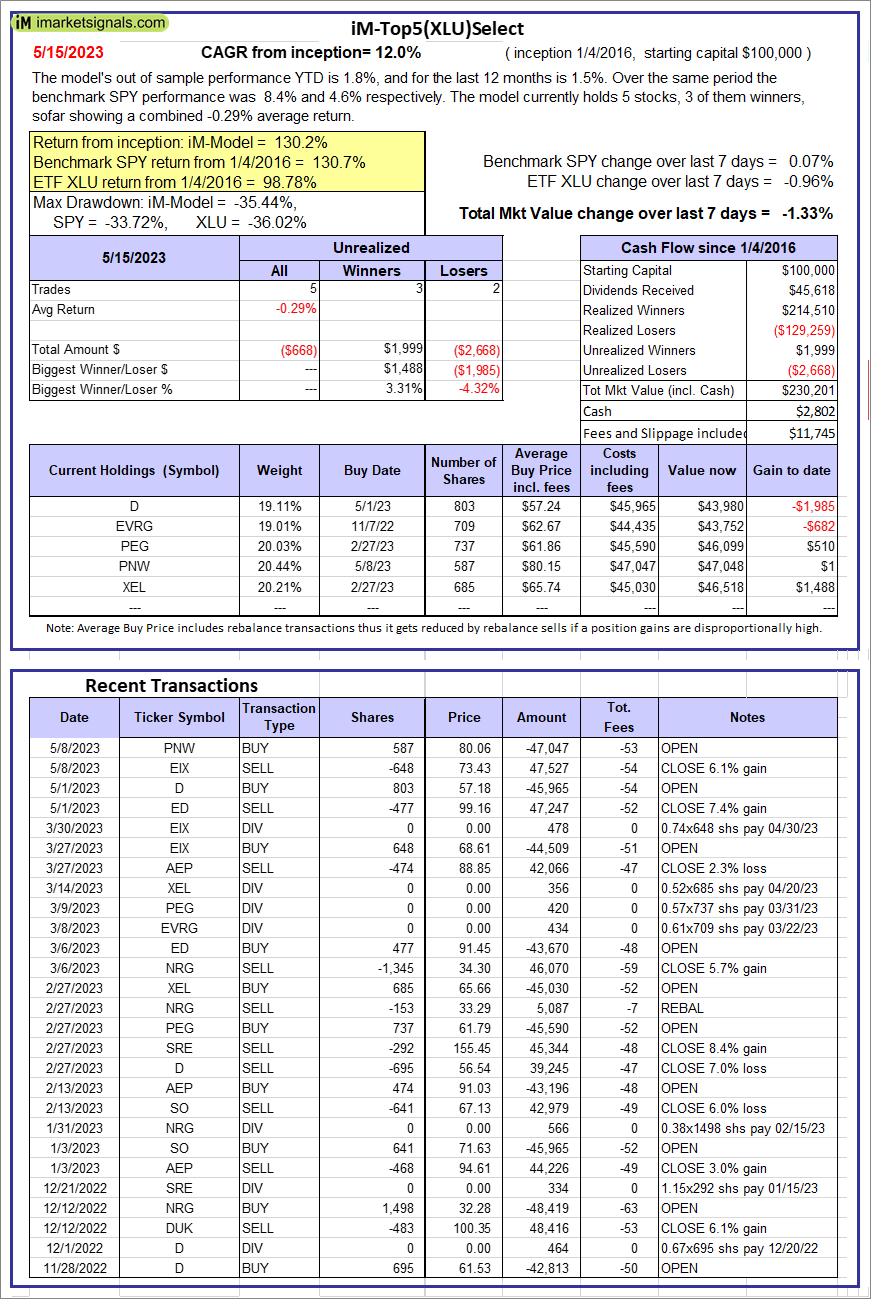 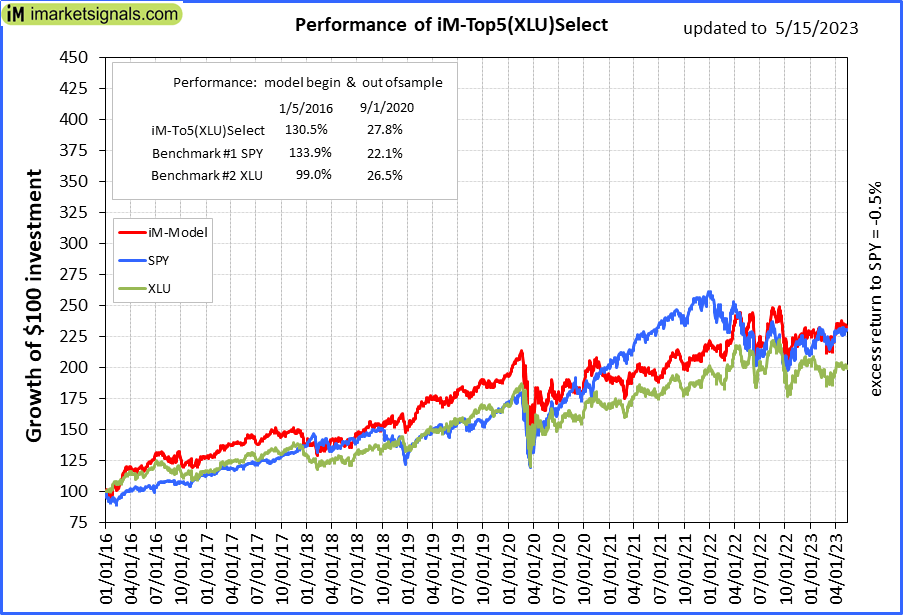 |
iM-Top5(XLU)Select: Since inception, on 1/5/2016, the model gained 130.20% while the benchmark SPY gained 130.65% over the same period. Over the previous week the market value of iM-Top5(XLU)Select gained -1.33% at a time when SPY gained 0.07%. A starting capital of $100,000 at inception on 1/5/2016 would have grown to $230,201 which includes $2,802 cash and excludes $11,745 spent on fees and slippage. |
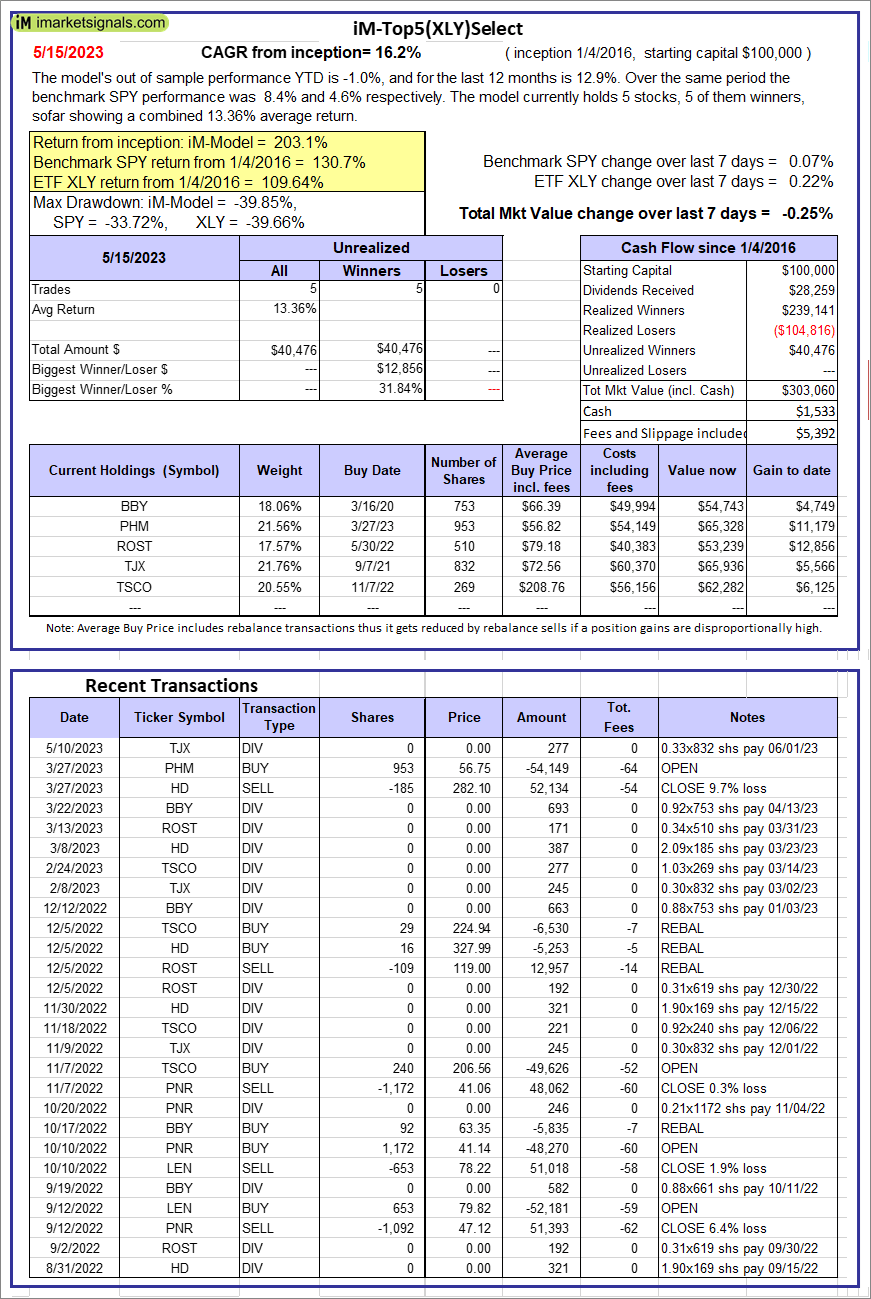 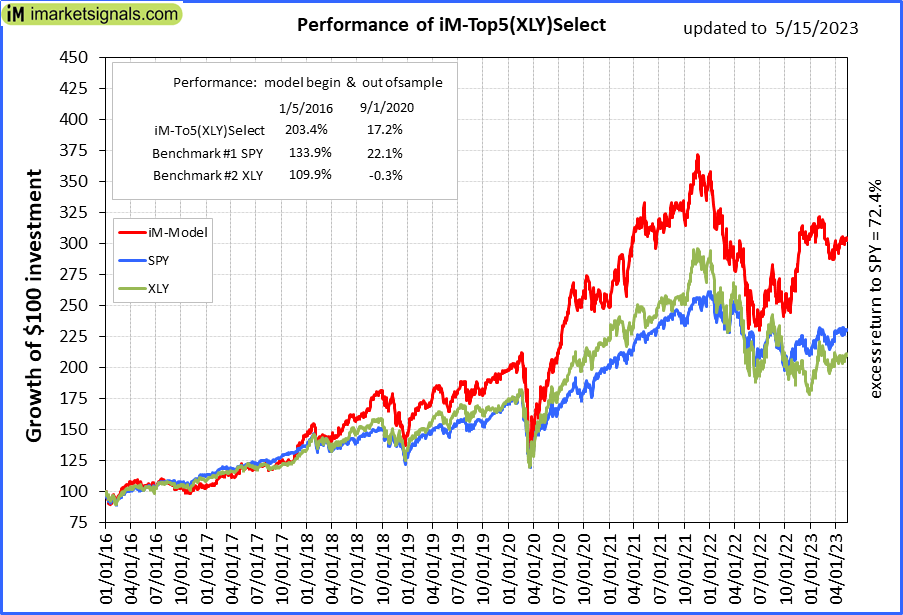 |
iM-Top5(XLY)Select: Since inception, on 1/5/2016, the model gained 203.06% while the benchmark SPY gained 130.65% over the same period. Over the previous week the market value of iM-Top5(XLY)Select gained -0.25% at a time when SPY gained 0.07%. A starting capital of $100,000 at inception on 1/5/2016 would have grown to $303,060 which includes $1,533 cash and excludes $5,392 spent on fees and slippage. |
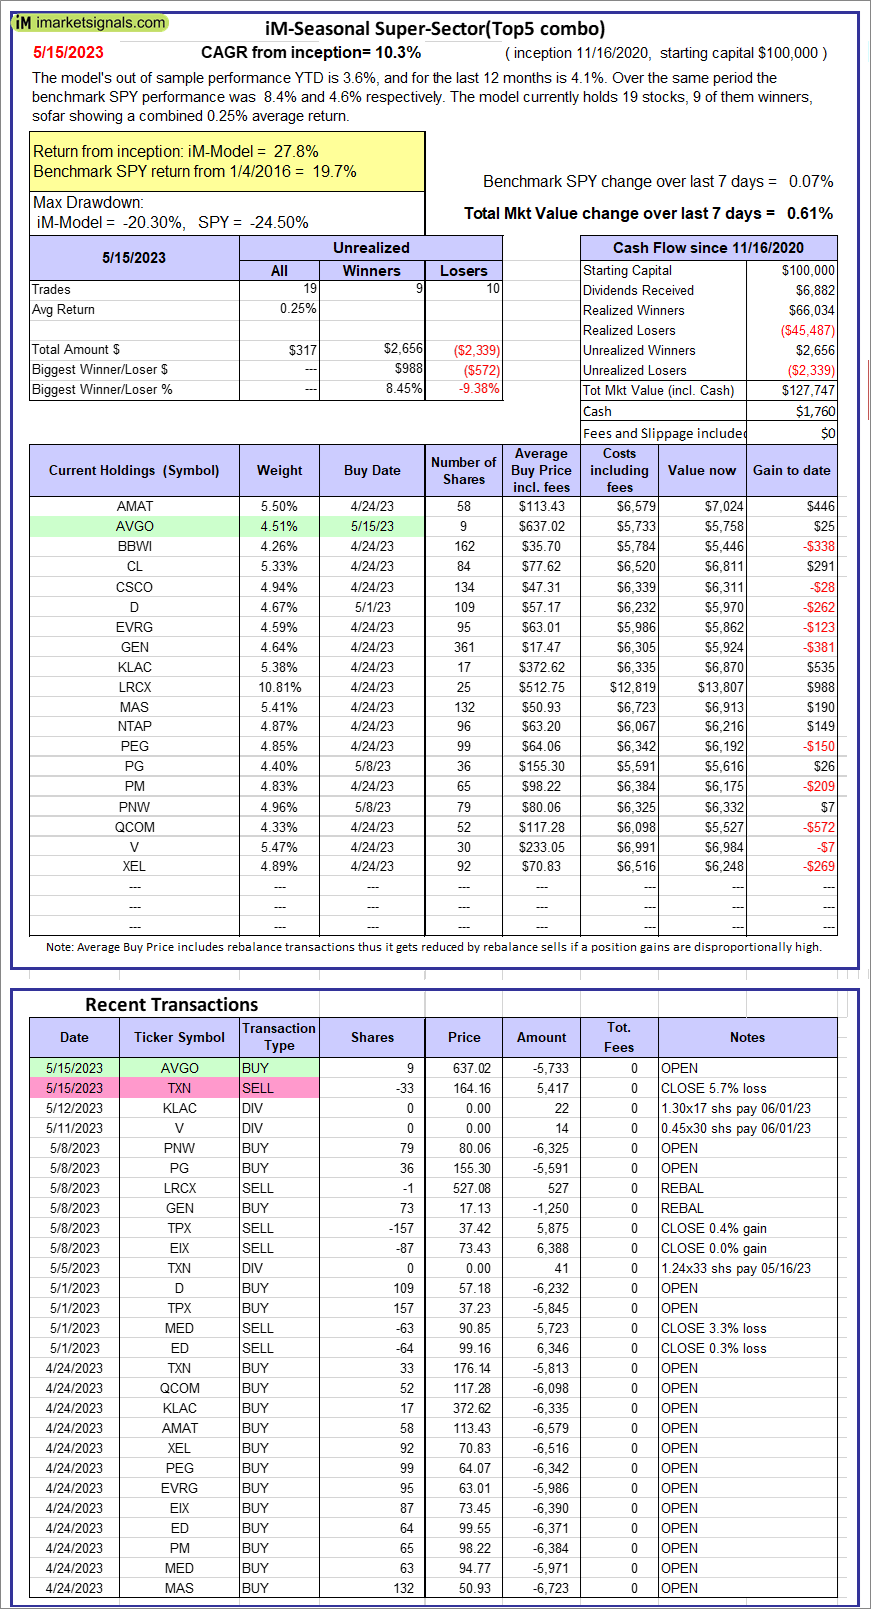 |
iM-Seasonal Super-Sectors (Top5 combo) : Since inception, on 11/17/2020, the model gained 27.75% while the benchmark SPY gained 19.73% over the same period. Over the previous week the market value of iM-Seasonal Super-Sectors (Top5 combo) gained 0.61% at a time when SPY gained 0.07%. A starting capital of $100,000 at inception on 11/17/2020 would have grown to $127,747 which includes $1,760 cash and excludes $00 spent on fees and slippage. |
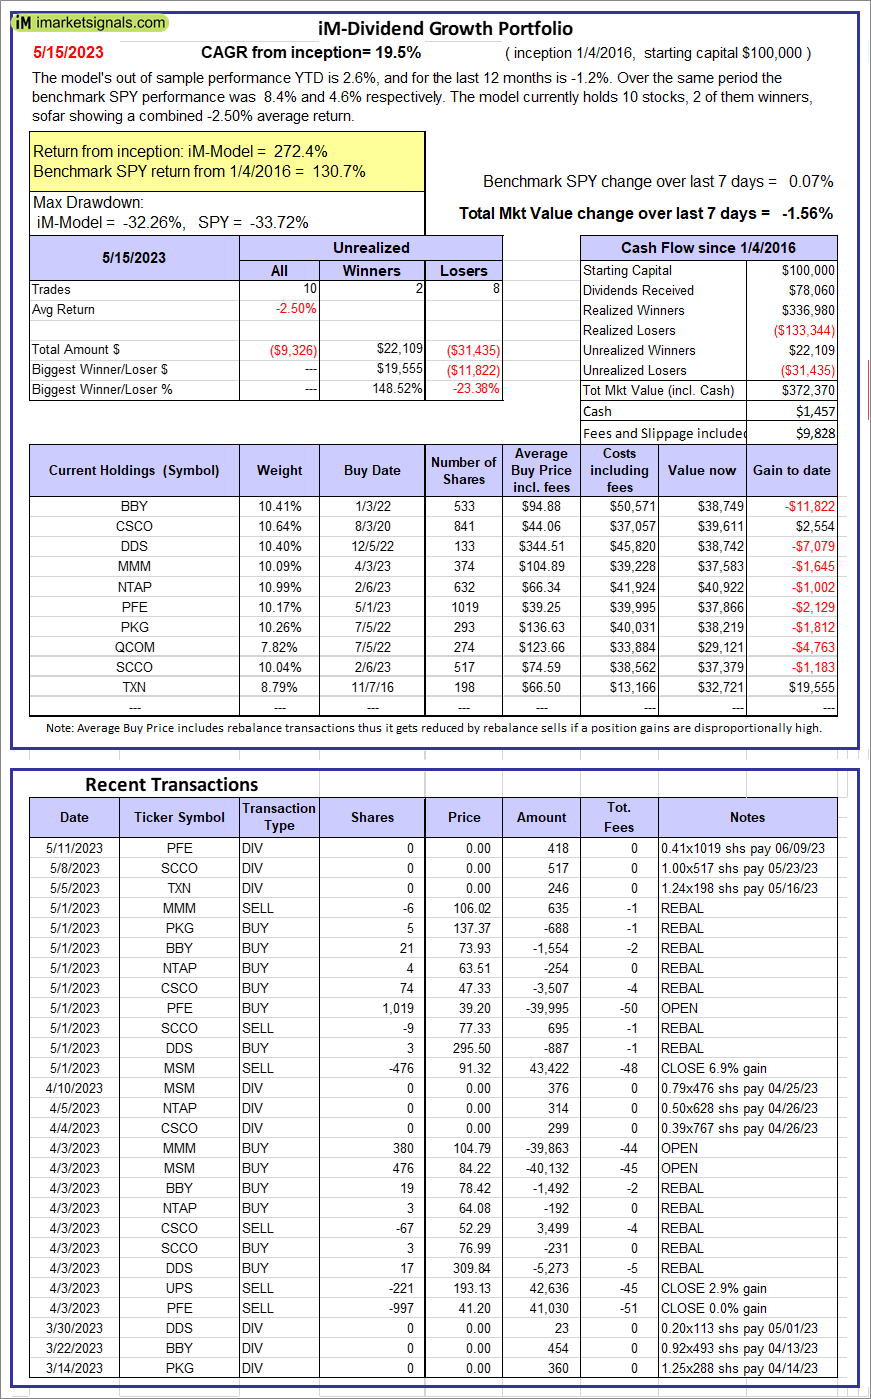 |
iM-Dividend Growth Portfolio: The model’s out of sample performance YTD is 2.6%, and for the last 12 months is -1.2%. Over the same period the benchmark SPY performance was 8.4% and 4.6% respectively. Over the previous week the market value of the iM-Dividend Growth Portfolio gained -1.56% at a time when SPY gained 0.07%. A starting capital of $100,000 at inception on 6/30/2016 would have grown to $372,370 which includes $1,457 cash and excludes $9,828 spent on fees and slippage. |
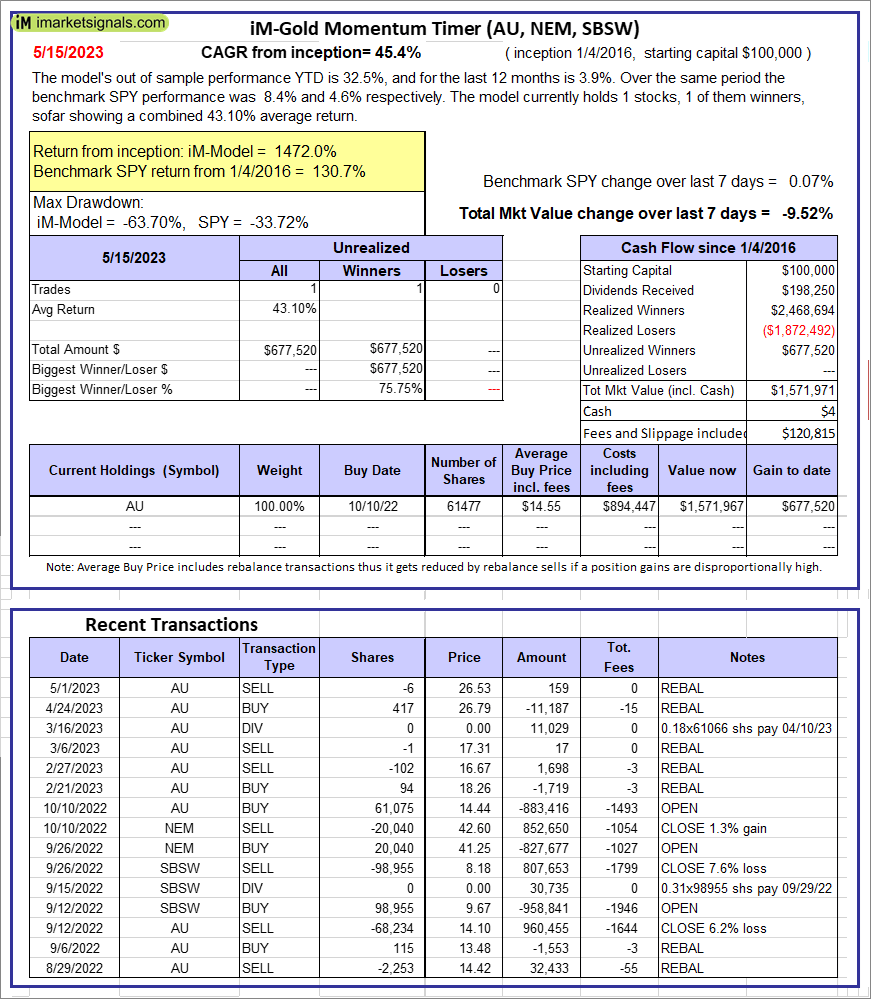 |
iM-Gold Momentum Timer (AU, NEM, SBSW): The model’s out of sample performance YTD is 32.5%, and for the last 12 months is 3.9%. Over the same period the benchmark SPY performance was 8.4% and 4.6% respectively. Over the previous week the market value of iM-Gold Momentum Timer (AU, NEM, SBSW) gained -9.52% at a time when SPY gained 0.07%. A starting capital of $100,000 at inception on 6/30/2016 would have grown to $04 which includes $120,815 cash and excludes Gain to date spent on fees and slippage. |
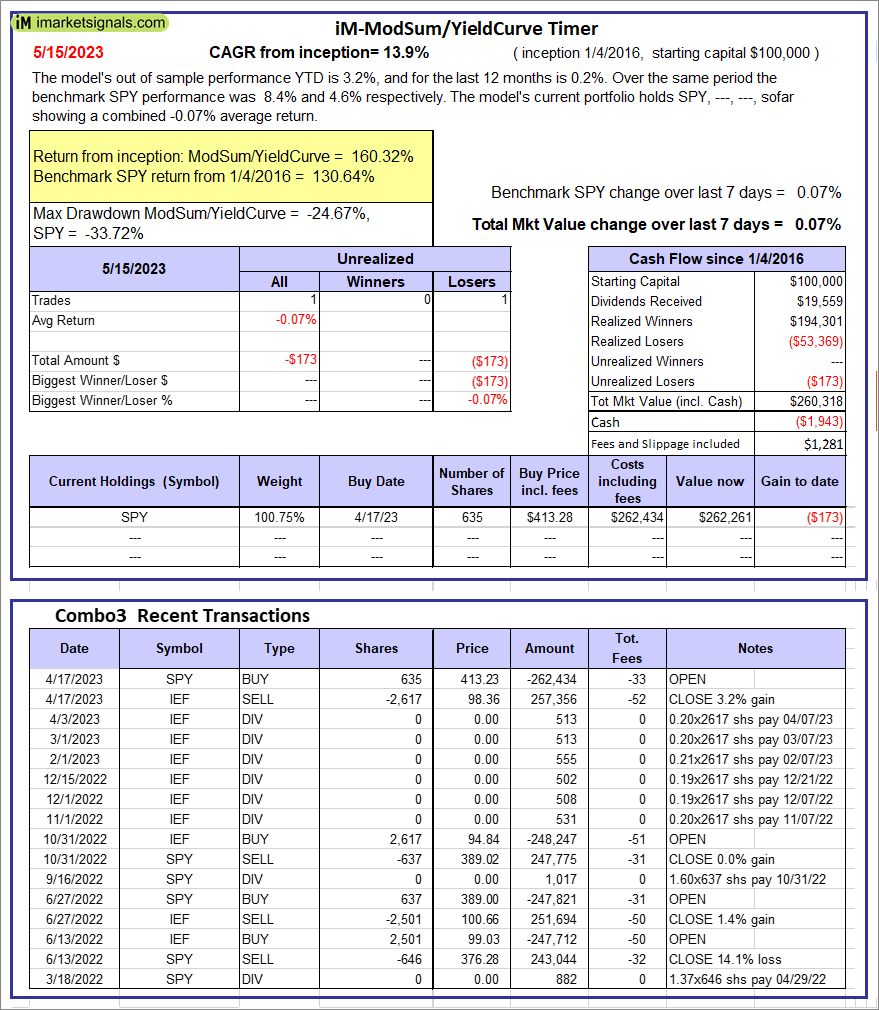 |
iM-ModSum/YieldCurve Timer: The model’s out of sample performance YTD is 3.2%, and for the last 12 months is 0.2%. Over the same period the benchmark SPY performance was 8.4% and 4.6% respectively. Over the previous week the market value of iM-PortSum/YieldCurve Timer gained 0.07% at a time when SPY gained 0.07%. A starting capital of $100,000 at inception on 1/1/2016 would have grown to $260,318 which includes -$1,943 cash and excludes $1,281 spent on fees and slippage. |
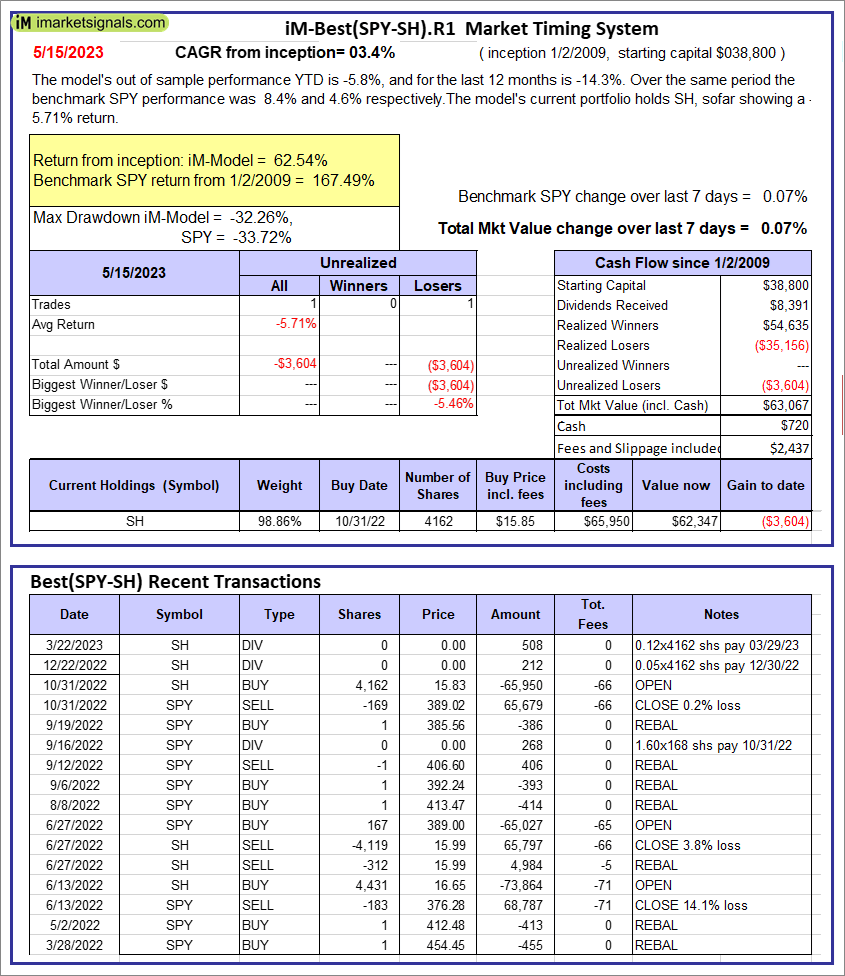 |
iM-Best(SPY-SH).R1: The model’s out of sample performance YTD is -5.8%, and for the last 12 months is -14.3%. Over the same period the benchmark SPY performance was 8.4% and 4.6% respectively. Over the previous week the market value of Best(SPY-SH) gained 0.07% at a time when SPY gained 0.07%. A starting capital of $100,000 at inception on 1/2/2009 would have grown to $63,067 which includes $720 cash and excludes $2,437 spent on fees and slippage. |
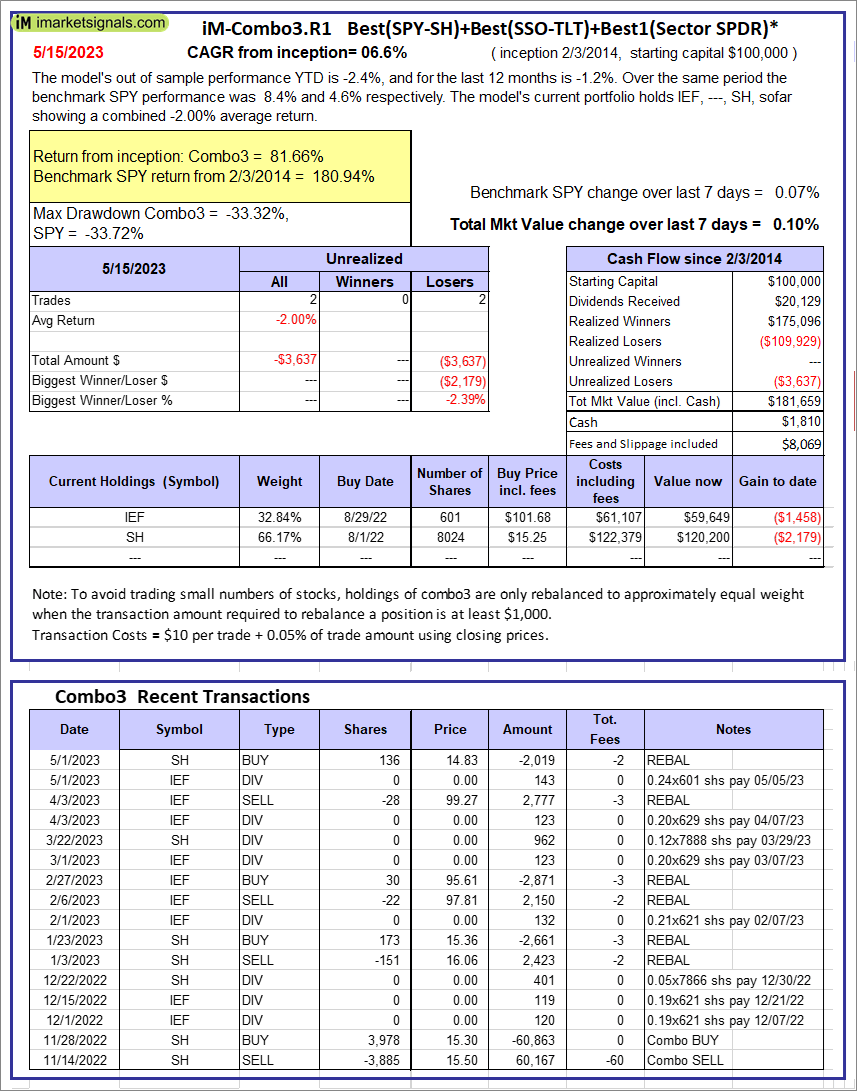 |
iM-Combo3.R1: The model’s out of sample performance YTD is -2.4%, and for the last 12 months is -1.2%. Over the same period the benchmark SPY performance was 8.4% and 4.6% respectively. Over the previous week the market value of iM-Combo3.R1 gained 0.10% at a time when SPY gained 0.07%. A starting capital of $100,000 at inception on 2/3/2014 would have grown to $181,659 which includes $1,810 cash and excludes $8,069 spent on fees and slippage. |
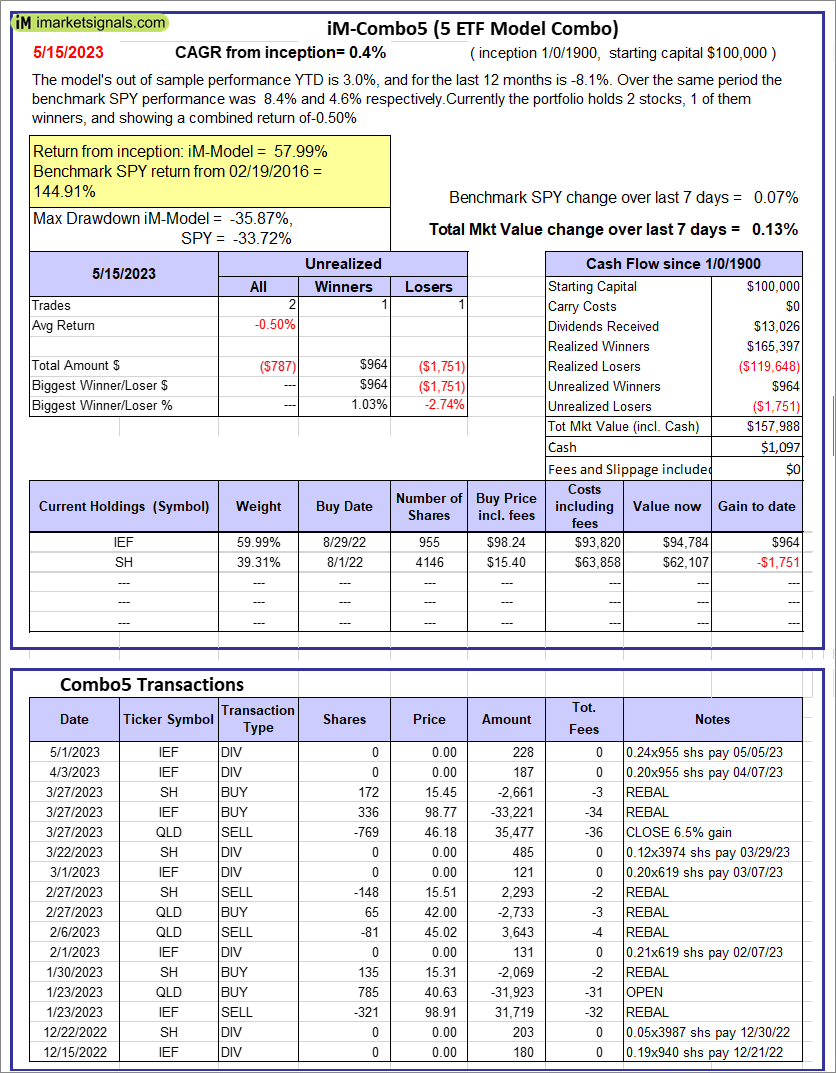 |
iM-Combo5: The model’s out of sample performance YTD is 3.0%, and for the last 12 months is -8.1%. Over the same period the benchmark SPY performance was 8.4% and 4.6% respectively. Over the previous week the market value of iM-Combo5 gained 0.13% at a time when SPY gained 0.07%. A starting capital of $100,000 at inception on 2/22/2016 would have grown to $157,988 which includes $1,097 cash and excludes $0 spent on fees and slippage. |
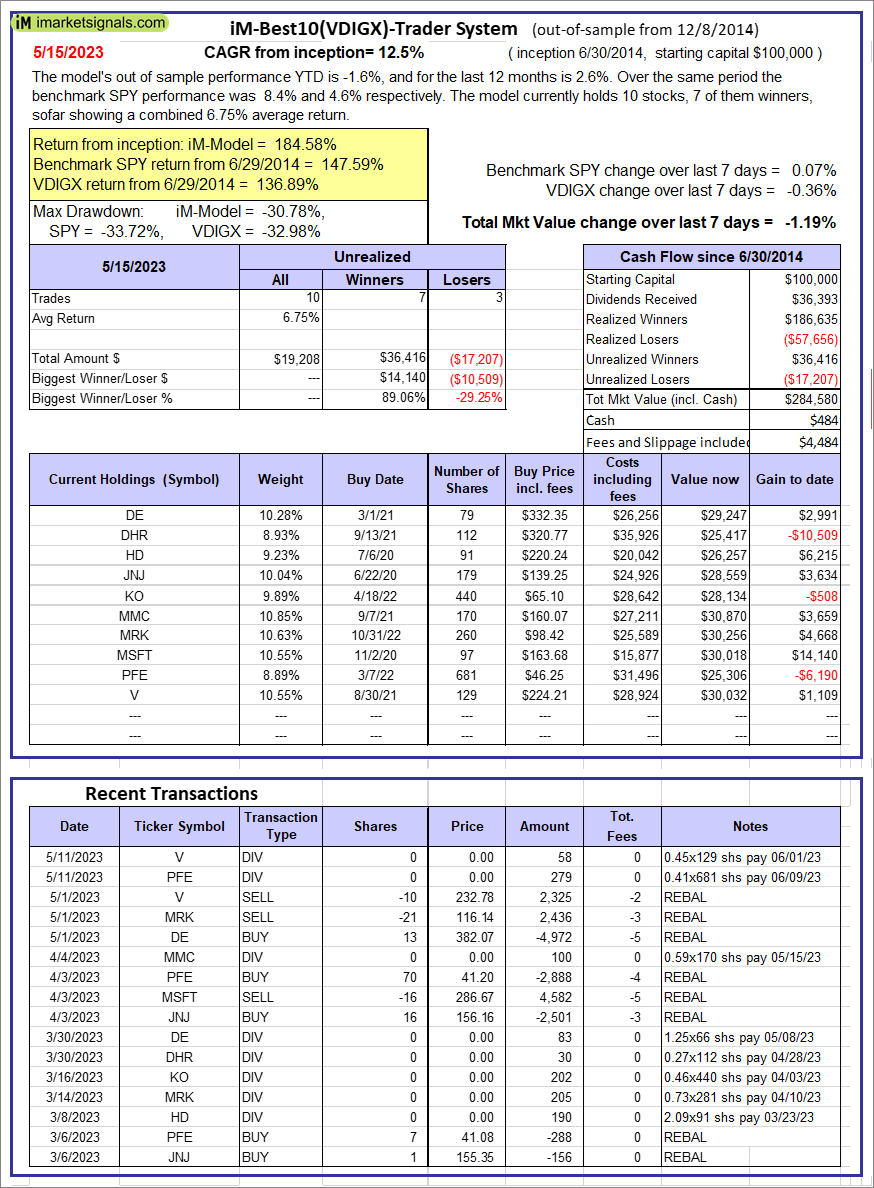 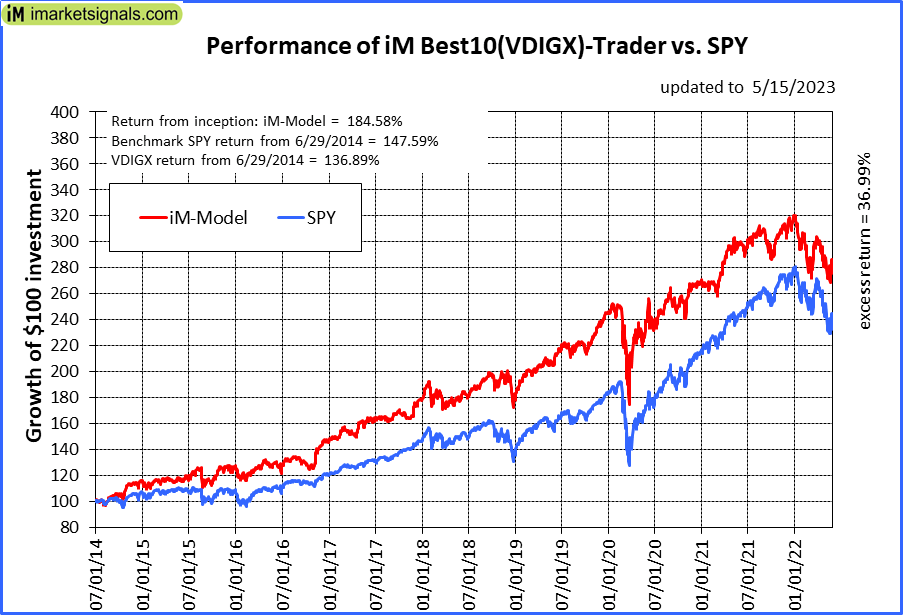 |
iM-Best10(VDIGX)-Trader: The model’s out of sample performance YTD is -1.6%, and for the last 12 months is 2.6%. Over the same period the benchmark SPY performance was 8.4% and 4.6% respectively. Since inception, on 7/1/2014, the model gained 184.58% while the benchmark SPY gained 147.59% and VDIGX gained 136.89% over the same period. Over the previous week the market value of iM-Best10(VDIGX) gained -1.19% at a time when SPY gained 0.07%. A starting capital of $100,000 at inception on 7/1/2014 would have grown to $284,580 which includes $484 cash and excludes $4,484 spent on fees and slippage. |
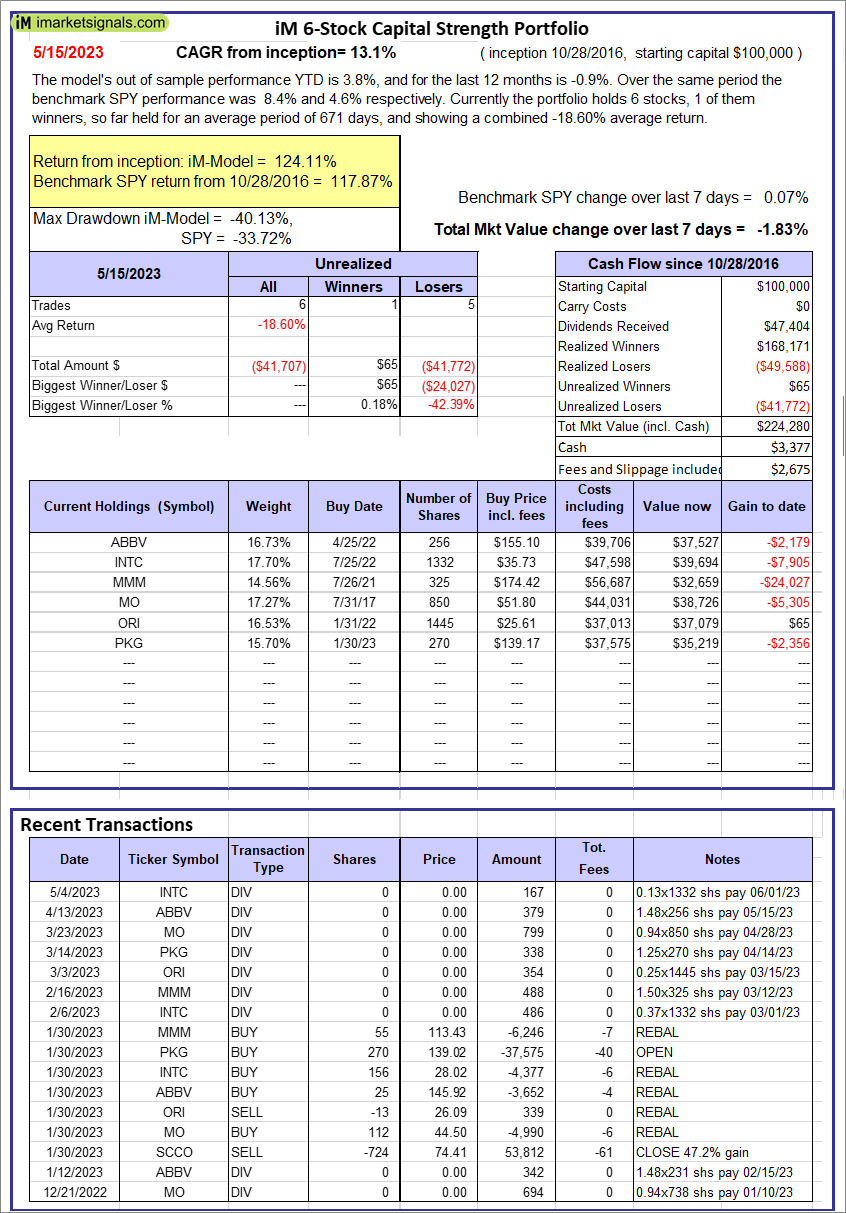 |
iM 6-Stock Capital Strength Portfolio: The model’s out of sample performance YTD is 3.8%, and for the last 12 months is -0.9%. Over the same period the benchmark SPY performance was 8.4% and 4.6% respectively. Over the previous week the market value of the iM 6-Stock Capital Strength Portfolio gained -1.83% at a time when SPY gained 0.07%. A starting capital of $100,000 at inception on 10/28/2016 would have grown to $224,280 which includes $3,377 cash and excludes $2,675 spent on fees and slippage. |
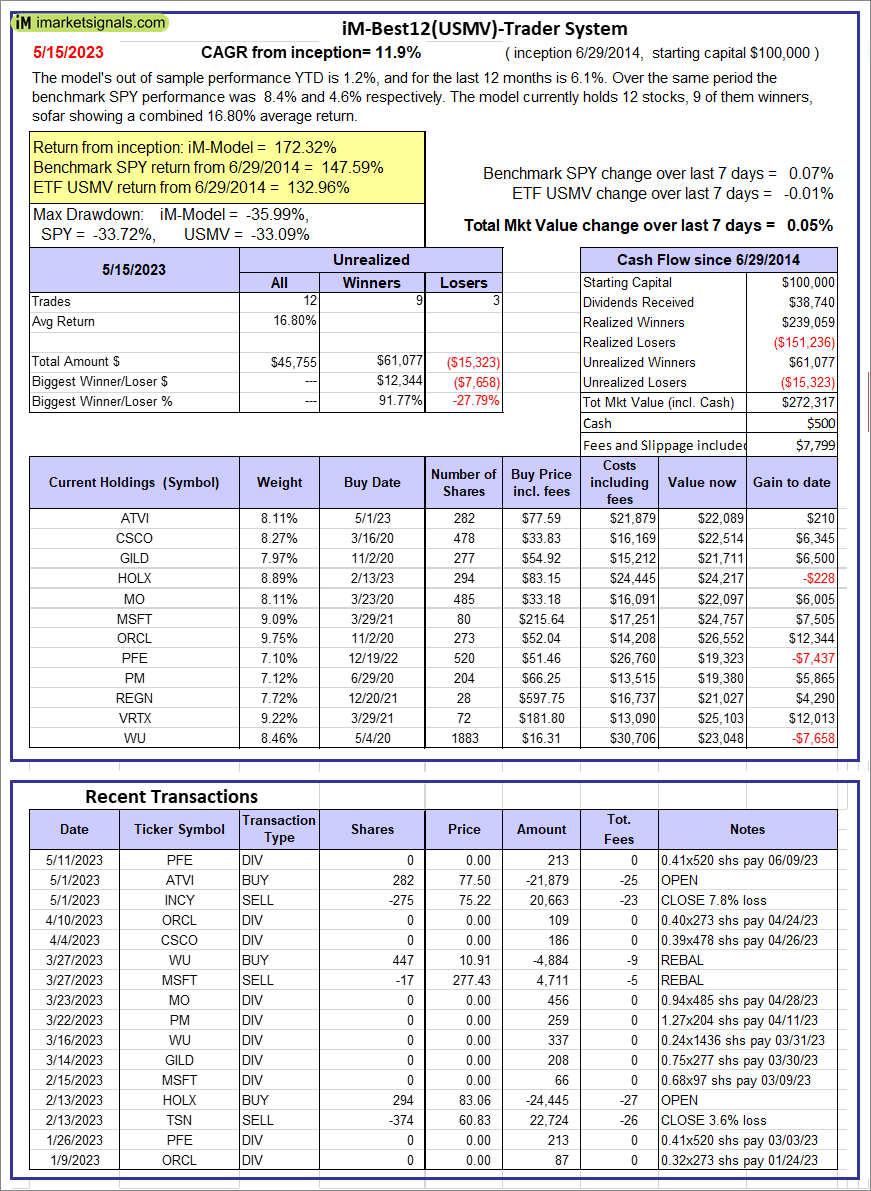 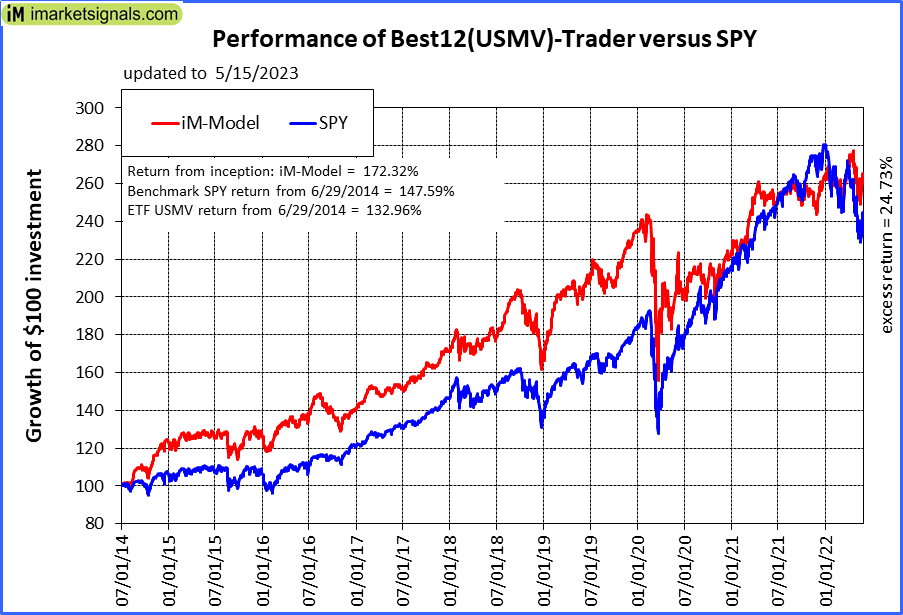 |
iM-Best12(USMV)-Trader: The model’s out of sample performance YTD is 1.2%, and for the last 12 months is 6.1%. Over the same period the benchmark SPY performance was 8.4% and 4.6% respectively. Since inception, on 6/30/2014, the model gained 172.32% while the benchmark SPY gained 147.59% and the ETF USMV gained 132.96% over the same period. Over the previous week the market value of iM-Best12(USMV)-Trader gained 0.05% at a time when SPY gained 0.07%. A starting capital of $100,000 at inception on 6/30/2014 would have grown to $272,317 which includes $500 cash and excludes $7,799 spent on fees and slippage. |
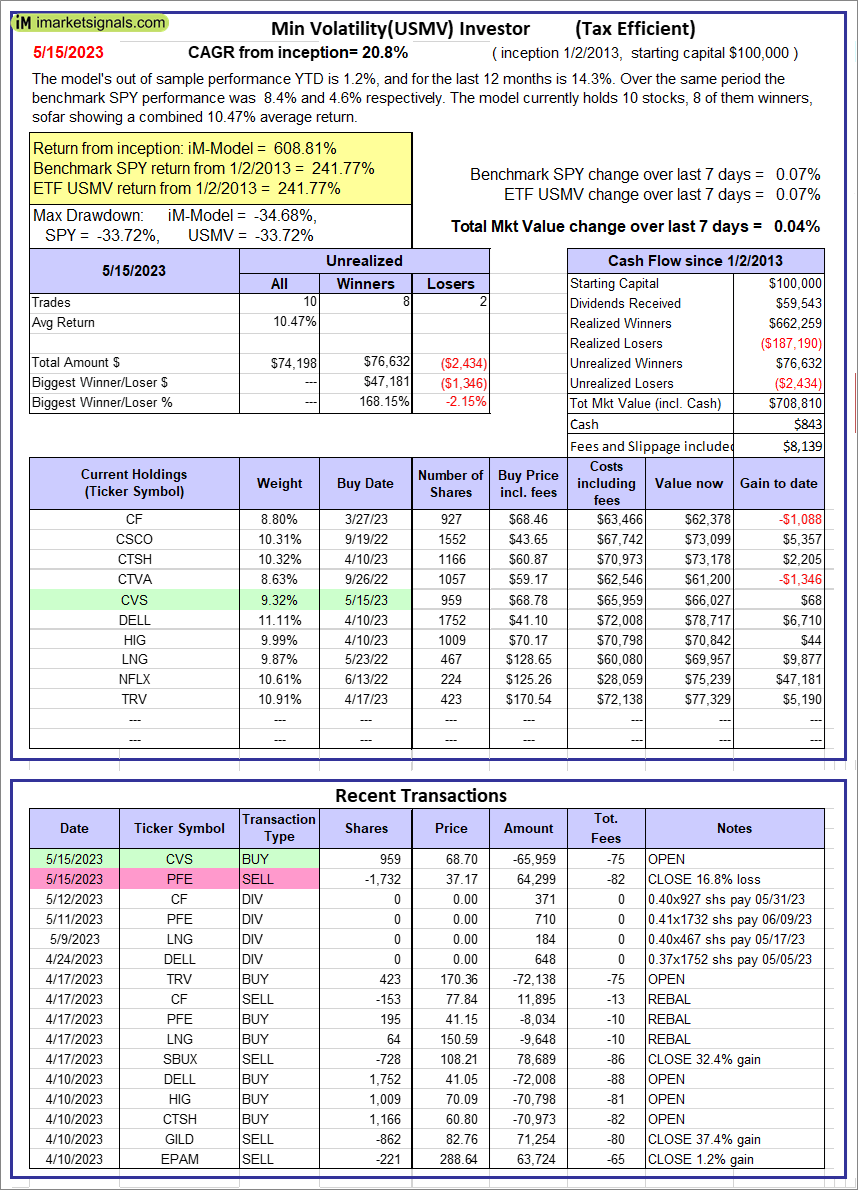 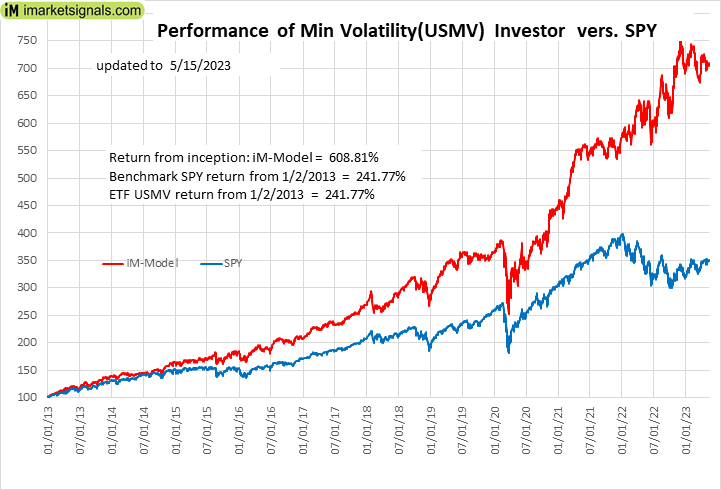 |
iM-Min Volatility(USMV) Investor (Tax Efficient): The model’s out of sample performance YTD is 1.2%, and for the last 12 months is 14.3%. Over the same period the benchmark SPY performance was 8.4% and 4.6% respectively. Since inception, on 1/3/2013, the model gained 608.81% while the benchmark SPY gained 241.77% and the ETF USMV gained 241.77% over the same period. Over the previous week the market value of iM-Best12(USMV)Q1 gained 0.04% at a time when SPY gained 0.07%. A starting capital of $100,000 at inception on 1/3/2013 would have grown to $708,810 which includes $843 cash and excludes $8,139 spent on fees and slippage. |
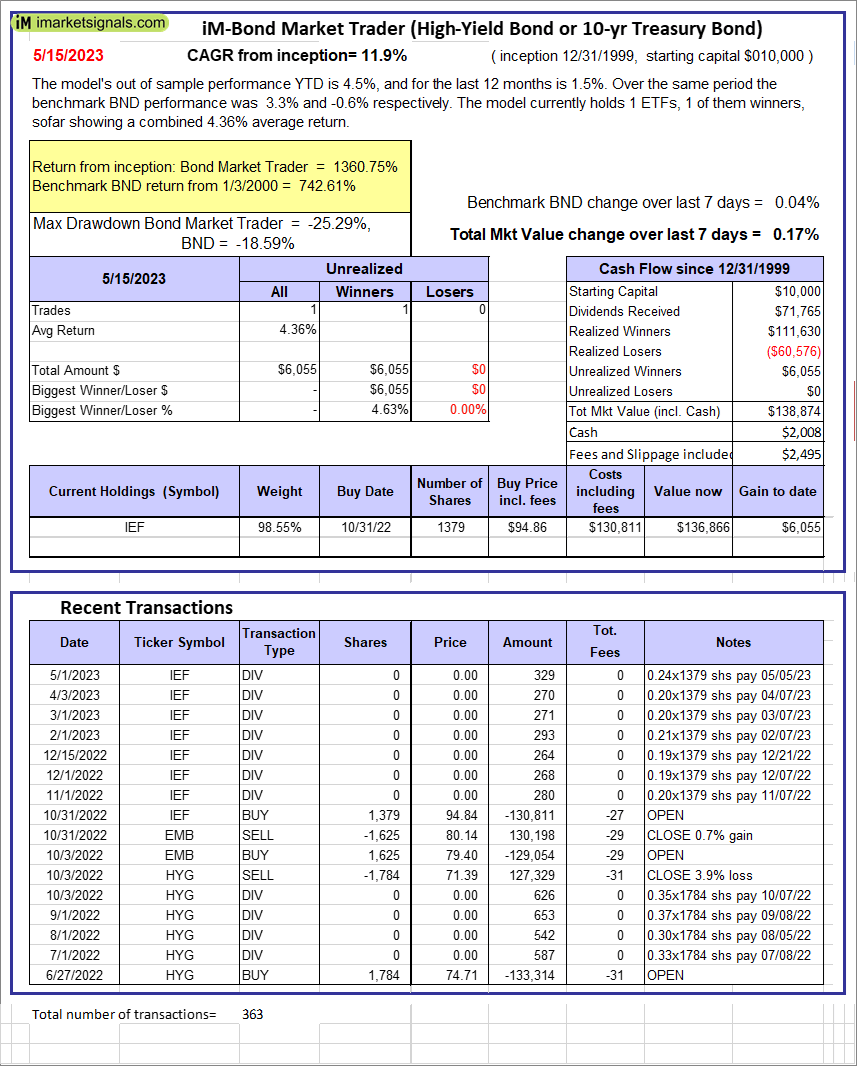 |
iM-Bond Market Trader (High-Yield Bond or 10-yr Treasury Bond): The model’s out of sample performance YTD is 4.5%, and for the last 12 months is 1.5%. Over the same period the benchmark BND performance was 3.3% and -0.6% respectively. Over the previous week the market value of the iM-Bond Market Trader (High-Yield Bond or 10-yr Treasury Bond) gained 0.17% at a time when BND gained 0.04%. A starting capital of $10,000 at inception on 1/3/2000 would have grown to $138,874 which includes $2,008 cash and excludes $2,495 spent on fees and slippage. |
|
|
iM-ModSum/YieldCurve Timer: The model’s out of sample performance YTD is 3.2%, and for the last 12 months is 0.2%. Over the same period the benchmark SPY performance was 8.4% and 4.6% respectively. Over the previous week the market value of iM-PortSum/YieldCurve Timer gained 0.07% at a time when SPY gained 0.07%. A starting capital of $100,000 at inception on 1/1/2016 would have grown to $260,318 which includes -$1,943 cash and excludes $1,281 spent on fees and slippage. |
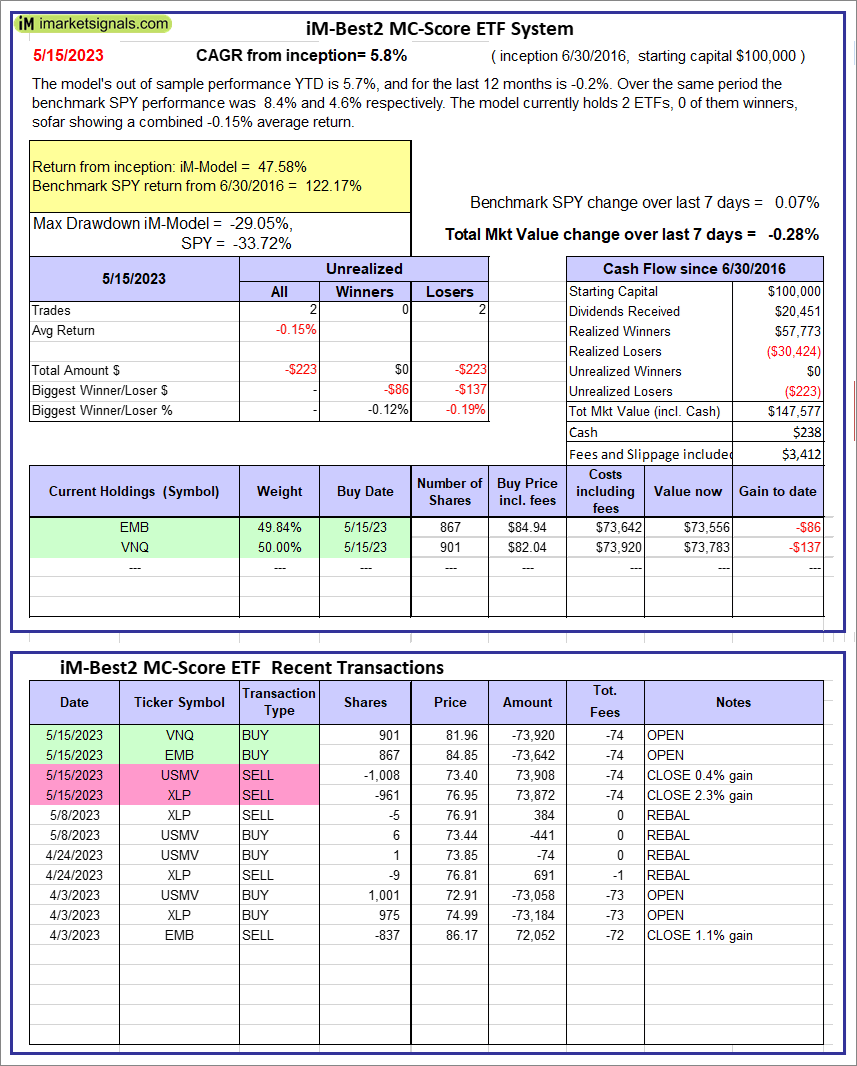 |
iM-Best2 MC-Score ETF System: The model’s out of sample performance YTD is 5.7%, and for the last 12 months is -0.2%. Over the same period the benchmark SPY performance was 8.4% and 4.6% respectively. Over the previous week the market value of the iM-Best2 MC-Score ETF System gained -0.28% at a time when SPY gained 0.07%. A starting capital of $100,000 at inception on 6/30/2016 would have grown to $147,577 which includes $238 cash and excludes $3,412 spent on fees and slippage. |
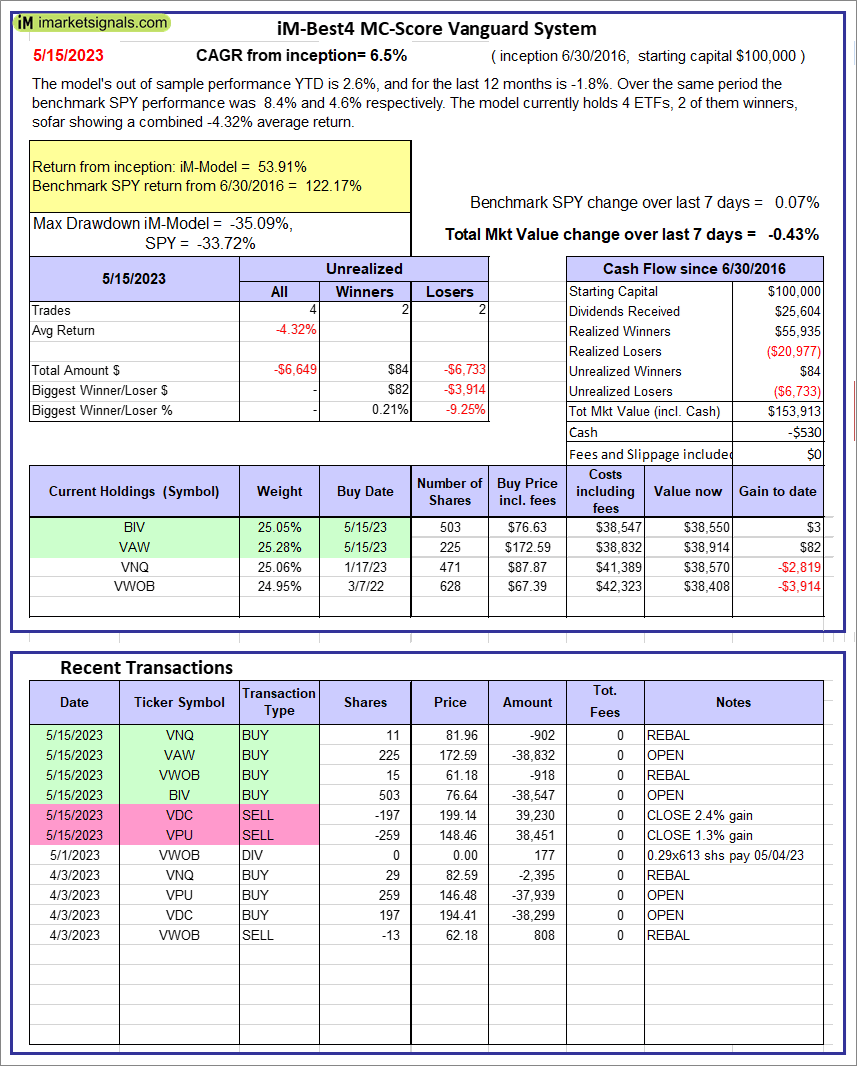 |
iM-Best4 MC-Score Vanguard System: The model’s out of sample performance YTD is 2.6%, and for the last 12 months is -1.8%. Over the same period the benchmark SPY performance was 8.4% and 4.6% respectively. Over the previous week the market value of the iM-Best4 MC-Score Vanguard System gained -0.43% at a time when SPY gained 0.07%. A starting capital of $100,000 at inception on 6/30/2016 would have grown to $153,913 which includes -$530 cash and excludes $00 spent on fees and slippage. |
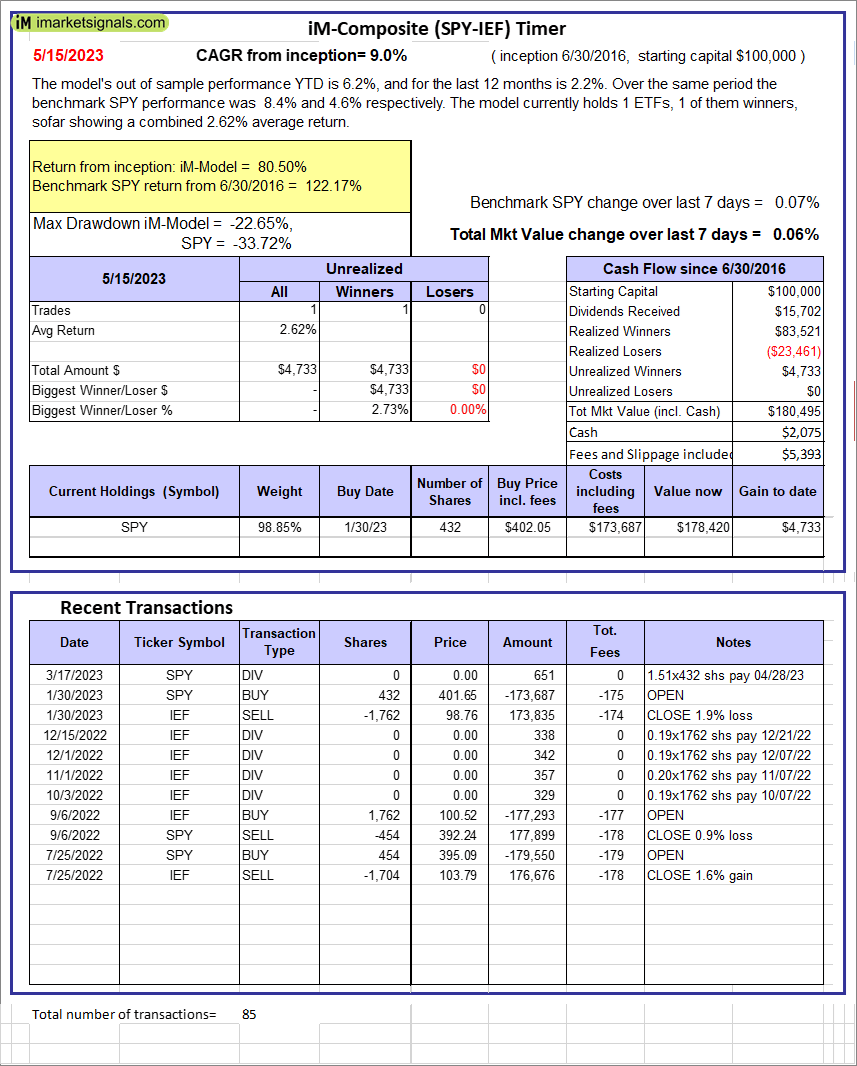 |
iM-Composite (SPY-IEF) Timer: The model’s out of sample performance YTD is 6.2%, and for the last 12 months is 2.2%. Over the same period the benchmark SPY performance was 8.4% and 4.6% respectively. Over the previous week the market value of the iM-Composite (SPY-IEF) Timer gained 0.06% at a time when SPY gained 0.07%. A starting capital of $100,000 at inception on 6/30/2016 would have grown to $180,495 which includes $2,075 cash and excludes $5,393 spent on fees and slippage. |
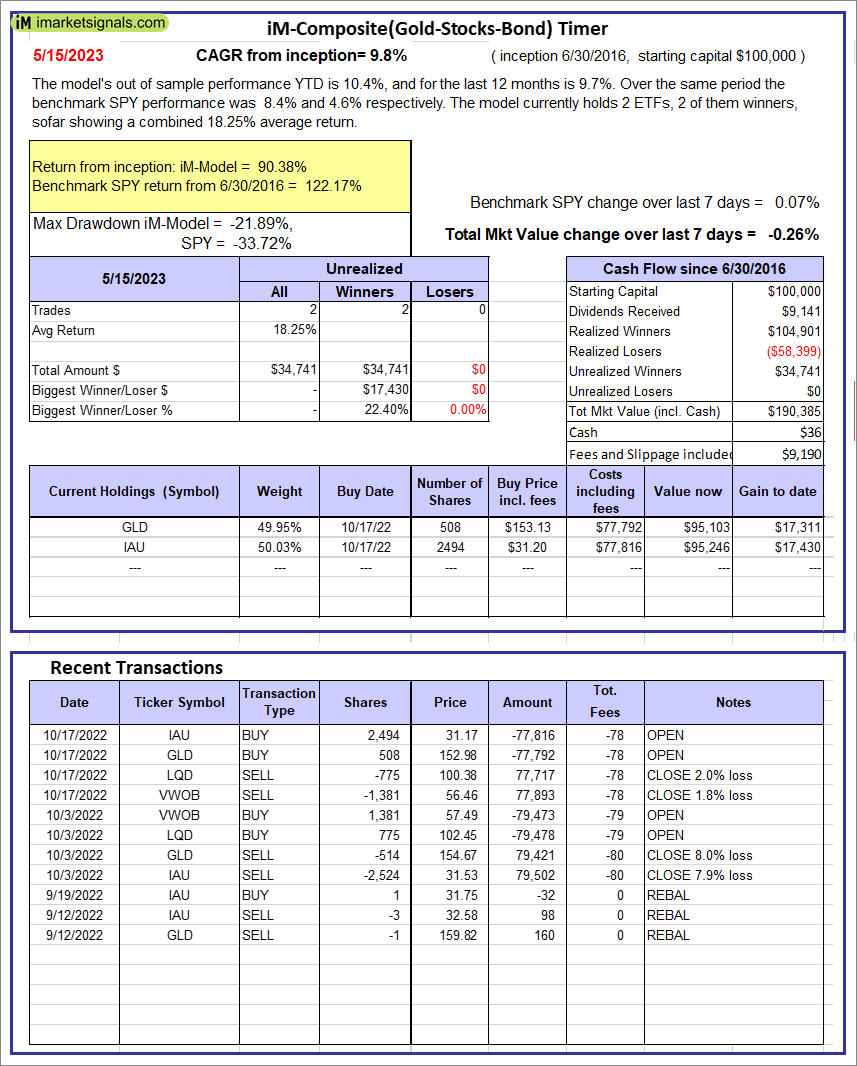 |
iM-Composite(Gold-Stocks-Bond) Timer: The model’s out of sample performance YTD is 10.4%, and for the last 12 months is 9.7%. Over the same period the benchmark SPY performance was 8.4% and 4.6% respectively. Over the previous week the market value of the iM-Composite(Gold-Stocks-Bond) Timer gained -0.26% at a time when SPY gained 0.07%. A starting capital of $100,000 at inception on 6/30/2016 would have grown to $190,385 which includes $36 cash and excludes $9,190 spent on fees and slippage. |
iM-Best Reports – 5/16/2023
Posted in pmp SPY-SH
Leave a Reply
You must be logged in to post a comment.