
  |
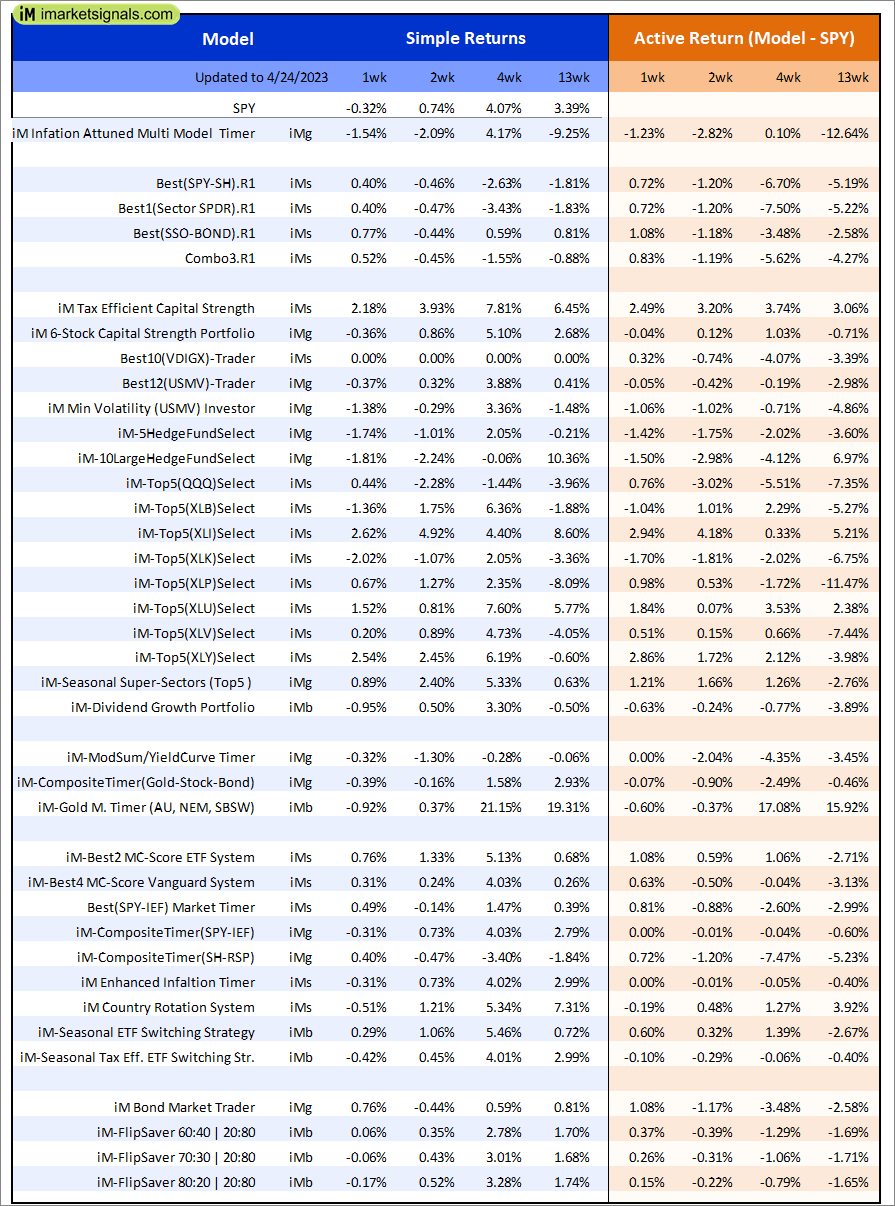
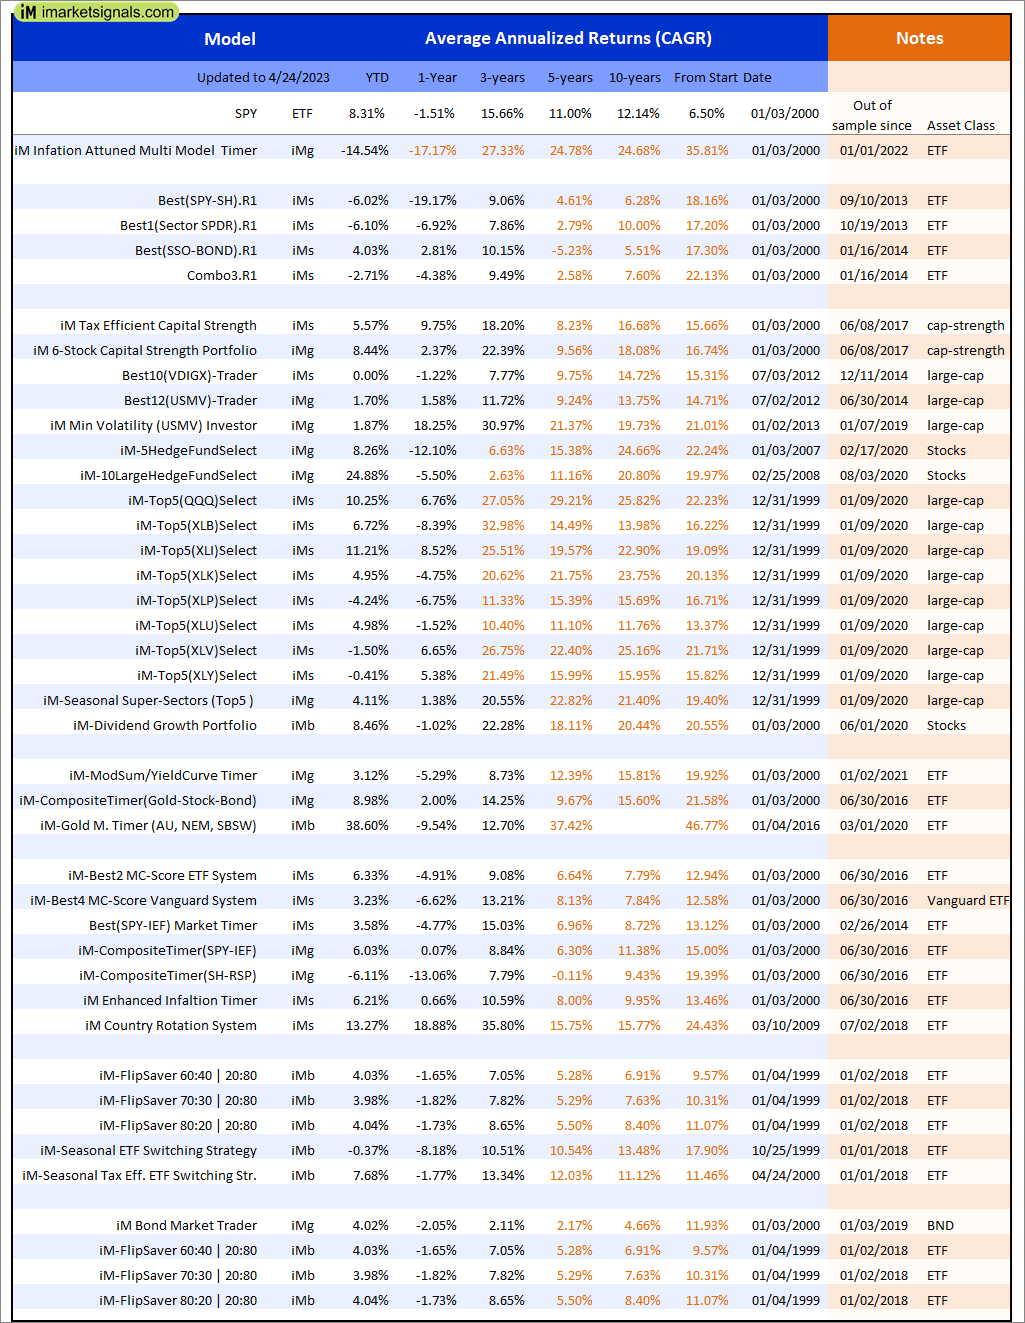
Out of sample performance summary of our models for the past 1, 2, 4 and 13 week periods. The active active return indicates how the models over- or underperformed the benchmark ETF SPY. Also the YTD, and the 1-, 3-, 5- and 10-year annualized returns are shown in the second table |
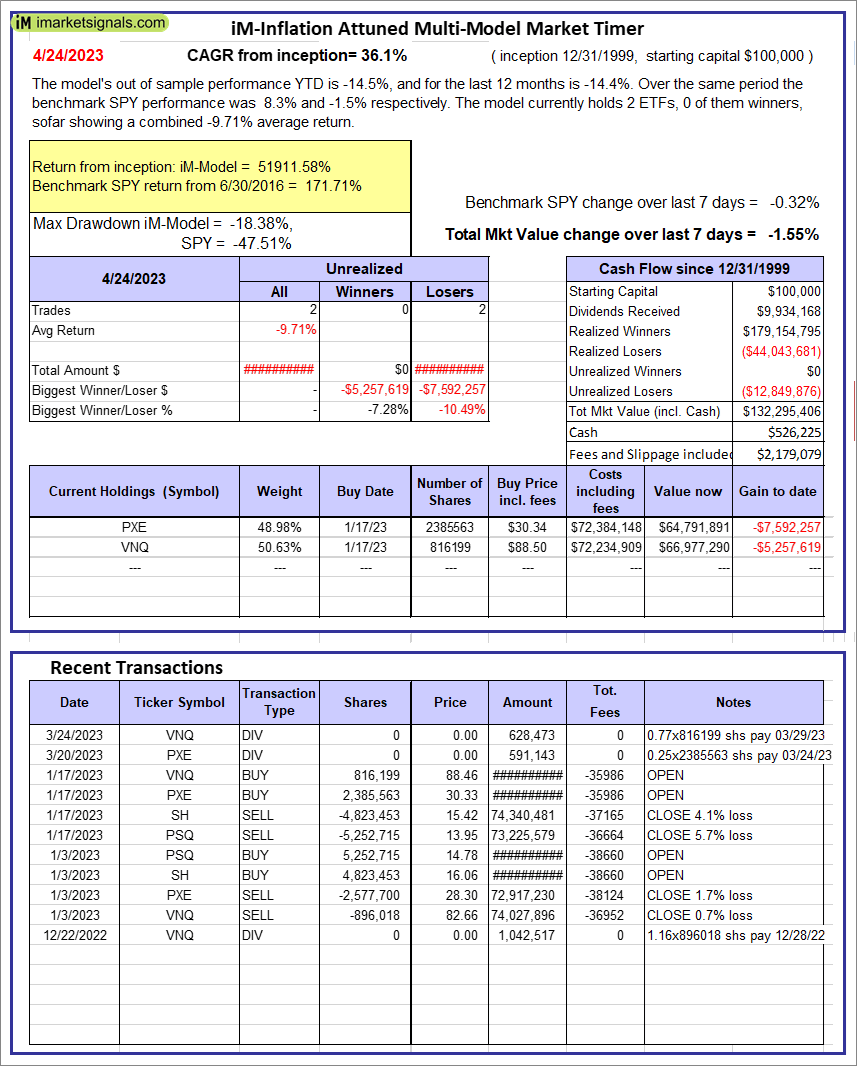 |
iM-Inflation Attuned Multi-Model Market Timer: The model’s out of sample performance YTD is -14.5%, and for the last 12 months is -14.4%. Over the same period the benchmark SPY performance was 8.3% and -1.5% respectively. Over the previous week the market value of the iM-Inflation Attuned Multi-Model Market Timer gained -1.55% at a time when SPY gained -0.32%. A starting capital of $100,000 at inception on 3/24/2017 would have grown to $132,295,406 which includes $526,225 cash and excludes $2,179,079 spent on fees and slippage. |
 |
iM-FlipSaver 60:40 | 20:80 – 2017: The model’s out of sample performance YTD is 3.9%, and for the last 12 months is -1.9%. Over the same period the benchmark E60B40 performance was 6.4% and -0.6% respectively. Over the previous week the market value of iM-FlipSaver 80:20 | 20:80 gained 0.06% at a time when SPY gained 0.08%. A starting capital of $100,000 at inception on 7/16/2015 would have grown to $146,526 which includes $1,093 cash and excludes $2,960 spent on fees and slippage. |
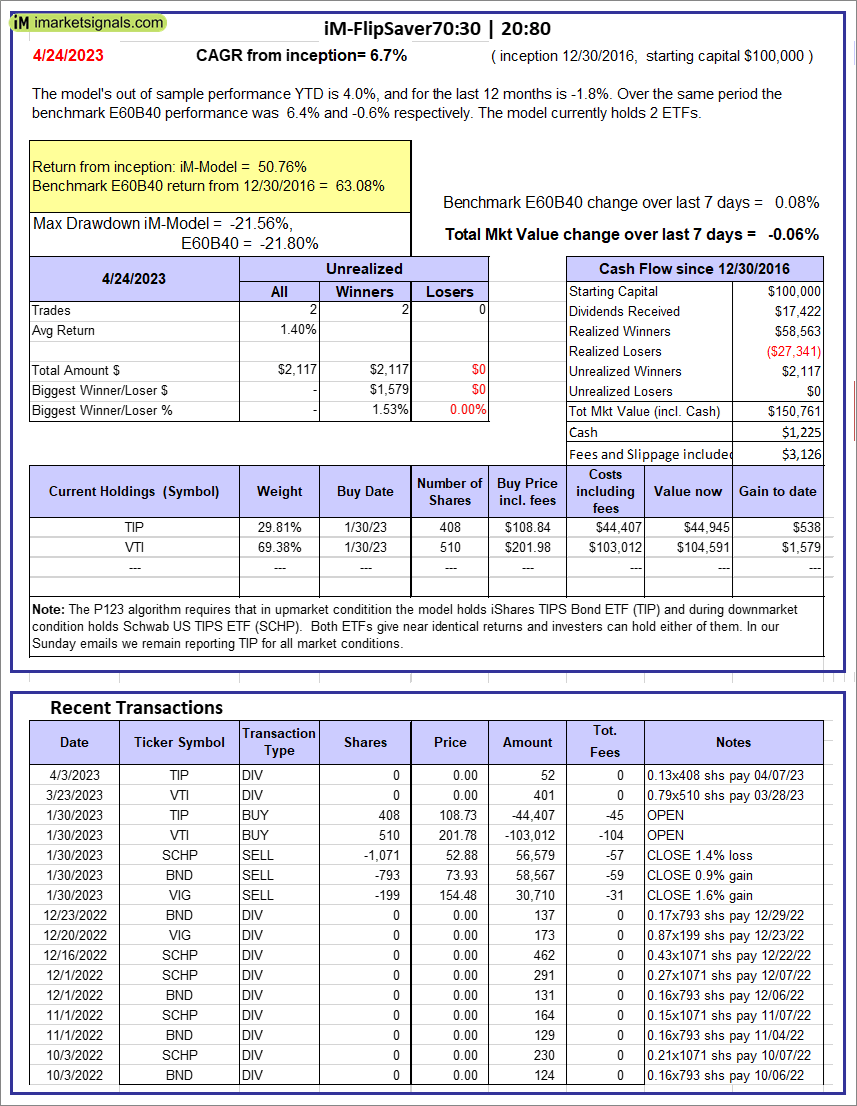 |
iM-FlipSaver 70:30 | 20:80 – 2017: The model’s out of sample performance YTD is 4.0%, and for the last 12 months is -1.8%. Over the same period the benchmark E60B40 performance was 6.4% and -0.6% respectively. Over the previous week the market value of iM-FlipSaver 70:30 | 20:80 gained -0.06% at a time when SPY gained 0.08%. A starting capital of $100,000 at inception on 7/15/2015 would have grown to $150,761 which includes $1,225 cash and excludes $3,126 spent on fees and slippage. |
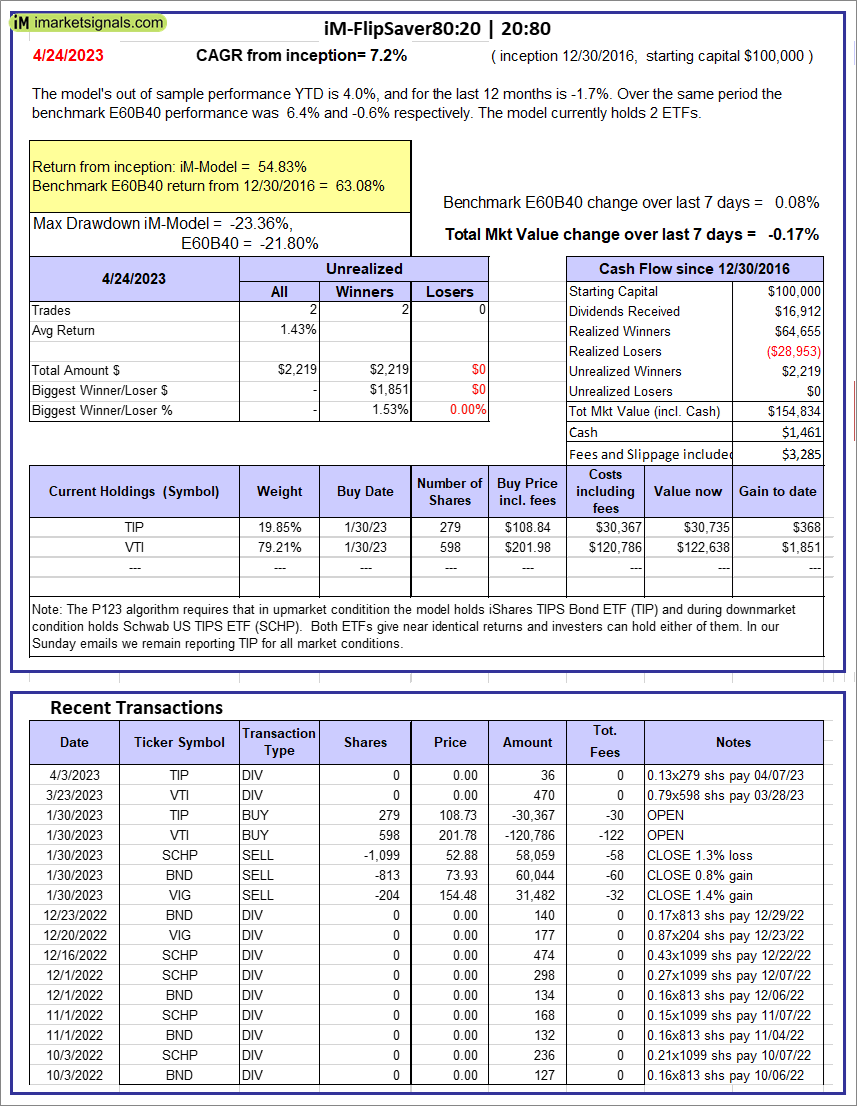 |
iM-FlipSaver 80:20 | 20:80 – 2017: The model’s out of sample performance YTD is 4.0%, and for the last 12 months is -1.7%. Over the same period the benchmark E60B40 performance was 6.4% and -0.6% respectively. Over the previous week the market value of iM-FlipSaver 80:20 | 20:80 gained -0.17% at a time when SPY gained 0.08%. A starting capital of $100,000 at inception on 1/2/2017 would have grown to $154,834 which includes $1,461 cash and excludes $3,285 spent on fees and slippage. |
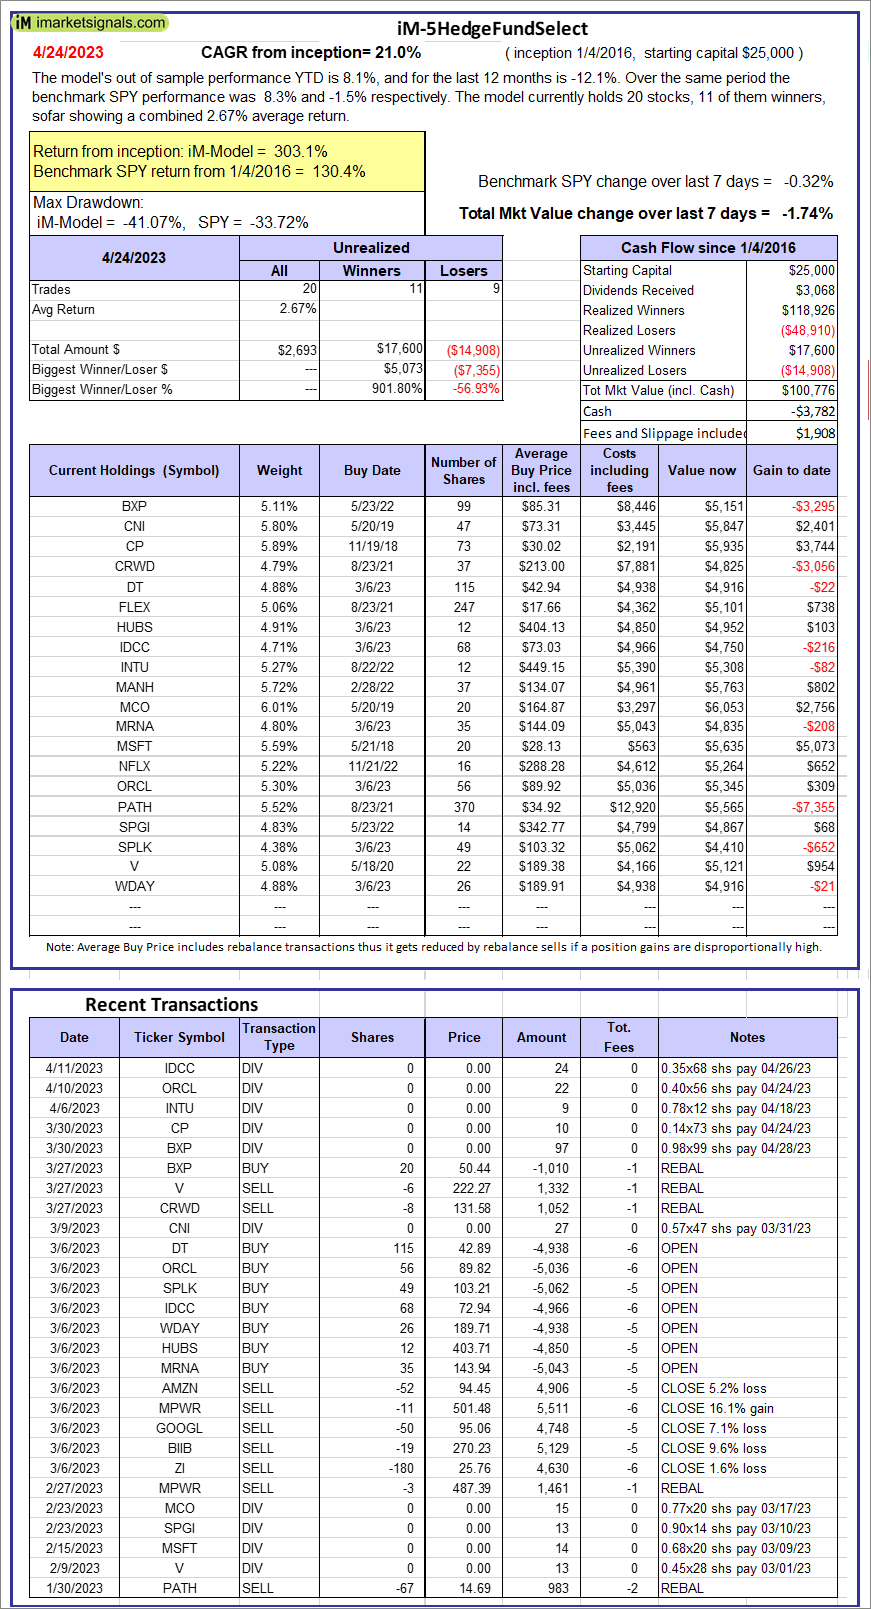 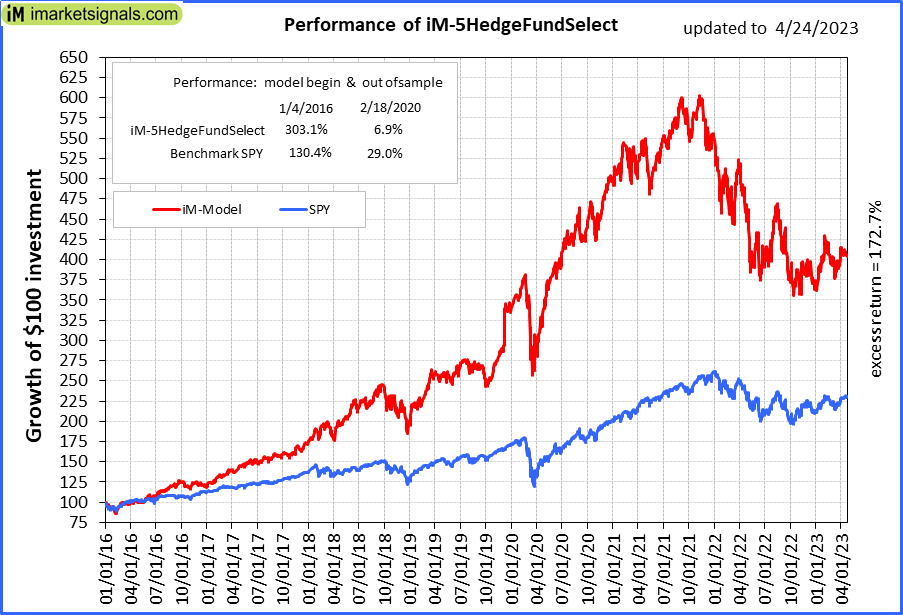 |
iM-5HedgeFundSelect: Since inception, on 1/5/2016, the model gained 303.10% while the benchmark SPY gained 130.43% over the same period. Over the previous week the market value of iM-5HedgeFundSelect gained -1.74% at a time when SPY gained -0.32%. A starting capital of $25,000 at inception on 1/5/2016 would have grown to $100,776 which includes -$3,782 cash and excludes $1,908 spent on fees and slippage. |
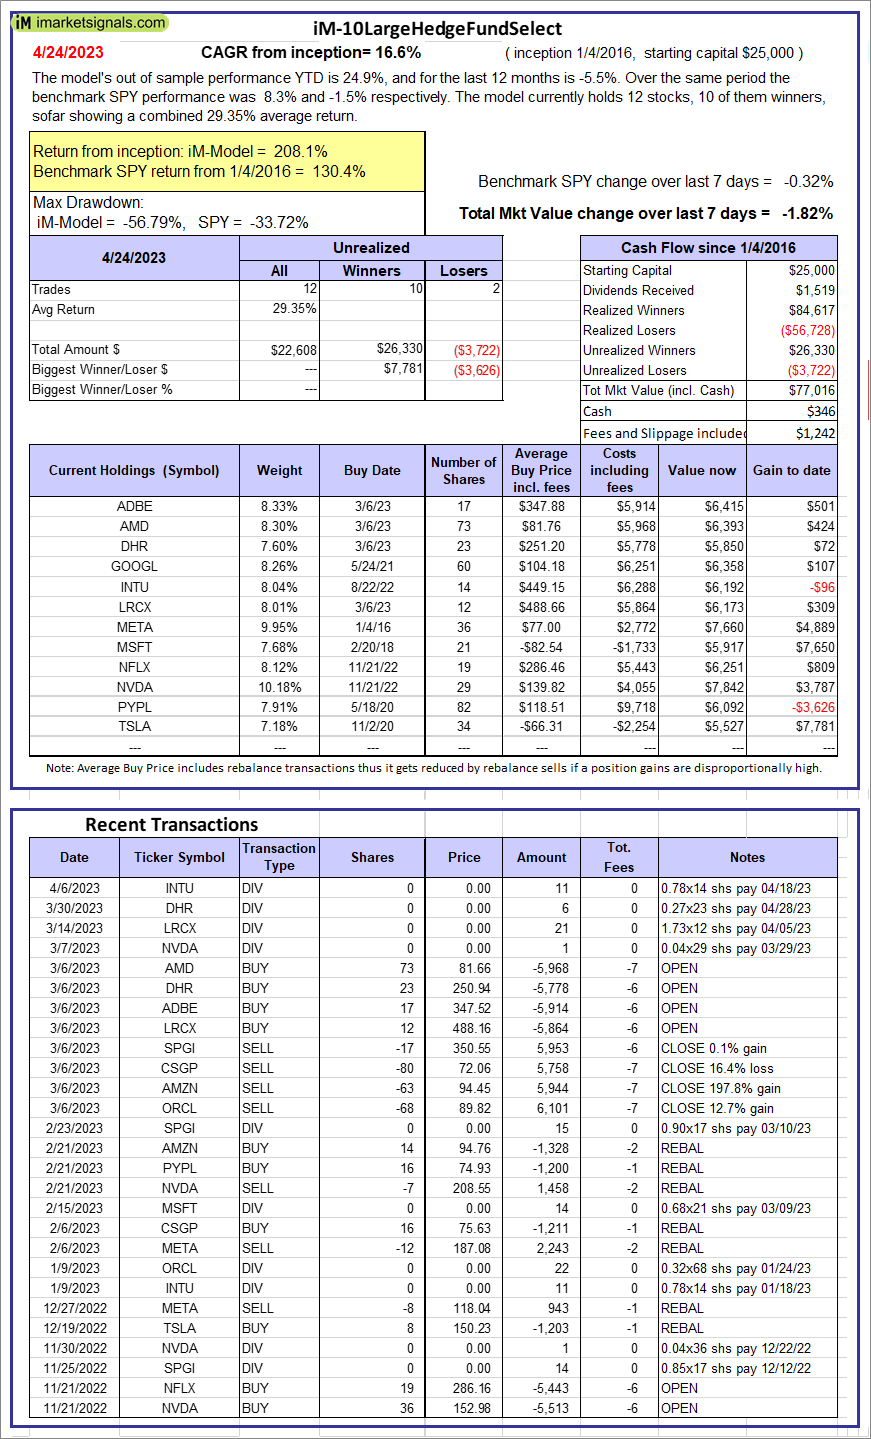 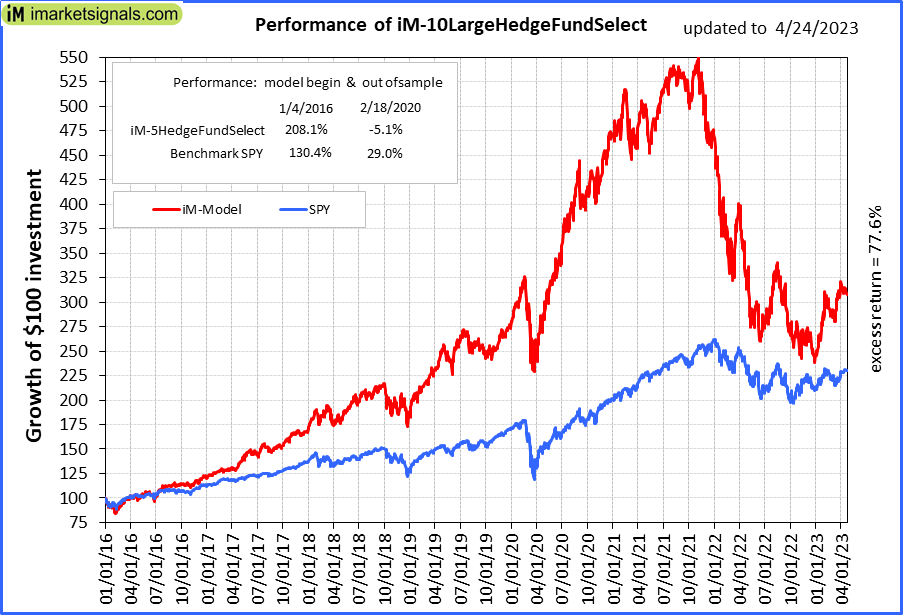 |
iM-10LargeHedgeFundSelect: Since inception, on 1/5/2016, the model gained 208.07% while the benchmark SPY gained 130.43% over the same period. Over the previous week the market value of iM-10LargeHedgeFundSelect gained -1.82% at a time when SPY gained -0.32%. A starting capital of $25,000 at inception on 1/5/2016 would have grown to $77,016 which includes $346 cash and excludes $1,242 spent on fees and slippage. |
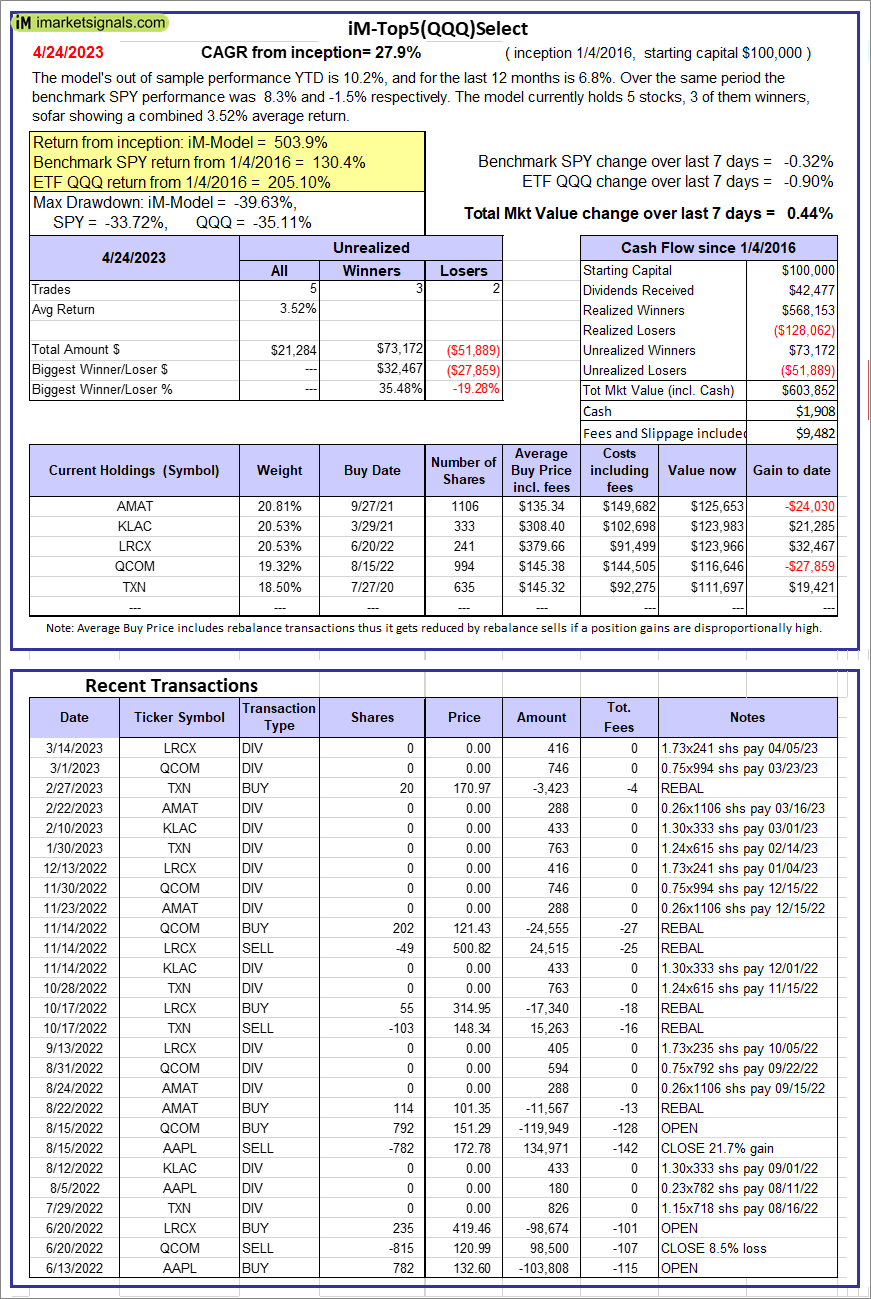 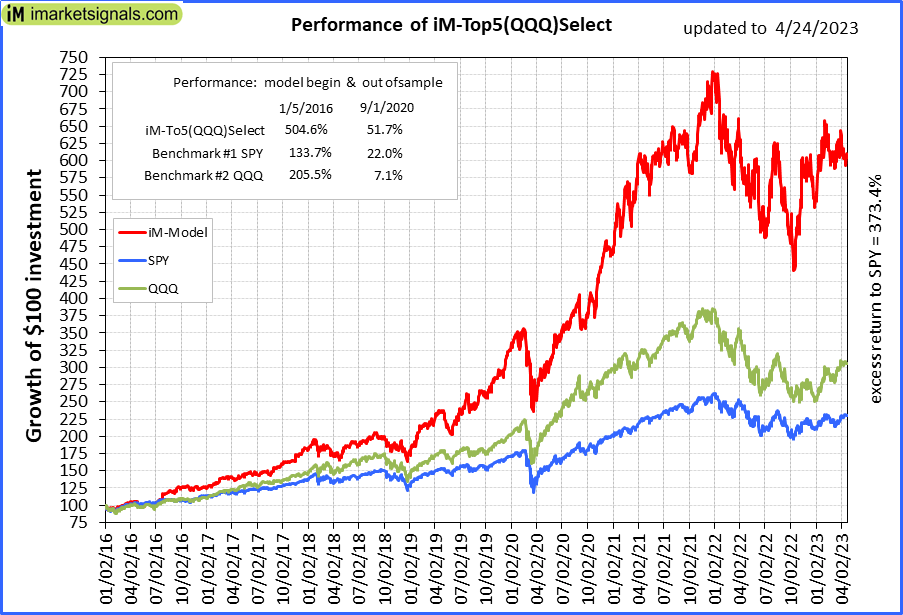 |
iM-Top5(QQQ)Select: Since inception, on 1/5/2016, the model gained 503.85% while the benchmark SPY gained 130.43% over the same period. Over the previous week the market value of iM-Top5(QQQ)Select gained 0.44% at a time when SPY gained -0.32%. A starting capital of $100,000 at inception on 1/5/2016 would have grown to $603,852 which includes $1,908 cash and excludes $9,482 spent on fees and slippage. |
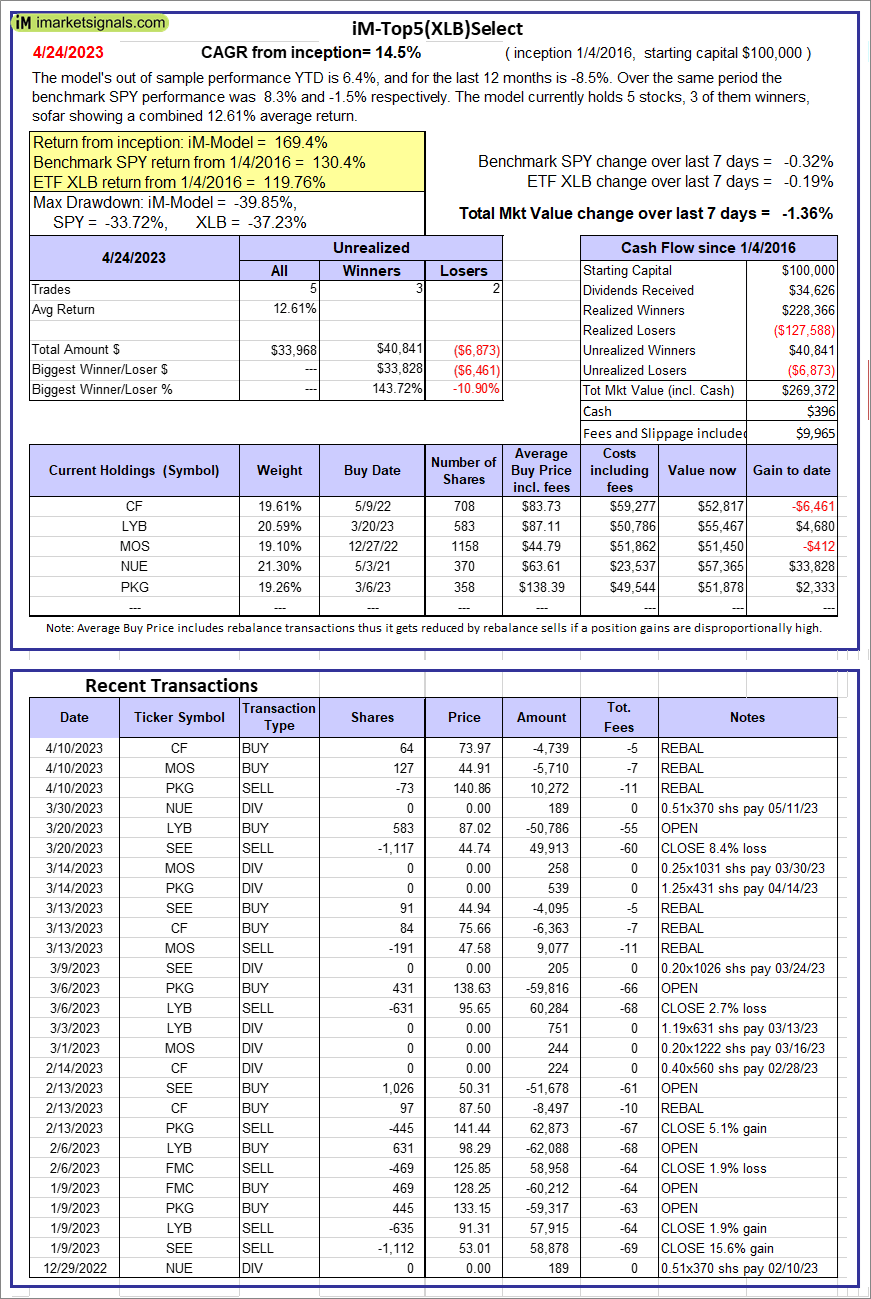 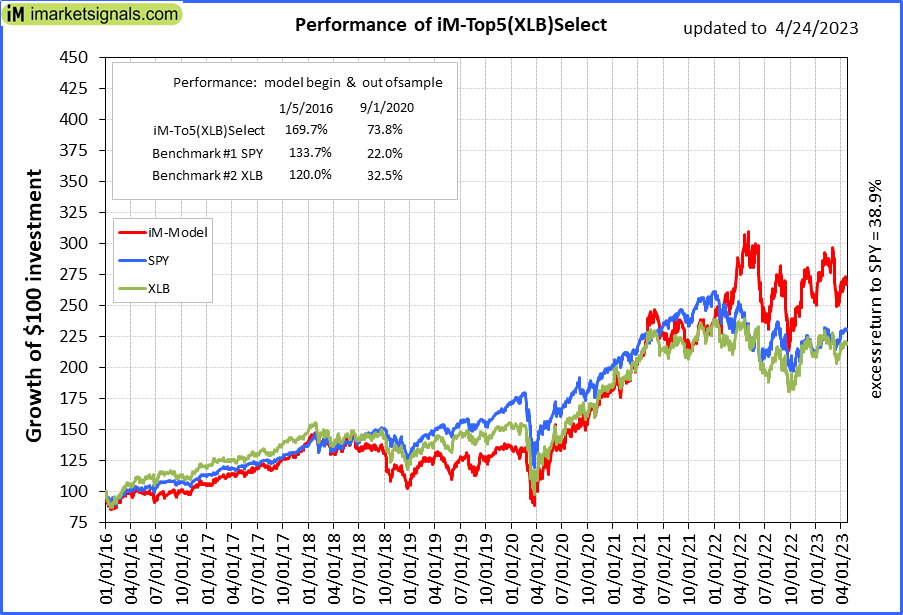 |
iM-Top5(XLB)Select: Since inception, on 1/5/2016, the model gained 169.37% while the benchmark SPY gained 130.43% over the same period. Over the previous week the market value of iM-Top5(XLB)Select gained -1.36% at a time when SPY gained -0.32%. A starting capital of $100,000 at inception on 1/5/2016 would have grown to $269,372 which includes $396 cash and excludes $9,965 spent on fees and slippage. |
 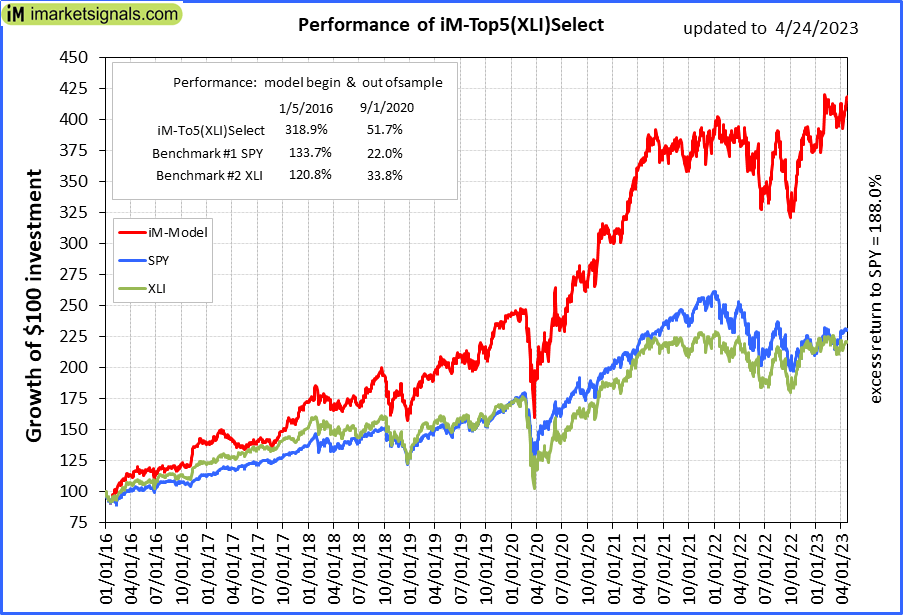 |
iM-Top5(XLI)Select: Since inception, on 1/5/2016, the model gained 318.39% while the benchmark SPY gained 130.43% over the same period. Over the previous week the market value of iM-Top5(XLI)Select gained 2.62% at a time when SPY gained -0.32%. A starting capital of $100,000 at inception on 1/5/2016 would have grown to $418,386 which includes $625 cash and excludes $5,584 spent on fees and slippage. |
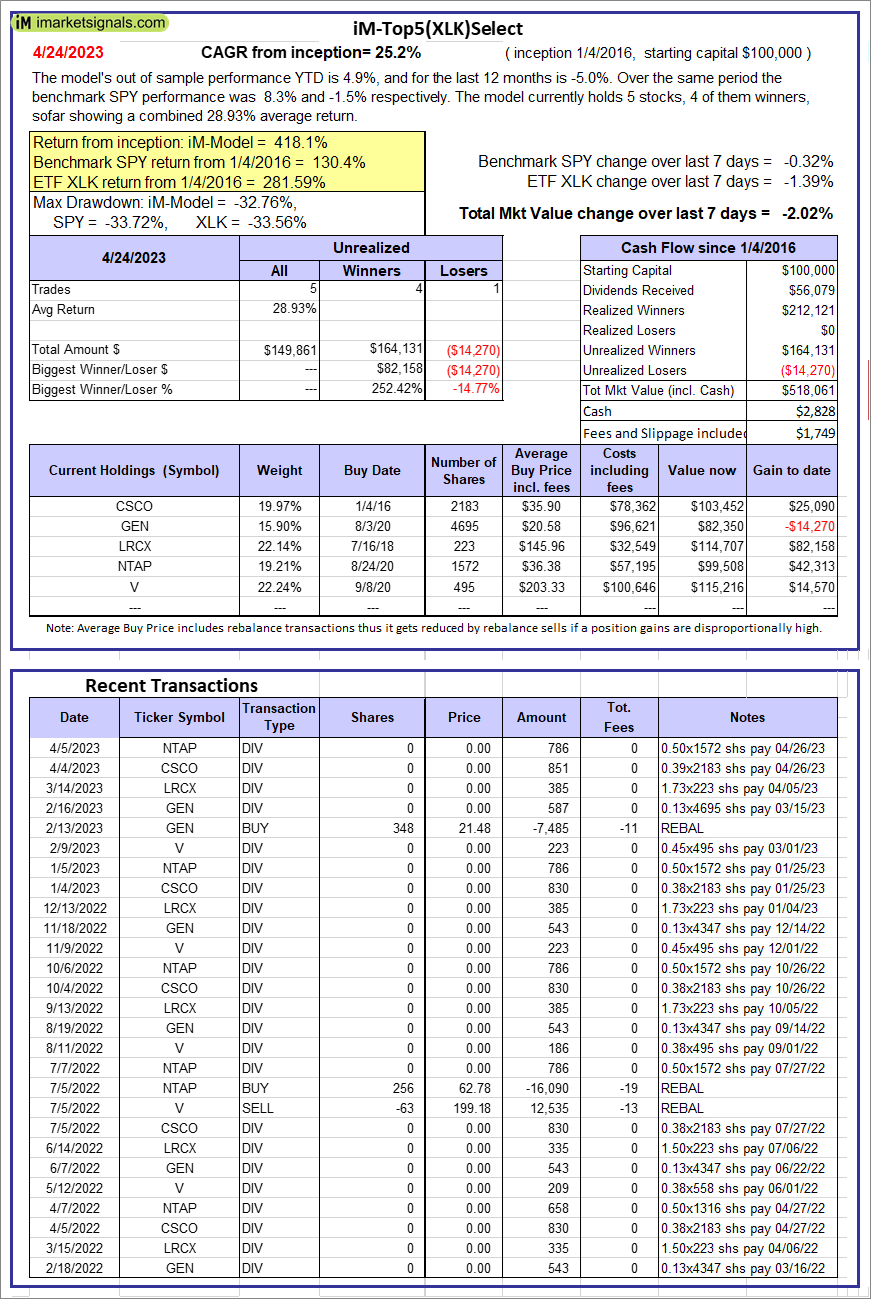 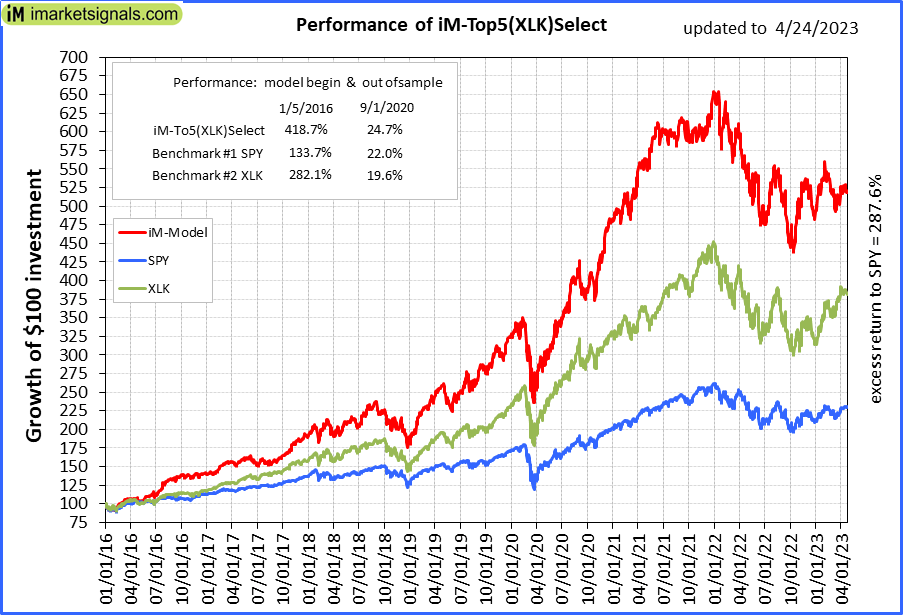 |
iM-Top5(XLK)Select: Since inception, on 1/5/2016, the model gained 418.06% while the benchmark SPY gained 130.43% over the same period. Over the previous week the market value of iM-Top5(XLK)Select gained -2.02% at a time when SPY gained -0.32%. A starting capital of $100,000 at inception on 1/5/2016 would have grown to $518,061 which includes $2,828 cash and excludes $1,749 spent on fees and slippage. |
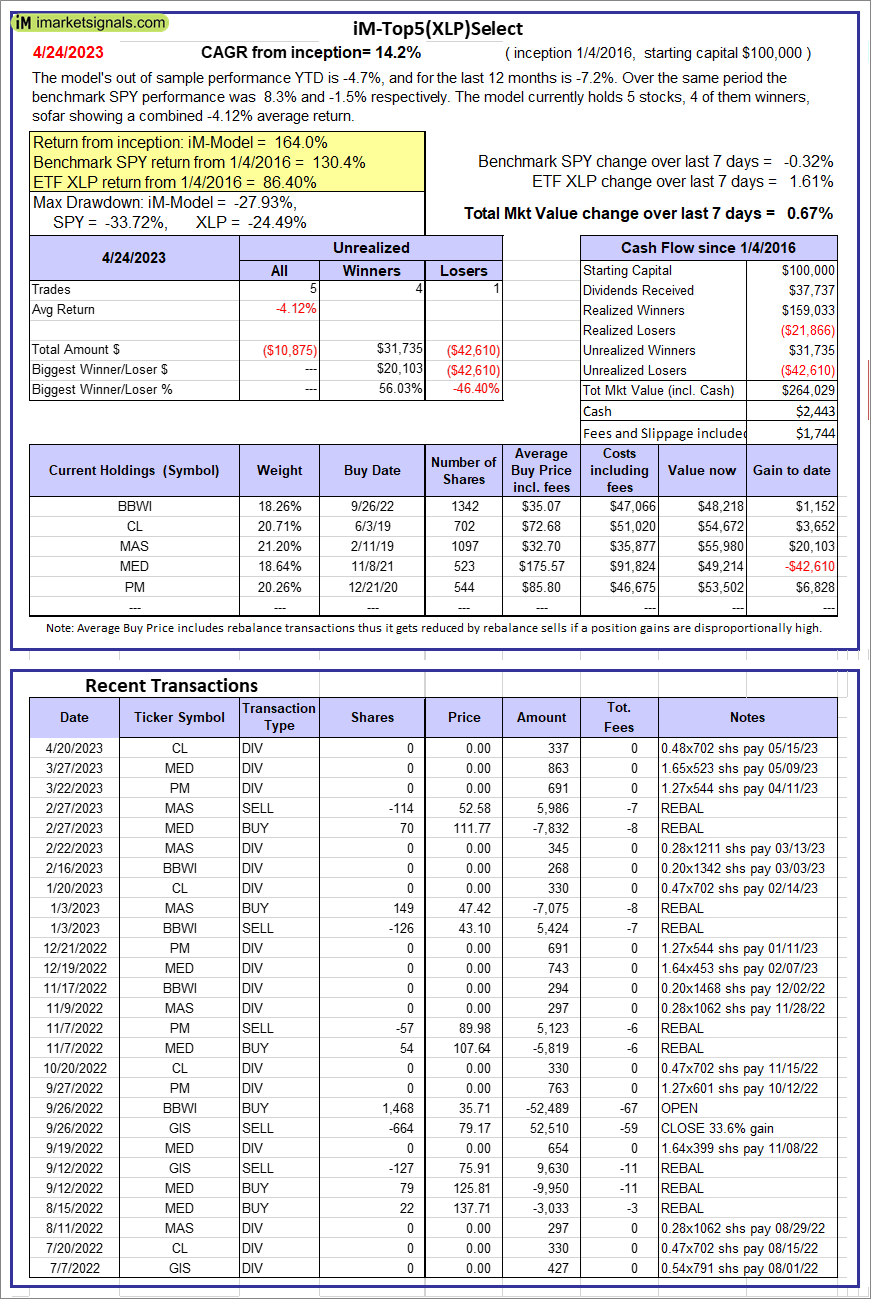  |
iM-Top5(XLP)Select: Since inception, on 1/5/2016, the model gained 164.03% while the benchmark SPY gained 130.43% over the same period. Over the previous week the market value of iM-Top5(XLP)Select gained 0.67% at a time when SPY gained -0.32%. A starting capital of $100,000 at inception on 1/5/2016 would have grown to $264,029 which includes $2,443 cash and excludes $1,744 spent on fees and slippage. |
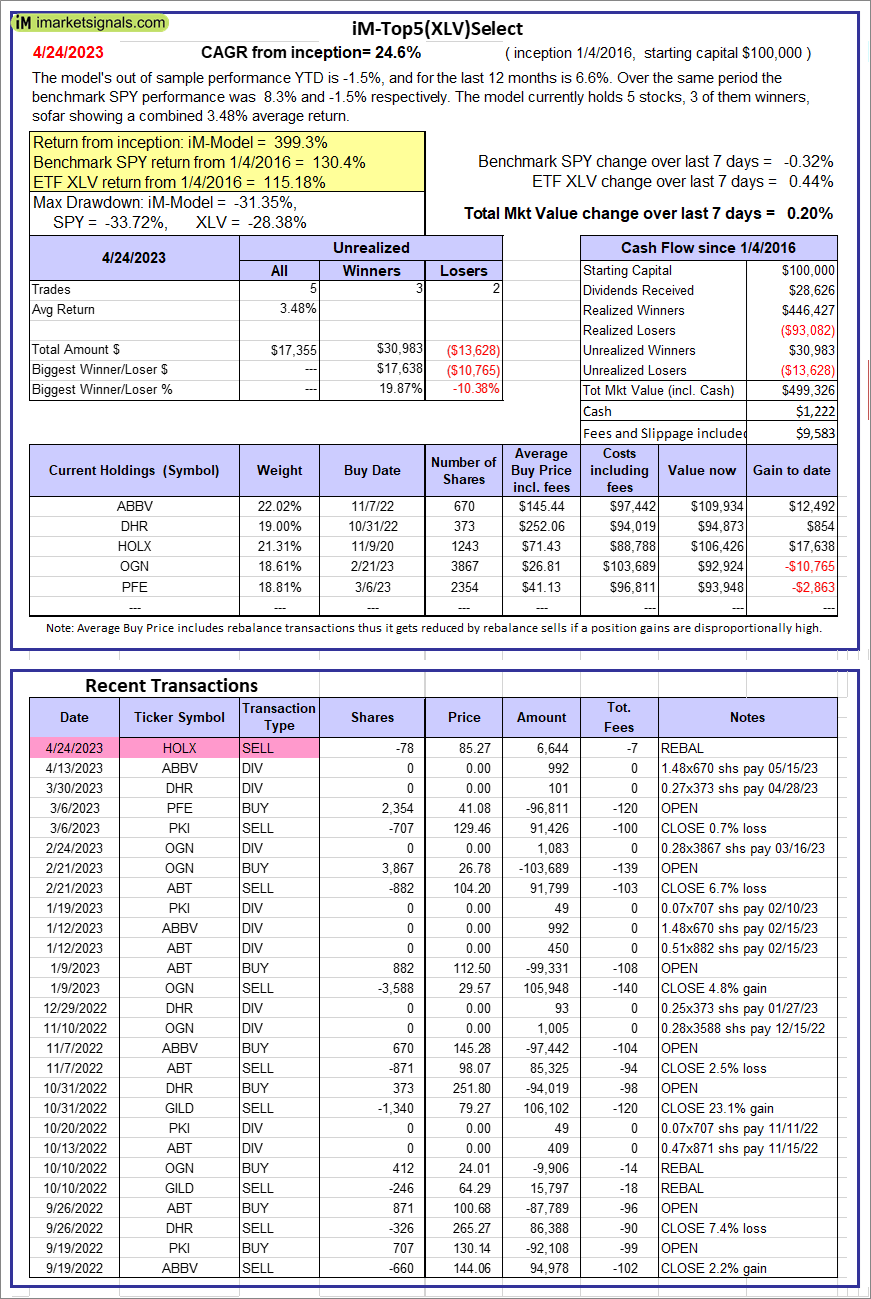 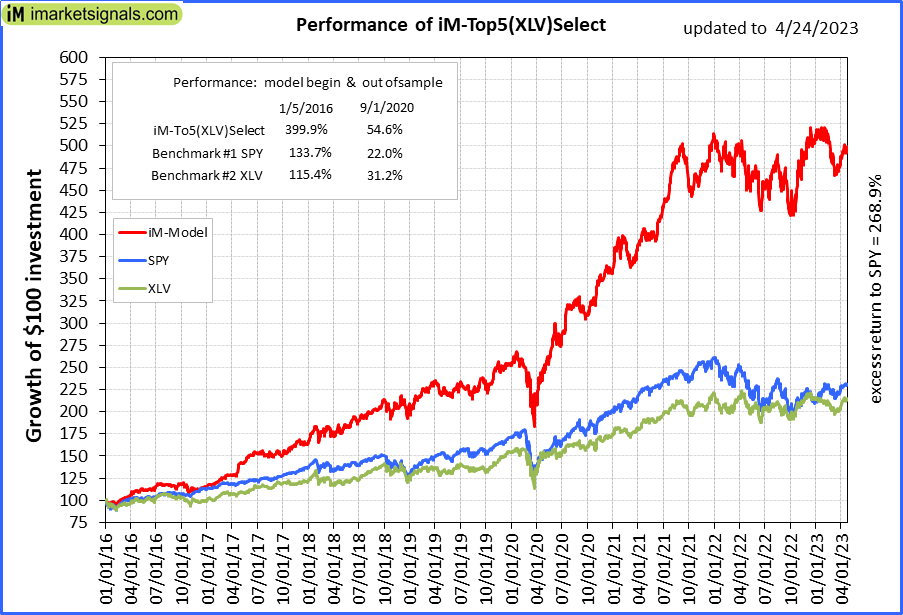 |
iM-Top5(XLV)Select: Since inception, on 1/5/2016, the model gained 399.33% while the benchmark SPY gained 130.43% over the same period. Over the previous week the market value of iM-Top5(XLV)Select gained 0.20% at a time when SPY gained -0.32%. A starting capital of $100,000 at inception on 1/5/2016 would have grown to $499,326 which includes $1,222 cash and excludes $9,583 spent on fees and slippage. |
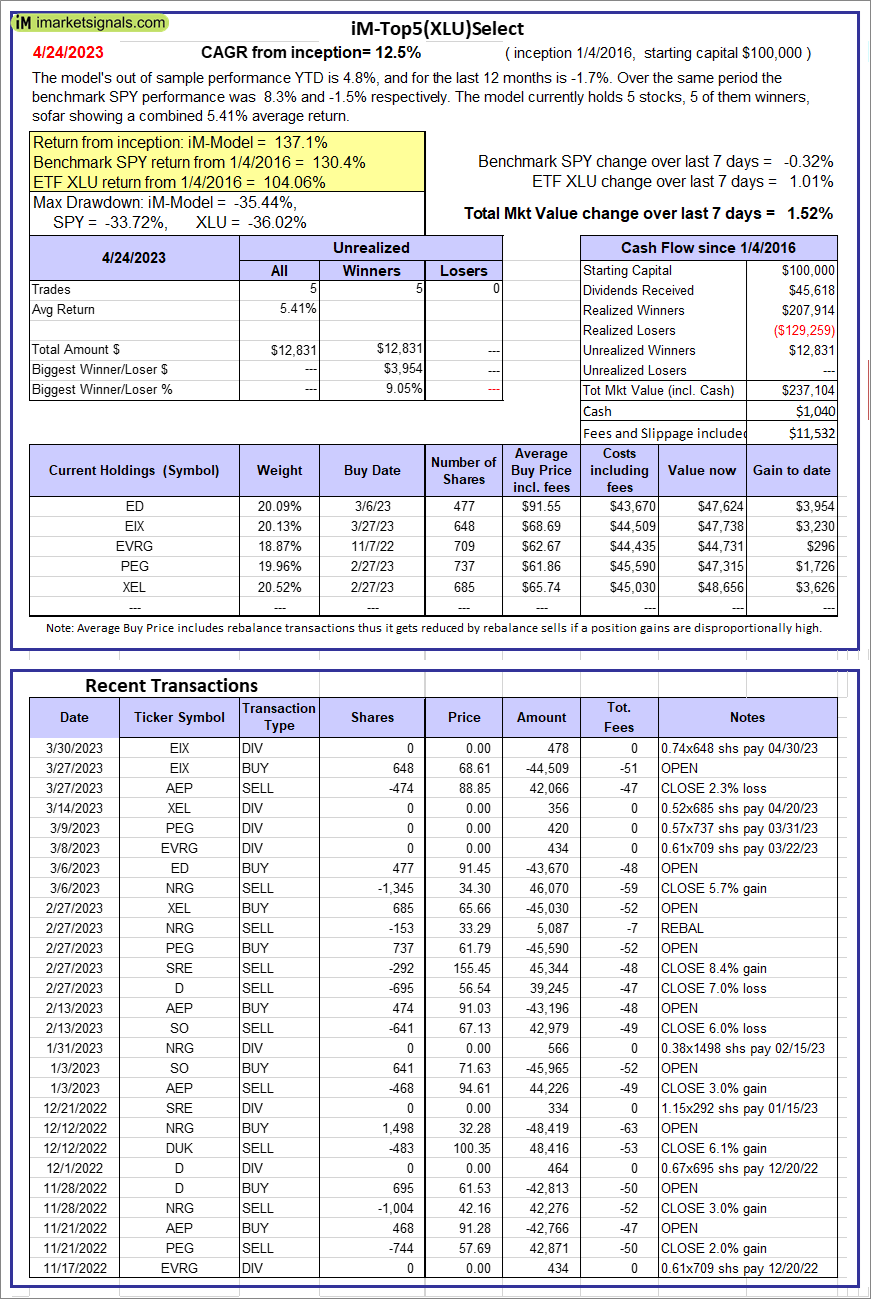  |
iM-Top5(XLU)Select: Since inception, on 1/5/2016, the model gained 137.10% while the benchmark SPY gained 130.43% over the same period. Over the previous week the market value of iM-Top5(XLU)Select gained 1.52% at a time when SPY gained -0.32%. A starting capital of $100,000 at inception on 1/5/2016 would have grown to $237,104 which includes $1,040 cash and excludes $11,532 spent on fees and slippage. |
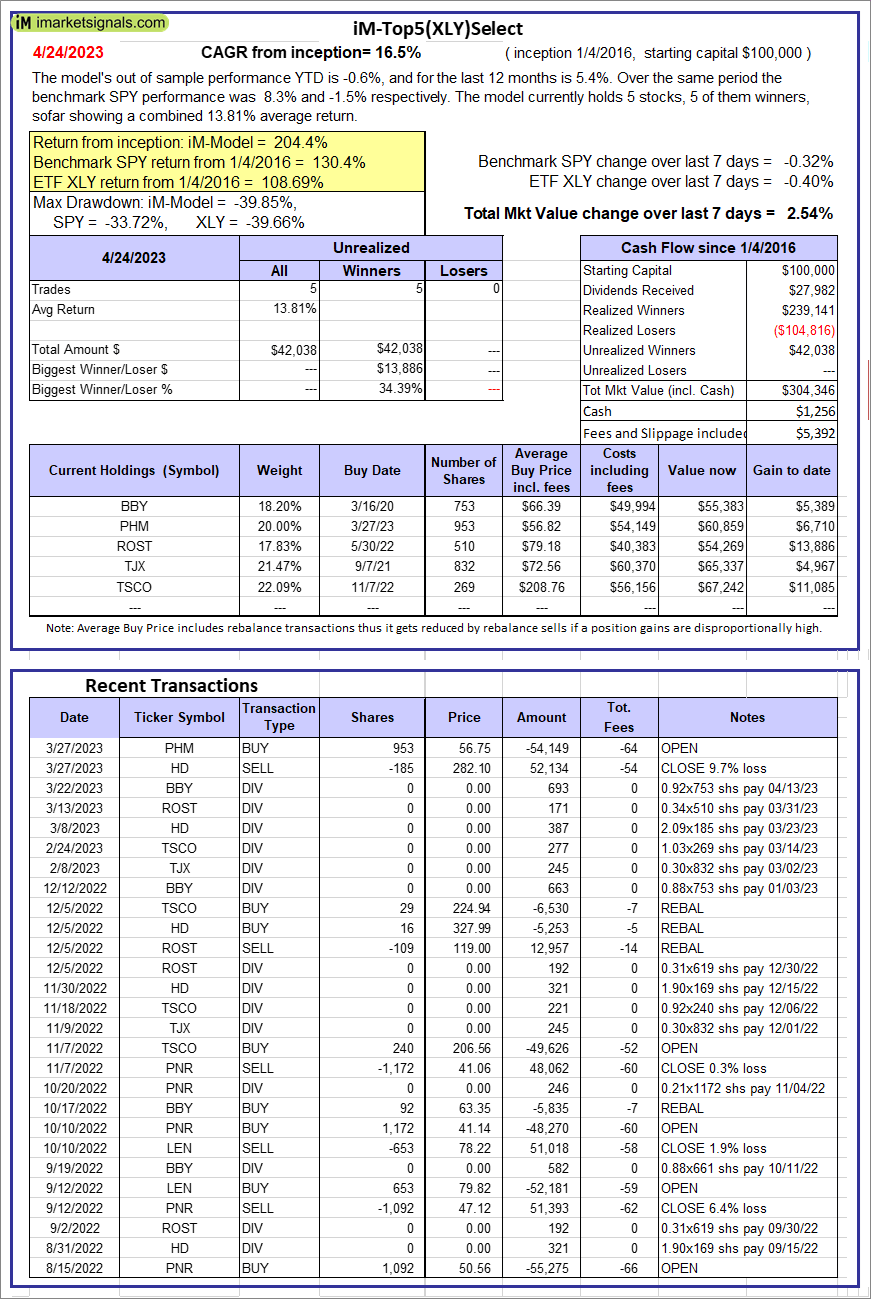 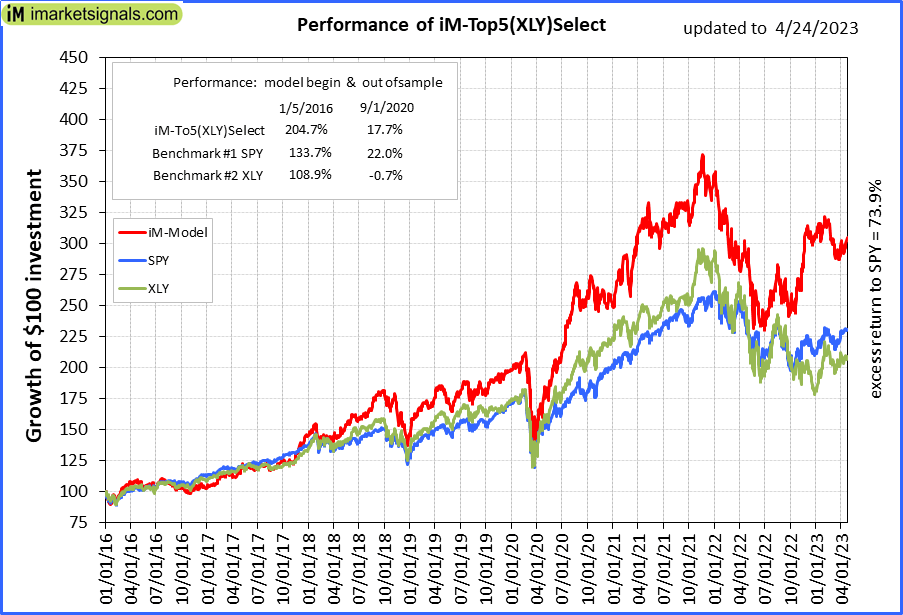 |
iM-Top5(XLY)Select: Since inception, on 1/5/2016, the model gained 204.35% while the benchmark SPY gained 130.43% over the same period. Over the previous week the market value of iM-Top5(XLY)Select gained 2.54% at a time when SPY gained -0.32%. A starting capital of $100,000 at inception on 1/5/2016 would have grown to $304,346 which includes $1,256 cash and excludes $5,392 spent on fees and slippage. |
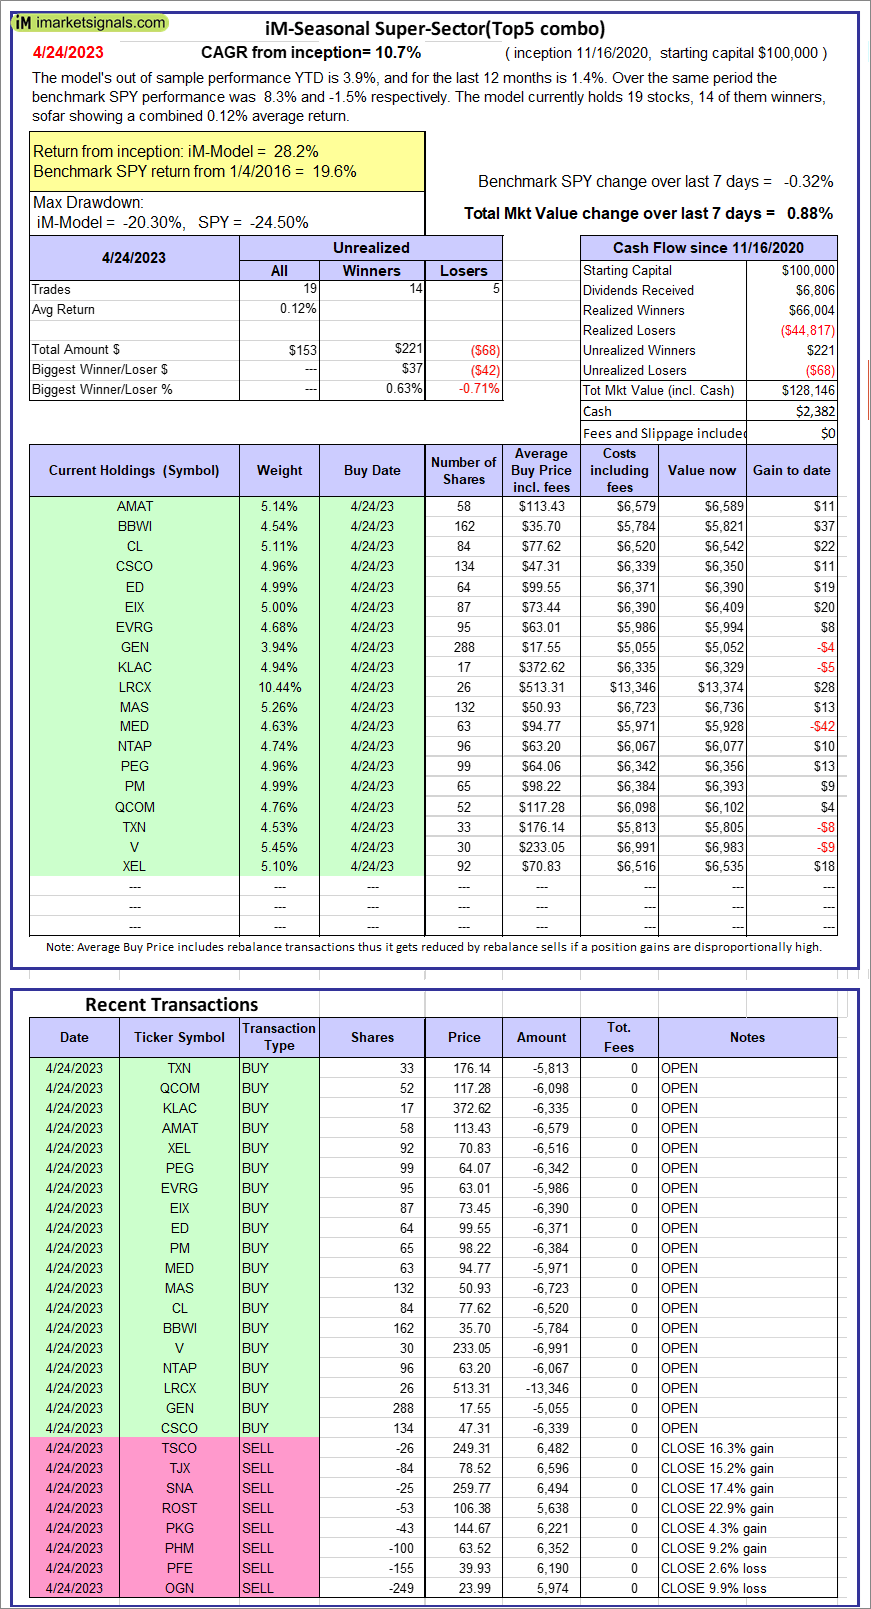 |
iM-Seasonal Super-Sectors (Top5 combo) : Since inception, on 11/17/2020, the model gained 28.15% while the benchmark SPY gained 19.62% over the same period. Over the previous week the market value of iM-Seasonal Super-Sectors (Top5 combo) gained 0.88% at a time when SPY gained -0.32%. A starting capital of $100,000 at inception on 11/17/2020 would have grown to $128,146 which includes $2,382 cash and excludes $00 spent on fees and slippage. |
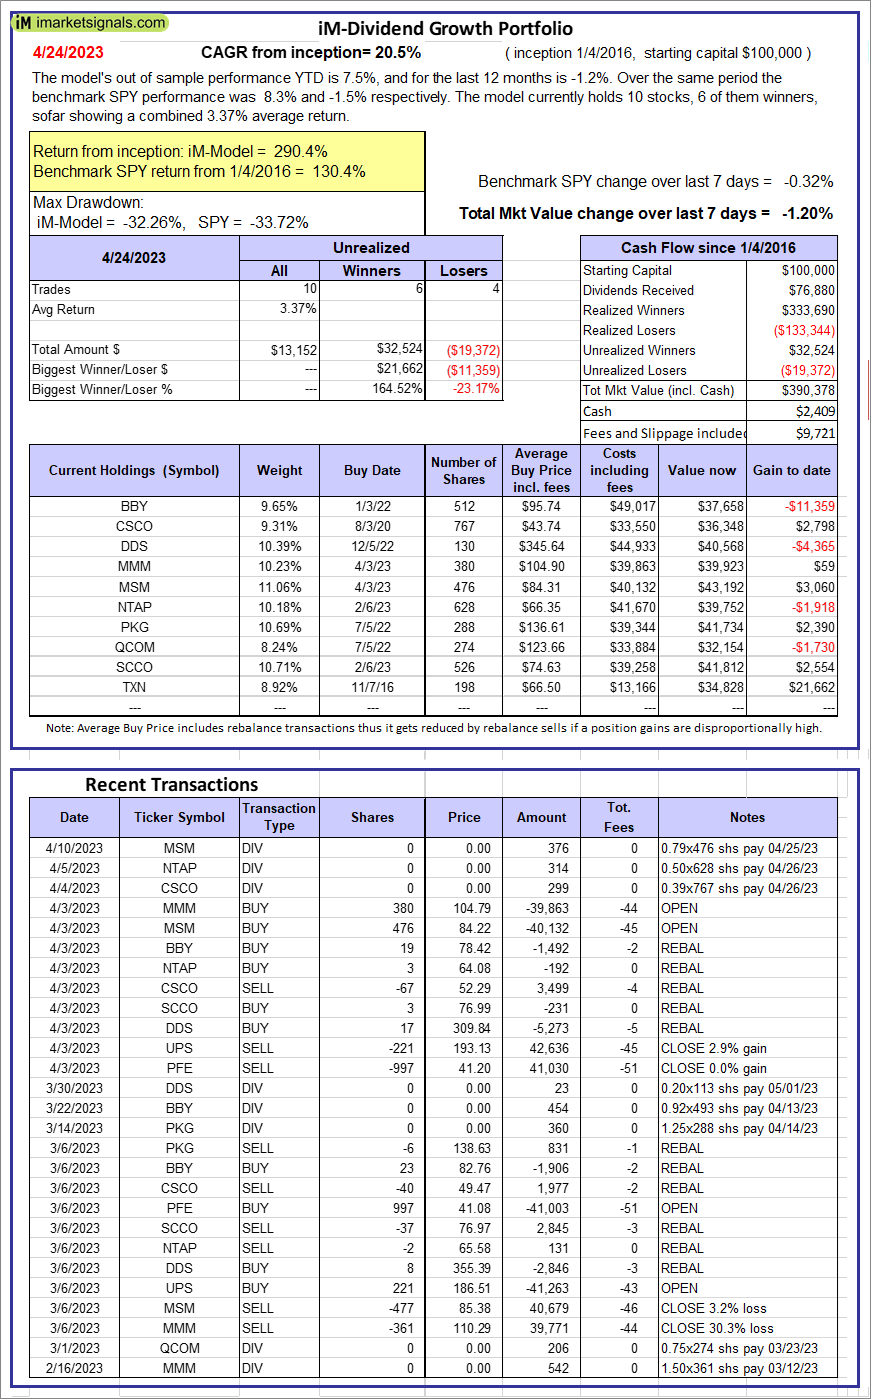 |
iM-Dividend Growth Portfolio: The model’s out of sample performance YTD is 7.5%, and for the last 12 months is -1.2%. Over the same period the benchmark SPY performance was 8.3% and -1.5% respectively. Over the previous week the market value of the iM-Dividend Growth Portfolio gained -1.20% at a time when SPY gained -0.32%. A starting capital of $100,000 at inception on 6/30/2016 would have grown to $390,378 which includes $2,409 cash and excludes $9,721 spent on fees and slippage. |
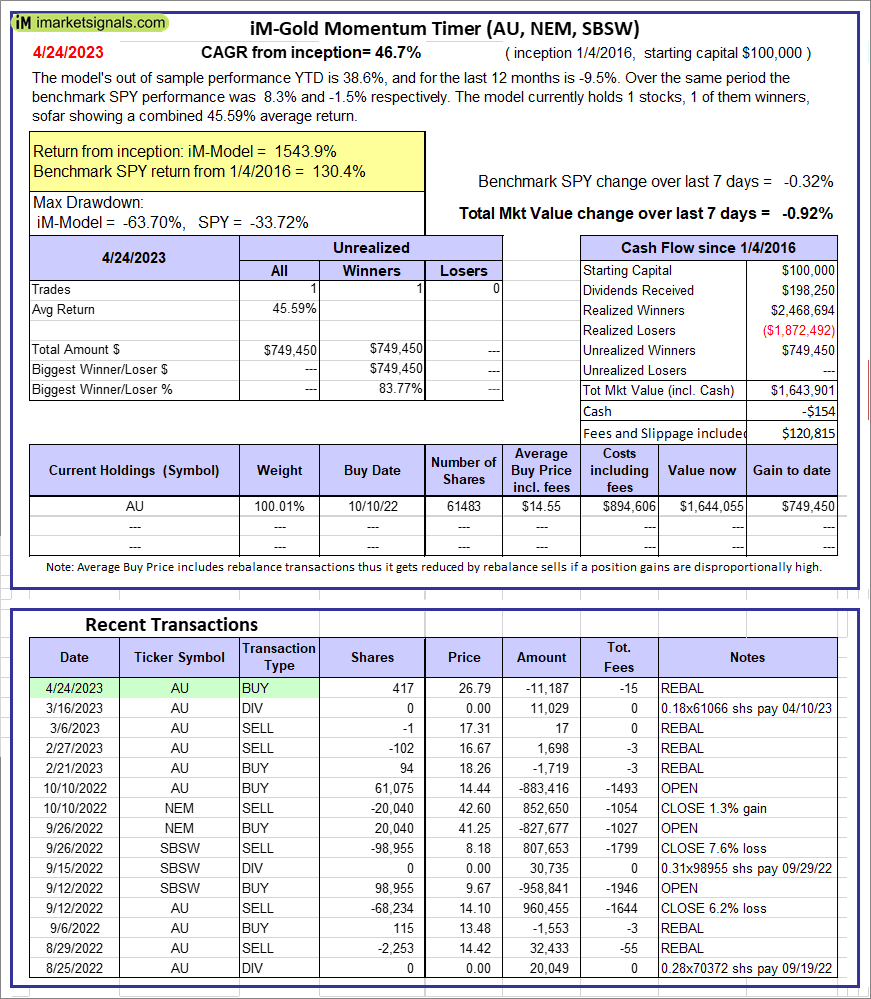 |
iM-Gold Momentum Timer (AU, NEM, SBSW): The model’s out of sample performance YTD is 38.6%, and for the last 12 months is -9.5%. Over the same period the benchmark SPY performance was 8.3% and -1.5% respectively. Over the previous week the market value of iM-Gold Momentum Timer (AU, NEM, SBSW) gained -0.92% at a time when SPY gained -0.32%. A starting capital of $100,000 at inception on 6/30/2016 would have grown to -$154 which includes $120,815 cash and excludes Gain to date spent on fees and slippage. |
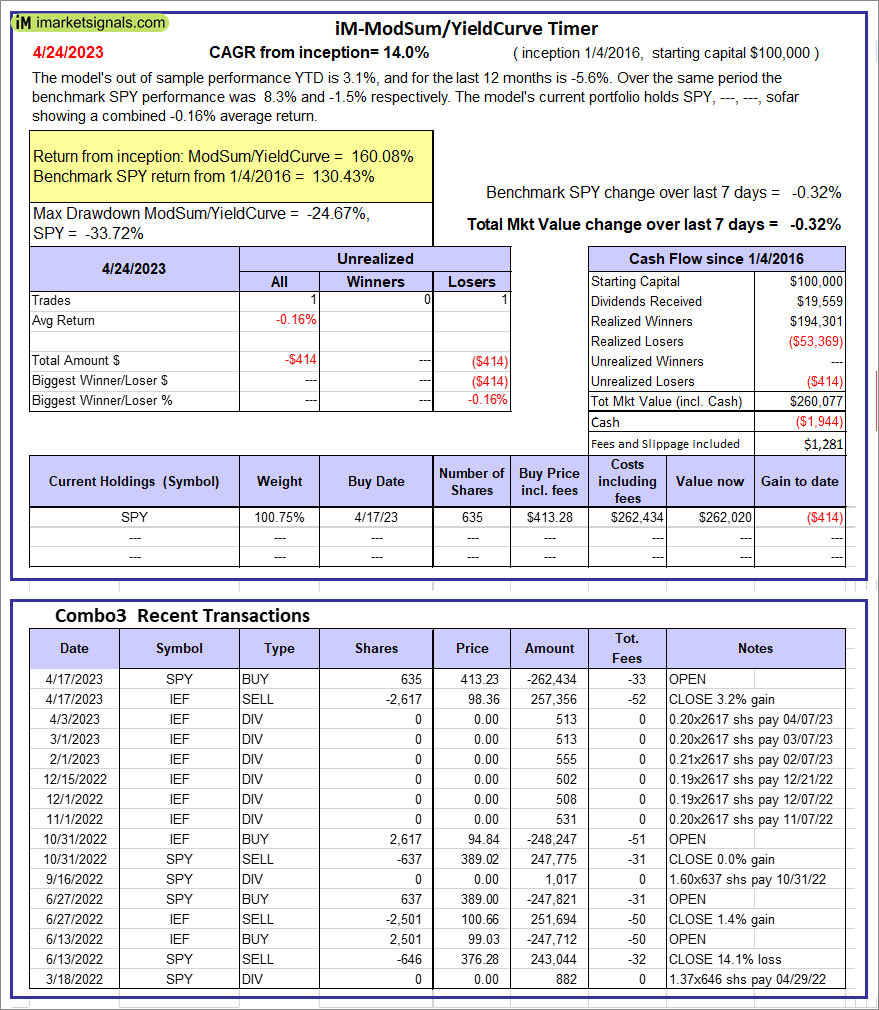 |
iM-ModSum/YieldCurve Timer: The model’s out of sample performance YTD is 3.1%, and for the last 12 months is -5.6%. Over the same period the benchmark SPY performance was 8.3% and -1.5% respectively. Over the previous week the market value of iM-PortSum/YieldCurve Timer gained -0.32% at a time when SPY gained -0.32%. A starting capital of $100,000 at inception on 1/1/2016 would have grown to $260,077 which includes -$1,944 cash and excludes $1,281 spent on fees and slippage. |
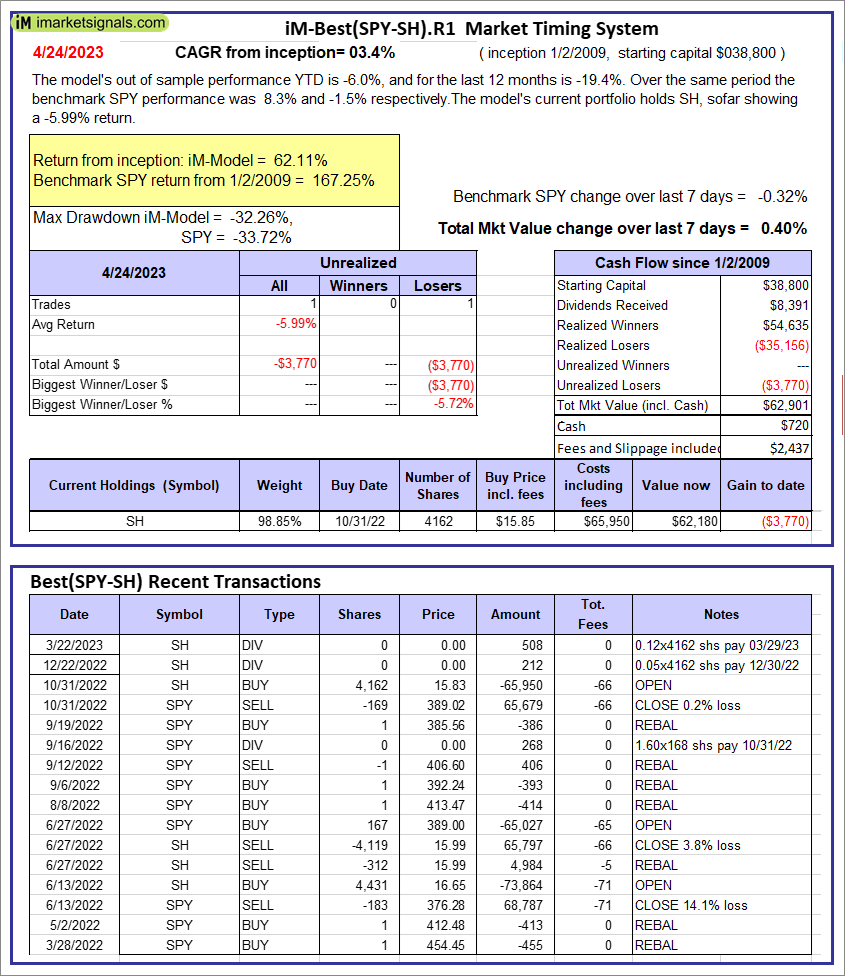 |
iM-Best(SPY-SH).R1: The model’s out of sample performance YTD is -6.0%, and for the last 12 months is -19.4%. Over the same period the benchmark SPY performance was 8.3% and -1.5% respectively. Over the previous week the market value of Best(SPY-SH) gained 0.40% at a time when SPY gained -0.32%. A starting capital of $100,000 at inception on 1/2/2009 would have grown to $62,901 which includes $720 cash and excludes $2,437 spent on fees and slippage. |
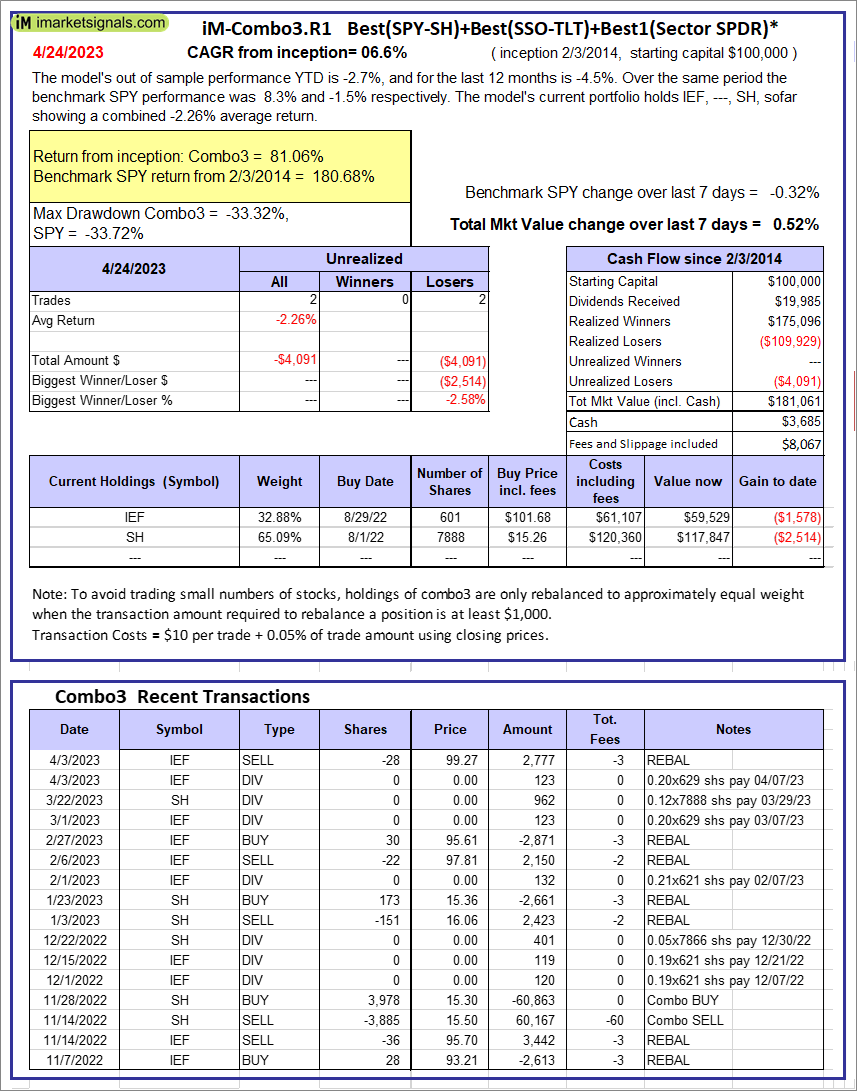 |
iM-Combo3.R1: The model’s out of sample performance YTD is -2.7%, and for the last 12 months is -4.5%. Over the same period the benchmark SPY performance was 8.3% and -1.5% respectively. Over the previous week the market value of iM-Combo3.R1 gained 0.52% at a time when SPY gained -0.32%. A starting capital of $100,000 at inception on 2/3/2014 would have grown to $181,061 which includes $3,685 cash and excludes $8,067 spent on fees and slippage. |
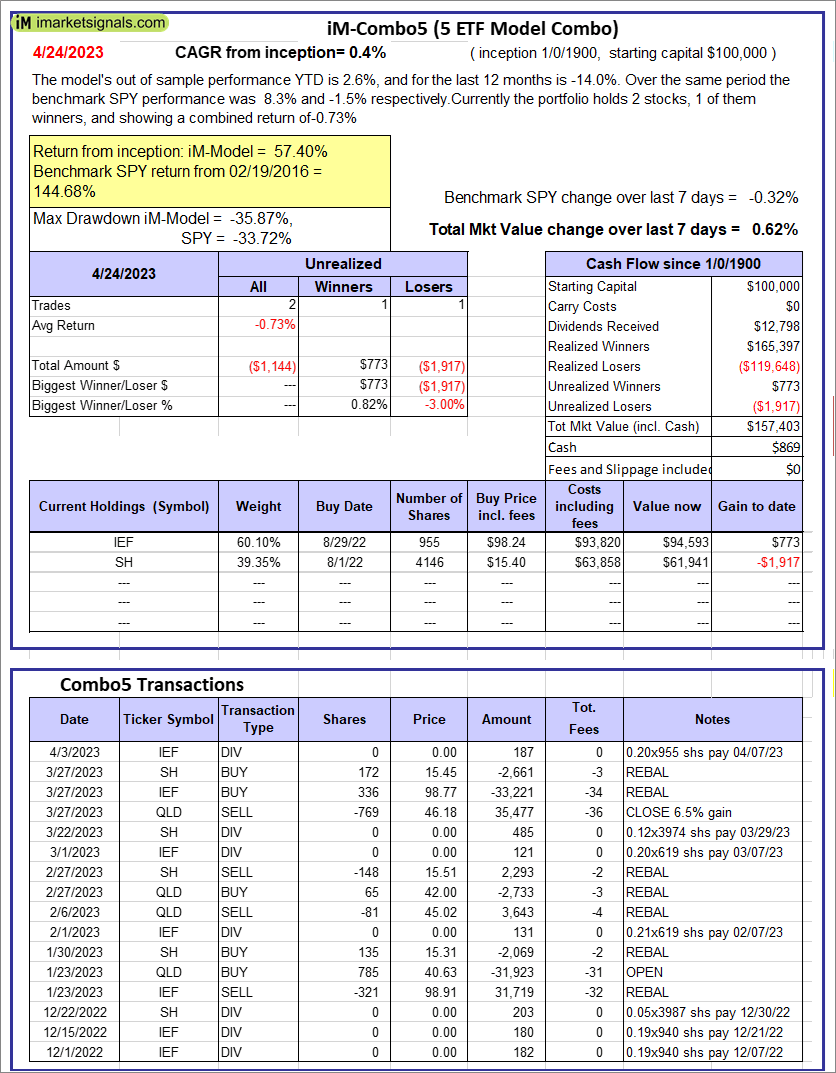 |
iM-Combo5: The model’s out of sample performance YTD is 2.6%, and for the last 12 months is -14.0%. Over the same period the benchmark SPY performance was 8.3% and -1.5% respectively. Over the previous week the market value of iM-Combo5 gained 0.62% at a time when SPY gained -0.32%. A starting capital of $100,000 at inception on 2/22/2016 would have grown to $157,403 which includes $869 cash and excludes $0 spent on fees and slippage. |
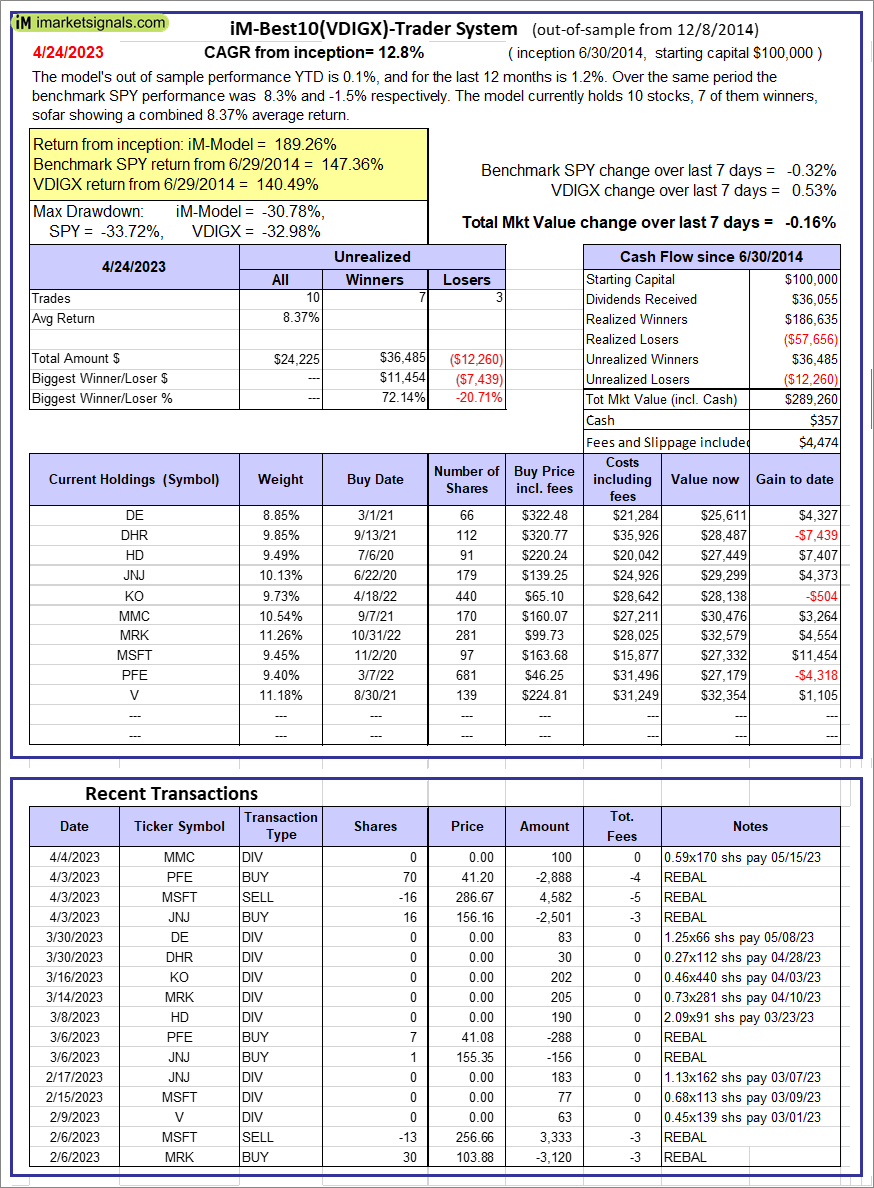 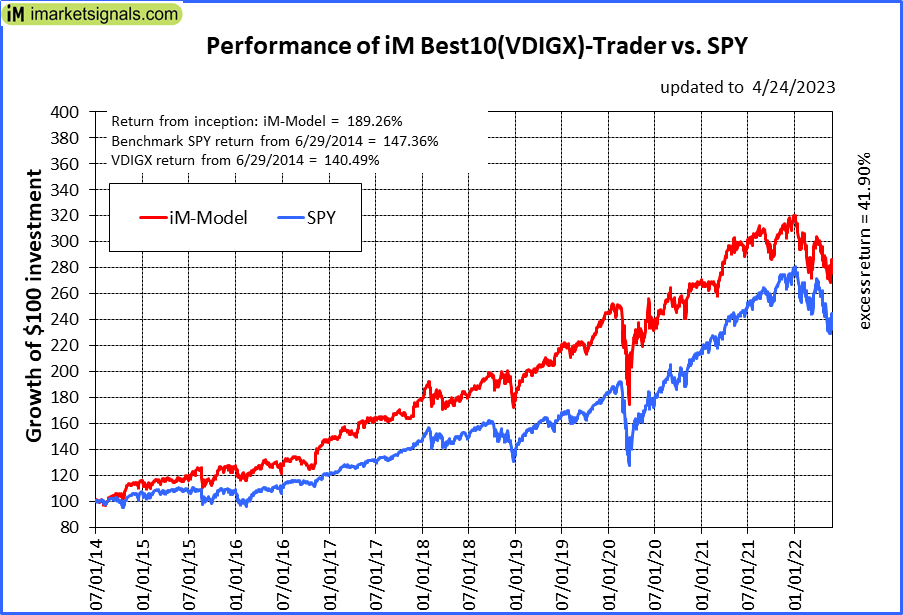 |
iM-Best10(VDIGX)-Trader: The model’s out of sample performance YTD is 0.1%, and for the last 12 months is 1.2%. Over the same period the benchmark SPY performance was 8.3% and -1.5% respectively. Since inception, on 7/1/2014, the model gained 189.26% while the benchmark SPY gained 147.36% and VDIGX gained 140.49% over the same period. Over the previous week the market value of iM-Best10(VDIGX) gained -0.16% at a time when SPY gained -0.32%. A starting capital of $100,000 at inception on 7/1/2014 would have grown to $289,260 which includes $357 cash and excludes $4,474 spent on fees and slippage. |
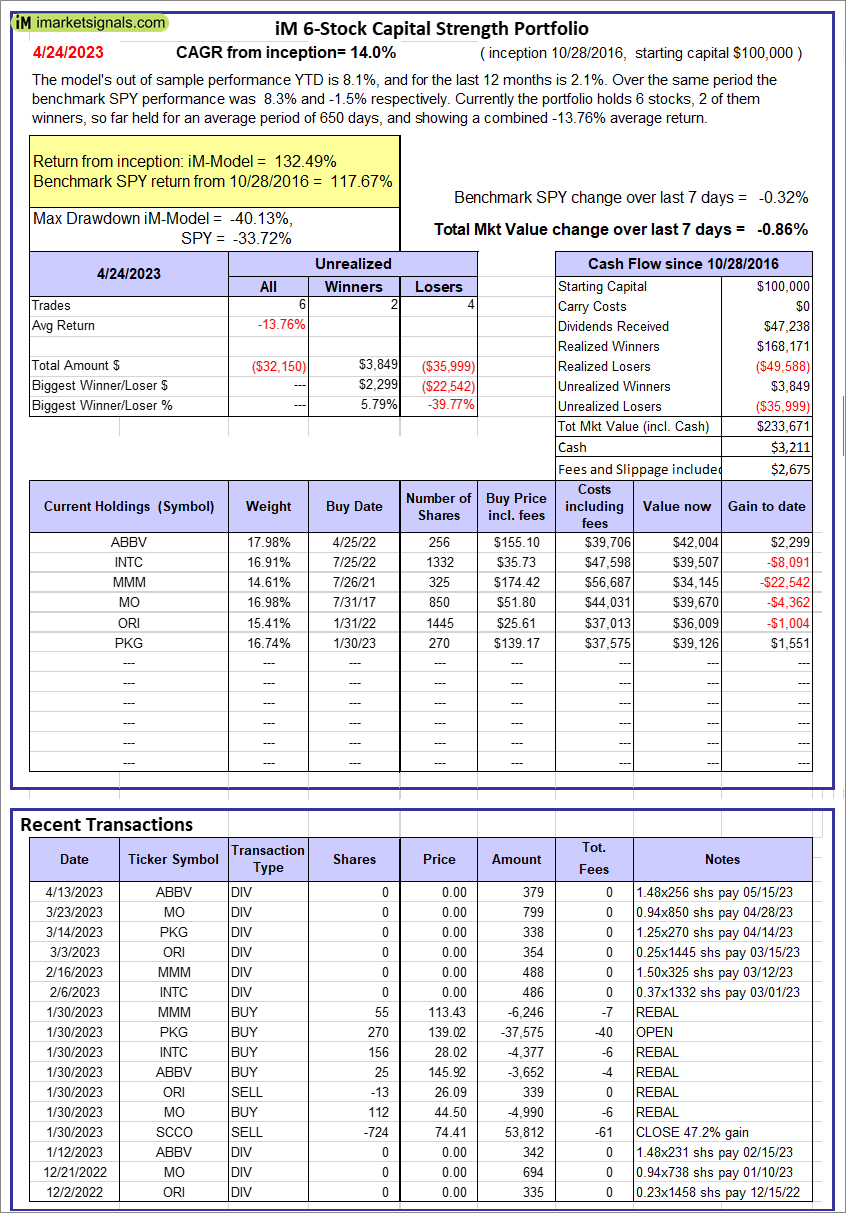 |
iM 6-Stock Capital Strength Portfolio: The model’s out of sample performance YTD is 8.1%, and for the last 12 months is 2.1%. Over the same period the benchmark SPY performance was 8.3% and -1.5% respectively. Over the previous week the market value of the iM 6-Stock Capital Strength Portfolio gained -0.86% at a time when SPY gained -0.32%. A starting capital of $100,000 at inception on 10/28/2016 would have grown to $233,671 which includes $3,211 cash and excludes $2,675 spent on fees and slippage. |
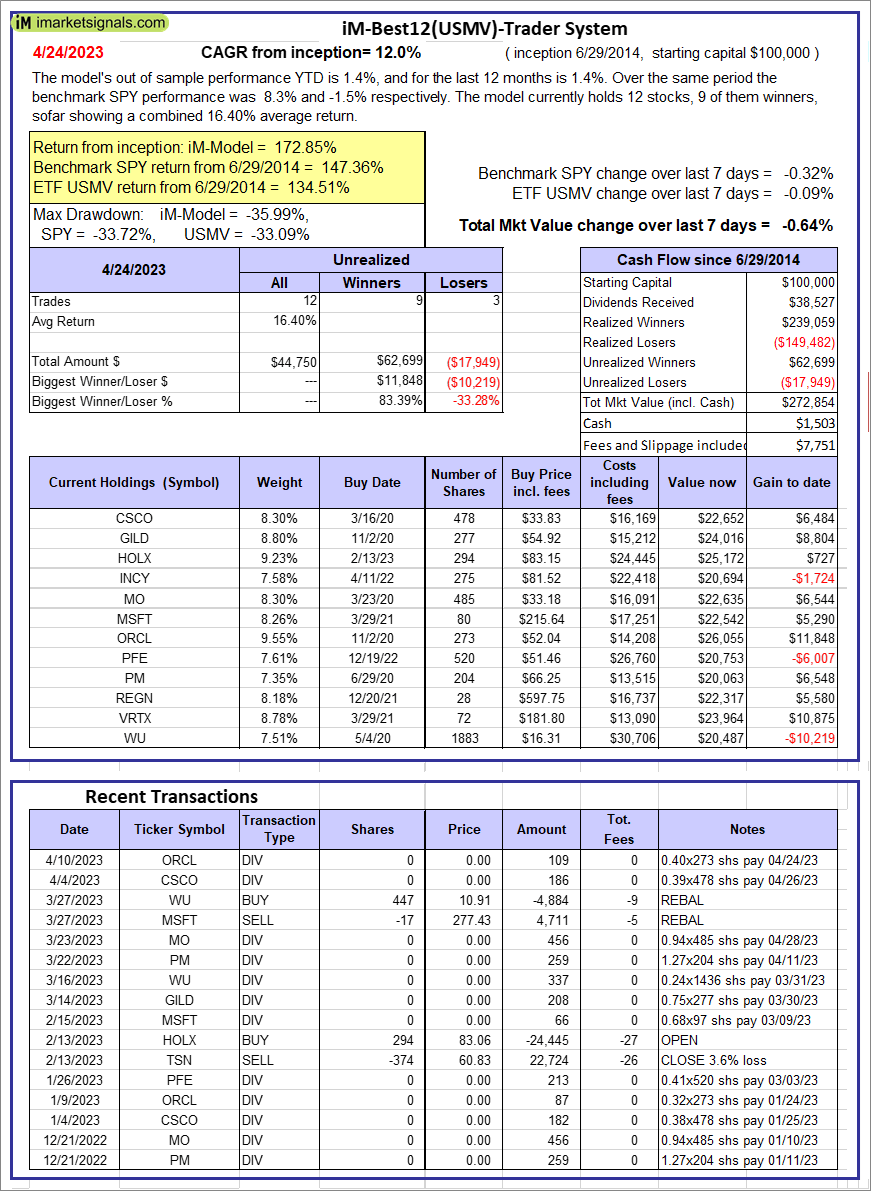 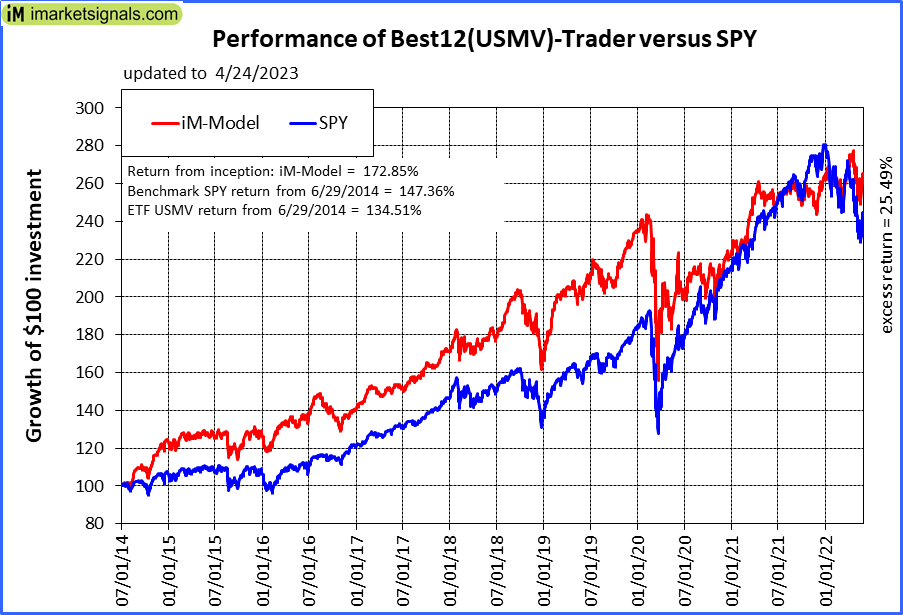 |
iM-Best12(USMV)-Trader: The model’s out of sample performance YTD is 1.4%, and for the last 12 months is 1.4%. Over the same period the benchmark SPY performance was 8.3% and -1.5% respectively. Since inception, on 6/30/2014, the model gained 172.85% while the benchmark SPY gained 147.36% and the ETF USMV gained 134.51% over the same period. Over the previous week the market value of iM-Best12(USMV)-Trader gained -0.64% at a time when SPY gained -0.32%. A starting capital of $100,000 at inception on 6/30/2014 would have grown to $272,854 which includes $1,503 cash and excludes $7,751 spent on fees and slippage. |
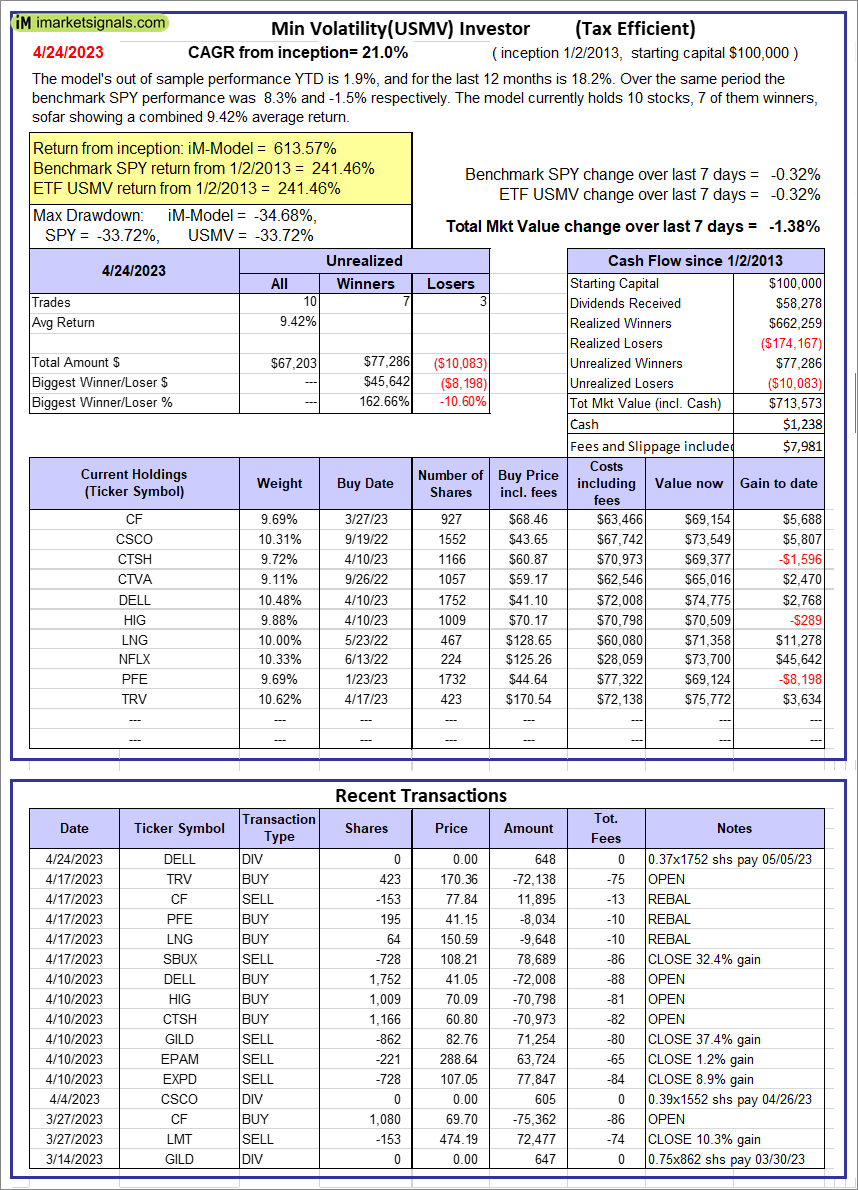 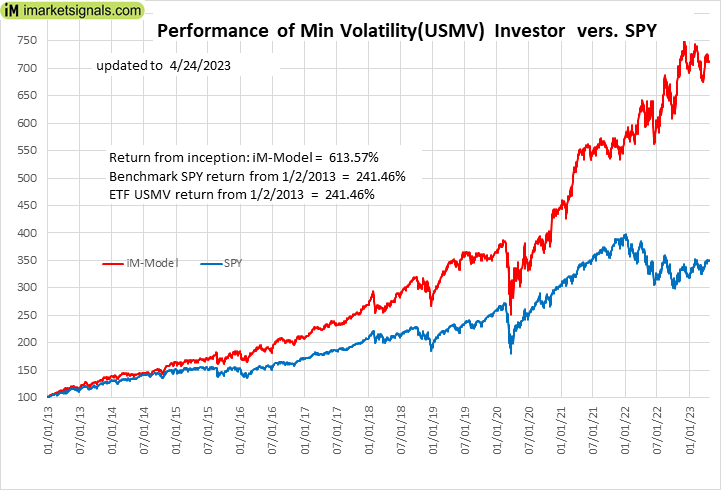 |
iM-Min Volatility(USMV) Investor (Tax Efficient): The model’s out of sample performance YTD is 1.9%, and for the last 12 months is 18.2%. Over the same period the benchmark SPY performance was 8.3% and -1.5% respectively. Since inception, on 1/3/2013, the model gained 613.57% while the benchmark SPY gained 241.46% and the ETF USMV gained 241.46% over the same period. Over the previous week the market value of iM-Best12(USMV)Q1 gained -1.38% at a time when SPY gained -0.32%. A starting capital of $100,000 at inception on 1/3/2013 would have grown to $713,573 which includes $1,238 cash and excludes $7,981 spent on fees and slippage. |
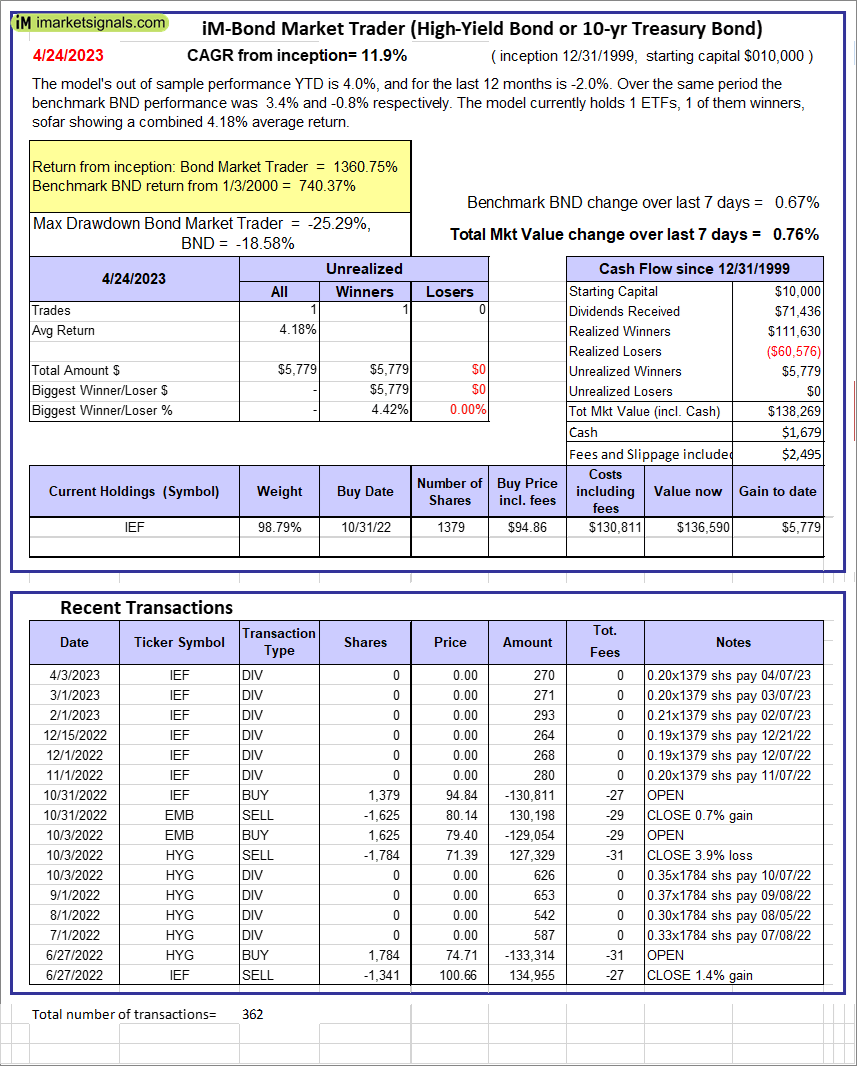 |
iM-Bond Market Trader (High-Yield Bond or 10-yr Treasury Bond): The model’s out of sample performance YTD is 4.0%, and for the last 12 months is -2.0%. Over the same period the benchmark BND performance was 3.4% and -0.8% respectively. Over the previous week the market value of the iM-Bond Market Trader (High-Yield Bond or 10-yr Treasury Bond) gained 0.76% at a time when BND gained 0.67%. A starting capital of $10,000 at inception on 1/3/2000 would have grown to $138,269 which includes $1,679 cash and excludes $2,495 spent on fees and slippage. |
|
|
iM-ModSum/YieldCurve Timer: The model’s out of sample performance YTD is 3.1%, and for the last 12 months is -5.6%. Over the same period the benchmark SPY performance was 8.3% and -1.5% respectively. Over the previous week the market value of iM-PortSum/YieldCurve Timer gained -0.32% at a time when SPY gained -0.32%. A starting capital of $100,000 at inception on 1/1/2016 would have grown to $260,077 which includes -$1,944 cash and excludes $1,281 spent on fees and slippage. |
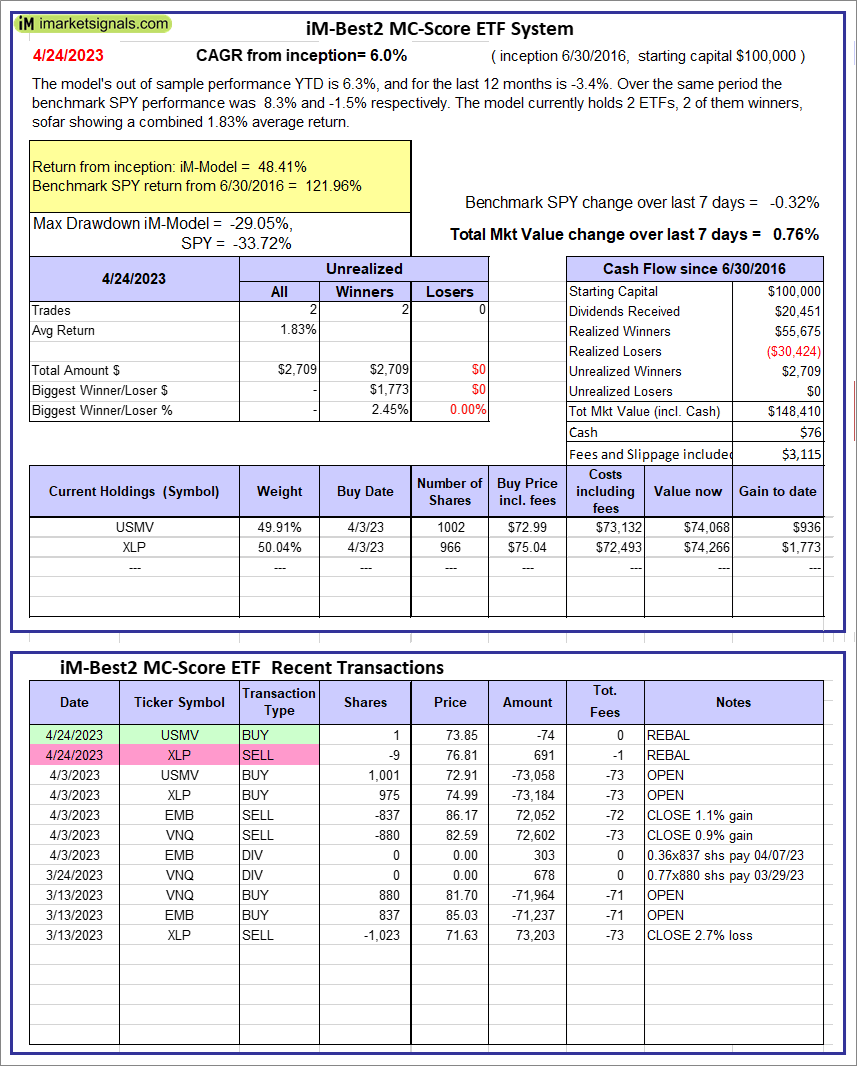 |
iM-Best2 MC-Score ETF System: The model’s out of sample performance YTD is 6.3%, and for the last 12 months is -3.4%. Over the same period the benchmark SPY performance was 8.3% and -1.5% respectively. Over the previous week the market value of the iM-Best2 MC-Score ETF System gained 0.76% at a time when SPY gained -0.32%. A starting capital of $100,000 at inception on 6/30/2016 would have grown to $148,410 which includes $76 cash and excludes $3,115 spent on fees and slippage. |
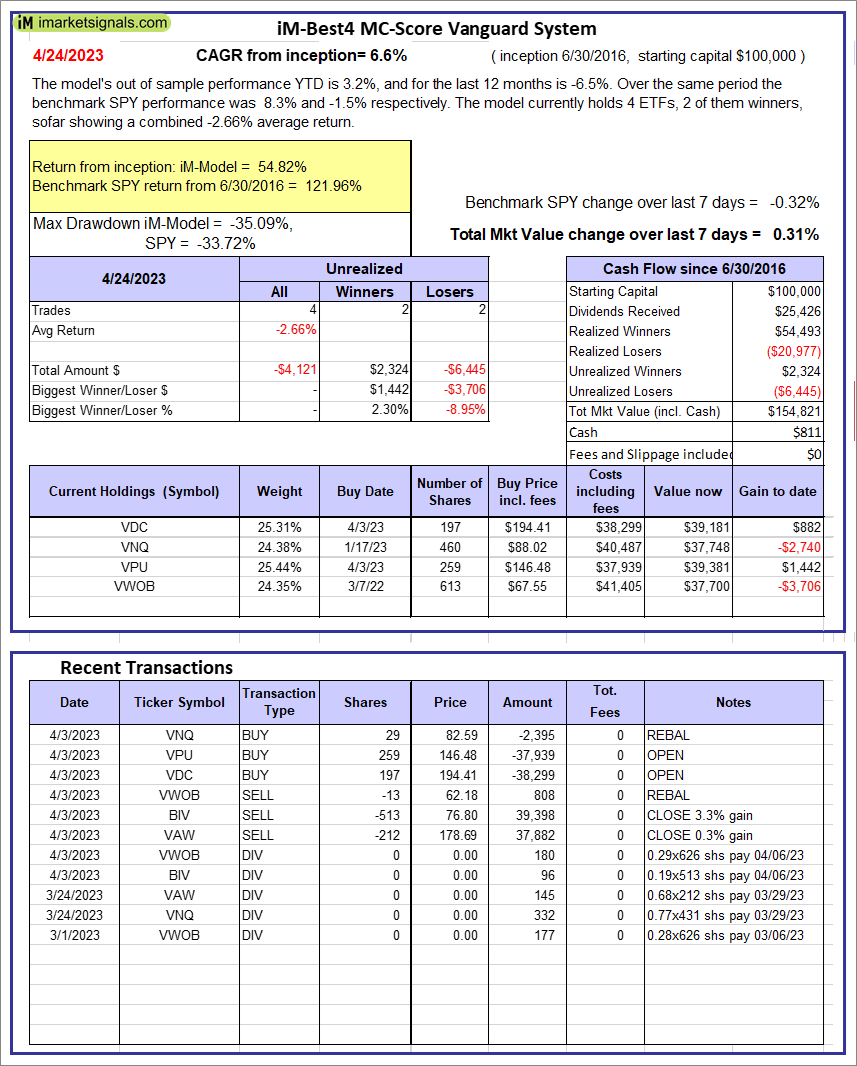 |
iM-Best4 MC-Score Vanguard System: The model’s out of sample performance YTD is 3.2%, and for the last 12 months is -6.5%. Over the same period the benchmark SPY performance was 8.3% and -1.5% respectively. Over the previous week the market value of the iM-Best4 MC-Score Vanguard System gained 0.31% at a time when SPY gained -0.32%. A starting capital of $100,000 at inception on 6/30/2016 would have grown to $154,821 which includes $811 cash and excludes $00 spent on fees and slippage. |
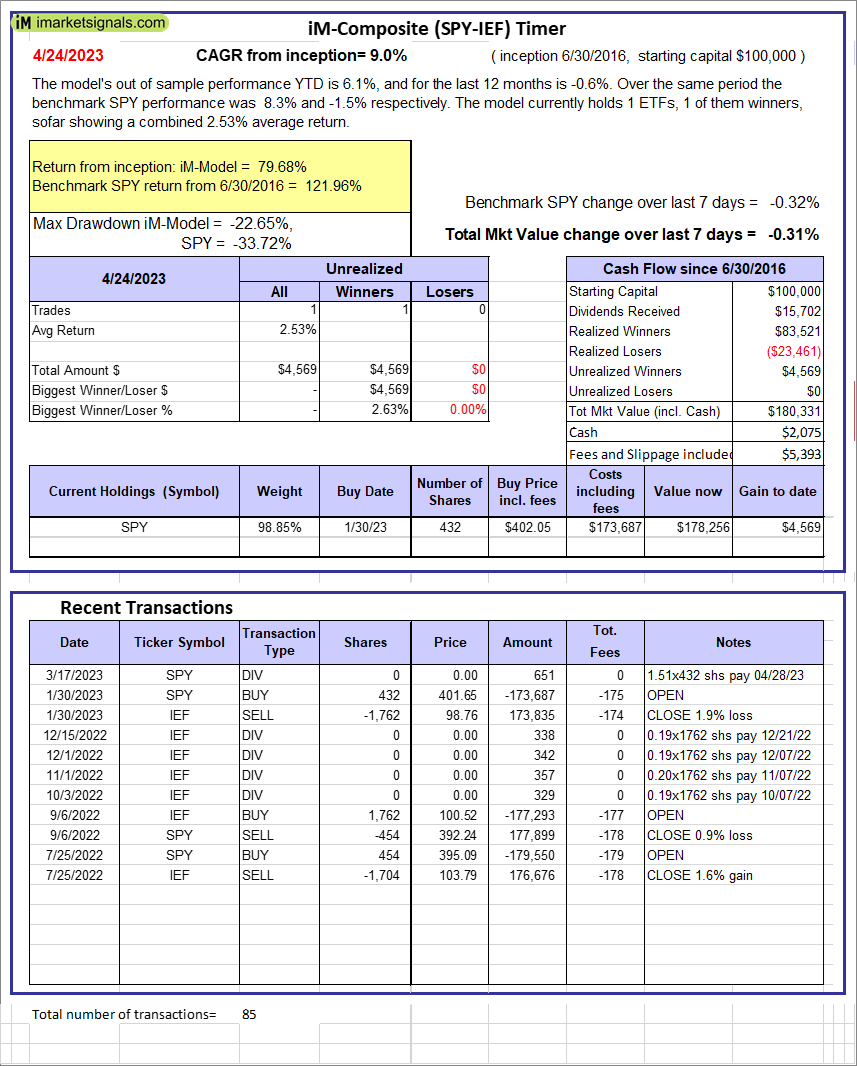 |
iM-Composite (SPY-IEF) Timer: The model’s out of sample performance YTD is 6.1%, and for the last 12 months is -0.6%. Over the same period the benchmark SPY performance was 8.3% and -1.5% respectively. Over the previous week the market value of the iM-Composite (SPY-IEF) Timer gained -0.31% at a time when SPY gained -0.32%. A starting capital of $100,000 at inception on 6/30/2016 would have grown to $180,331 which includes $2,075 cash and excludes $5,393 spent on fees and slippage. |
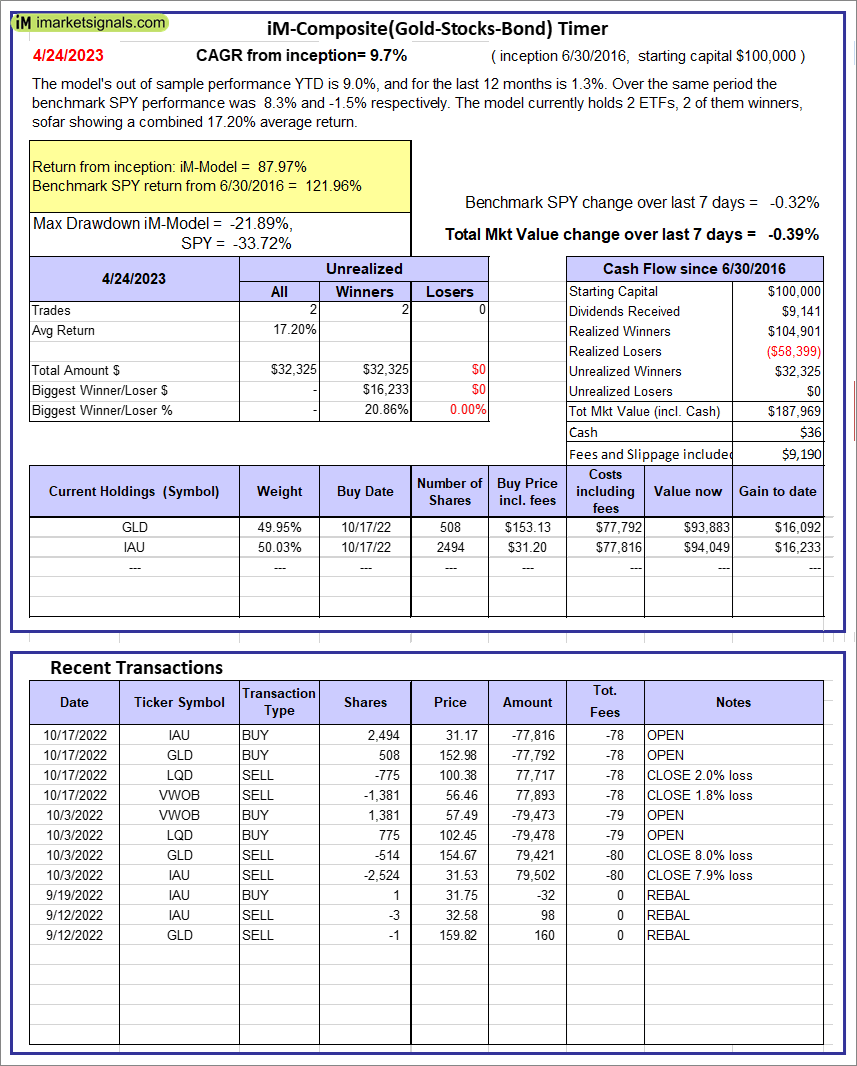 |
iM-Composite(Gold-Stocks-Bond) Timer: The model’s out of sample performance YTD is 9.0%, and for the last 12 months is 1.3%. Over the same period the benchmark SPY performance was 8.3% and -1.5% respectively. Over the previous week the market value of the iM-Composite(Gold-Stocks-Bond) Timer gained -0.39% at a time when SPY gained -0.32%. A starting capital of $100,000 at inception on 6/30/2016 would have grown to $187,969 which includes $36 cash and excludes $9,190 spent on fees and slippage. |
iM-Best Reports – 4/24/2023
Posted in pmp SPY-SH
Leave a Reply
You must be logged in to post a comment.