
  |
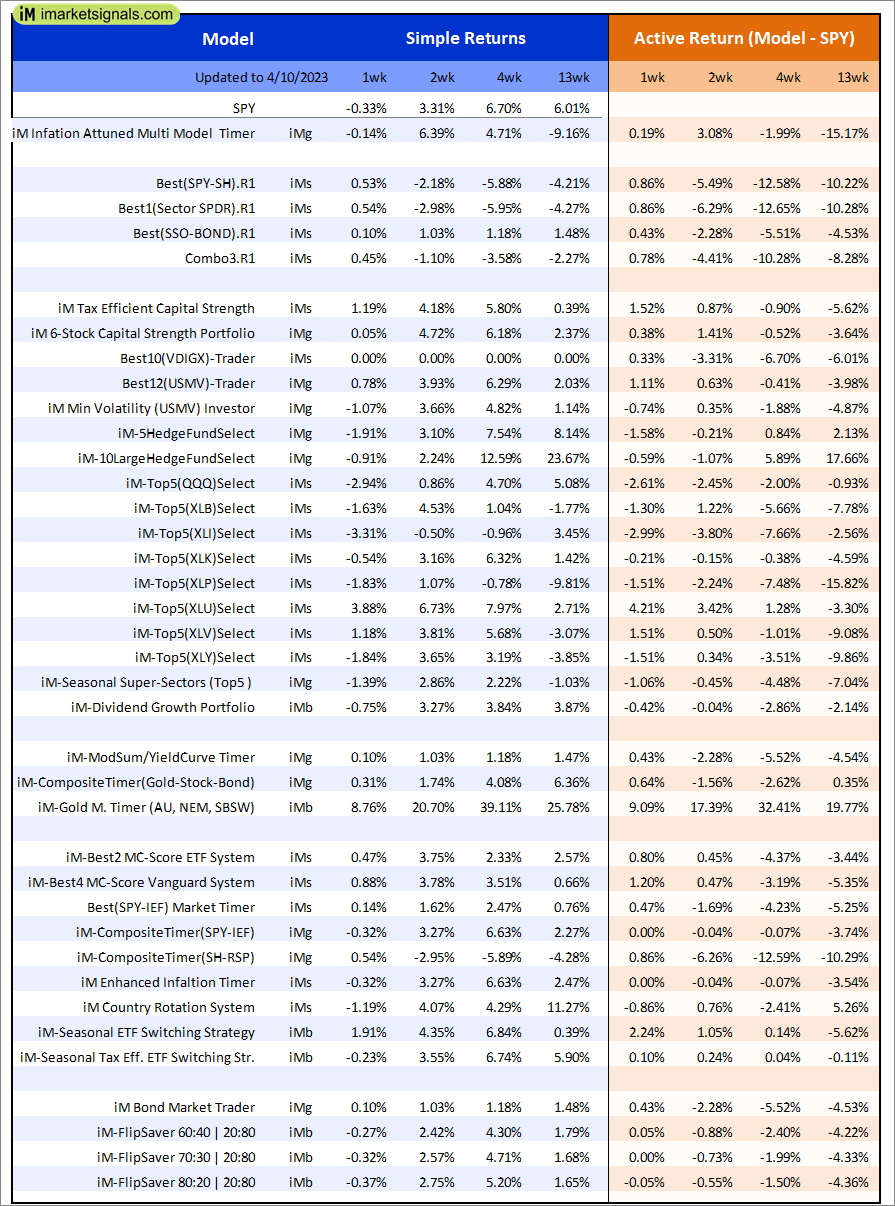
Out of sample performance summary of our models for the past 1, 2, 4 and 13 week periods. The active active return indicates how the models over- or underperformed the benchmark ETF SPY. Also the YTD, and the 1-, 3-, 5- and 10-year annualized returns are shown in the second table |
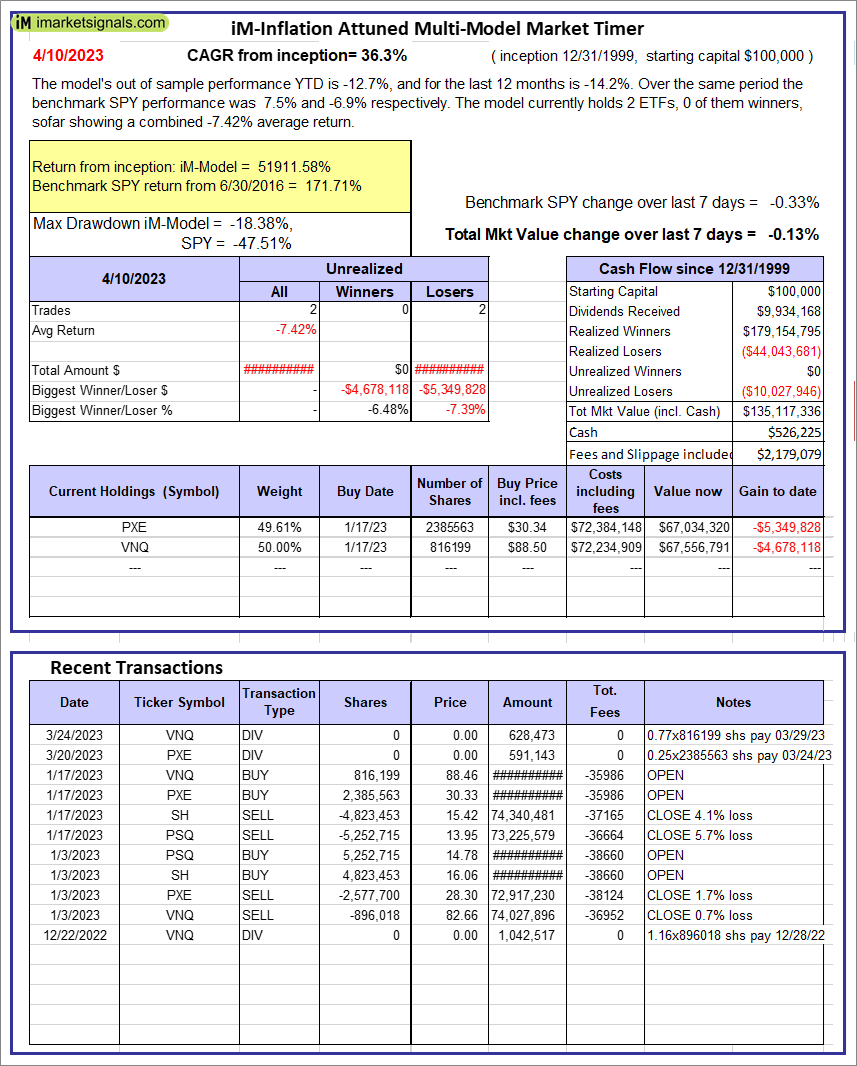 |
iM-Inflation Attuned Multi-Model Market Timer: The model’s out of sample performance YTD is -12.7%, and for the last 12 months is -14.2%. Over the same period the benchmark SPY performance was 7.5% and -6.9% respectively. Over the previous week the market value of the iM-Inflation Attuned Multi-Model Market Timer gained -0.13% at a time when SPY gained -0.33%. A starting capital of $100,000 at inception on 3/24/2017 would have grown to $135,117,336 which includes $526,225 cash and excludes $2,179,079 spent on fees and slippage. |
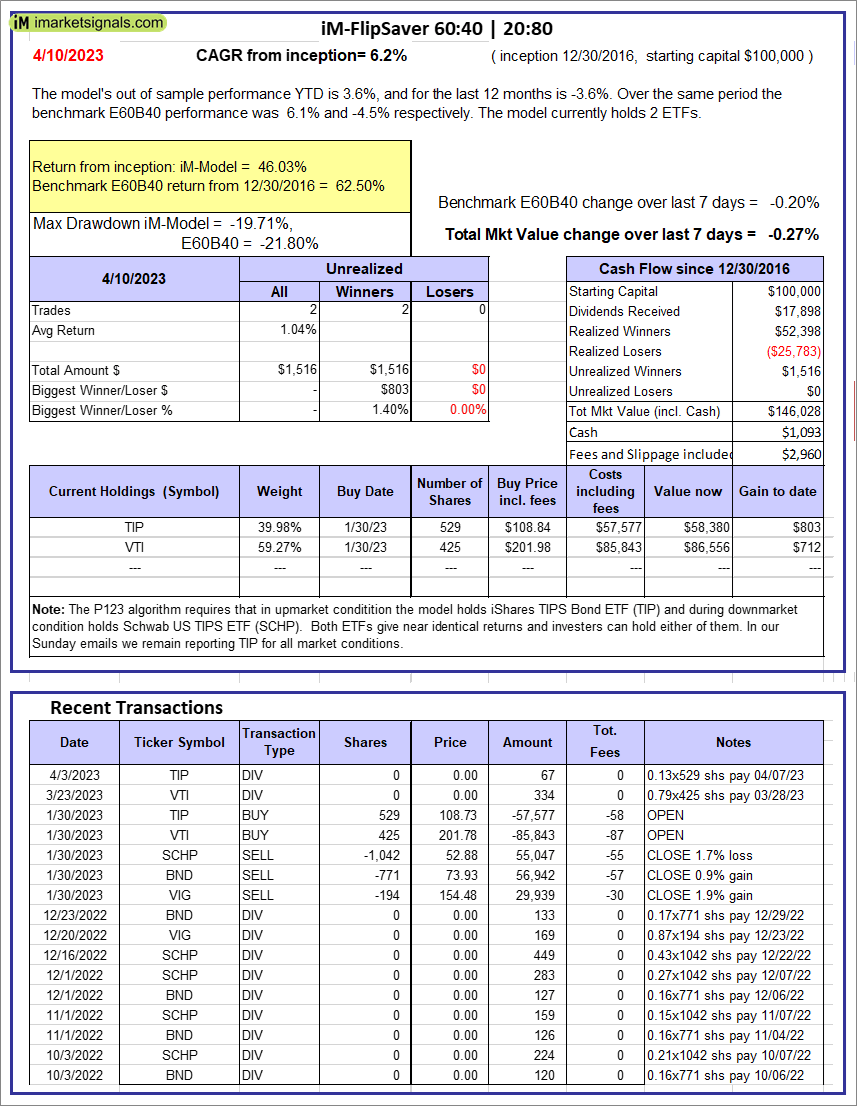 |
iM-FlipSaver 60:40 | 20:80 – 2017: The model’s out of sample performance YTD is 3.6%, and for the last 12 months is -3.6%. Over the same period the benchmark E60B40 performance was 6.1% and -4.5% respectively. Over the previous week the market value of iM-FlipSaver 80:20 | 20:80 gained -0.27% at a time when SPY gained -0.20%. A starting capital of $100,000 at inception on 7/16/2015 would have grown to $146,028 which includes $1,093 cash and excludes $2,960 spent on fees and slippage. |
 |
iM-FlipSaver 70:30 | 20:80 – 2017: The model’s out of sample performance YTD is 3.5%, and for the last 12 months is -3.6%. Over the same period the benchmark E60B40 performance was 6.1% and -4.5% respectively. Over the previous week the market value of iM-FlipSaver 70:30 | 20:80 gained -0.32% at a time when SPY gained -0.20%. A starting capital of $100,000 at inception on 7/15/2015 would have grown to $150,119 which includes $1,225 cash and excludes $3,126 spent on fees and slippage. |
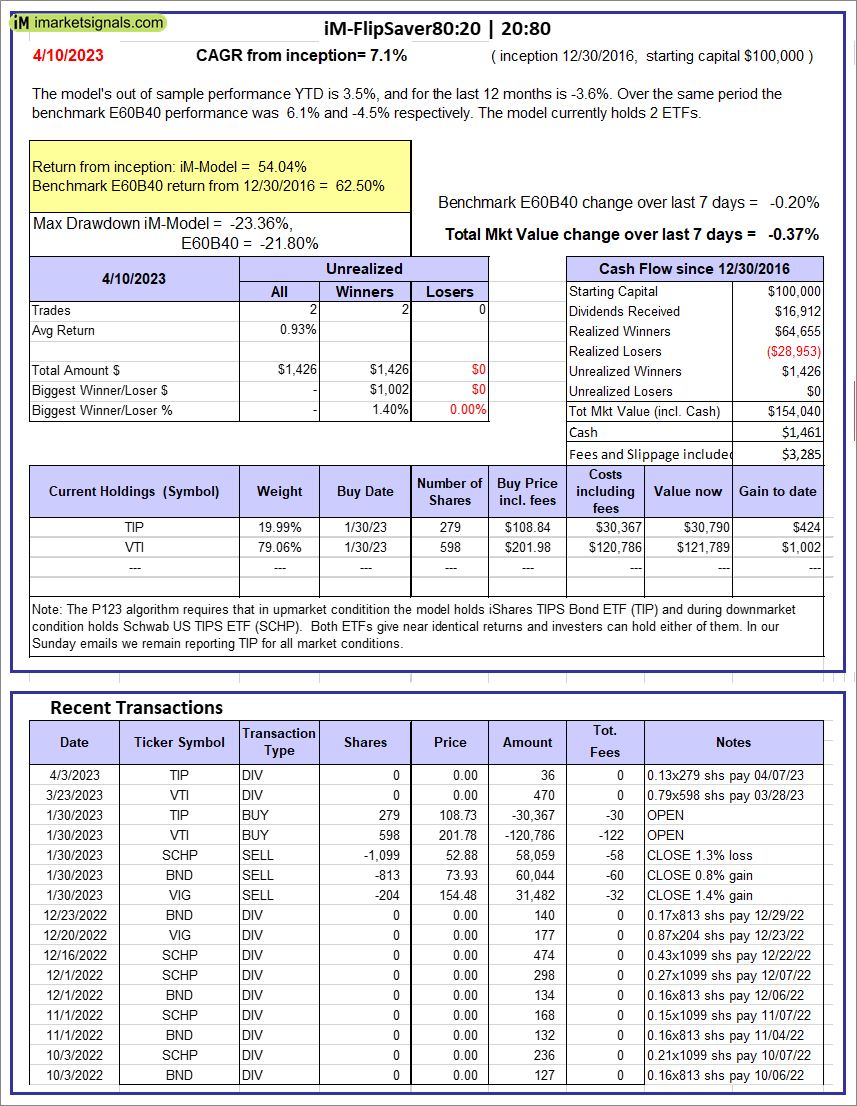 |
iM-FlipSaver 80:20 | 20:80 – 2017: The model’s out of sample performance YTD is 3.5%, and for the last 12 months is -3.6%. Over the same period the benchmark E60B40 performance was 6.1% and -4.5% respectively. Over the previous week the market value of iM-FlipSaver 80:20 | 20:80 gained -0.37% at a time when SPY gained -0.20%. A starting capital of $100,000 at inception on 1/2/2017 would have grown to $154,040 which includes $1,461 cash and excludes $3,285 spent on fees and slippage. |
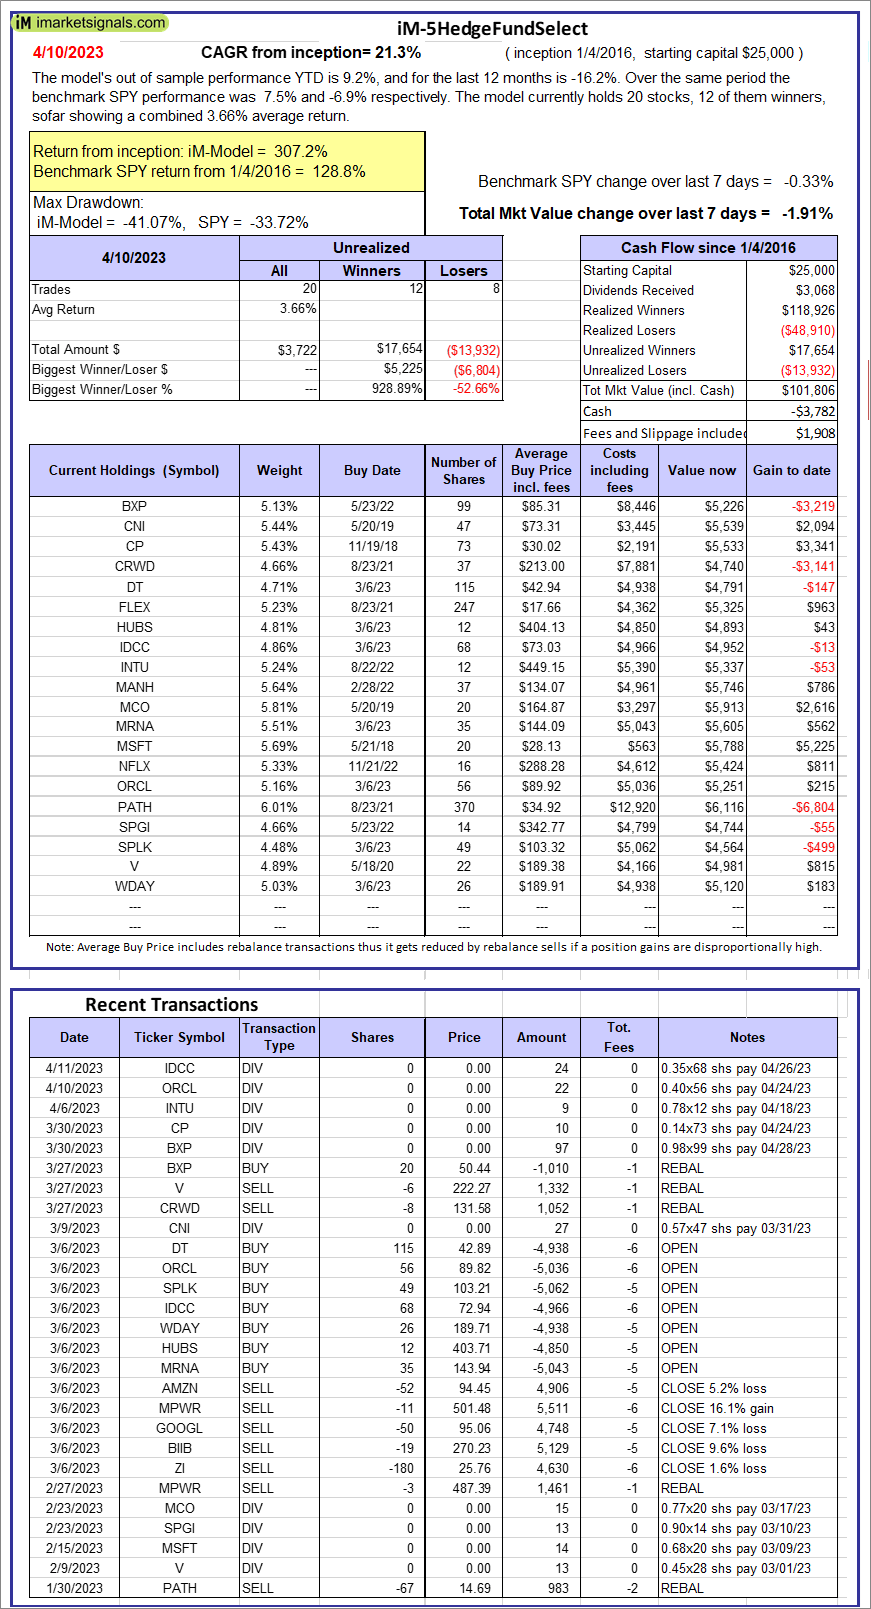  |
iM-5HedgeFundSelect: Since inception, on 1/5/2016, the model gained 307.22% while the benchmark SPY gained 128.75% over the same period. Over the previous week the market value of iM-5HedgeFundSelect gained -1.91% at a time when SPY gained -0.33%. A starting capital of $25,000 at inception on 1/5/2016 would have grown to $101,806 which includes -$3,782 cash and excludes $1,908 spent on fees and slippage. |
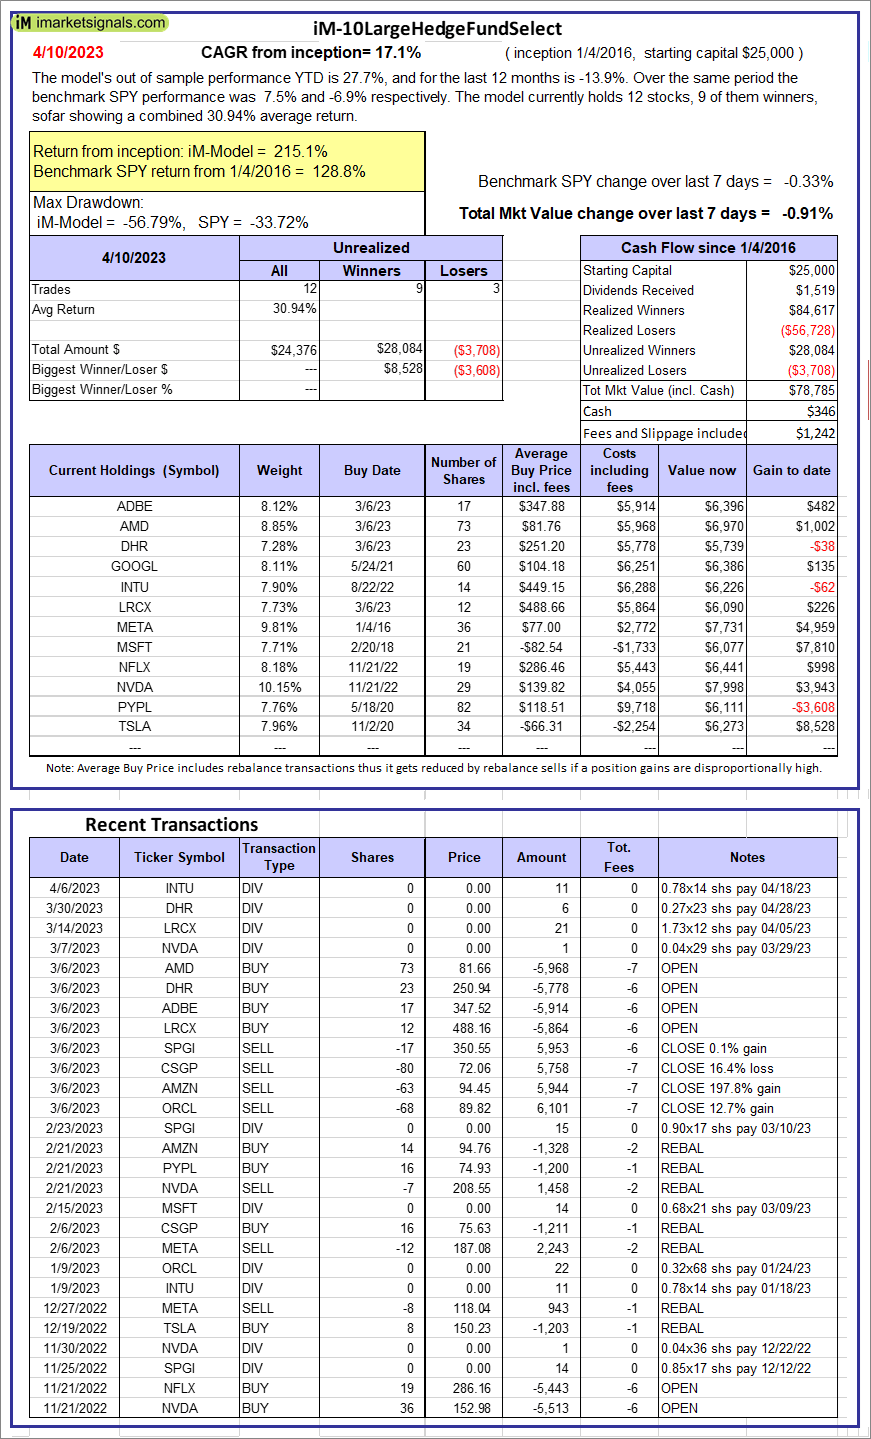 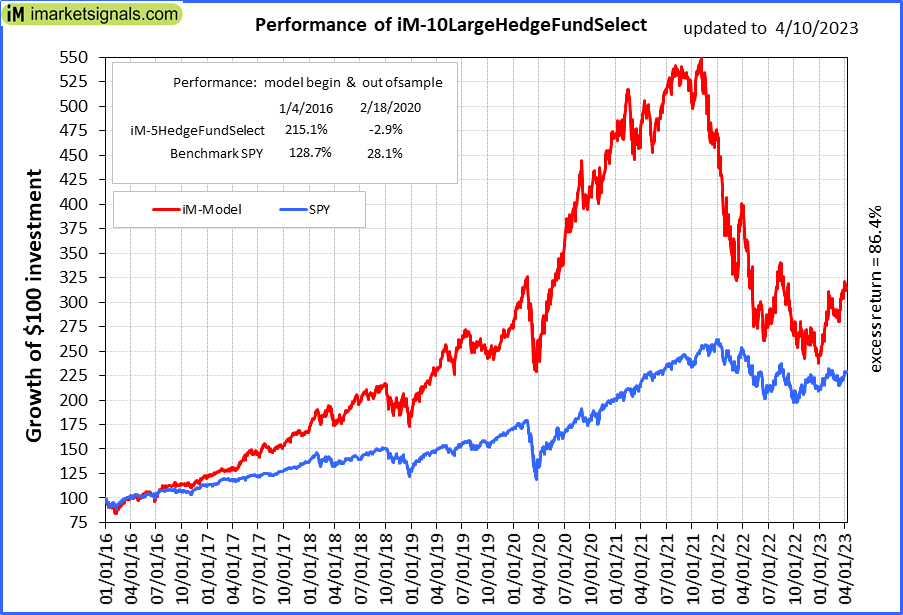 |
iM-10LargeHedgeFundSelect: Since inception, on 1/5/2016, the model gained 215.14% while the benchmark SPY gained 128.75% over the same period. Over the previous week the market value of iM-10LargeHedgeFundSelect gained -0.91% at a time when SPY gained -0.33%. A starting capital of $25,000 at inception on 1/5/2016 would have grown to $78,785 which includes $346 cash and excludes $1,242 spent on fees and slippage. |
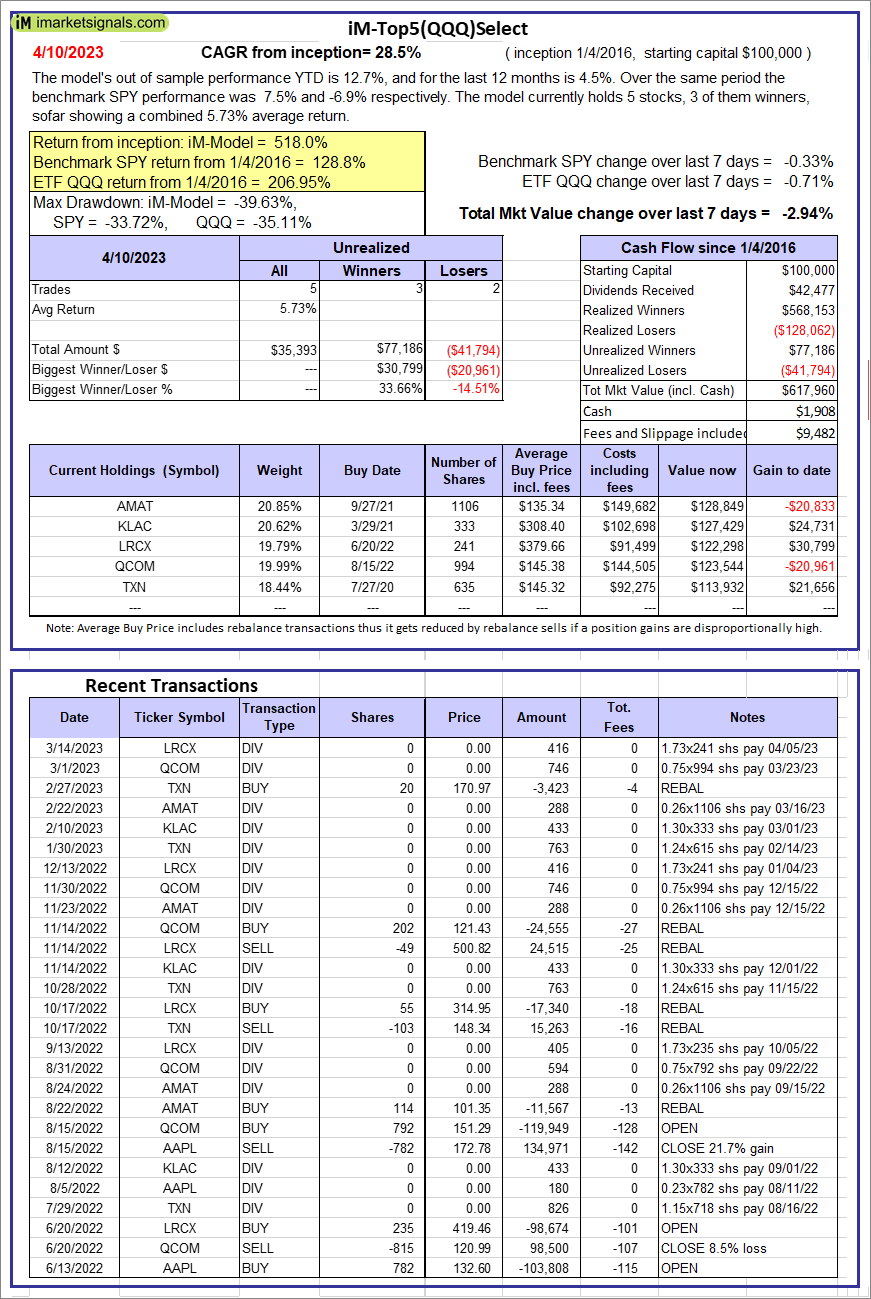 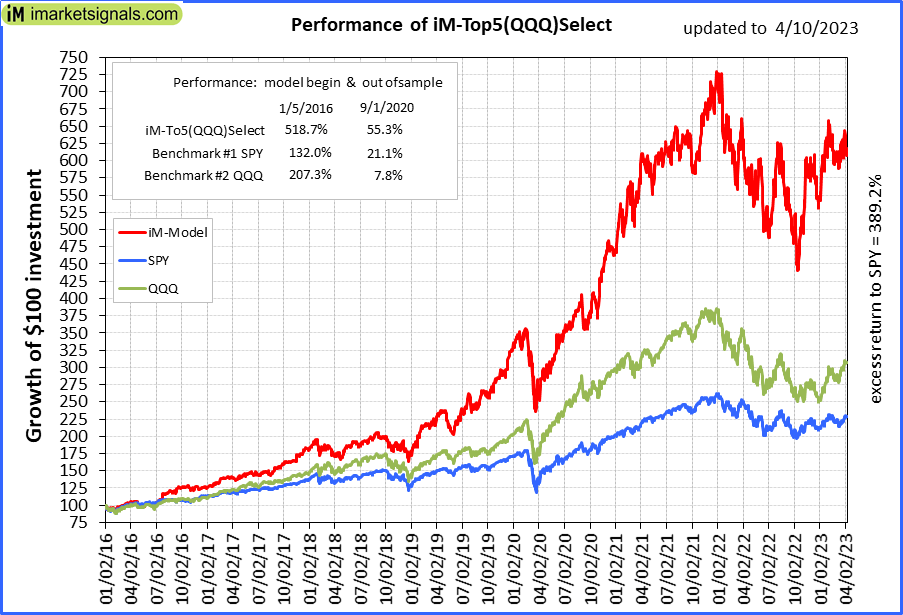 |
iM-Top5(QQQ)Select: Since inception, on 1/5/2016, the model gained 517.96% while the benchmark SPY gained 128.75% over the same period. Over the previous week the market value of iM-Top5(QQQ)Select gained -2.94% at a time when SPY gained -0.33%. A starting capital of $100,000 at inception on 1/5/2016 would have grown to $617,960 which includes $1,908 cash and excludes $9,482 spent on fees and slippage. |
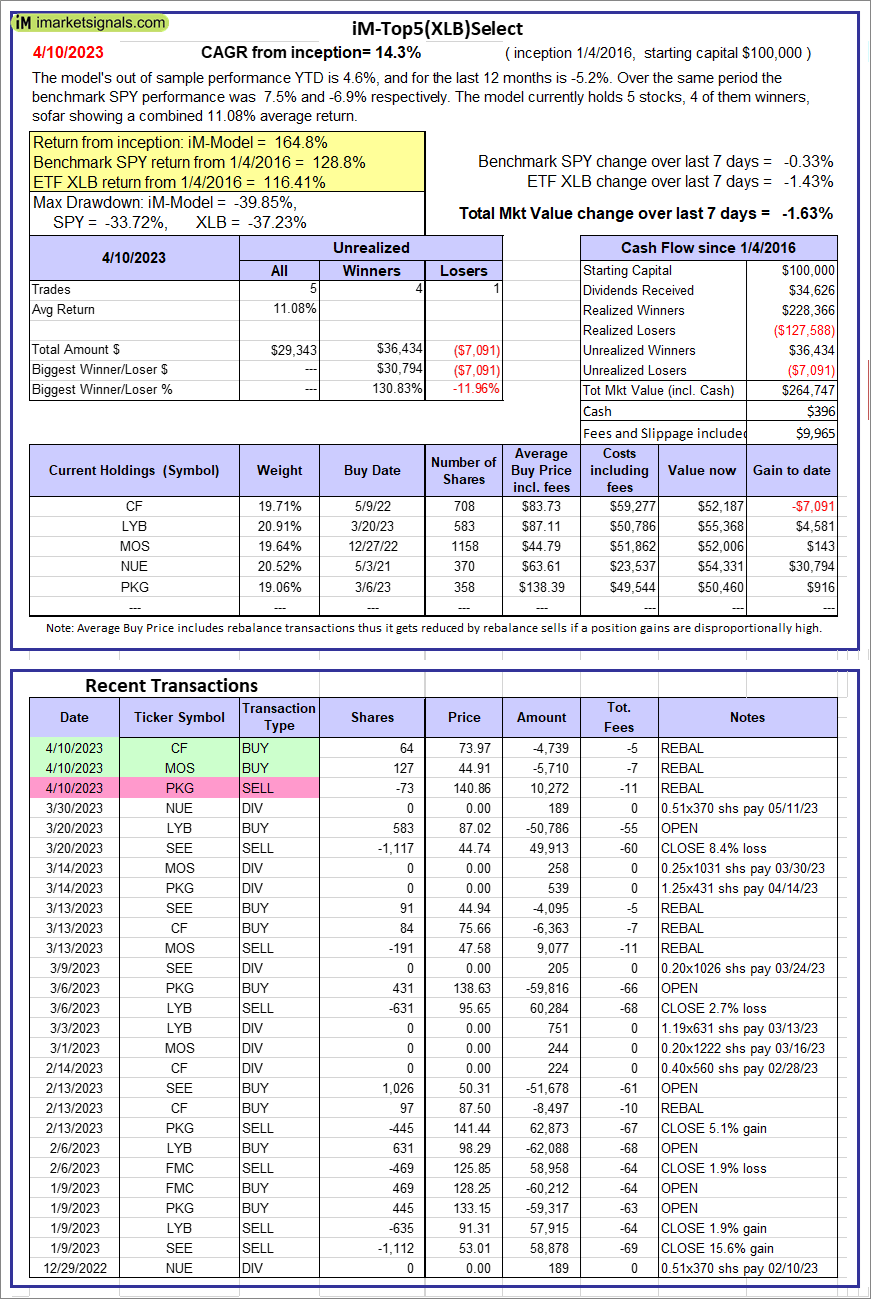 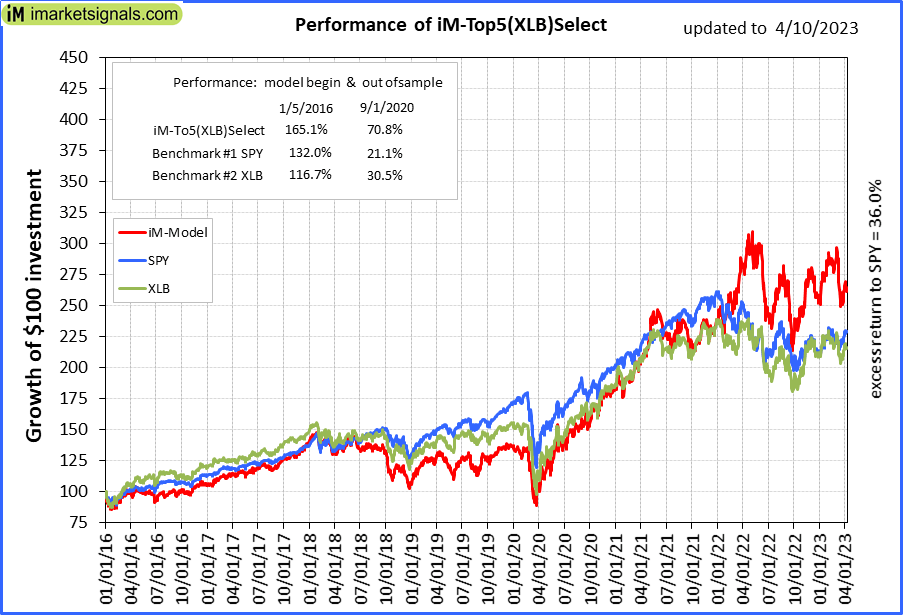 |
iM-Top5(XLB)Select: Since inception, on 1/5/2016, the model gained 164.75% while the benchmark SPY gained 128.75% over the same period. Over the previous week the market value of iM-Top5(XLB)Select gained -1.63% at a time when SPY gained -0.33%. A starting capital of $100,000 at inception on 1/5/2016 would have grown to $264,747 which includes $396 cash and excludes $9,965 spent on fees and slippage. |
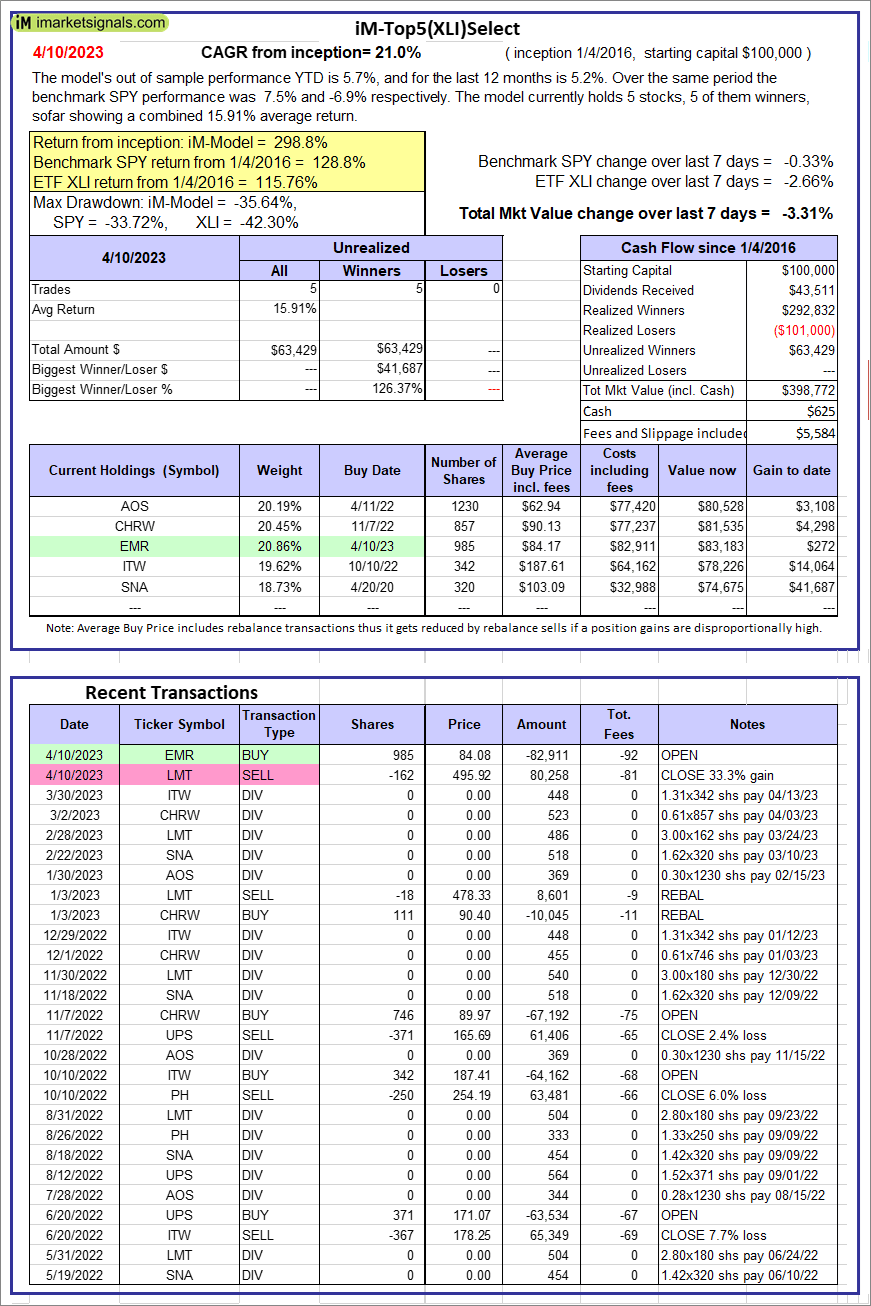 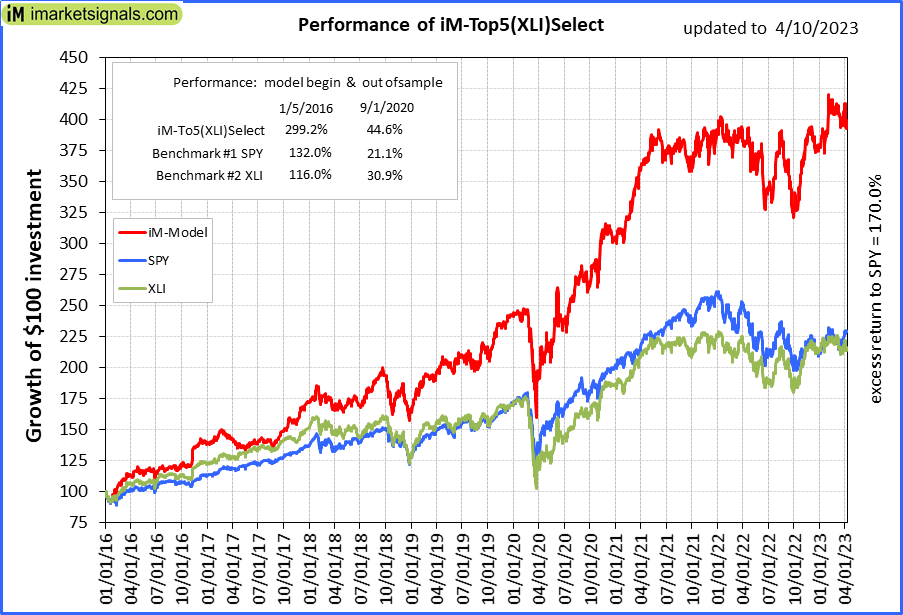 |
iM-Top5(XLI)Select: Since inception, on 1/5/2016, the model gained 298.77% while the benchmark SPY gained 128.75% over the same period. Over the previous week the market value of iM-Top5(XLI)Select gained -3.31% at a time when SPY gained -0.33%. A starting capital of $100,000 at inception on 1/5/2016 would have grown to $398,772 which includes $625 cash and excludes $5,584 spent on fees and slippage. |
 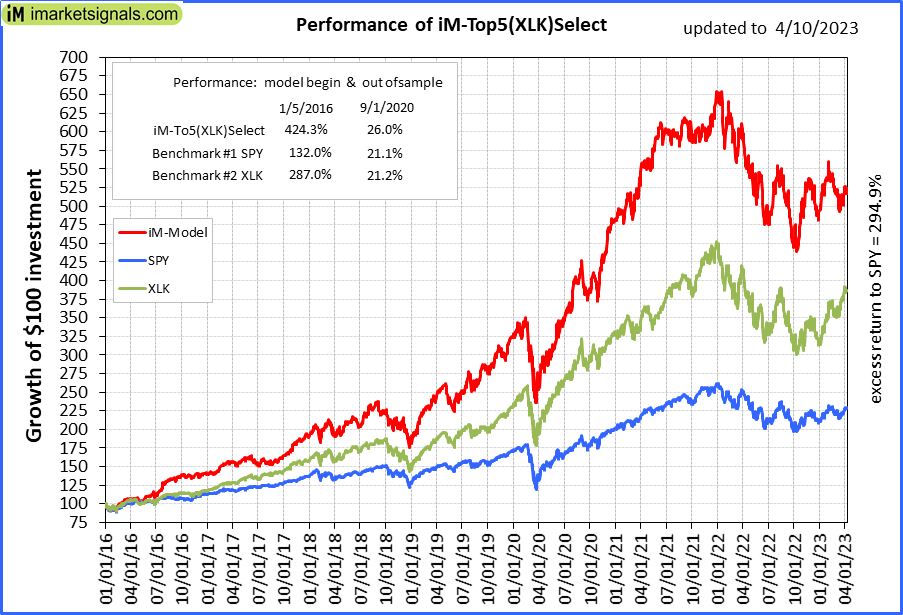 |
iM-Top5(XLK)Select: Since inception, on 1/5/2016, the model gained 423.66% while the benchmark SPY gained 128.75% over the same period. Over the previous week the market value of iM-Top5(XLK)Select gained -0.54% at a time when SPY gained -0.33%. A starting capital of $100,000 at inception on 1/5/2016 would have grown to $523,656 which includes $2,828 cash and excludes $1,749 spent on fees and slippage. |
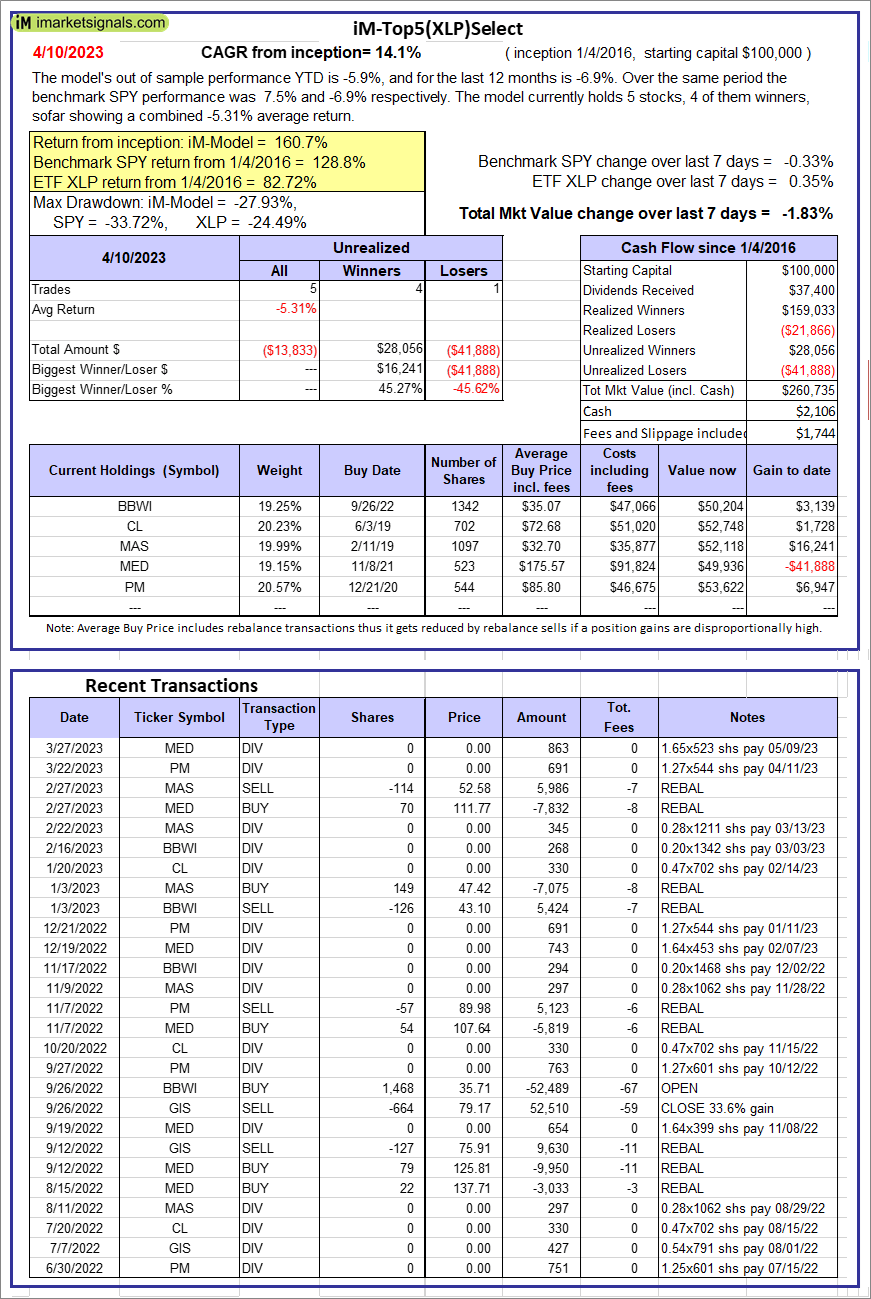 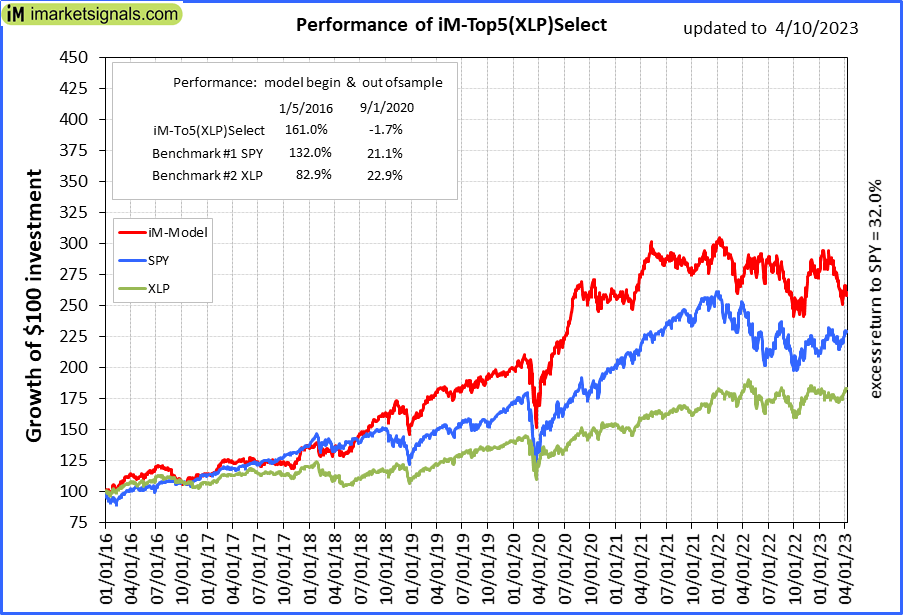 |
iM-Top5(XLP)Select: Since inception, on 1/5/2016, the model gained 160.73% while the benchmark SPY gained 128.75% over the same period. Over the previous week the market value of iM-Top5(XLP)Select gained -1.83% at a time when SPY gained -0.33%. A starting capital of $100,000 at inception on 1/5/2016 would have grown to $260,735 which includes $2,106 cash and excludes $1,744 spent on fees and slippage. |
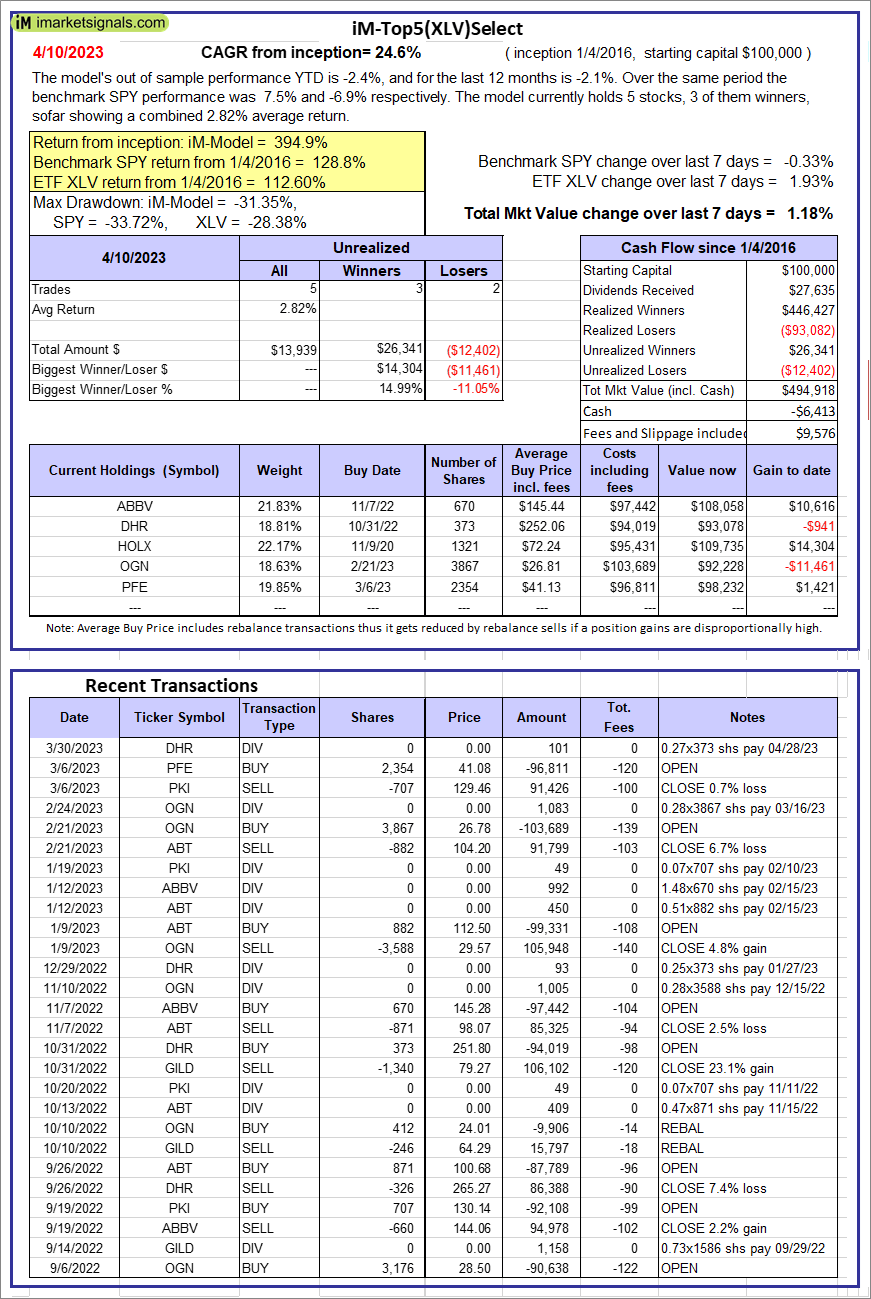 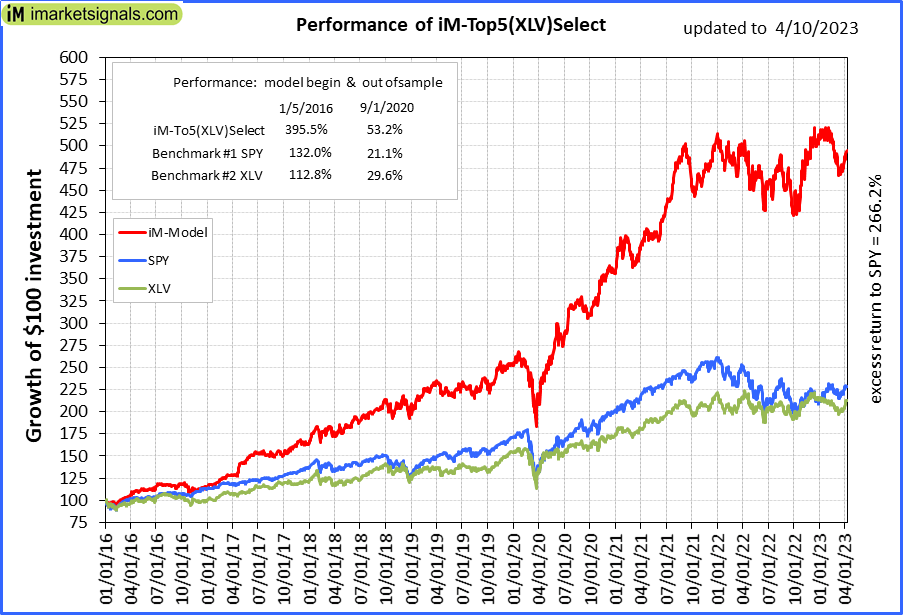 |
iM-Top5(XLV)Select: Since inception, on 1/5/2016, the model gained 394.92% while the benchmark SPY gained 128.75% over the same period. Over the previous week the market value of iM-Top5(XLV)Select gained 1.18% at a time when SPY gained -0.33%. A starting capital of $100,000 at inception on 1/5/2016 would have grown to $494,918 which includes -$6,413 cash and excludes $9,576 spent on fees and slippage. |
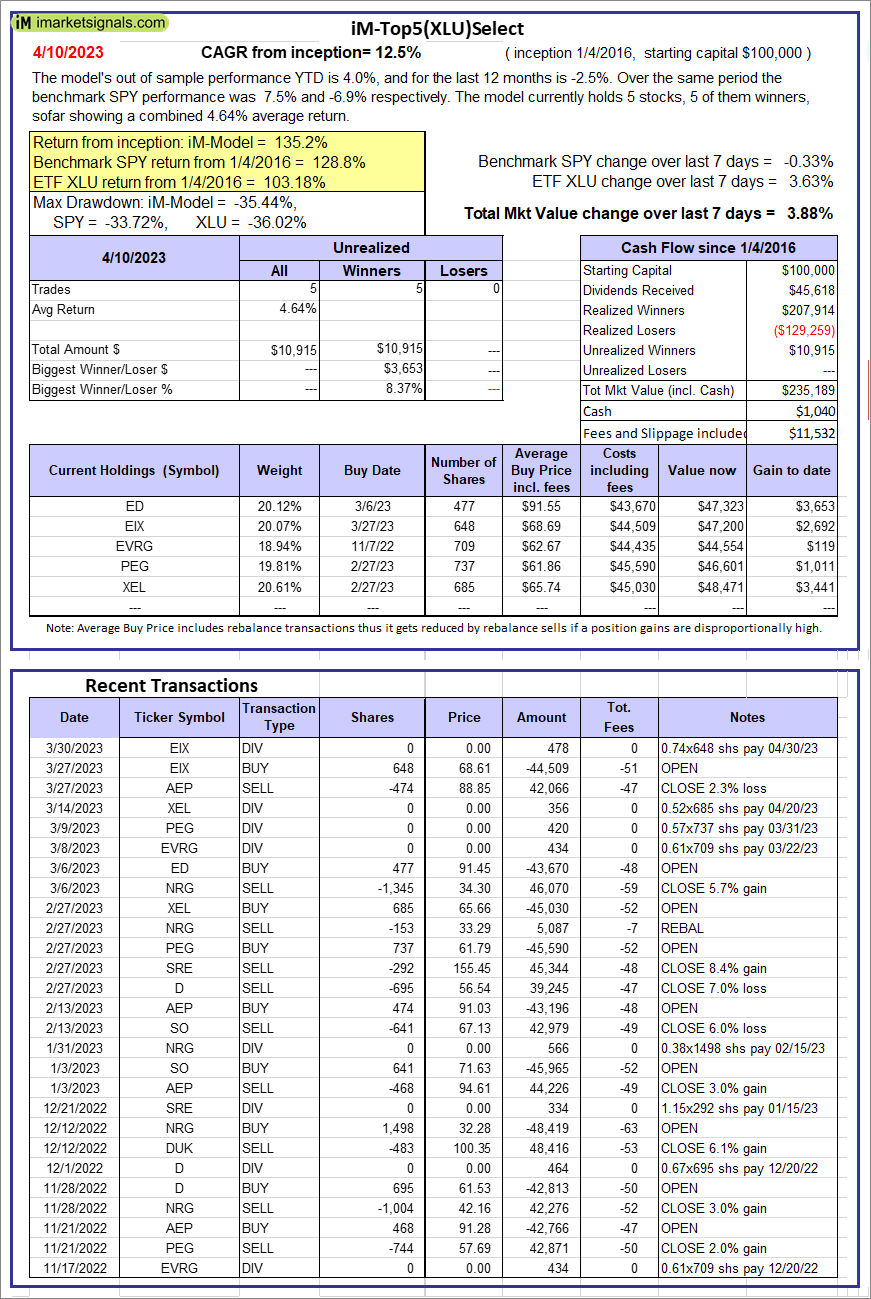 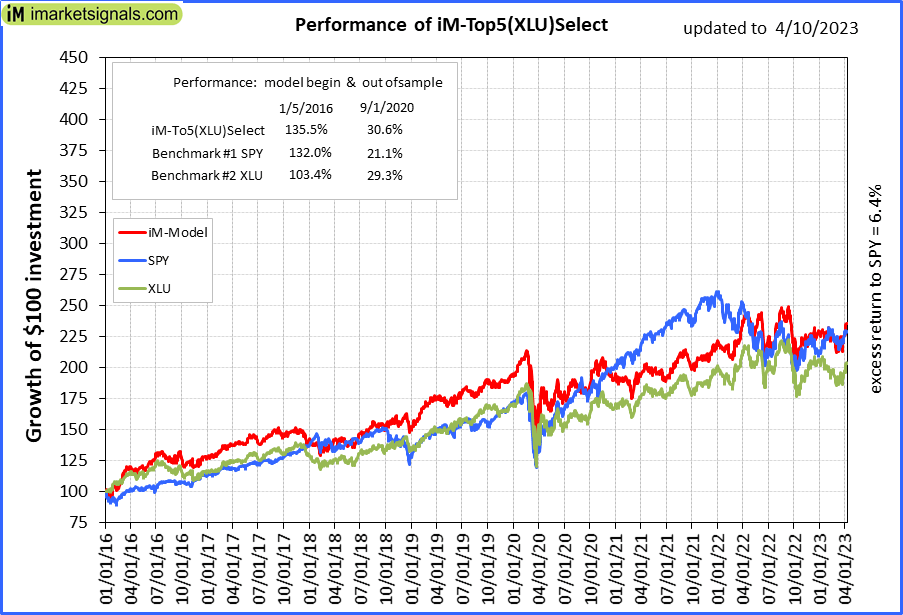 |
iM-Top5(XLU)Select: Since inception, on 1/5/2016, the model gained 135.19% while the benchmark SPY gained 128.75% over the same period. Over the previous week the market value of iM-Top5(XLU)Select gained 3.88% at a time when SPY gained -0.33%. A starting capital of $100,000 at inception on 1/5/2016 would have grown to $235,189 which includes $1,040 cash and excludes $11,532 spent on fees and slippage. |
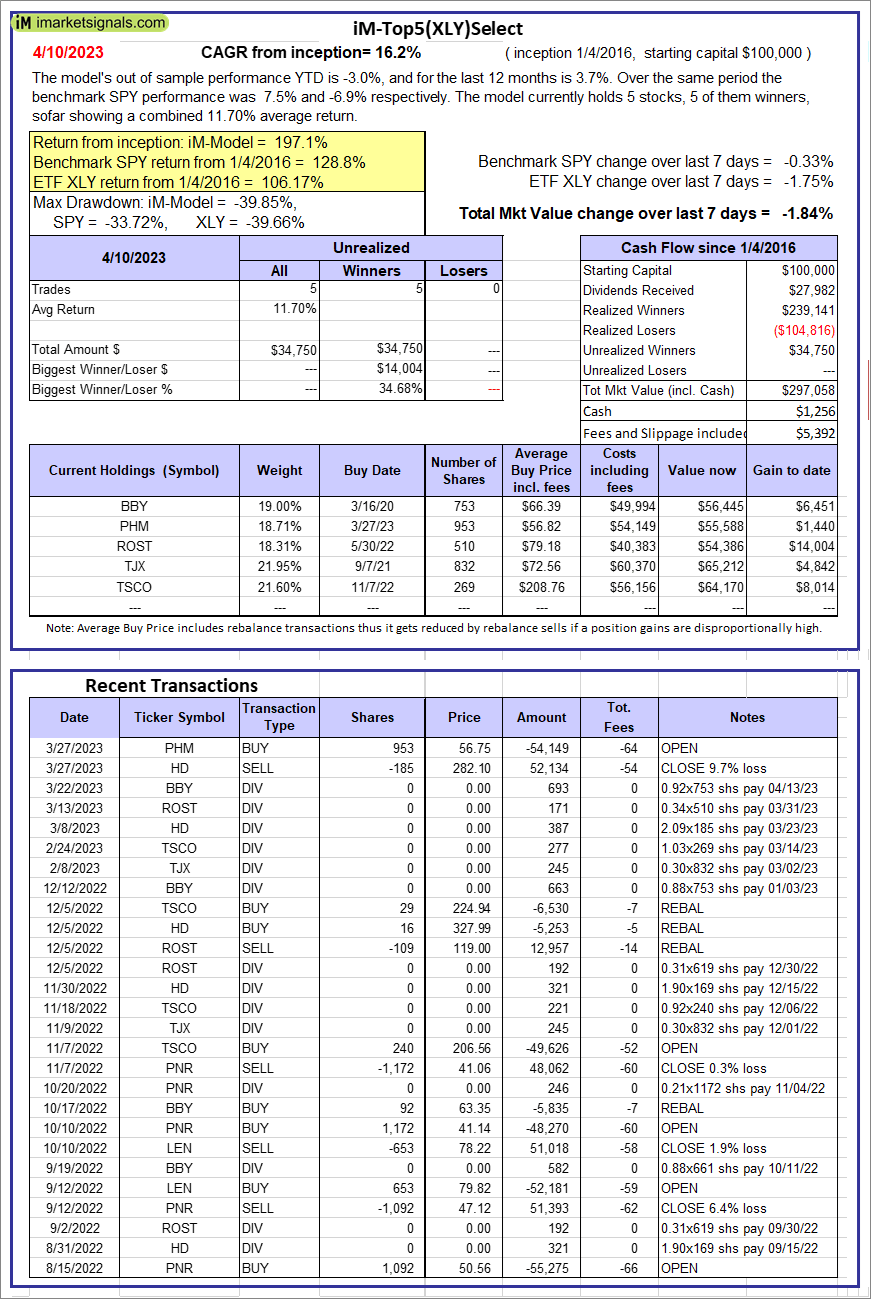 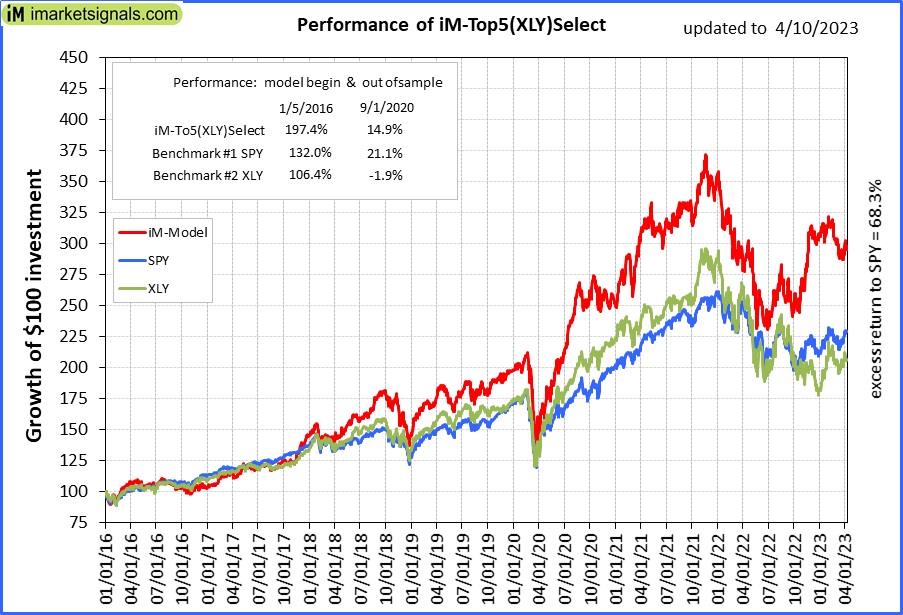 |
iM-Top5(XLY)Select: Since inception, on 1/5/2016, the model gained 197.06% while the benchmark SPY gained 128.75% over the same period. Over the previous week the market value of iM-Top5(XLY)Select gained -1.84% at a time when SPY gained -0.33%. A starting capital of $100,000 at inception on 1/5/2016 would have grown to $297,058 which includes $1,256 cash and excludes $5,392 spent on fees and slippage. |
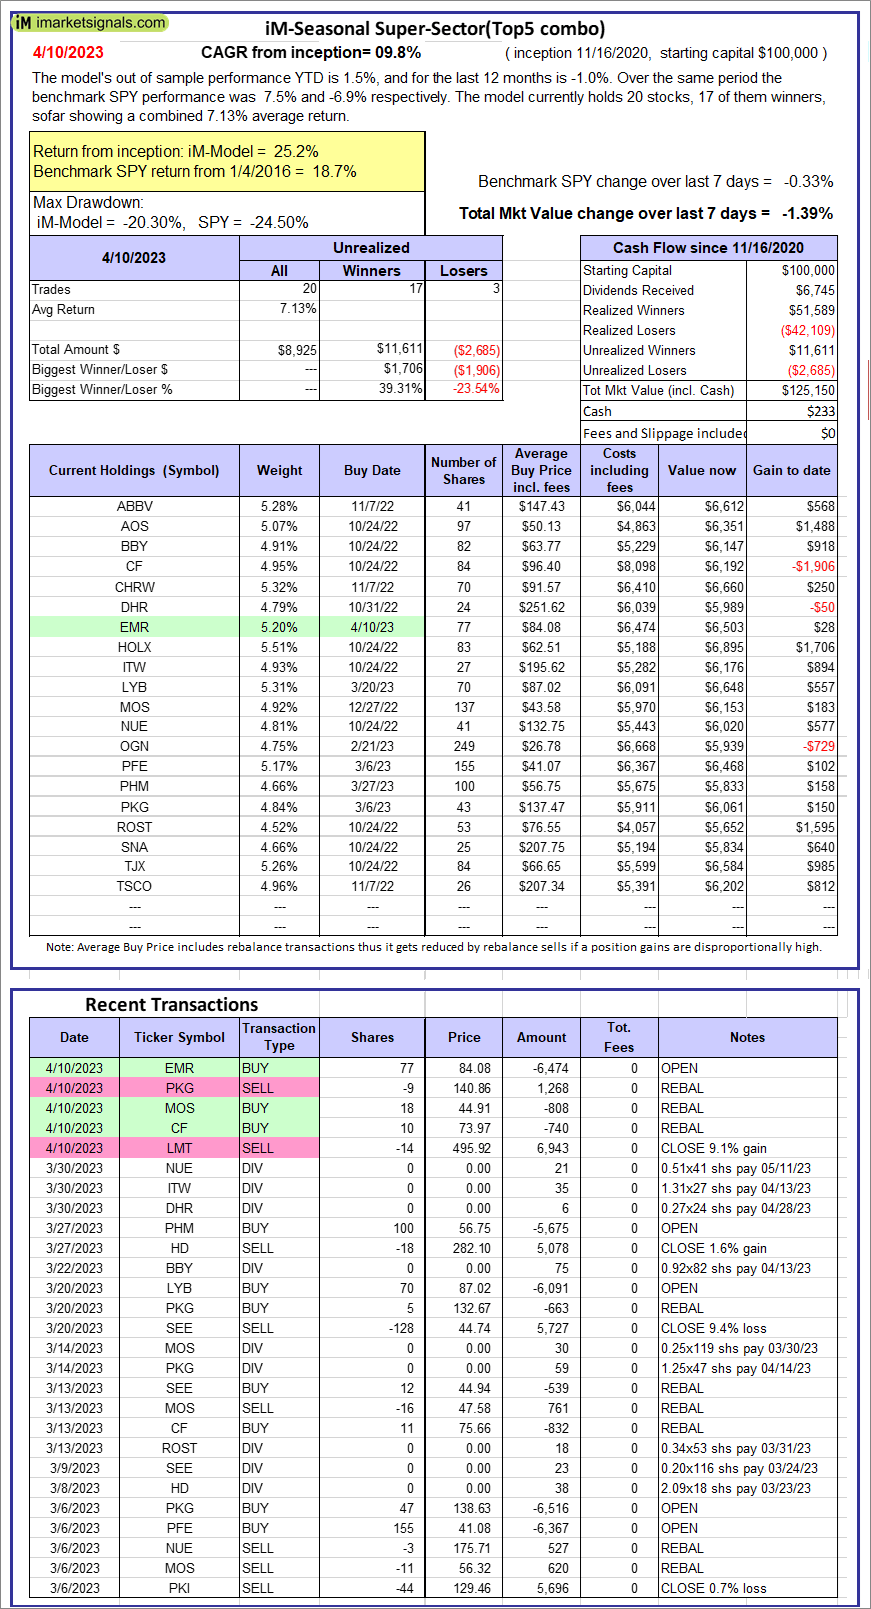 |
iM-Seasonal Super-Sectors (Top5 combo) : Since inception, on 11/17/2020, the model gained 25.15% while the benchmark SPY gained 18.74% over the same period. Over the previous week the market value of iM-Seasonal Super-Sectors (Top5 combo) gained -1.39% at a time when SPY gained -0.33%. A starting capital of $100,000 at inception on 11/17/2020 would have grown to $125,150 which includes $233 cash and excludes $00 spent on fees and slippage. |
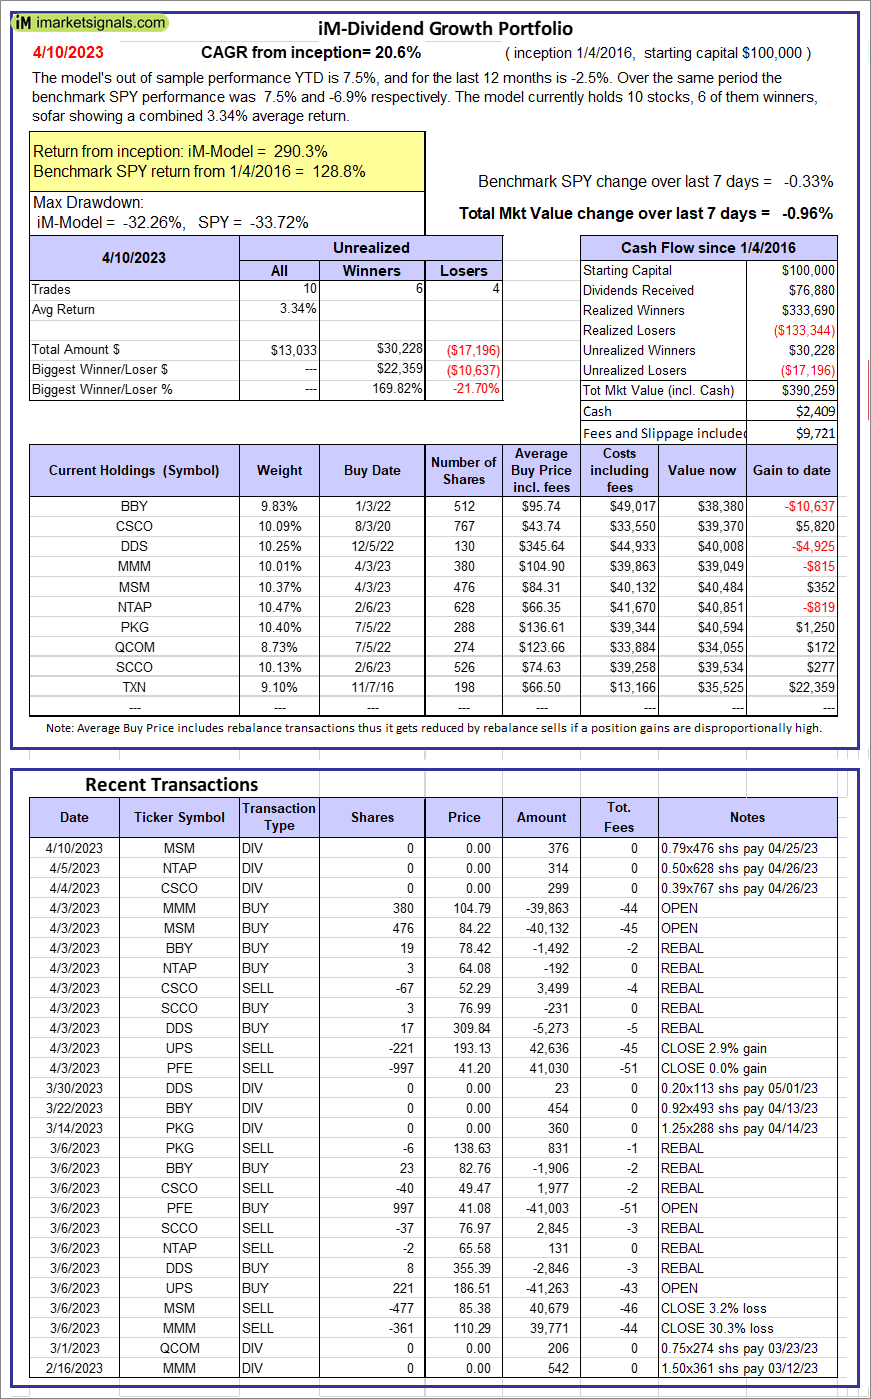 |
iM-Dividend Growth Portfolio: The model’s out of sample performance YTD is 7.5%, and for the last 12 months is -2.5%. Over the same period the benchmark SPY performance was 7.5% and -6.9% respectively. Over the previous week the market value of the iM-Dividend Growth Portfolio gained -0.96% at a time when SPY gained -0.33%. A starting capital of $100,000 at inception on 6/30/2016 would have grown to $390,259 which includes $2,409 cash and excludes $9,721 spent on fees and slippage. |
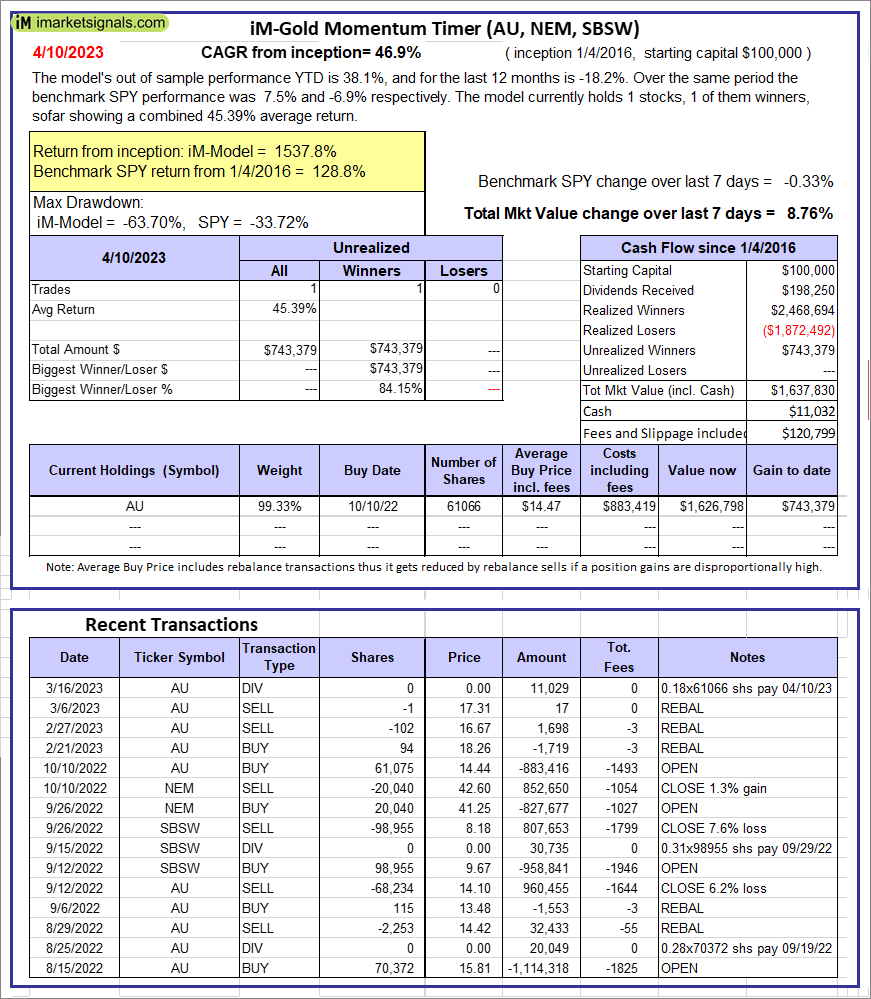 |
iM-Gold Momentum Timer (AU, NEM, SBSW): The model’s out of sample performance YTD is 38.1%, and for the last 12 months is -18.2%. Over the same period the benchmark SPY performance was 7.5% and -6.9% respectively. Over the previous week the market value of iM-Gold Momentum Timer (AU, NEM, SBSW) gained 8.76% at a time when SPY gained -0.33%. A starting capital of $100,000 at inception on 6/30/2016 would have grown to $11,032 which includes $120,799 cash and excludes Gain to date spent on fees and slippage. |
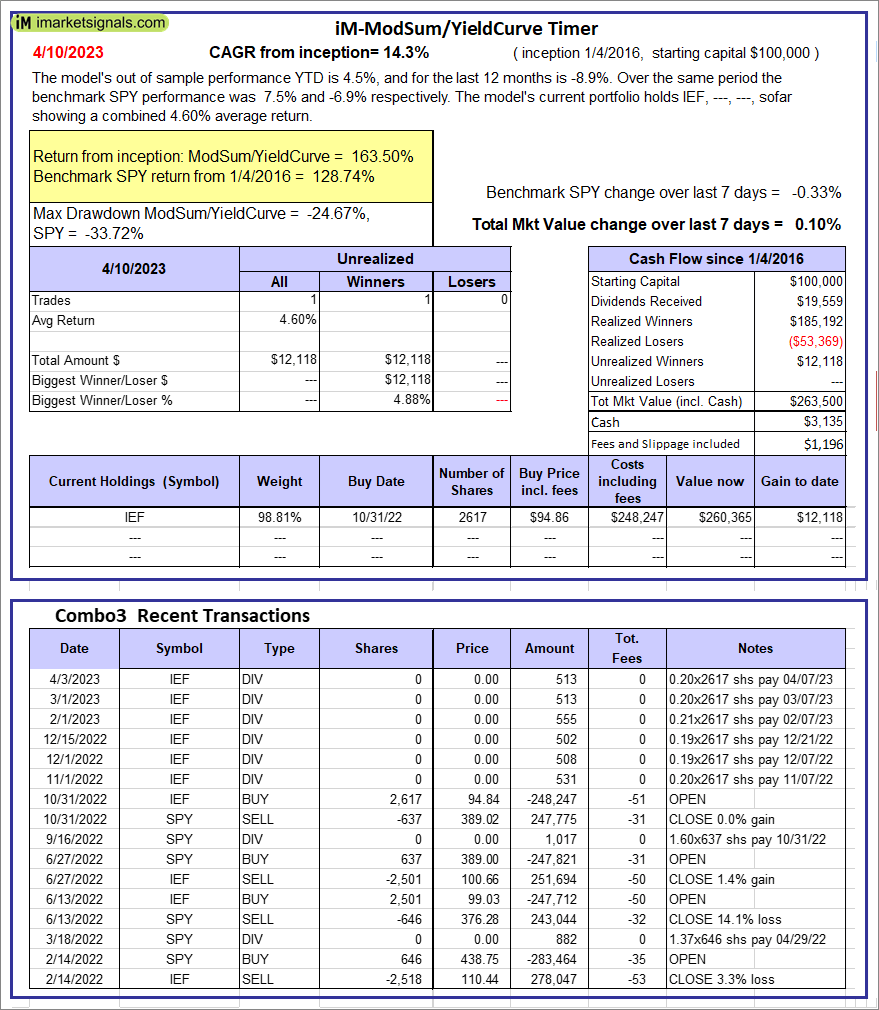 |
iM-ModSum/YieldCurve Timer: The model’s out of sample performance YTD is 4.5%, and for the last 12 months is -8.9%. Over the same period the benchmark SPY performance was 7.5% and -6.9% respectively. Over the previous week the market value of iM-PortSum/YieldCurve Timer gained 0.10% at a time when SPY gained -0.33%. A starting capital of $100,000 at inception on 1/1/2016 would have grown to $263,500 which includes $3,135 cash and excludes $1,196 spent on fees and slippage. |
 |
iM-Best(SPY-SH).R1: The model’s out of sample performance YTD is -5.6%, and for the last 12 months is -22.9%. Over the same period the benchmark SPY performance was 7.5% and -6.9% respectively. Over the previous week the market value of Best(SPY-SH) gained 0.53% at a time when SPY gained -0.33%. A starting capital of $100,000 at inception on 1/2/2009 would have grown to $63,192 which includes $720 cash and excludes $2,437 spent on fees and slippage. |
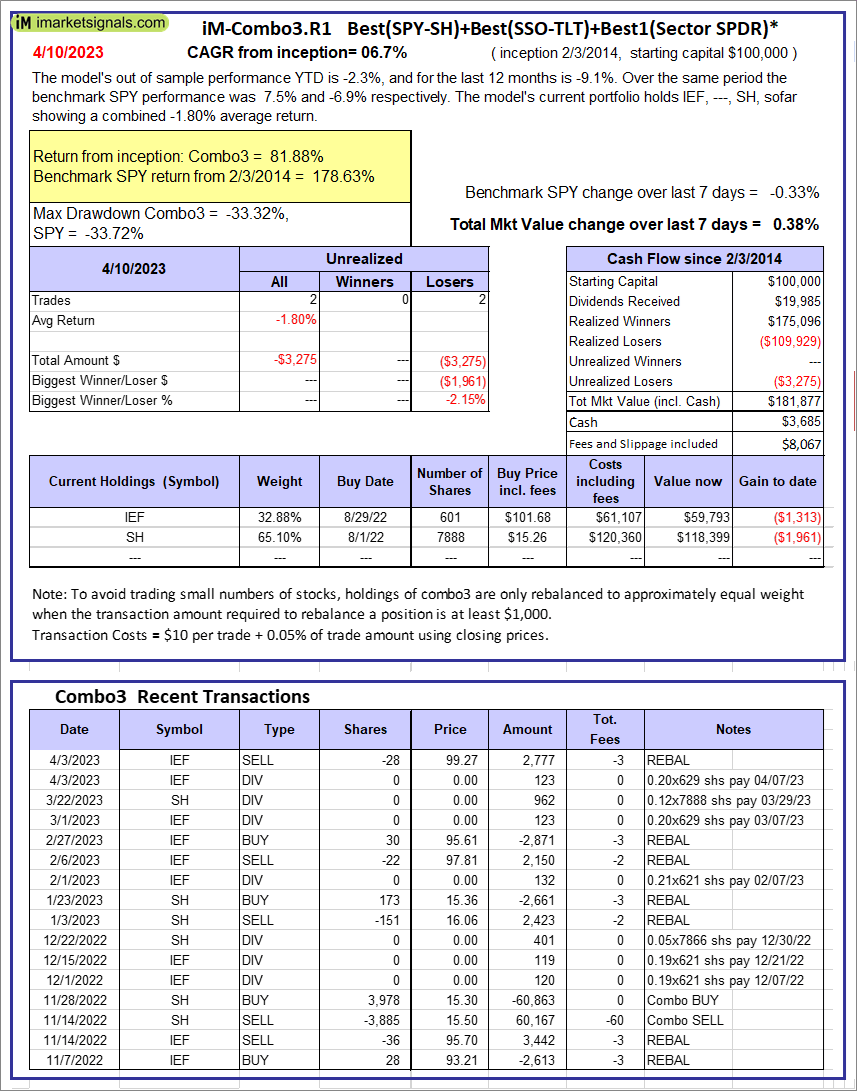 |
iM-Combo3.R1: The model’s out of sample performance YTD is -2.3%, and for the last 12 months is -9.1%. Over the same period the benchmark SPY performance was 7.5% and -6.9% respectively. Over the previous week the market value of iM-Combo3.R1 gained 0.38% at a time when SPY gained -0.33%. A starting capital of $100,000 at inception on 2/3/2014 would have grown to $181,877 which includes $3,685 cash and excludes $8,067 spent on fees and slippage. |
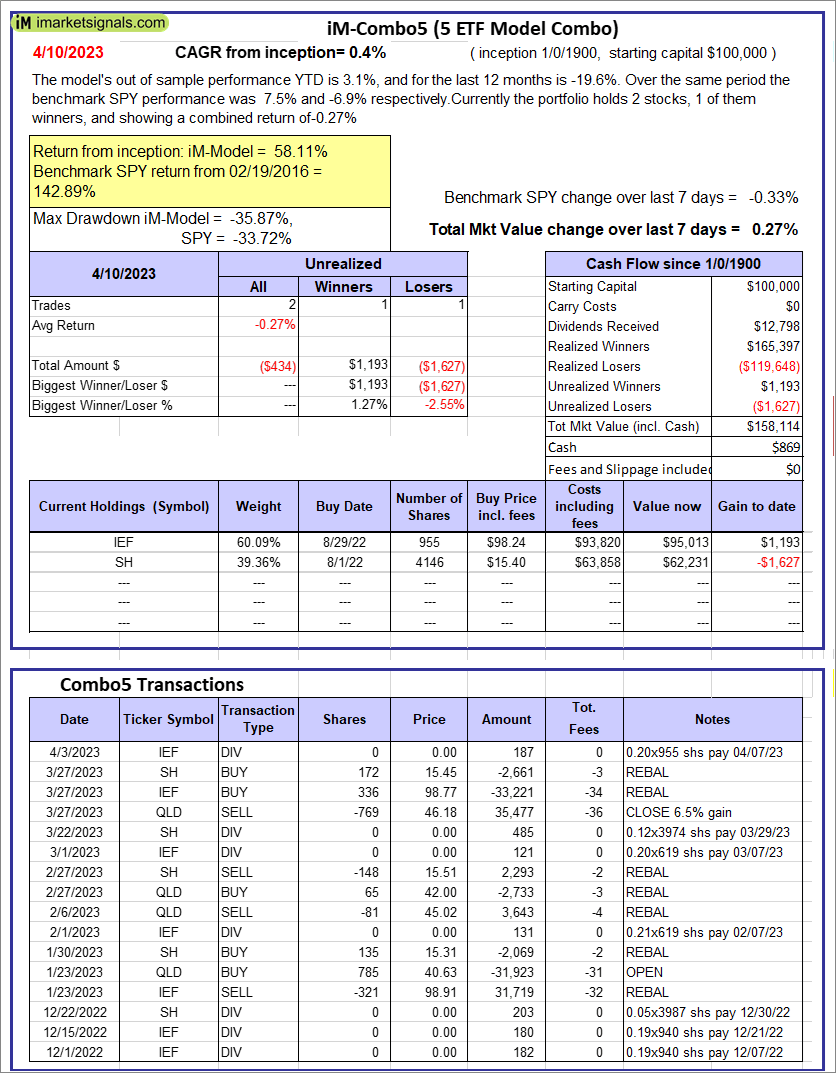 |
iM-Combo5: The model’s out of sample performance YTD is 3.1%, and for the last 12 months is -19.6%. Over the same period the benchmark SPY performance was 7.5% and -6.9% respectively. Over the previous week the market value of iM-Combo5 gained 0.27% at a time when SPY gained -0.33%. A starting capital of $100,000 at inception on 2/22/2016 would have grown to $158,114 which includes $869 cash and excludes $0 spent on fees and slippage. |
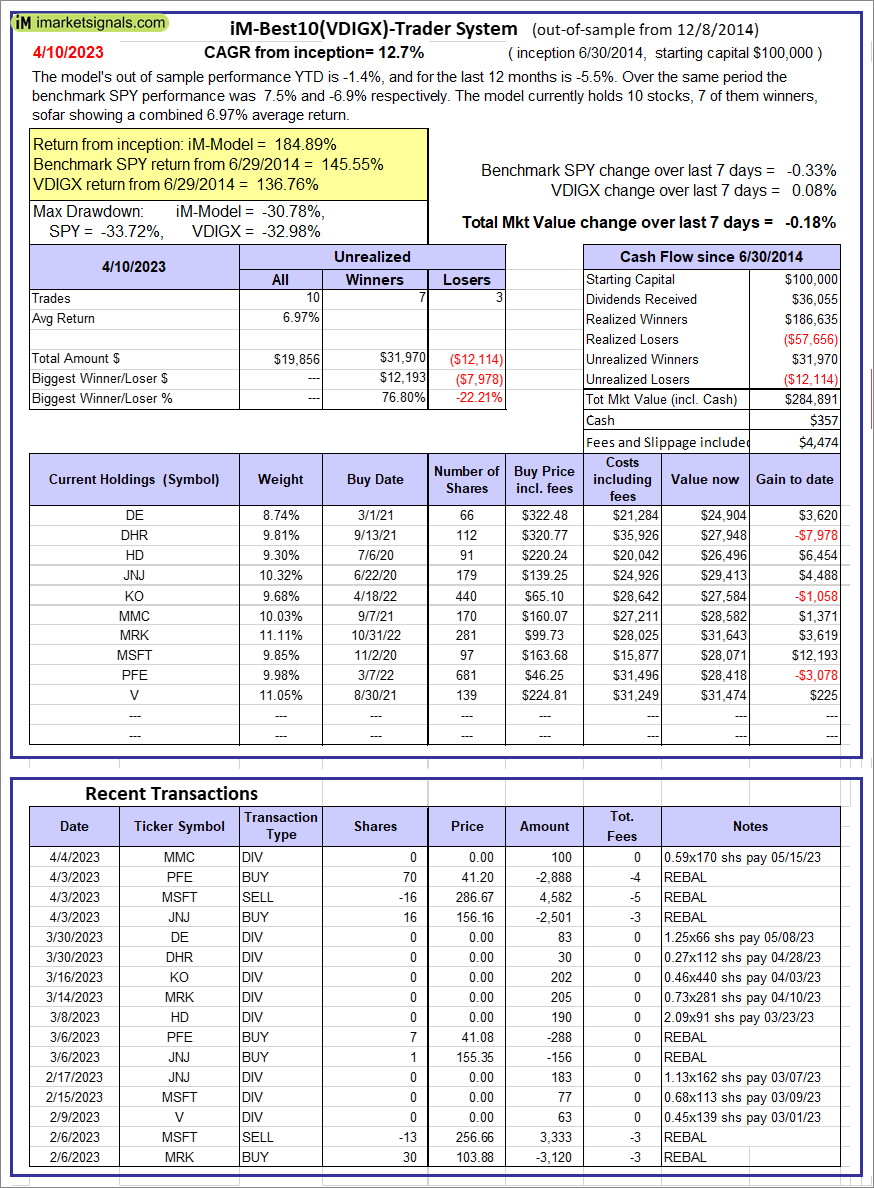 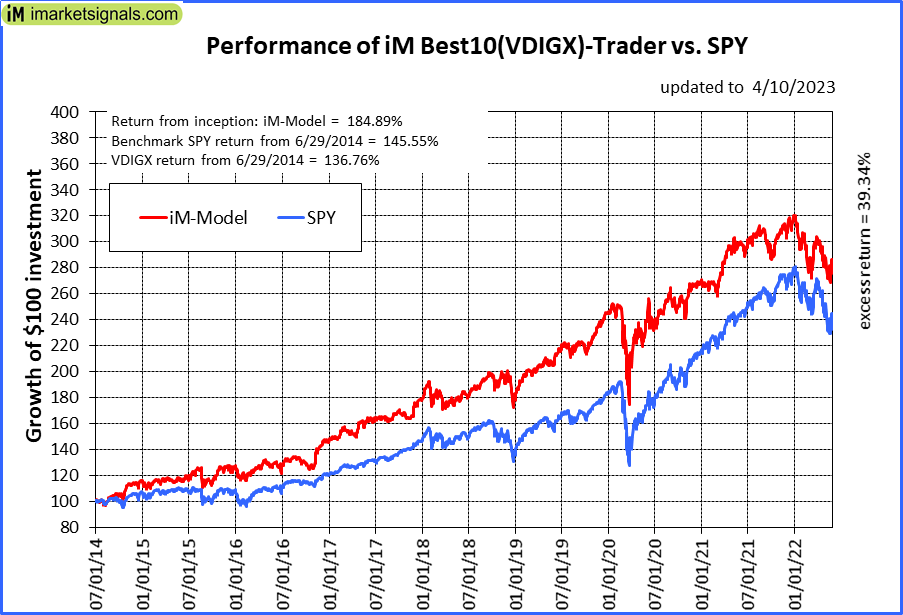 |
iM-Best10(VDIGX)-Trader: The model’s out of sample performance YTD is -1.4%, and for the last 12 months is -5.5%. Over the same period the benchmark SPY performance was 7.5% and -6.9% respectively. Since inception, on 7/1/2014, the model gained 184.89% while the benchmark SPY gained 145.55% and VDIGX gained 136.76% over the same period. Over the previous week the market value of iM-Best10(VDIGX) gained -0.18% at a time when SPY gained -0.33%. A starting capital of $100,000 at inception on 7/1/2014 would have grown to $284,891 which includes $357 cash and excludes $4,474 spent on fees and slippage. |
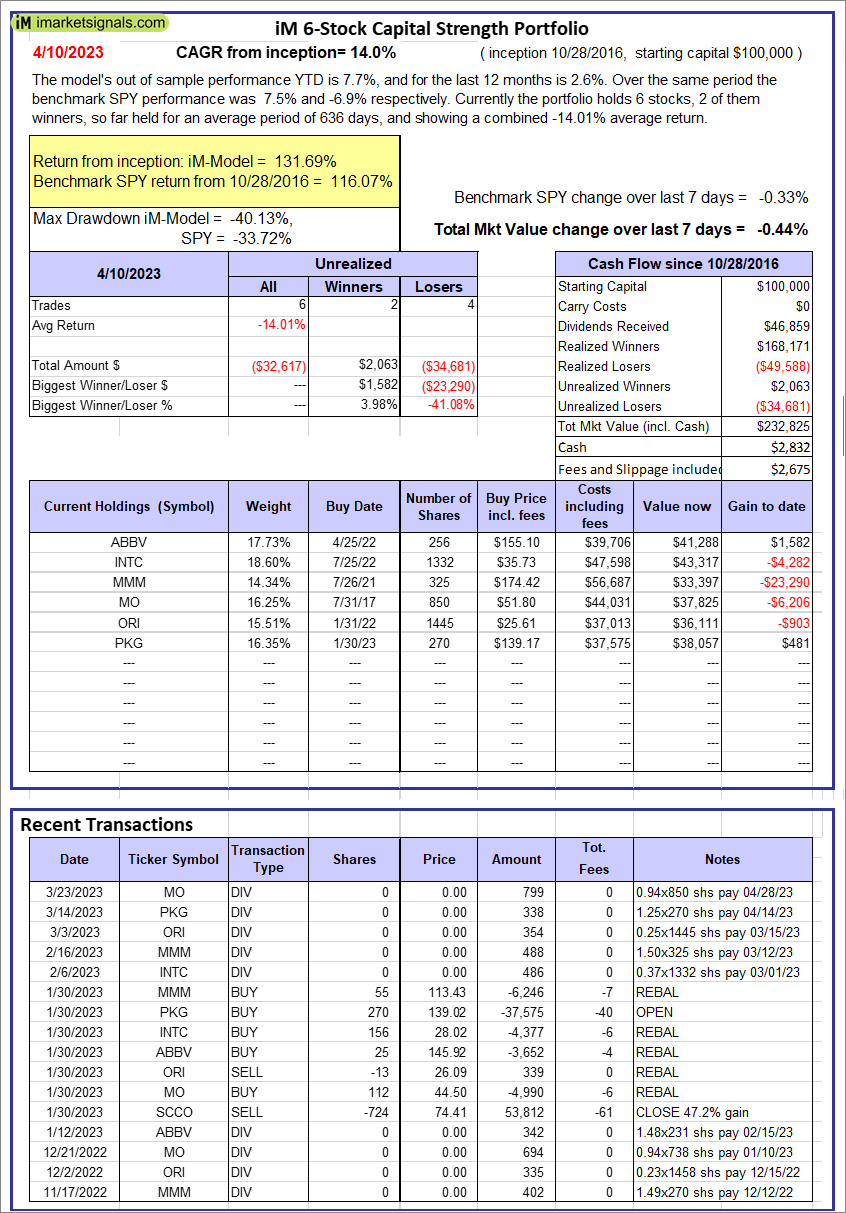 |
iM 6-Stock Capital Strength Portfolio: The model’s out of sample performance YTD is 7.7%, and for the last 12 months is 2.6%. Over the same period the benchmark SPY performance was 7.5% and -6.9% respectively. Over the previous week the market value of the iM 6-Stock Capital Strength Portfolio gained -0.44% at a time when SPY gained -0.33%. A starting capital of $100,000 at inception on 10/28/2016 would have grown to $232,825 which includes $2,832 cash and excludes $2,675 spent on fees and slippage. |
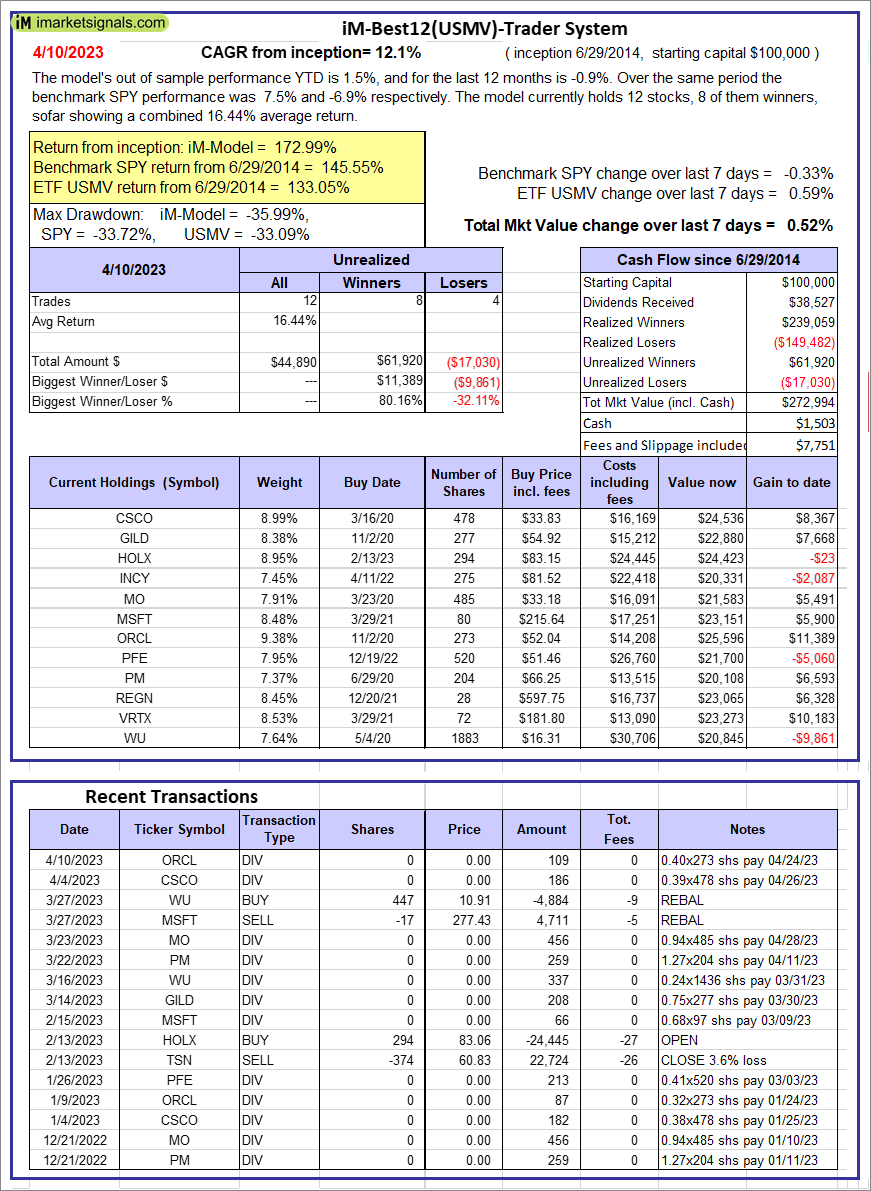 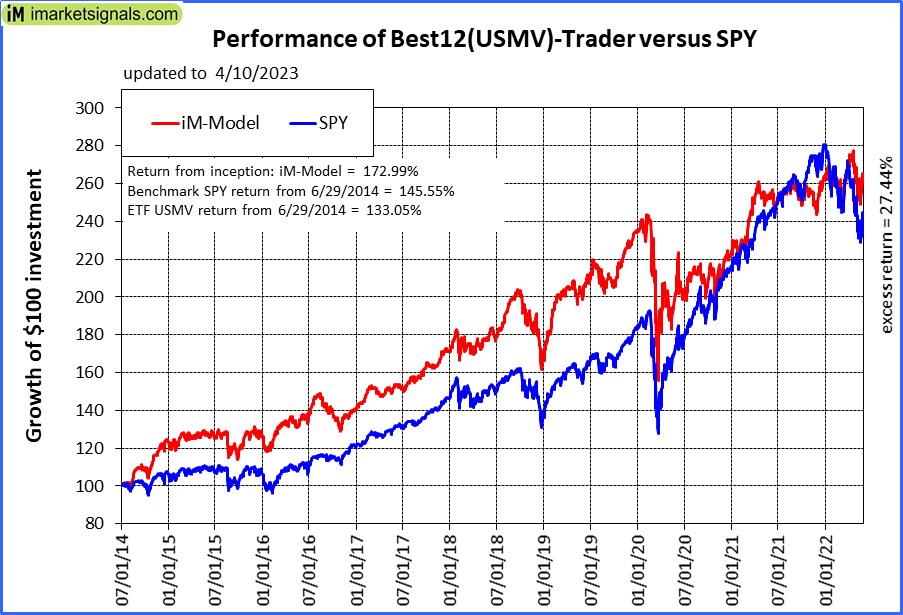 |
iM-Best12(USMV)-Trader: The model’s out of sample performance YTD is 1.5%, and for the last 12 months is -0.9%. Over the same period the benchmark SPY performance was 7.5% and -6.9% respectively. Since inception, on 6/30/2014, the model gained 172.99% while the benchmark SPY gained 145.55% and the ETF USMV gained 133.05% over the same period. Over the previous week the market value of iM-Best12(USMV)-Trader gained 0.52% at a time when SPY gained -0.33%. A starting capital of $100,000 at inception on 6/30/2014 would have grown to $272,994 which includes $1,503 cash and excludes $7,751 spent on fees and slippage. |
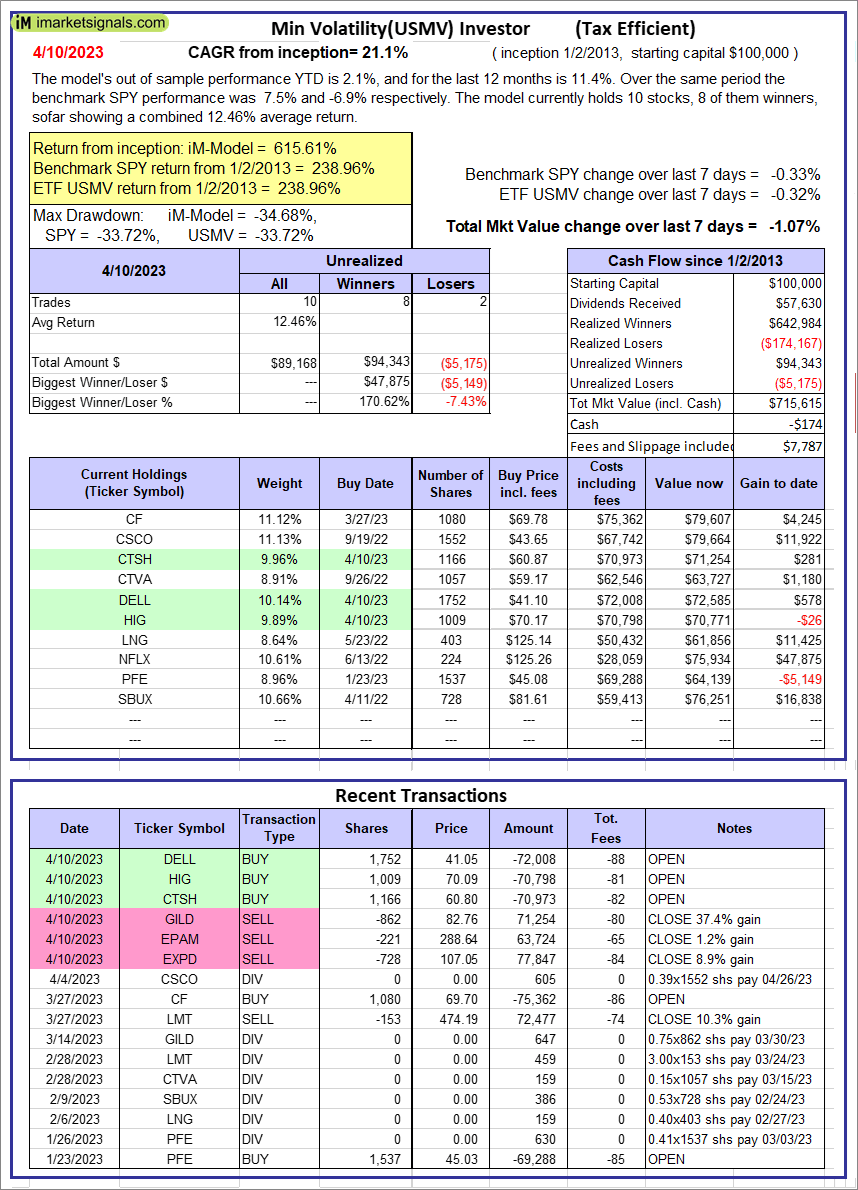 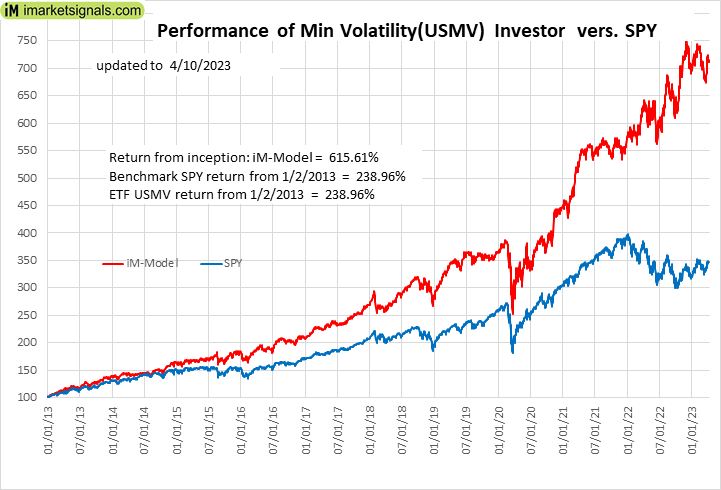 |
iM-Min Volatility(USMV) Investor (Tax Efficient): The model’s out of sample performance YTD is 2.1%, and for the last 12 months is 11.4%. Over the same period the benchmark SPY performance was 7.5% and -6.9% respectively. Since inception, on 1/3/2013, the model gained 615.61% while the benchmark SPY gained 238.96% and the ETF USMV gained 238.96% over the same period. Over the previous week the market value of iM-Best12(USMV)Q1 gained -1.07% at a time when SPY gained -0.33%. A starting capital of $100,000 at inception on 1/3/2013 would have grown to $715,615 which includes -$174 cash and excludes $7,787 spent on fees and slippage. |
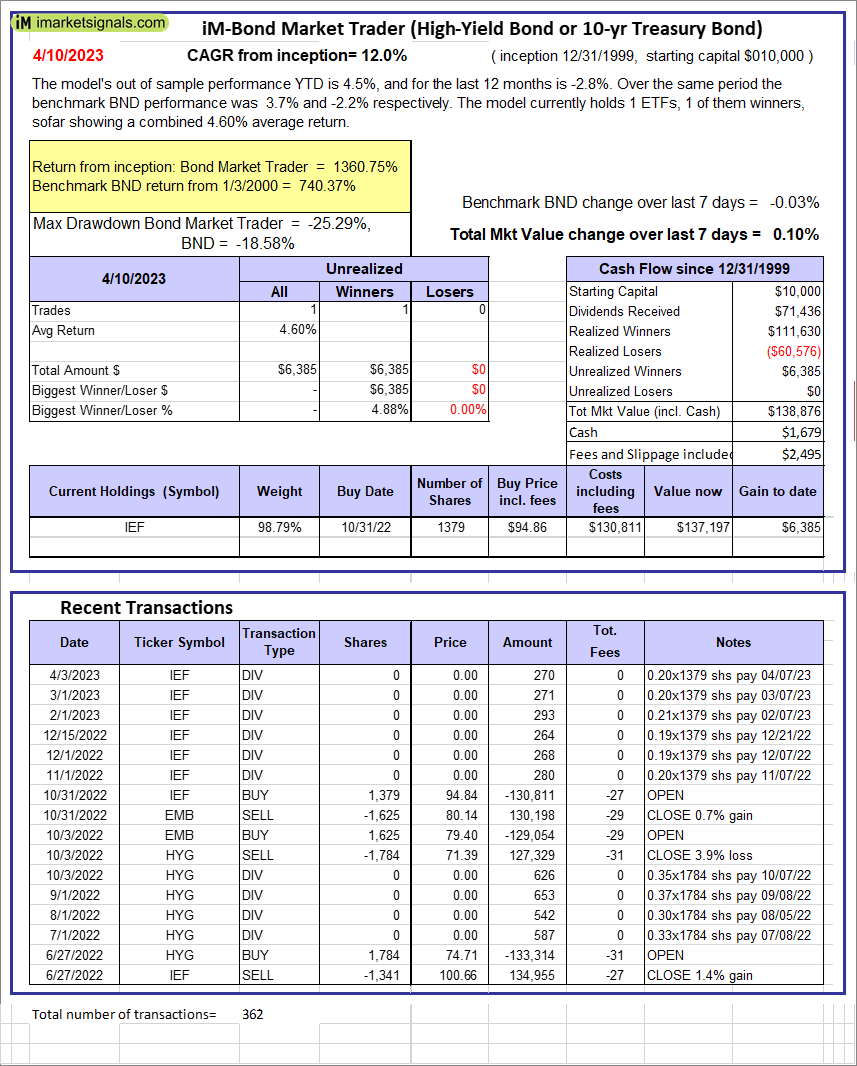 |
iM-Bond Market Trader (High-Yield Bond or 10-yr Treasury Bond): The model’s out of sample performance YTD is 4.5%, and for the last 12 months is -2.8%. Over the same period the benchmark BND performance was 3.7% and -2.2% respectively. Over the previous week the market value of the iM-Bond Market Trader (High-Yield Bond or 10-yr Treasury Bond) gained 0.10% at a time when BND gained -0.03%. A starting capital of $10,000 at inception on 1/3/2000 would have grown to $138,876 which includes $1,679 cash and excludes $2,495 spent on fees and slippage. |
|
|
iM-ModSum/YieldCurve Timer: The model’s out of sample performance YTD is 4.5%, and for the last 12 months is -8.9%. Over the same period the benchmark SPY performance was 7.5% and -6.9% respectively. Over the previous week the market value of iM-PortSum/YieldCurve Timer gained 0.10% at a time when SPY gained -0.33%. A starting capital of $100,000 at inception on 1/1/2016 would have grown to $263,500 which includes $3,135 cash and excludes $1,196 spent on fees and slippage. |
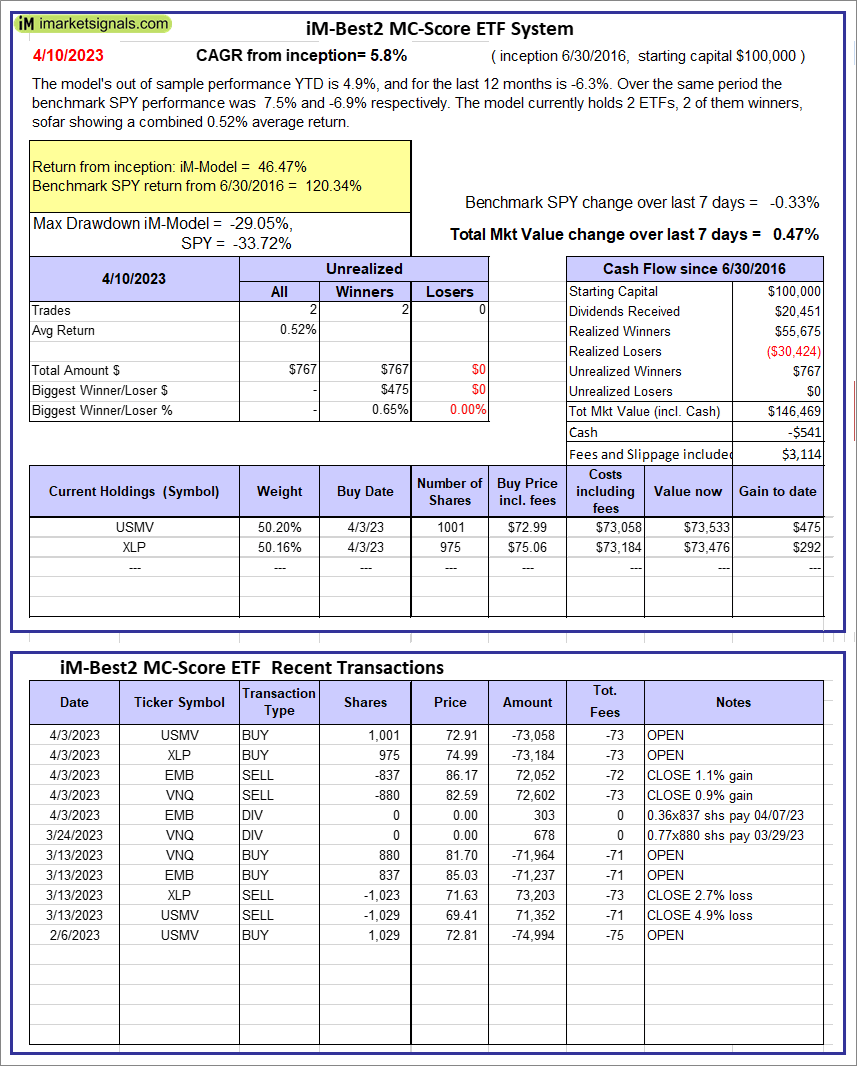 |
iM-Best2 MC-Score ETF System: The model’s out of sample performance YTD is 4.9%, and for the last 12 months is -6.3%. Over the same period the benchmark SPY performance was 7.5% and -6.9% respectively. Over the previous week the market value of the iM-Best2 MC-Score ETF System gained 0.47% at a time when SPY gained -0.33%. A starting capital of $100,000 at inception on 6/30/2016 would have grown to $146,469 which includes -$541 cash and excludes $3,114 spent on fees and slippage. |
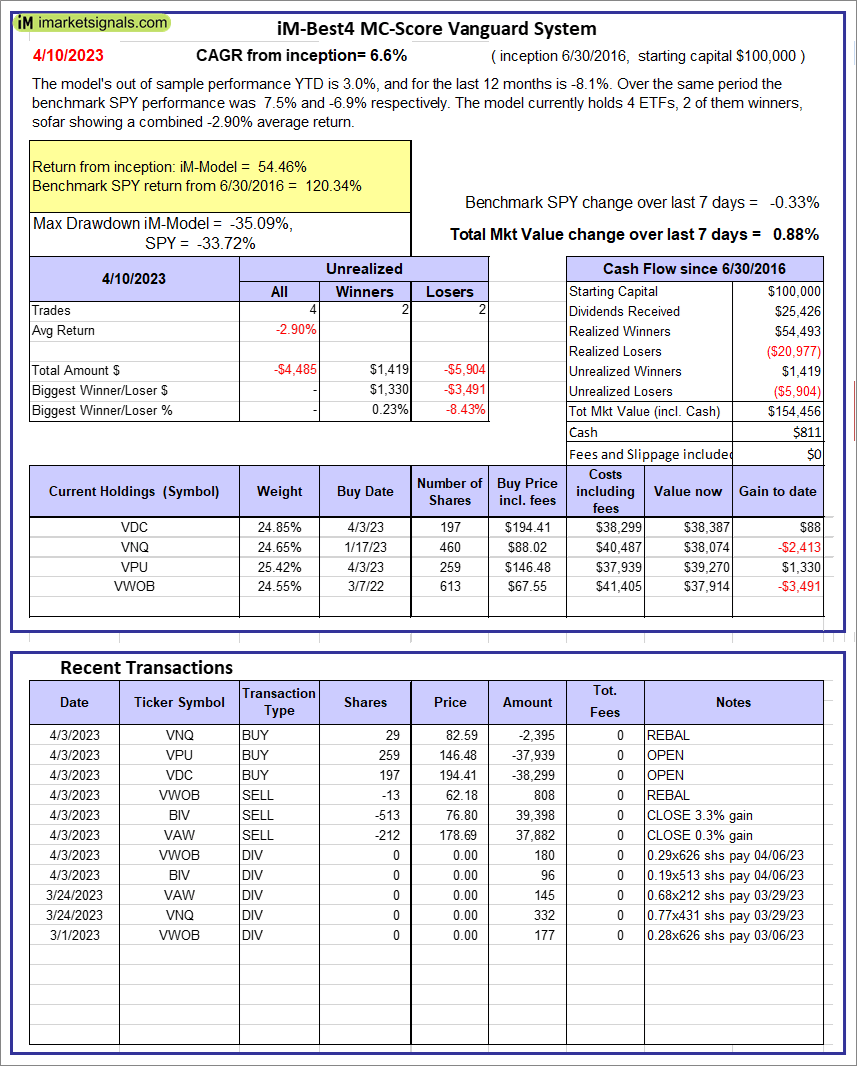 |
iM-Best4 MC-Score Vanguard System: The model’s out of sample performance YTD is 3.0%, and for the last 12 months is -8.1%. Over the same period the benchmark SPY performance was 7.5% and -6.9% respectively. Over the previous week the market value of the iM-Best4 MC-Score Vanguard System gained 0.88% at a time when SPY gained -0.33%. A starting capital of $100,000 at inception on 6/30/2016 would have grown to $154,456 which includes $811 cash and excludes $00 spent on fees and slippage. |
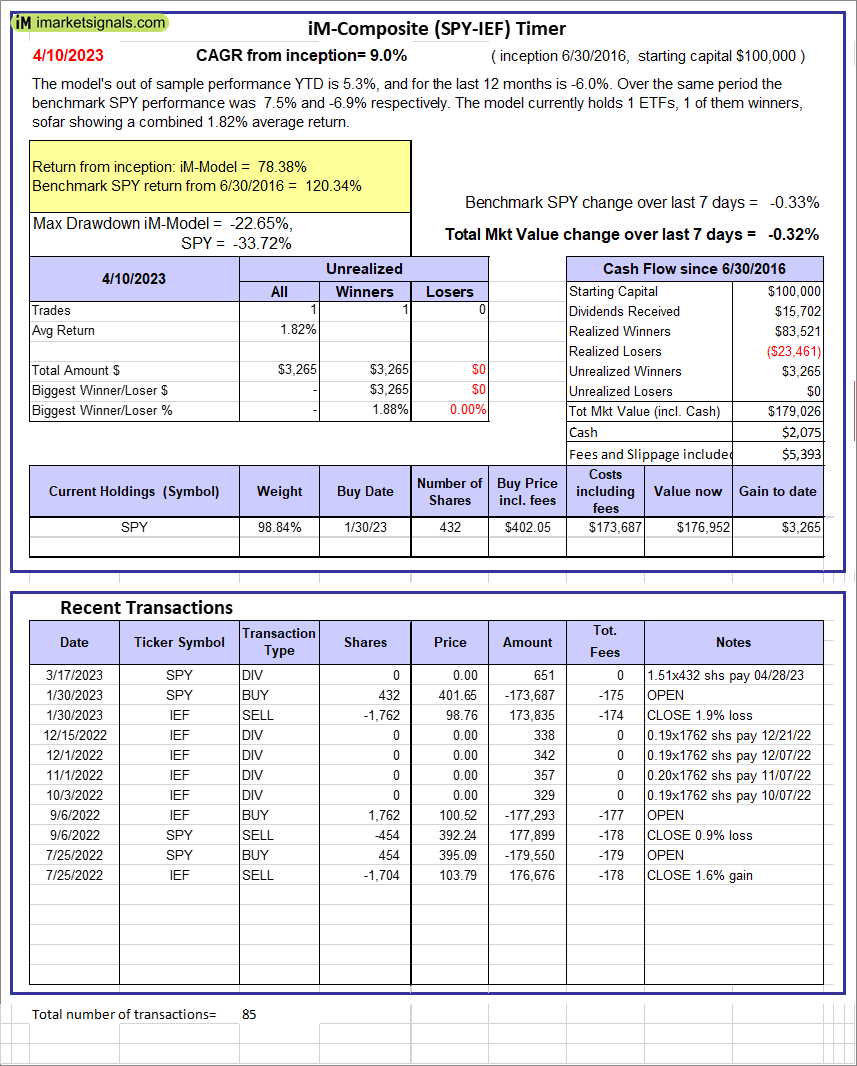 |
iM-Composite (SPY-IEF) Timer: The model’s out of sample performance YTD is 5.3%, and for the last 12 months is -6.0%. Over the same period the benchmark SPY performance was 7.5% and -6.9% respectively. Over the previous week the market value of the iM-Composite (SPY-IEF) Timer gained -0.32% at a time when SPY gained -0.33%. A starting capital of $100,000 at inception on 6/30/2016 would have grown to $179,026 which includes $2,075 cash and excludes $5,393 spent on fees and slippage. |
 |
iM-Composite(Gold-Stocks-Bond) Timer: The model’s out of sample performance YTD is 9.2%, and for the last 12 months is 0.8%. Over the same period the benchmark SPY performance was 7.5% and -6.9% respectively. Over the previous week the market value of the iM-Composite(Gold-Stocks-Bond) Timer gained 0.31% at a time when SPY gained -0.33%. A starting capital of $100,000 at inception on 6/30/2016 would have grown to $188,271 which includes $36 cash and excludes $9,190 spent on fees and slippage. |
iM-Best Reports – 4/10/2023
Posted in pmp SPY-SH
Leave a Reply
You must be logged in to post a comment.