
  |
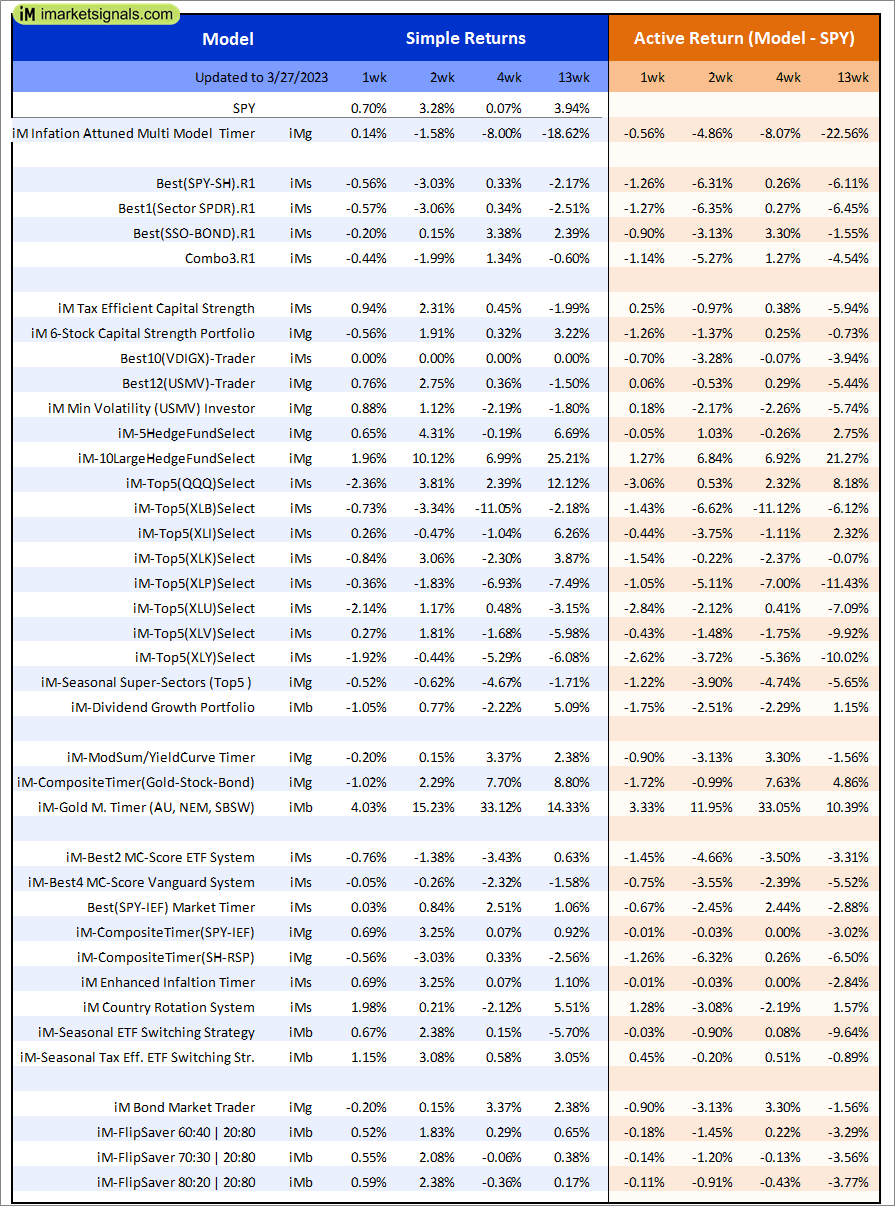
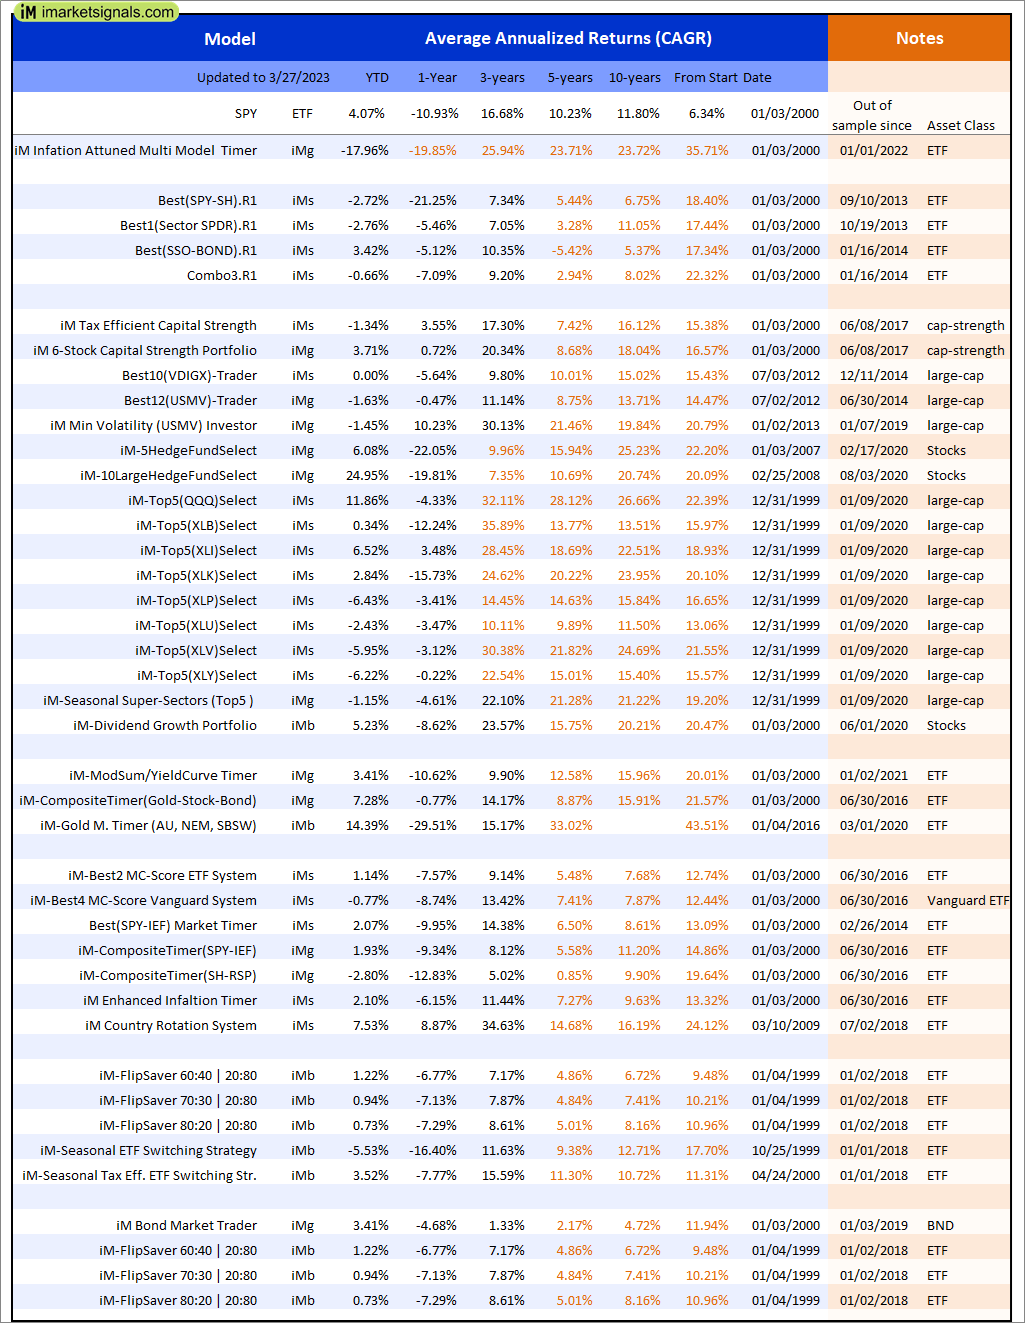
Out of sample performance summary of our models for the past 1, 2, 4 and 13 week periods. The active active return indicates how the models over- or underperformed the benchmark ETF SPY. Also the YTD, and the 1-, 3-, 5- and 10-year annualized returns are shown in the second table |
 |
iM-Inflation Attuned Multi-Model Market Timer: The model’s out of sample performance YTD is -17.9%, and for the last 12 months is -17.5%. Over the same period the benchmark SPY performance was 4.1% and -10.9% respectively. Over the previous week the market value of the iM-Inflation Attuned Multi-Model Market Timer gained 0.14% at a time when SPY gained 0.70%. A starting capital of $100,000 at inception on 3/24/2017 would have grown to $127,000,425 which includes $526,225 cash and excludes $2,179,079 spent on fees and slippage. |
 |
iM-FlipSaver 60:40 | 20:80 – 2017: The model’s out of sample performance YTD is 1.1%, and for the last 12 months is -7.0%. Over the same period the benchmark E60B40 performance was 3.6% and -7.8% respectively. Over the previous week the market value of iM-FlipSaver 80:20 | 20:80 gained 0.52% at a time when SPY gained 0.43%. A starting capital of $100,000 at inception on 7/16/2015 would have grown to $142,615 which includes $1,025 cash and excludes $2,960 spent on fees and slippage. |
 |
iM-FlipSaver 70:30 | 20:80 – 2017: The model’s out of sample performance YTD is 0.9%, and for the last 12 months is -7.1%. Over the same period the benchmark E60B40 performance was 3.6% and -7.8% respectively. Over the previous week the market value of iM-FlipSaver 70:30 | 20:80 gained 0.55% at a time when SPY gained 0.43%. A starting capital of $100,000 at inception on 7/15/2015 would have grown to $146,351 which includes $1,173 cash and excludes $3,126 spent on fees and slippage. |
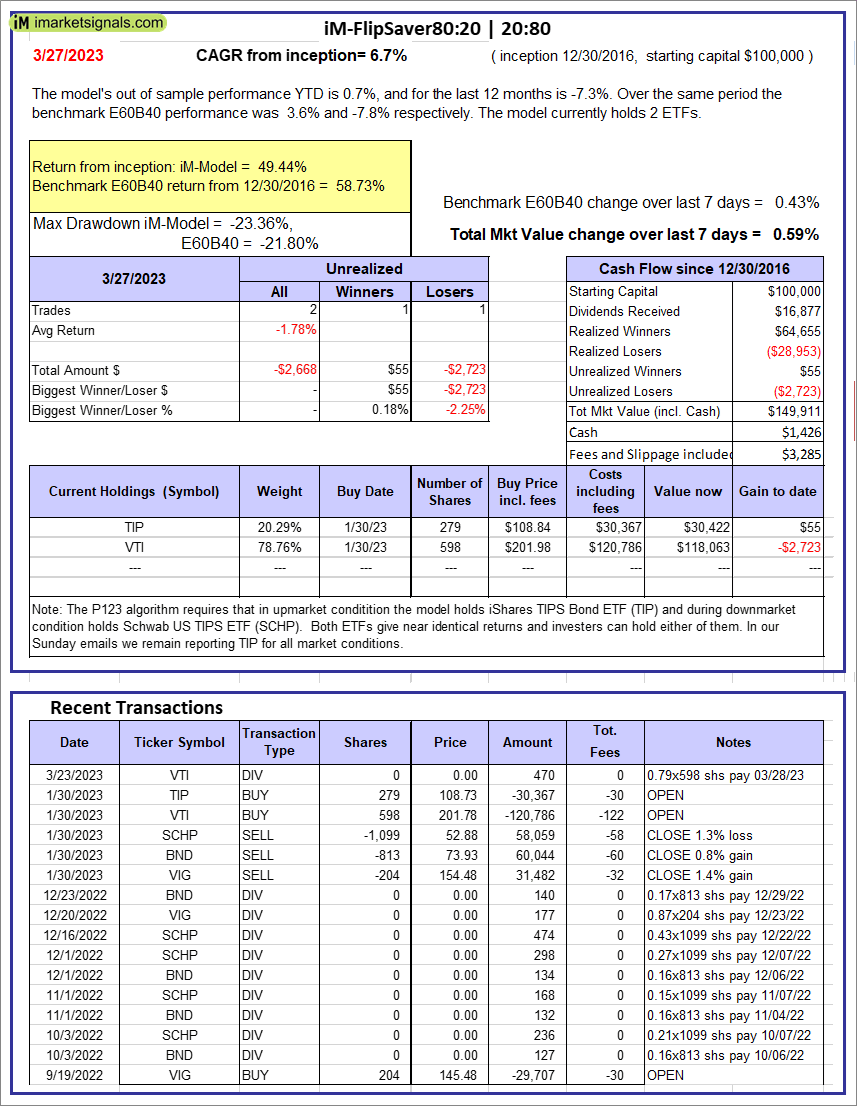 |
iM-FlipSaver 80:20 | 20:80 – 2017: The model’s out of sample performance YTD is 0.7%, and for the last 12 months is -7.3%. Over the same period the benchmark E60B40 performance was 3.6% and -7.8% respectively. Over the previous week the market value of iM-FlipSaver 80:20 | 20:80 gained 0.59% at a time when SPY gained 0.43%. A starting capital of $100,000 at inception on 1/2/2017 would have grown to $149,911 which includes $1,426 cash and excludes $3,285 spent on fees and slippage. |
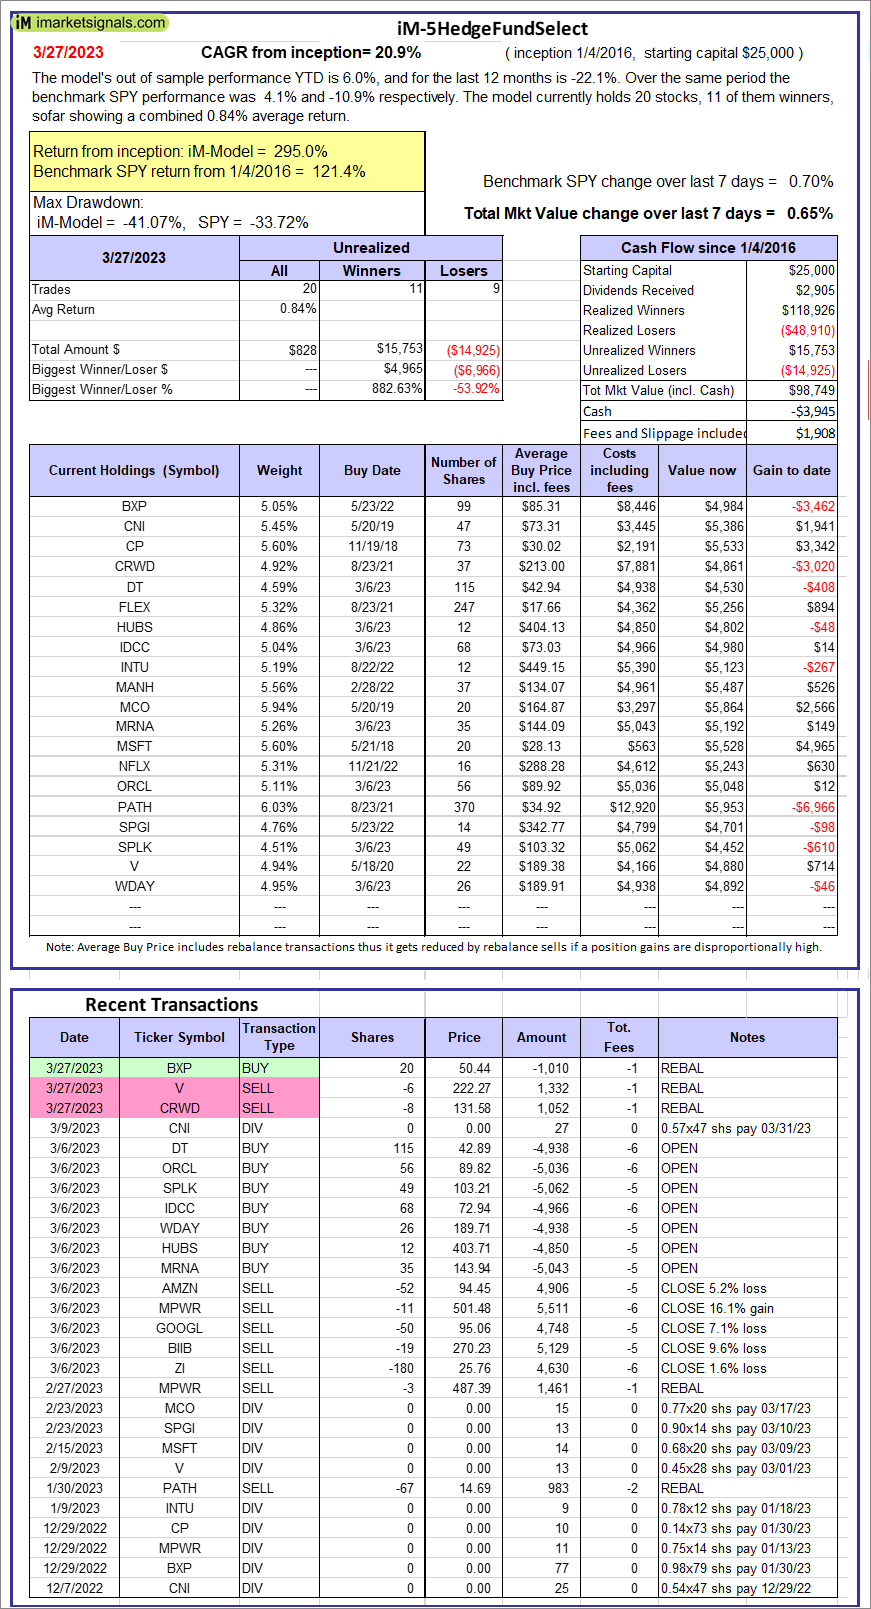 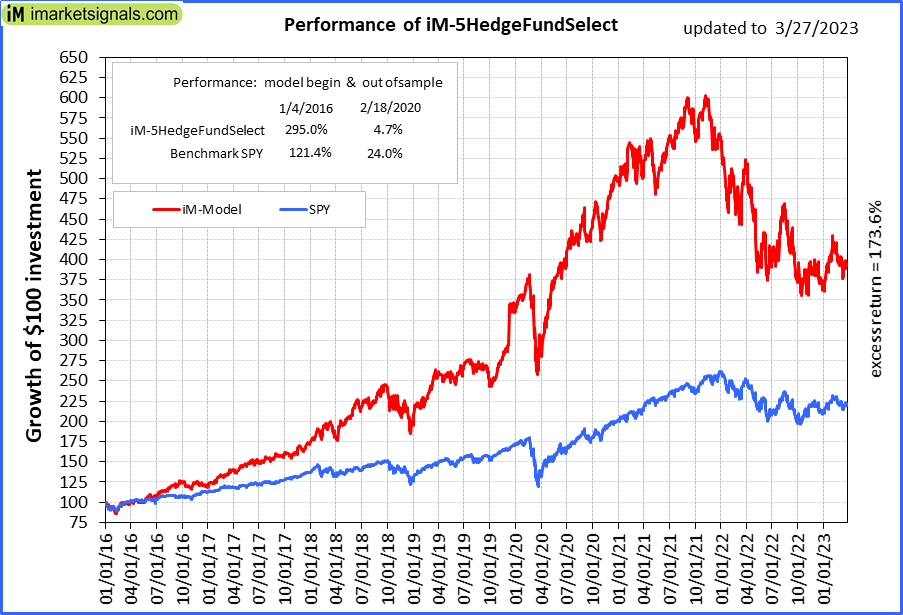 |
iM-5HedgeFundSelect: Since inception, on 1/5/2016, the model gained 294.99% while the benchmark SPY gained 121.42% over the same period. Over the previous week the market value of iM-5HedgeFundSelect gained 0.65% at a time when SPY gained 0.70%. A starting capital of $25,000 at inception on 1/5/2016 would have grown to $98,749 which includes -$3,945 cash and excludes $1,908 spent on fees and slippage. |
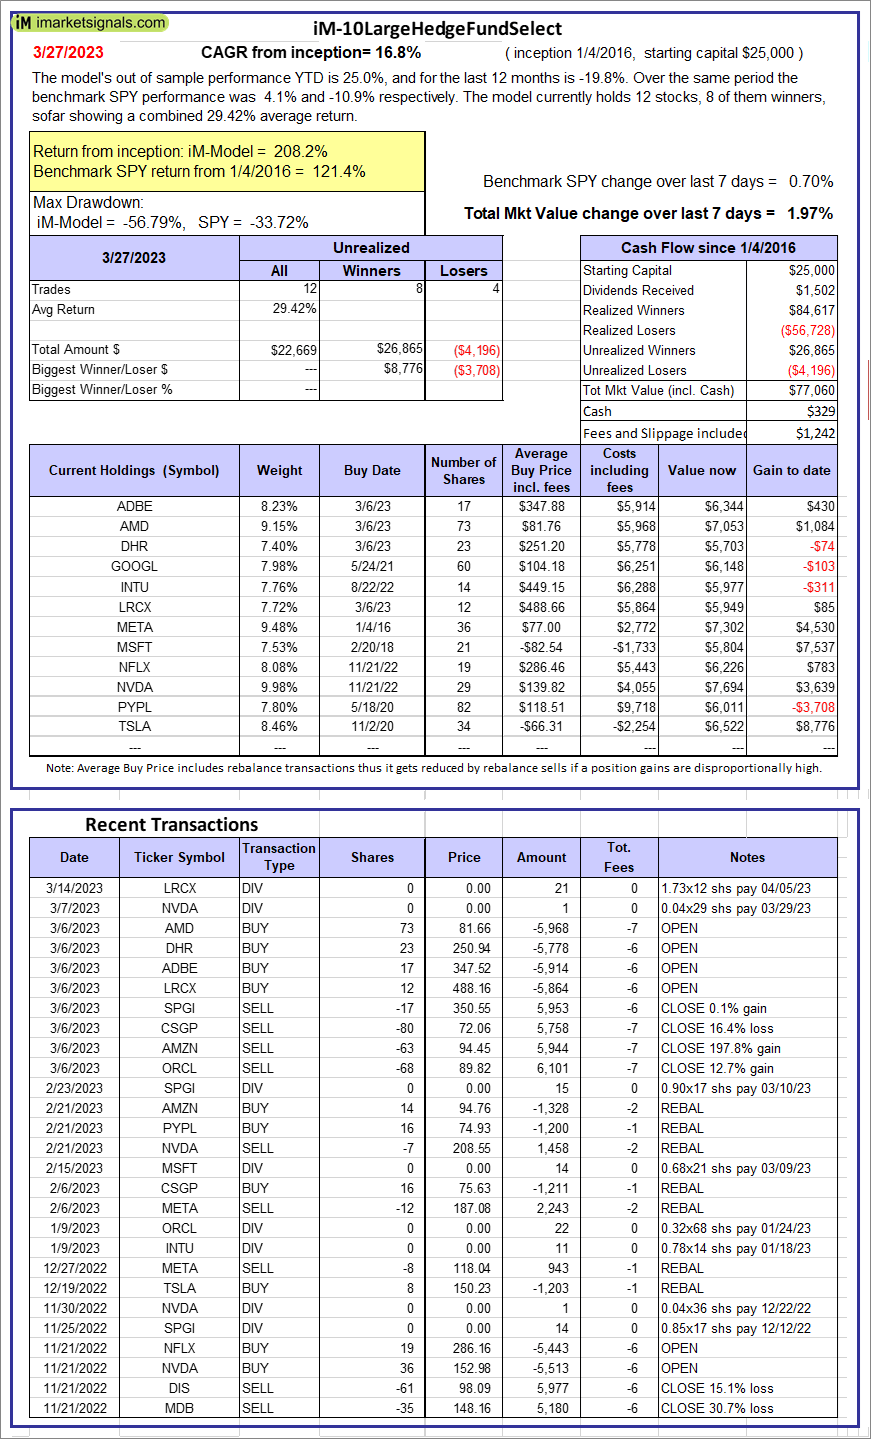  |
iM-10LargeHedgeFundSelect: Since inception, on 1/5/2016, the model gained 208.24% while the benchmark SPY gained 121.42% over the same period. Over the previous week the market value of iM-10LargeHedgeFundSelect gained 1.97% at a time when SPY gained 0.70%. A starting capital of $25,000 at inception on 1/5/2016 would have grown to $77,060 which includes $329 cash and excludes $1,242 spent on fees and slippage. |
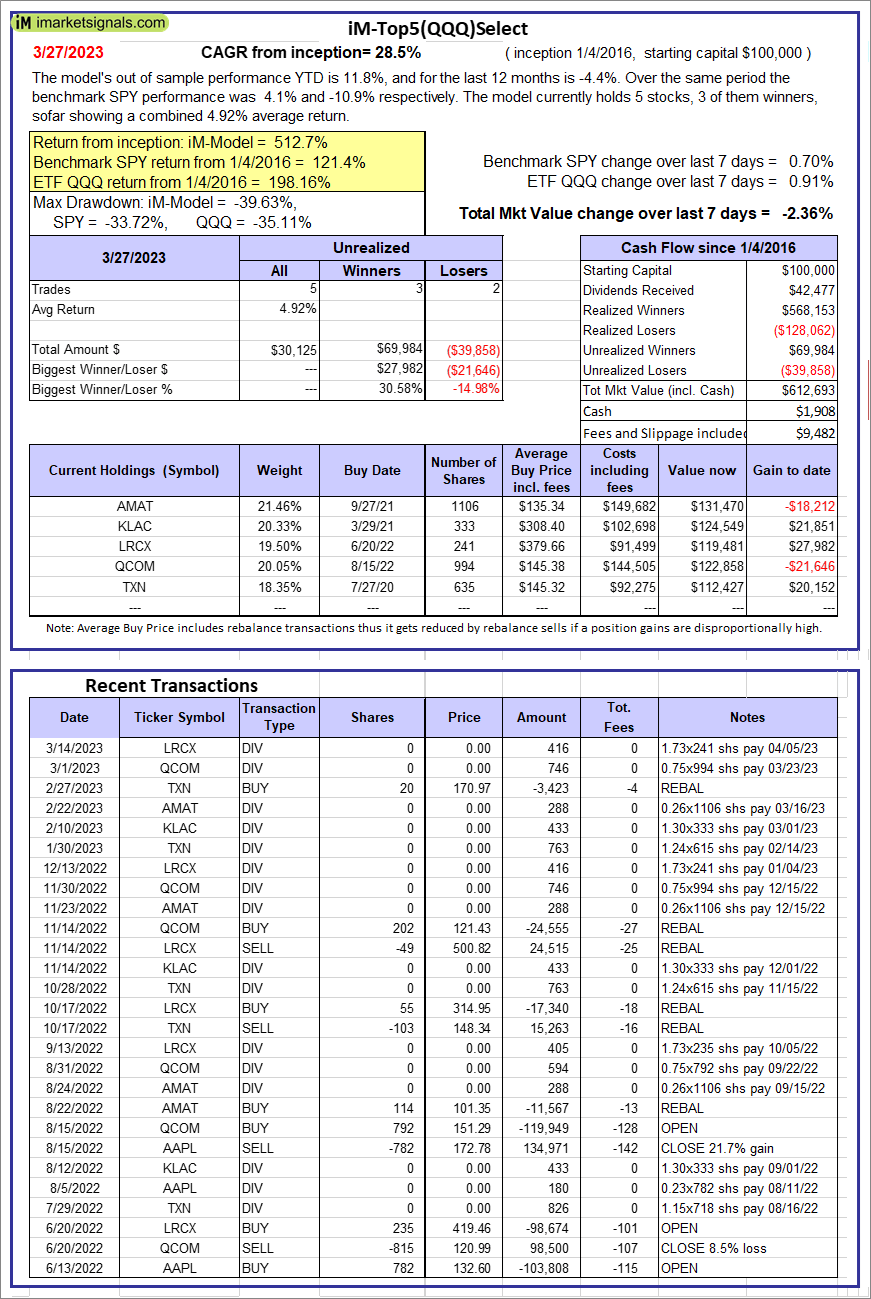 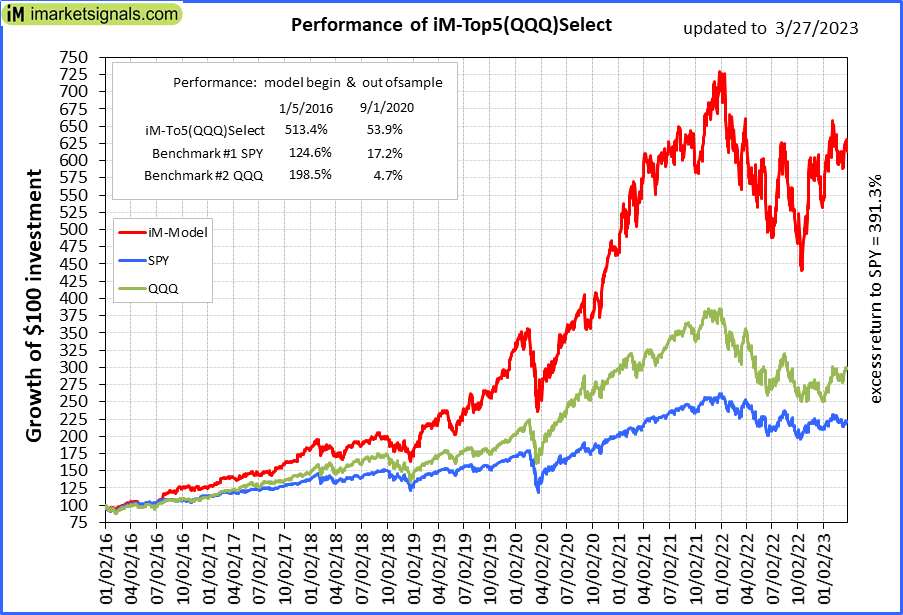 |
iM-Top5(QQQ)Select: Since inception, on 1/5/2016, the model gained 512.69% while the benchmark SPY gained 121.42% over the same period. Over the previous week the market value of iM-Top5(QQQ)Select gained -2.36% at a time when SPY gained 0.70%. A starting capital of $100,000 at inception on 1/5/2016 would have grown to $612,693 which includes $1,908 cash and excludes $9,482 spent on fees and slippage. |
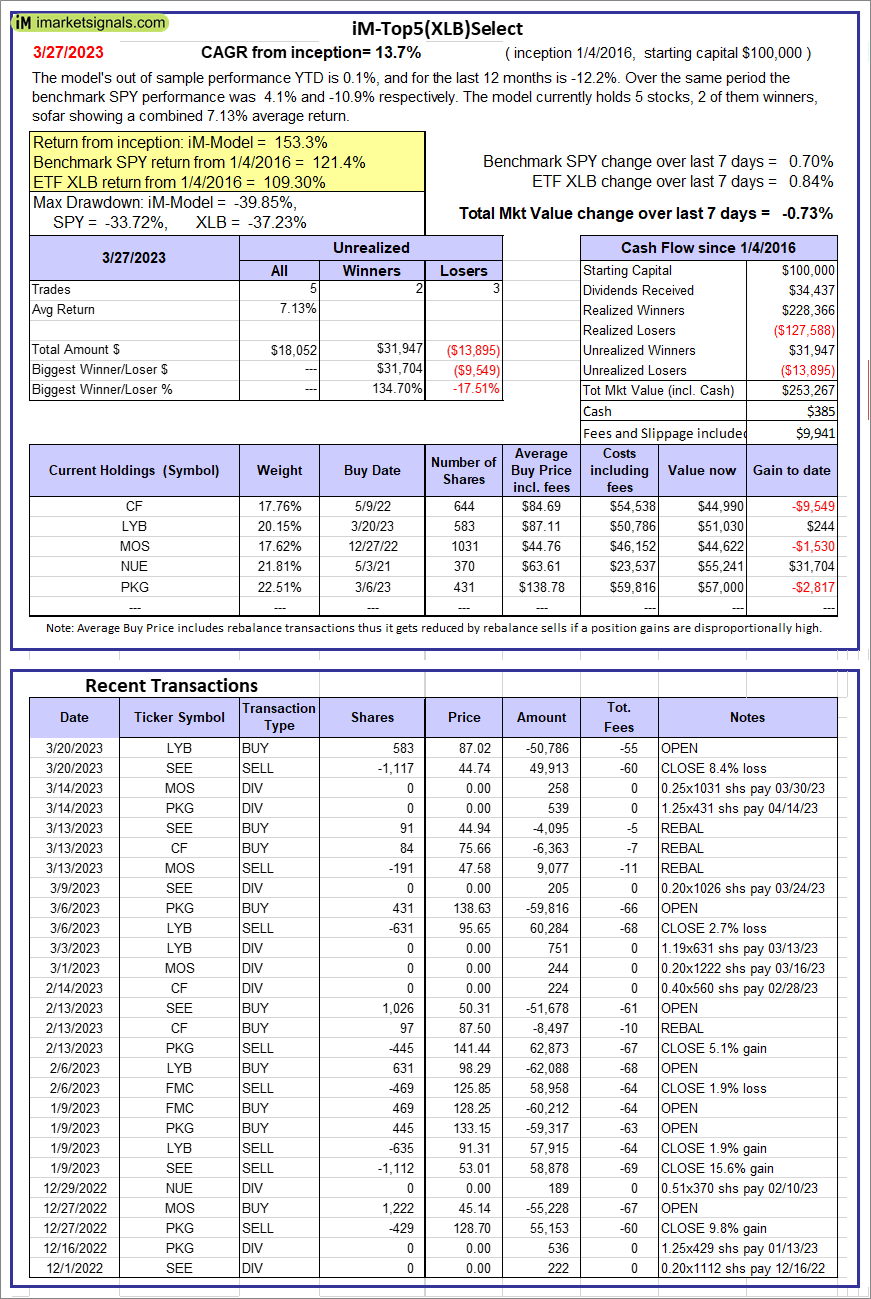 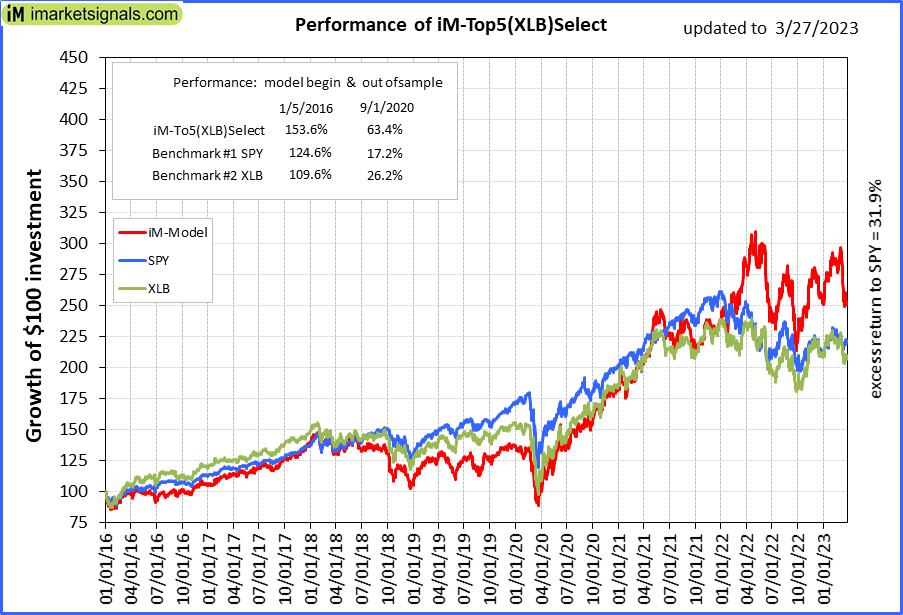 |
iM-Top5(XLB)Select: Since inception, on 1/5/2016, the model gained 153.27% while the benchmark SPY gained 121.42% over the same period. Over the previous week the market value of iM-Top5(XLB)Select gained -0.73% at a time when SPY gained 0.70%. A starting capital of $100,000 at inception on 1/5/2016 would have grown to $253,267 which includes $385 cash and excludes $9,941 spent on fees and slippage. |
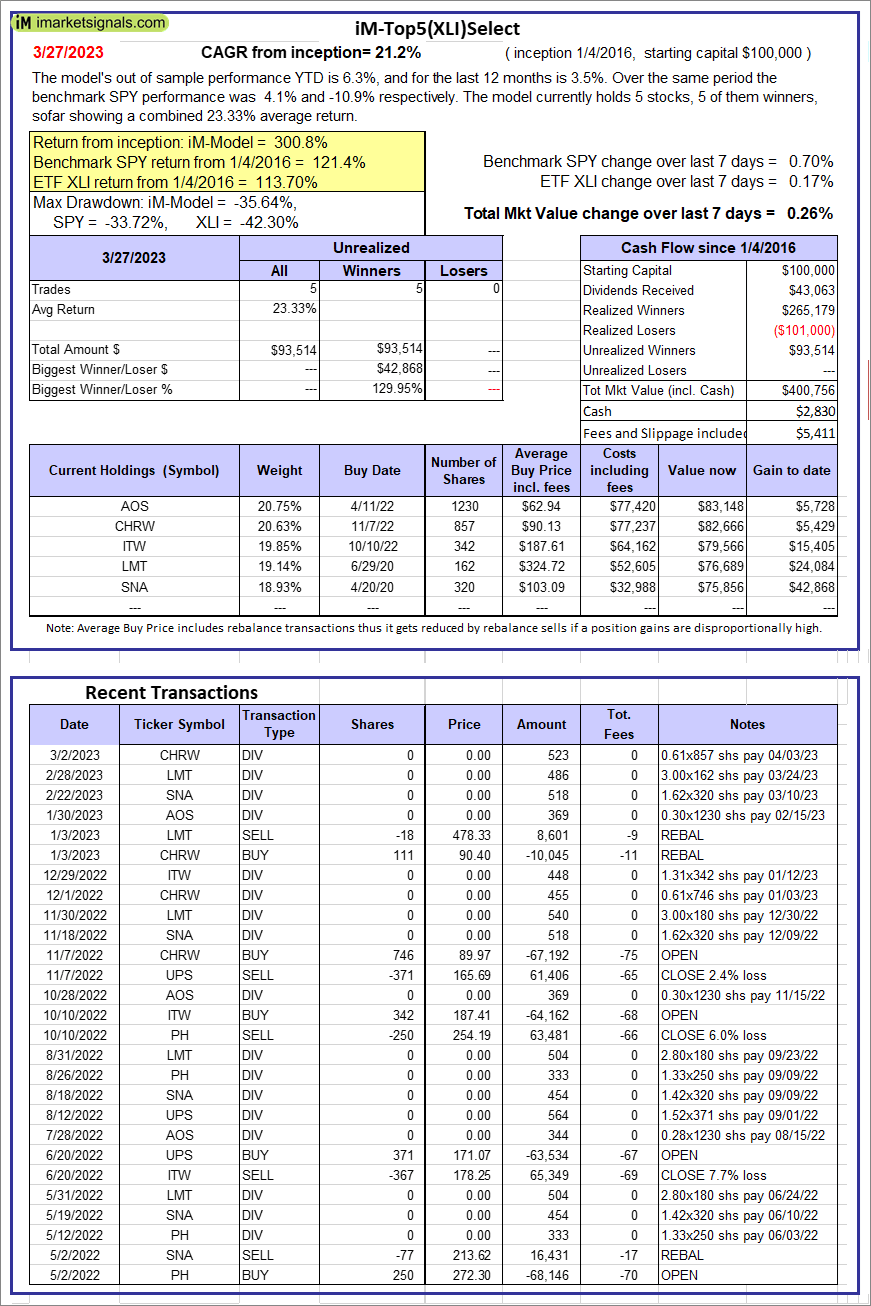 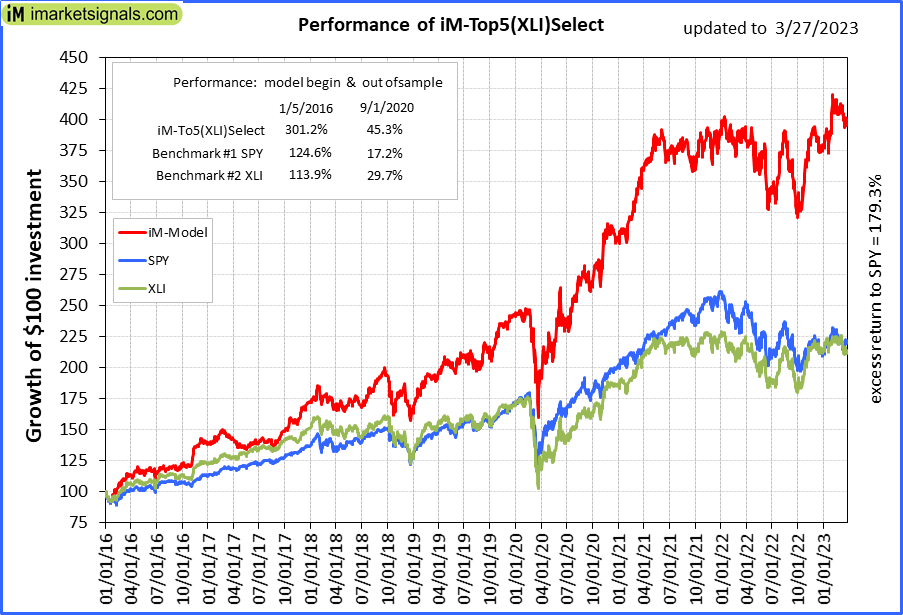 |
iM-Top5(XLI)Select: Since inception, on 1/5/2016, the model gained 300.76% while the benchmark SPY gained 121.42% over the same period. Over the previous week the market value of iM-Top5(XLI)Select gained 0.26% at a time when SPY gained 0.70%. A starting capital of $100,000 at inception on 1/5/2016 would have grown to $400,756 which includes $2,830 cash and excludes $5,411 spent on fees and slippage. |
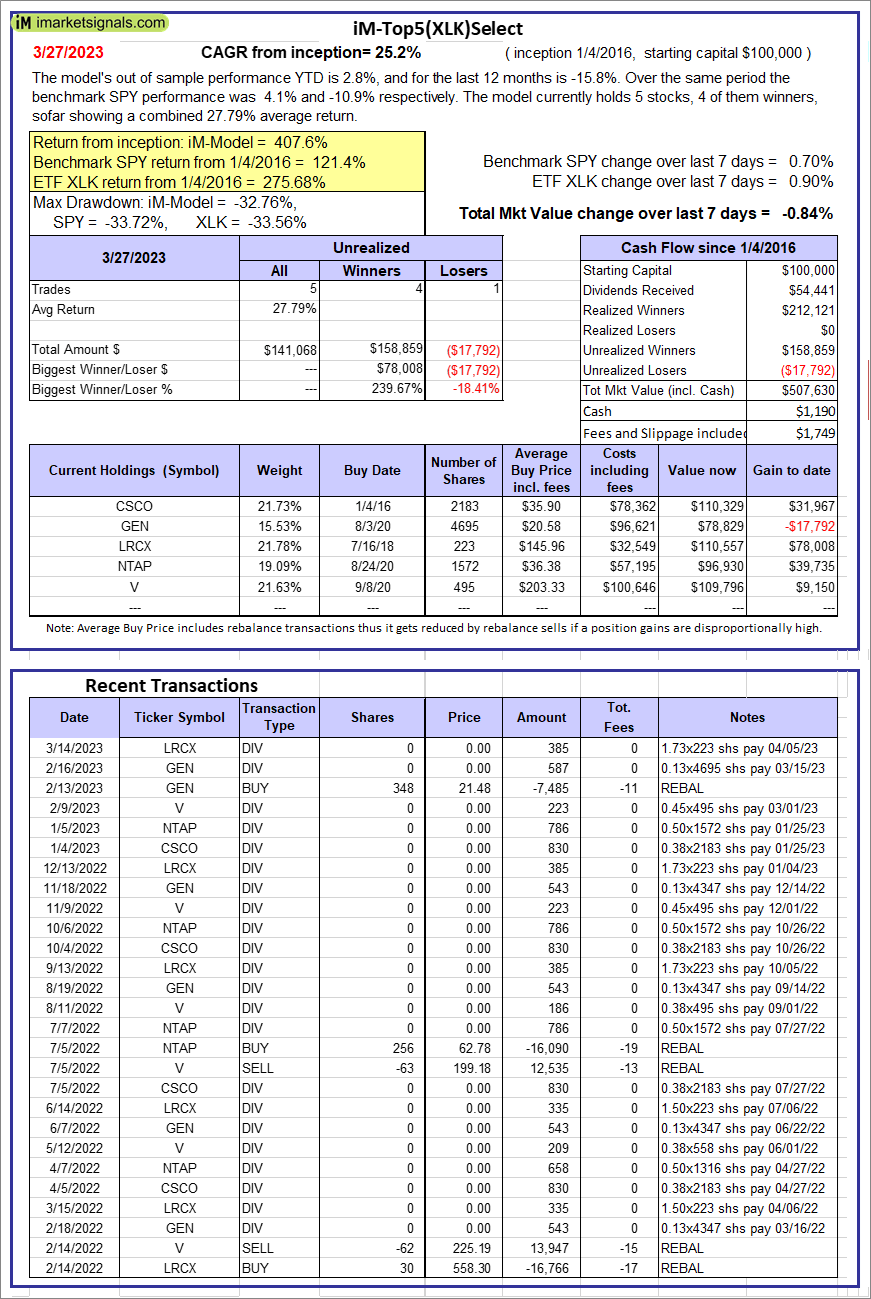 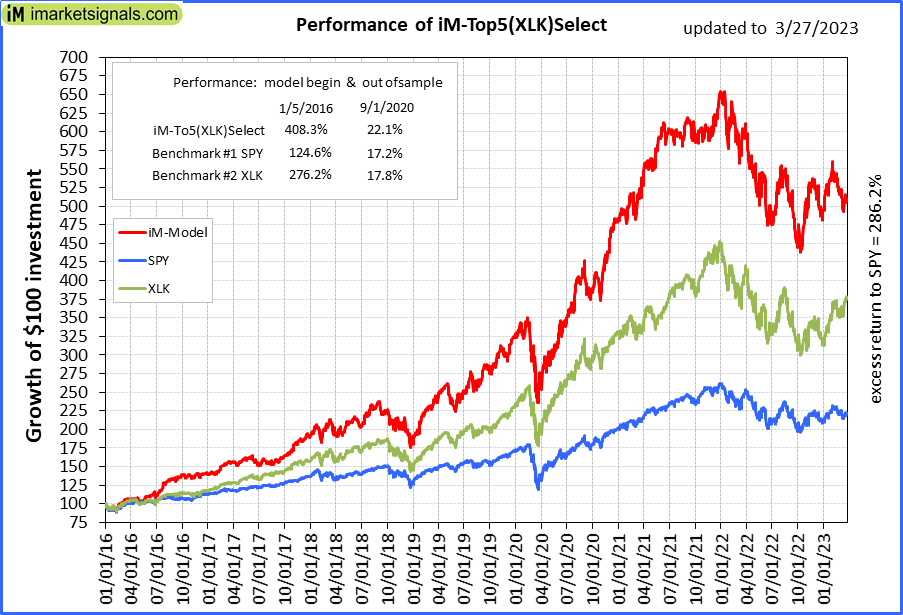 |
iM-Top5(XLK)Select: Since inception, on 1/5/2016, the model gained 407.63% while the benchmark SPY gained 121.42% over the same period. Over the previous week the market value of iM-Top5(XLK)Select gained -0.84% at a time when SPY gained 0.70%. A starting capital of $100,000 at inception on 1/5/2016 would have grown to $507,630 which includes $1,190 cash and excludes $1,749 spent on fees and slippage. |
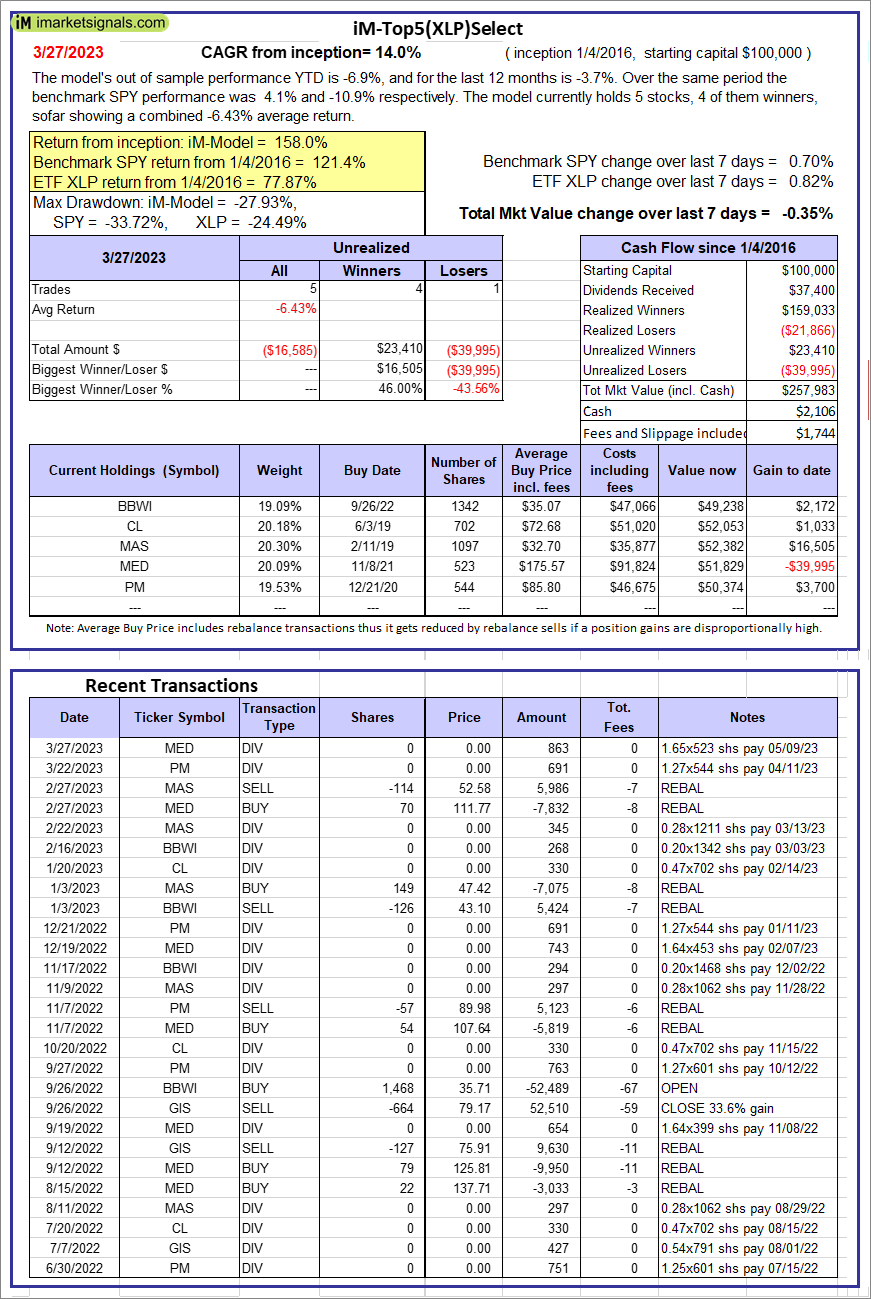 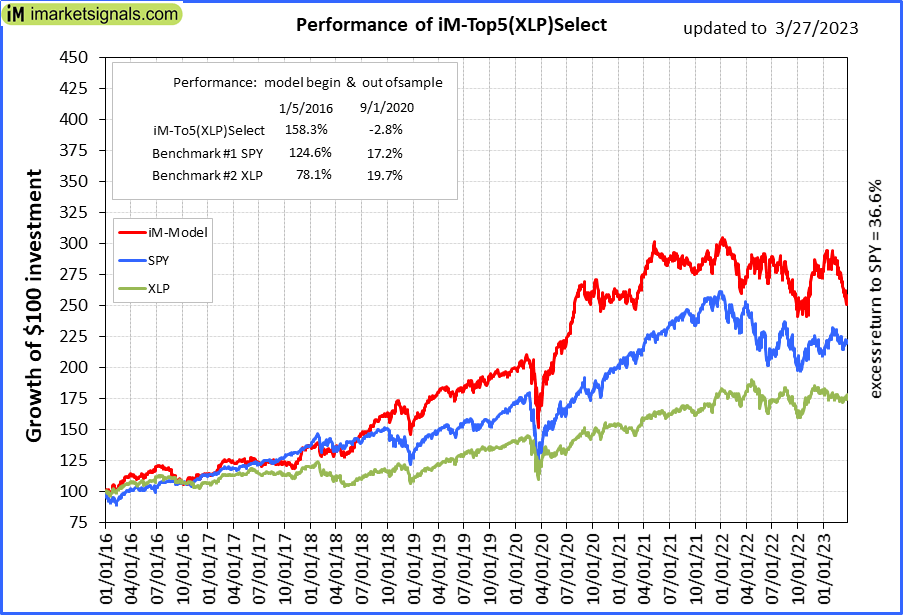 |
iM-Top5(XLP)Select: Since inception, on 1/5/2016, the model gained 157.98% while the benchmark SPY gained 121.42% over the same period. Over the previous week the market value of iM-Top5(XLP)Select gained -0.35% at a time when SPY gained 0.70%. A starting capital of $100,000 at inception on 1/5/2016 would have grown to $257,983 which includes $2,106 cash and excludes $1,744 spent on fees and slippage. |
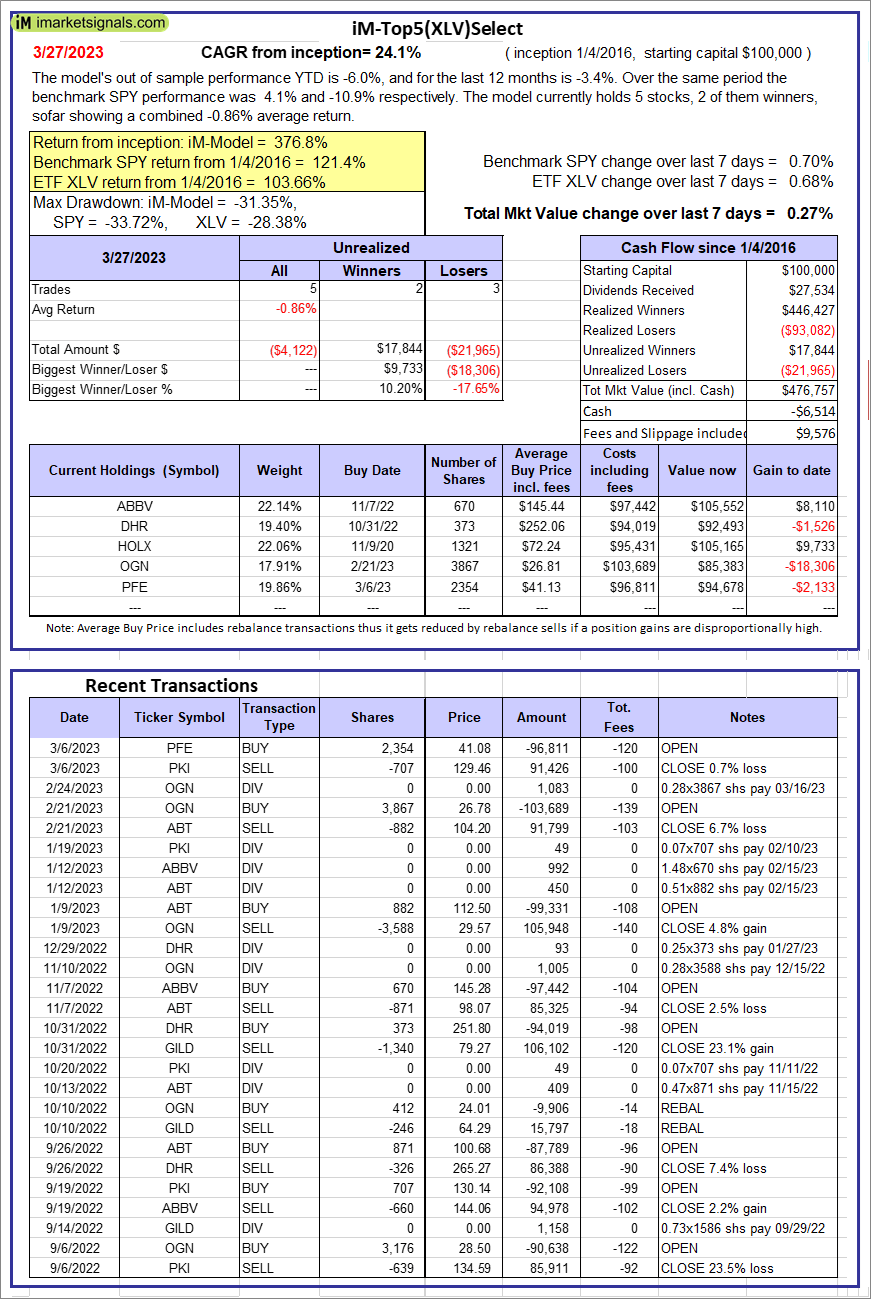 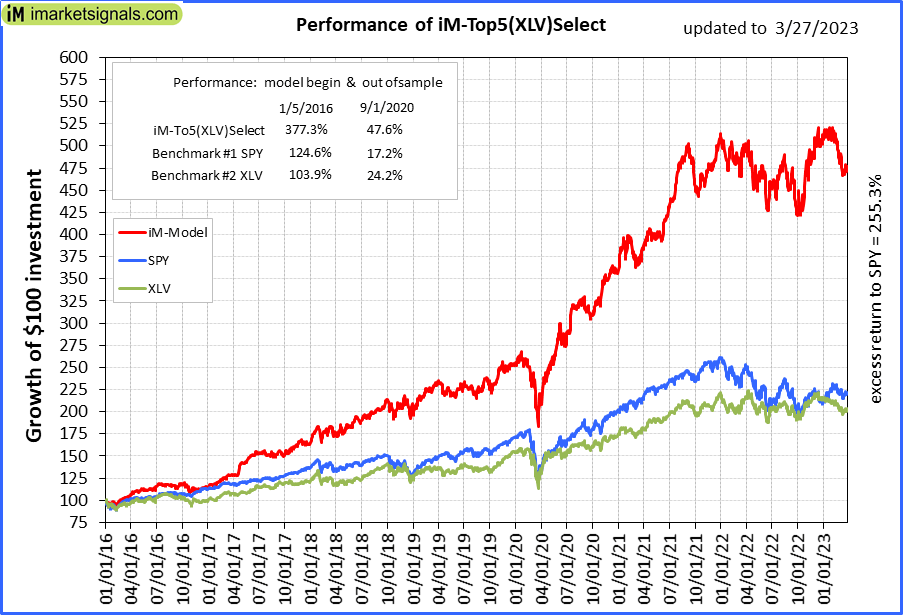 |
iM-Top5(XLV)Select: Since inception, on 1/5/2016, the model gained 376.76% while the benchmark SPY gained 121.42% over the same period. Over the previous week the market value of iM-Top5(XLV)Select gained 0.27% at a time when SPY gained 0.70%. A starting capital of $100,000 at inception on 1/5/2016 would have grown to $476,757 which includes -$6,514 cash and excludes $9,576 spent on fees and slippage. |
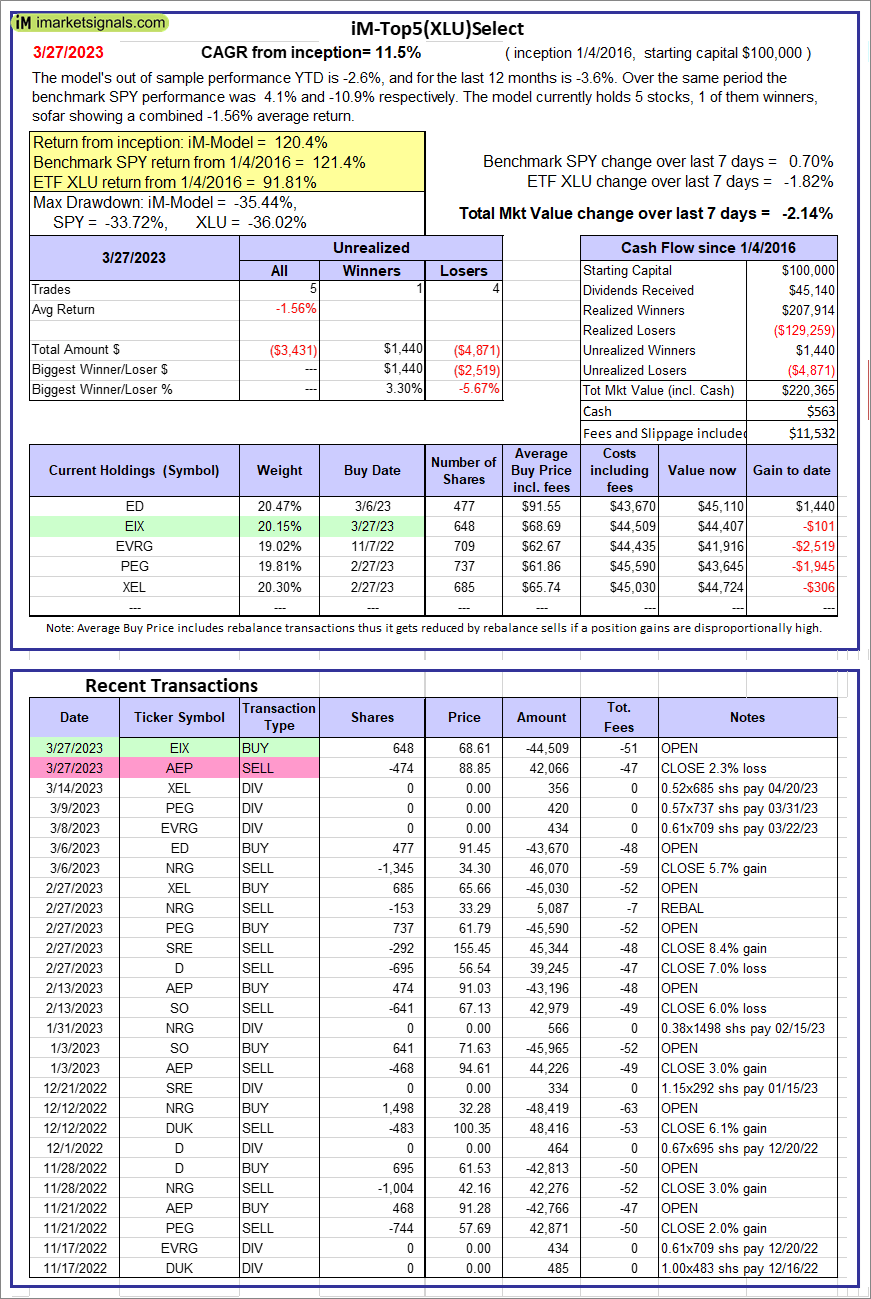 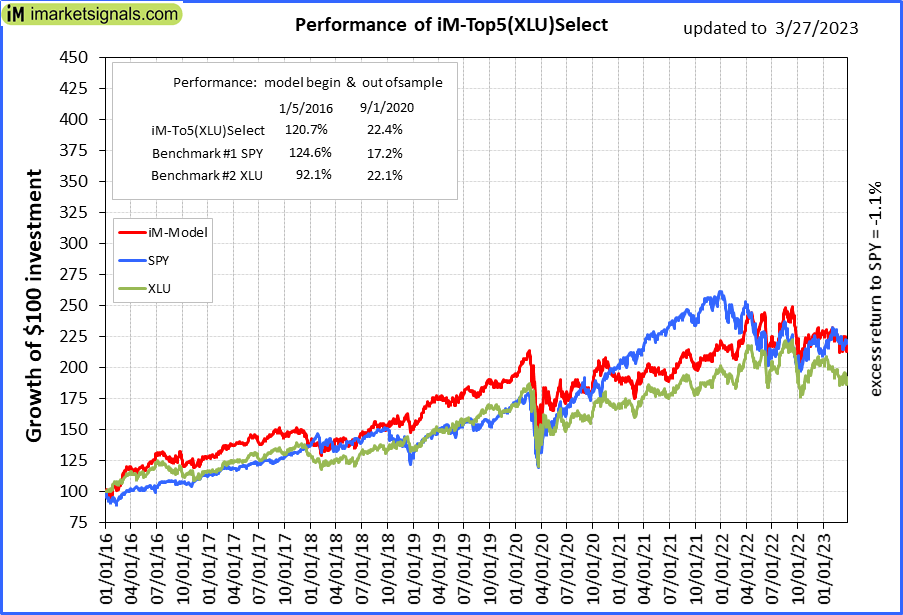 |
iM-Top5(XLU)Select: Since inception, on 1/5/2016, the model gained 120.36% while the benchmark SPY gained 121.42% over the same period. Over the previous week the market value of iM-Top5(XLU)Select gained -2.14% at a time when SPY gained 0.70%. A starting capital of $100,000 at inception on 1/5/2016 would have grown to $220,365 which includes $563 cash and excludes $11,532 spent on fees and slippage. |
 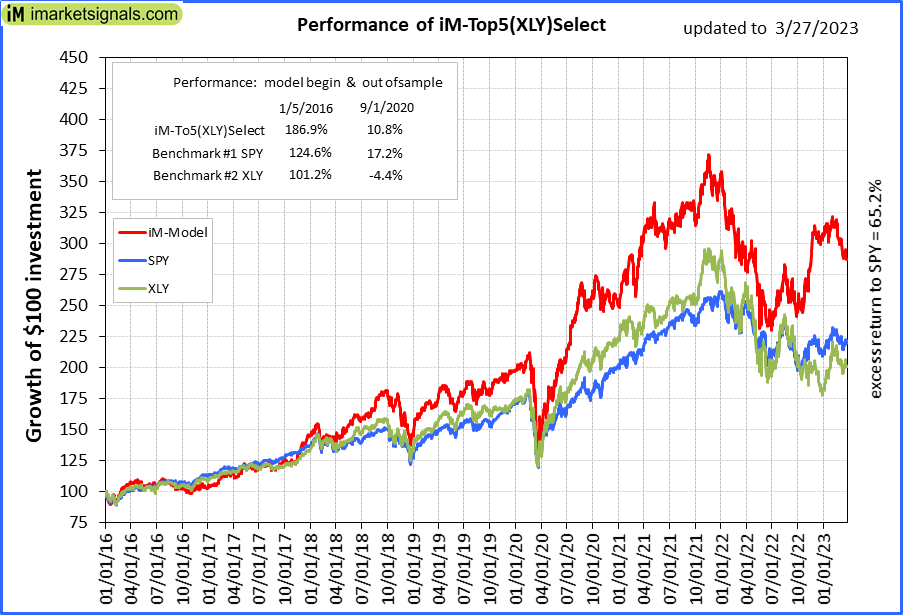 |
iM-Top5(XLY)Select: Since inception, on 1/5/2016, the model gained 186.60% while the benchmark SPY gained 121.42% over the same period. Over the previous week the market value of iM-Top5(XLY)Select gained -1.92% at a time when SPY gained 0.70%. A starting capital of $100,000 at inception on 1/5/2016 would have grown to $286,603 which includes $1,256 cash and excludes $5,392 spent on fees and slippage. |
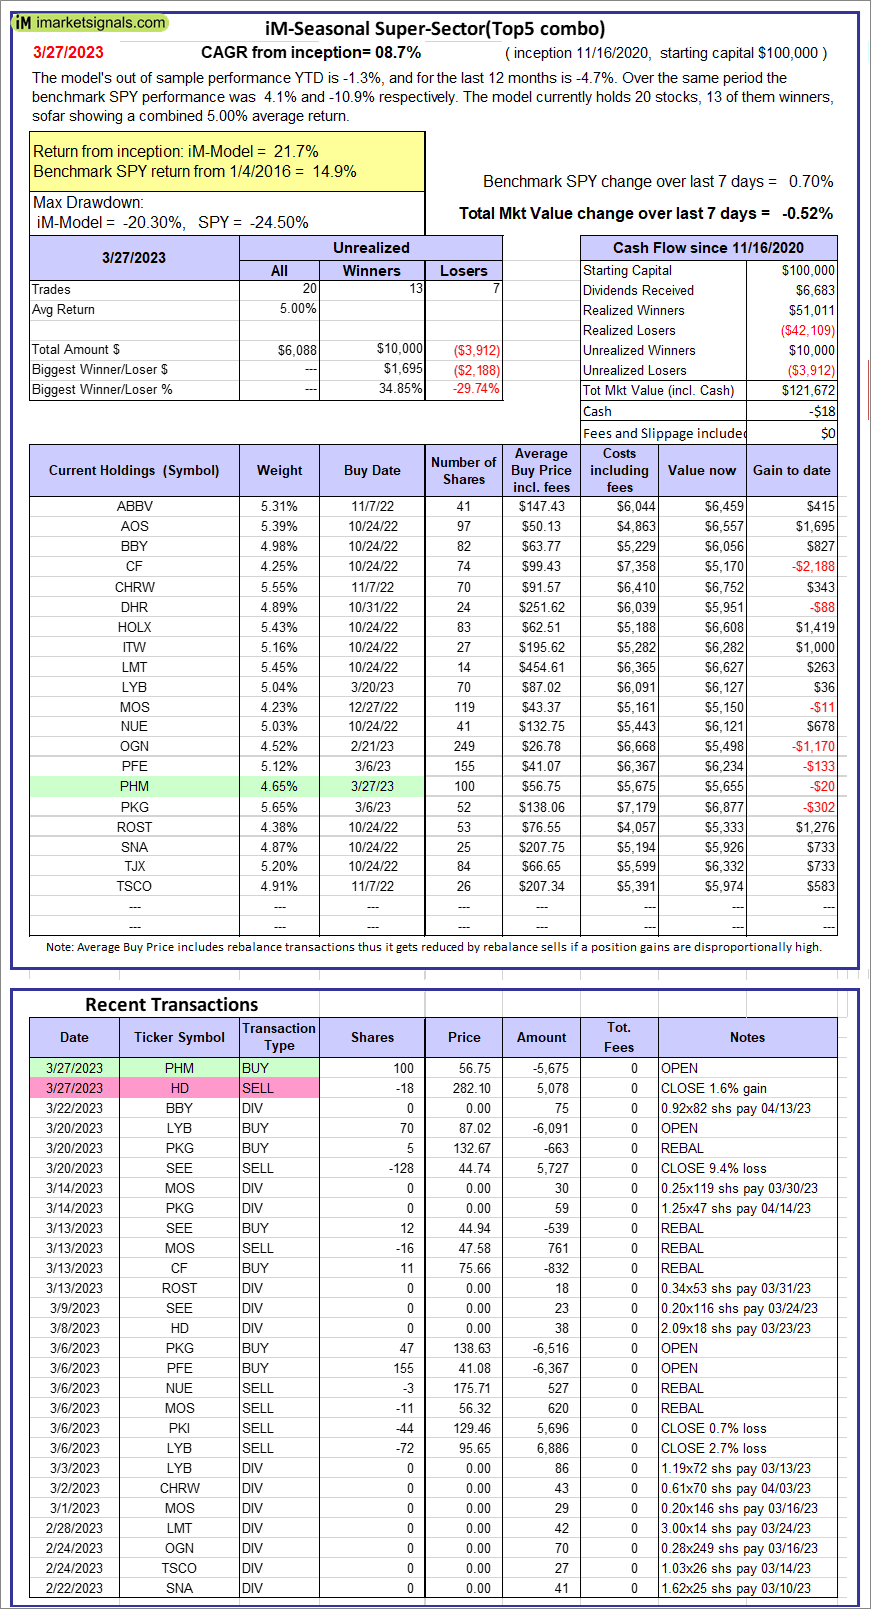 |
iM-Seasonal Super-Sectors (Top5 combo) : Since inception, on 11/17/2020, the model gained 21.67% while the benchmark SPY gained 14.94% over the same period. Over the previous week the market value of iM-Seasonal Super-Sectors (Top5 combo) gained -0.52% at a time when SPY gained 0.70%. A starting capital of $100,000 at inception on 11/17/2020 would have grown to $121,672 which includes -$18 cash and excludes $00 spent on fees and slippage. |
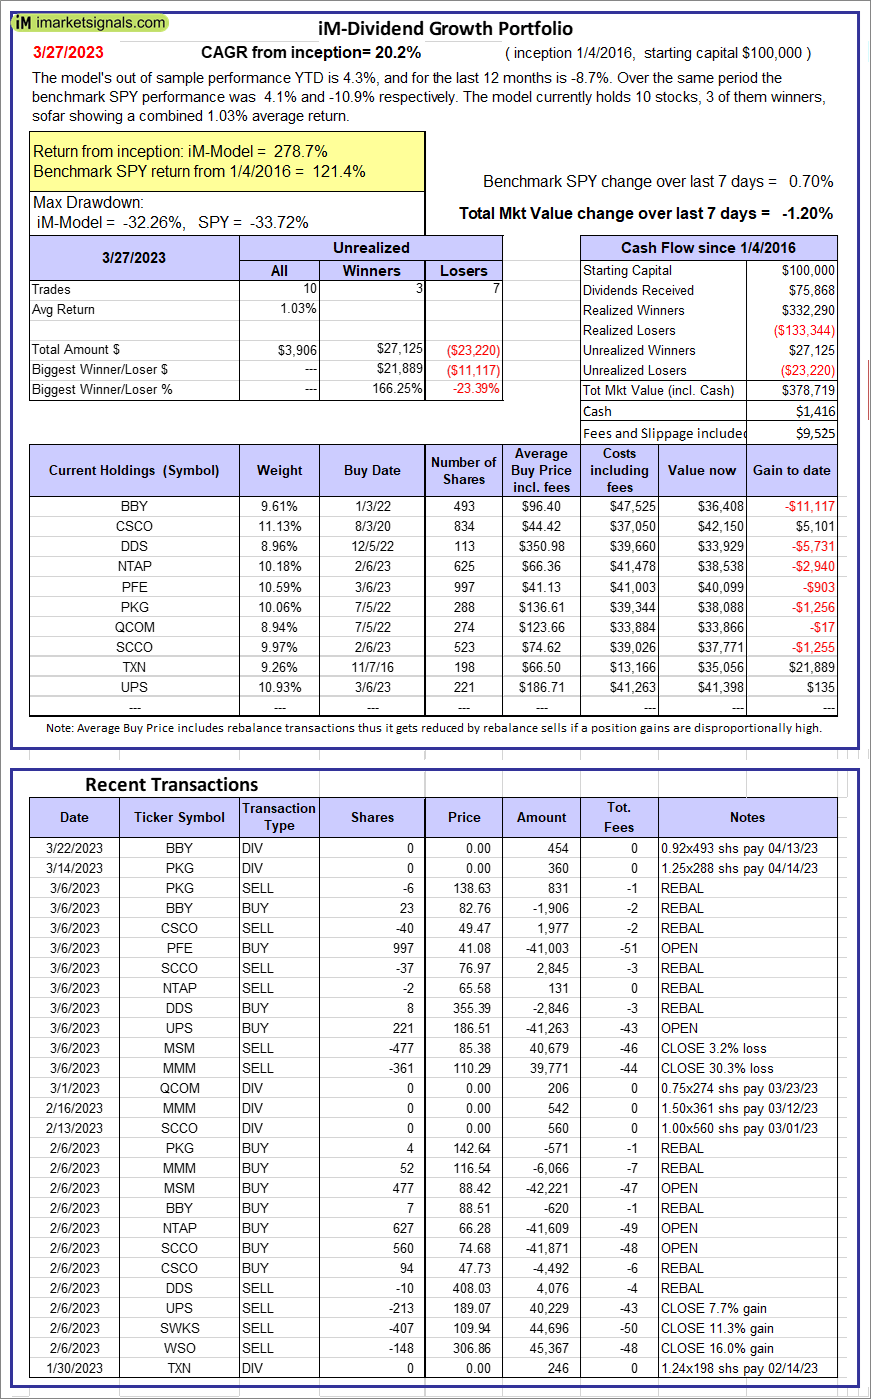 |
iM-Dividend Growth Portfolio: The model’s out of sample performance YTD is 4.3%, and for the last 12 months is -8.7%. Over the same period the benchmark SPY performance was 4.1% and -10.9% respectively. Over the previous week the market value of the iM-Dividend Growth Portfolio gained -1.20% at a time when SPY gained 0.70%. A starting capital of $100,000 at inception on 6/30/2016 would have grown to $378,719 which includes $1,416 cash and excludes $9,525 spent on fees and slippage. |
 |
iM-Gold Momentum Timer (AU, NEM, SBSW): The model’s out of sample performance YTD is 14.4%, and for the last 12 months is -29.5%. Over the same period the benchmark SPY performance was 4.1% and -10.9% respectively. Over the previous week the market value of iM-Gold Momentum Timer (AU, NEM, SBSW) gained 4.03% at a time when SPY gained 0.70%. A starting capital of $100,000 at inception on 6/30/2016 would have grown to $10,812 which includes $120,799 cash and excludes Gain to date spent on fees and slippage. |
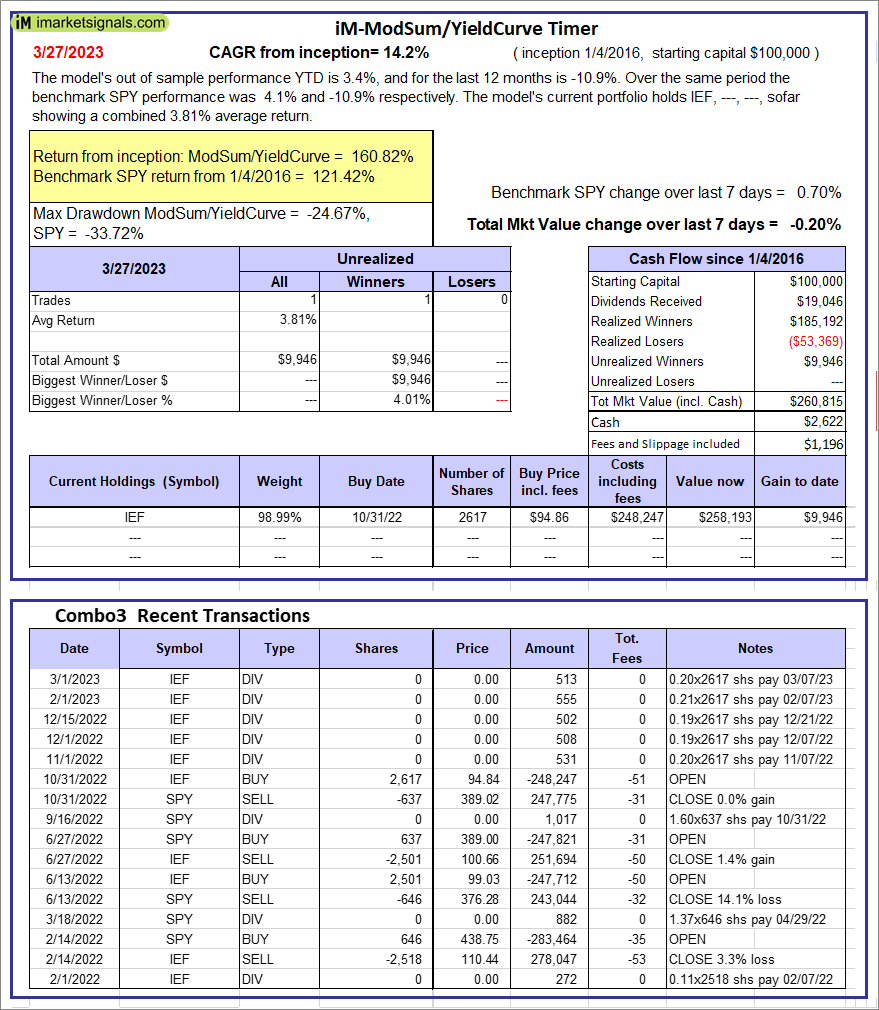 |
iM-ModSum/YieldCurve Timer: The model’s out of sample performance YTD is 3.4%, and for the last 12 months is -10.9%. Over the same period the benchmark SPY performance was 4.1% and -10.9% respectively. Over the previous week the market value of iM-PortSum/YieldCurve Timer gained -0.20% at a time when SPY gained 0.70%. A starting capital of $100,000 at inception on 1/1/2016 would have grown to $260,815 which includes $2,622 cash and excludes $1,196 spent on fees and slippage. |
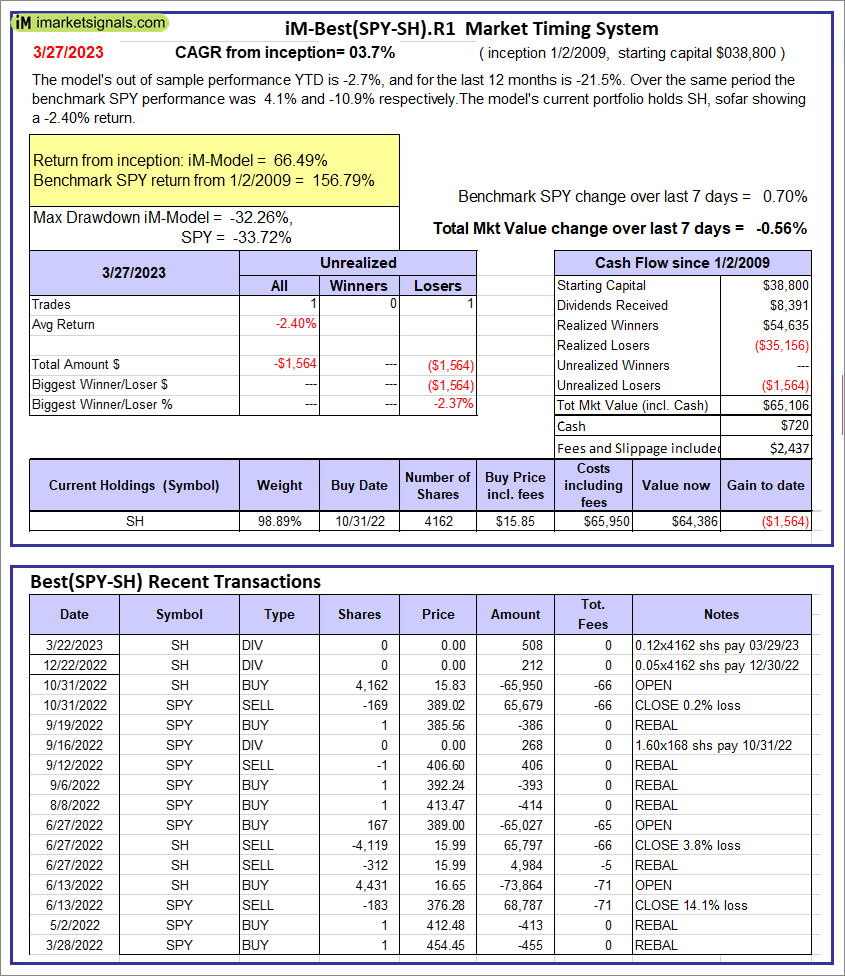 |
iM-Best(SPY-SH).R1: The model’s out of sample performance YTD is -2.7%, and for the last 12 months is -21.5%. Over the same period the benchmark SPY performance was 4.1% and -10.9% respectively. Over the previous week the market value of Best(SPY-SH) gained -0.56% at a time when SPY gained 0.70%. A starting capital of $100,000 at inception on 1/2/2009 would have grown to $65,106 which includes $720 cash and excludes $2,437 spent on fees and slippage. |
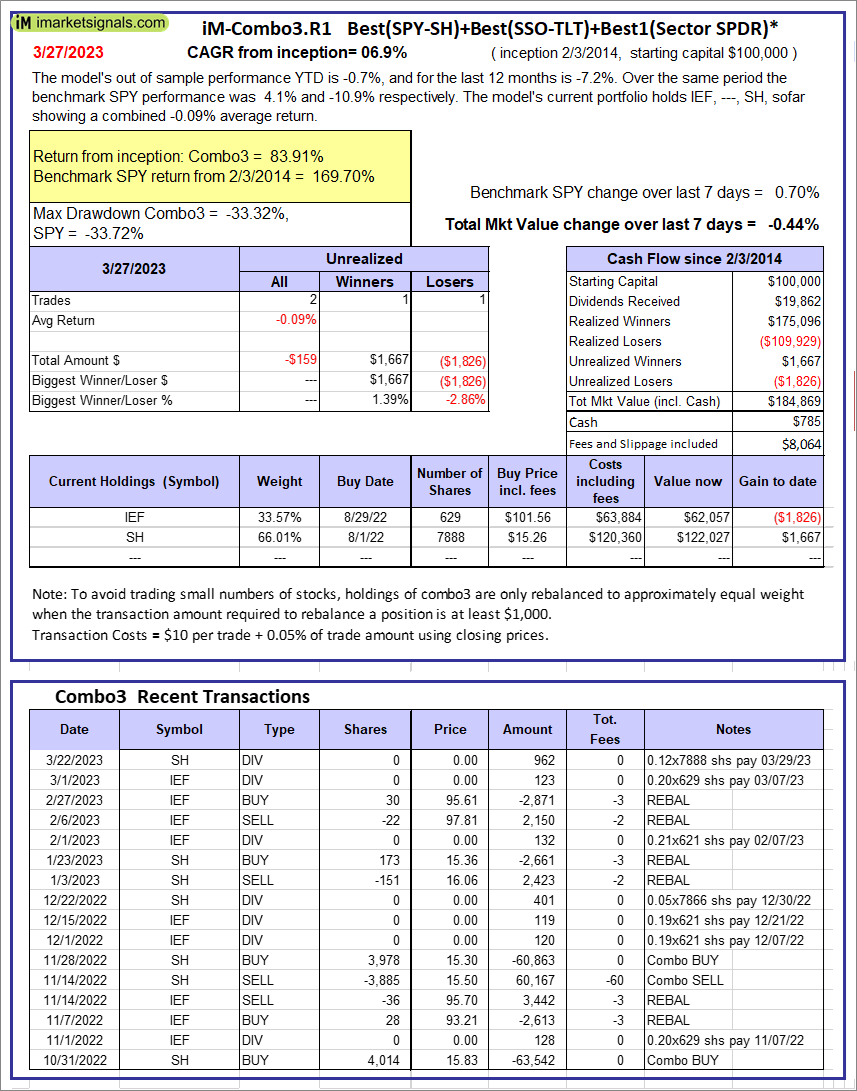 |
iM-Combo3.R1: The model’s out of sample performance YTD is -0.7%, and for the last 12 months is -7.2%. Over the same period the benchmark SPY performance was 4.1% and -10.9% respectively. Over the previous week the market value of iM-Combo3.R1 gained -0.44% at a time when SPY gained 0.70%. A starting capital of $100,000 at inception on 2/3/2014 would have grown to $184,869 which includes $785 cash and excludes $8,064 spent on fees and slippage. |
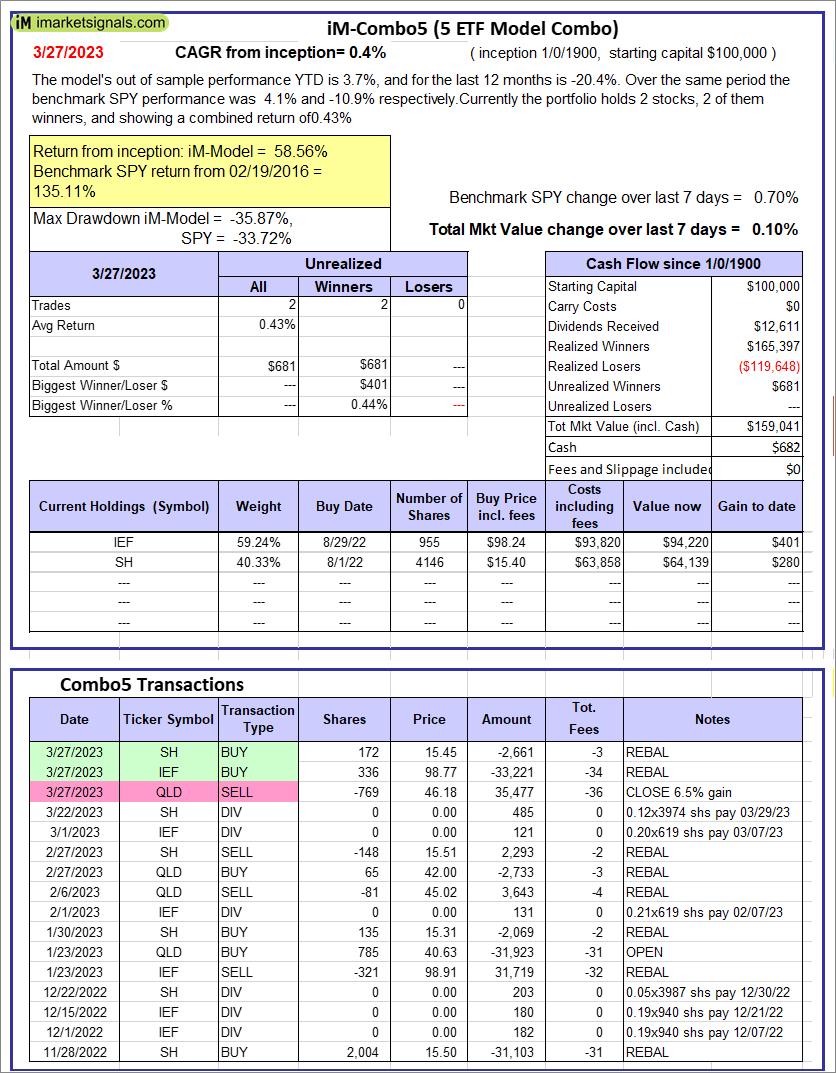 |
iM-Combo5: The model’s out of sample performance YTD is 3.7%, and for the last 12 months is -20.4%. Over the same period the benchmark SPY performance was 4.1% and -10.9% respectively. Over the previous week the market value of iM-Combo5 gained 0.10% at a time when SPY gained 0.70%. A starting capital of $100,000 at inception on 2/22/2016 would have grown to $159,041 which includes $682 cash and excludes $0 spent on fees and slippage. |
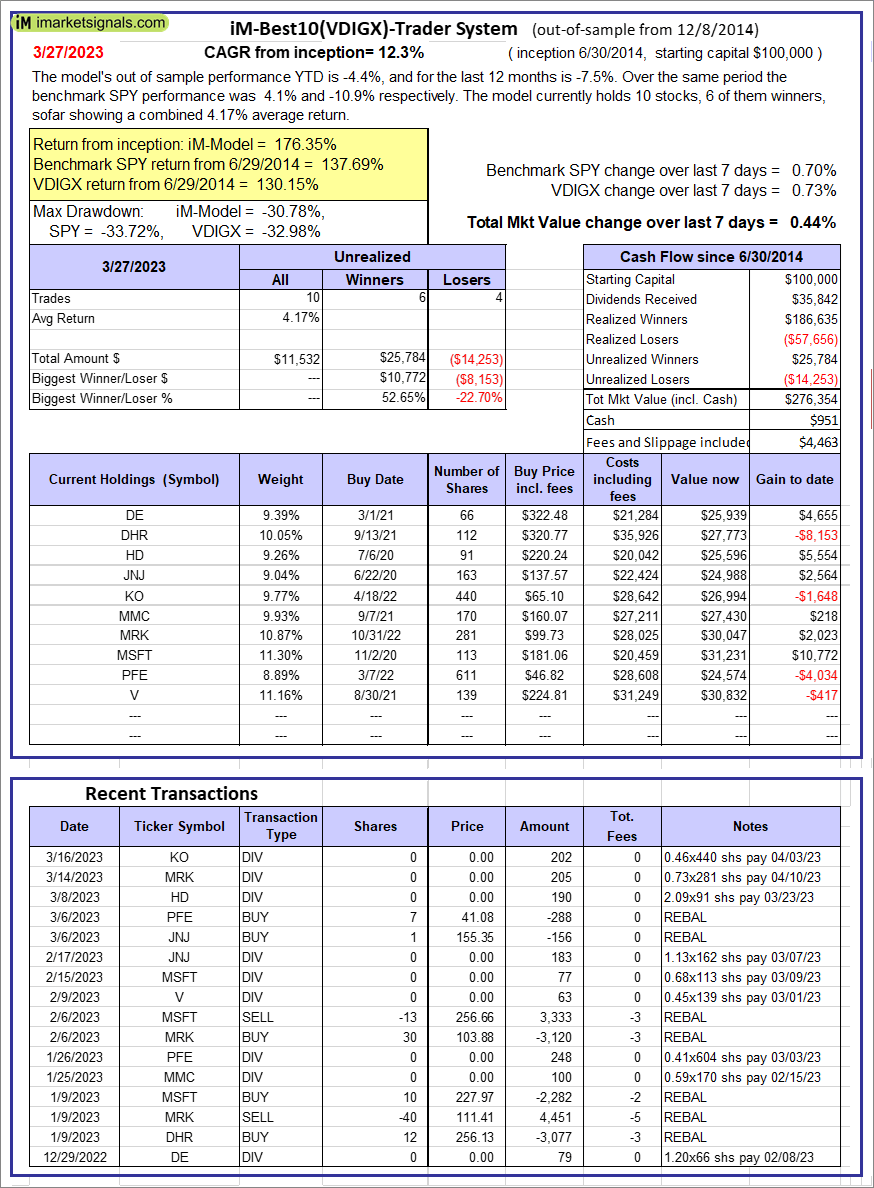  |
iM-Best10(VDIGX)-Trader: The model’s out of sample performance YTD is -4.4%, and for the last 12 months is -7.5%. Over the same period the benchmark SPY performance was 4.1% and -10.9% respectively. Since inception, on 7/1/2014, the model gained 176.35% while the benchmark SPY gained 137.69% and VDIGX gained 130.15% over the same period. Over the previous week the market value of iM-Best10(VDIGX) gained 0.44% at a time when SPY gained 0.70%. A starting capital of $100,000 at inception on 7/1/2014 would have grown to $276,354 which includes $951 cash and excludes $4,463 spent on fees and slippage. |
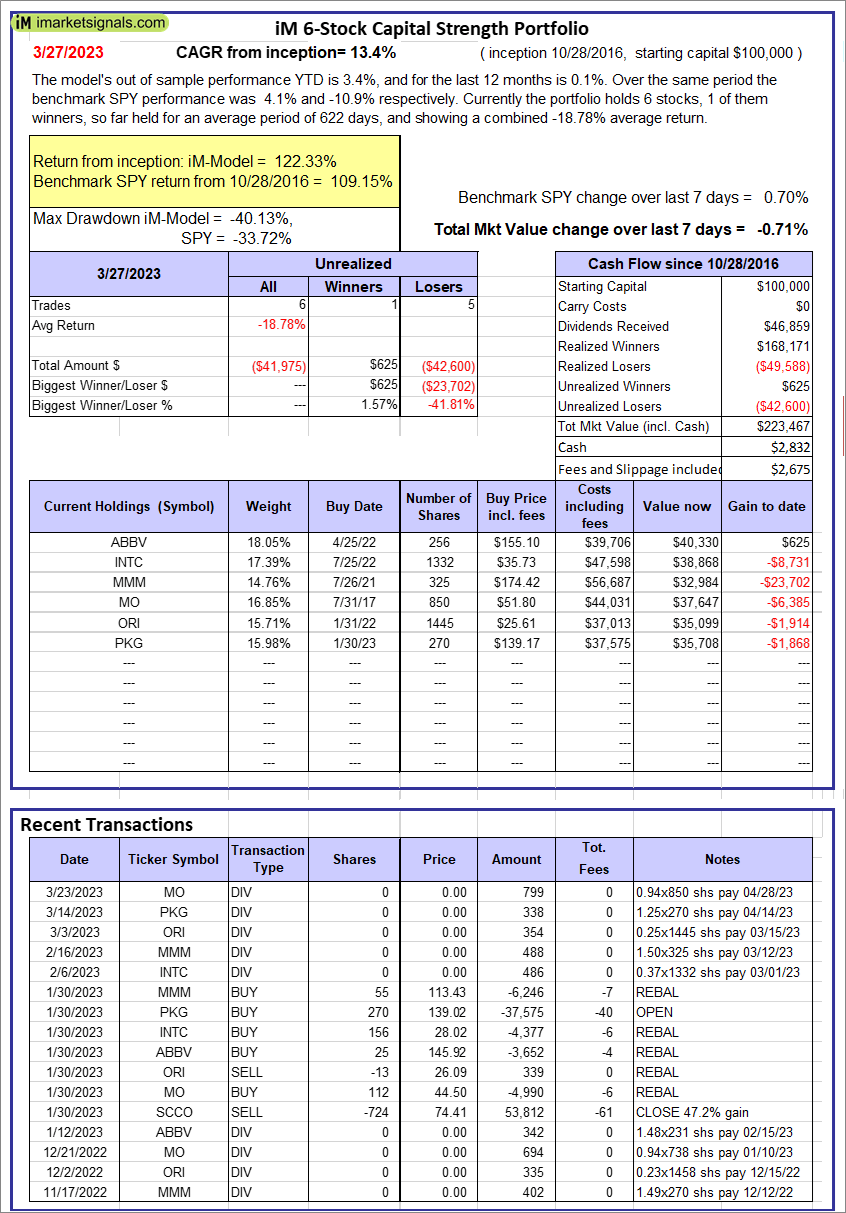 |
iM 6-Stock Capital Strength Portfolio: The model’s out of sample performance YTD is 3.4%, and for the last 12 months is 0.1%. Over the same period the benchmark SPY performance was 4.1% and -10.9% respectively. Over the previous week the market value of the iM 6-Stock Capital Strength Portfolio gained -0.71% at a time when SPY gained 0.70%. A starting capital of $100,000 at inception on 10/28/2016 would have grown to $223,467 which includes $2,832 cash and excludes $2,675 spent on fees and slippage. |
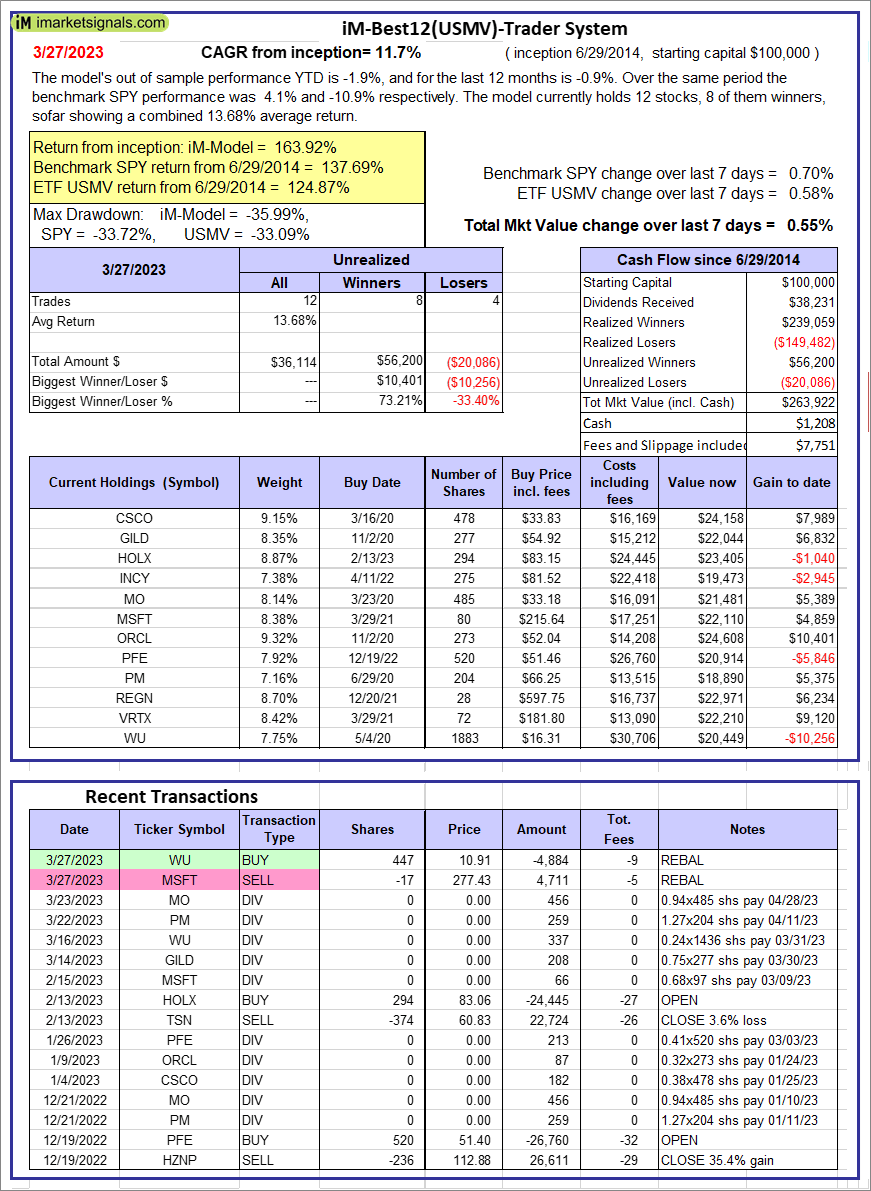 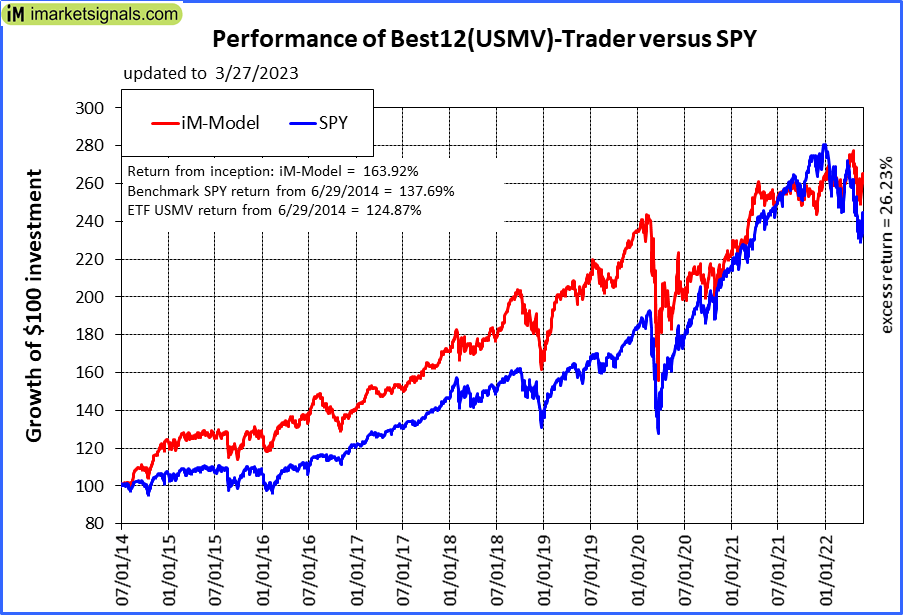 |
iM-Best12(USMV)-Trader: The model’s out of sample performance YTD is -1.9%, and for the last 12 months is -0.9%. Over the same period the benchmark SPY performance was 4.1% and -10.9% respectively. Since inception, on 6/30/2014, the model gained 163.92% while the benchmark SPY gained 137.69% and the ETF USMV gained 124.87% over the same period. Over the previous week the market value of iM-Best12(USMV)-Trader gained 0.55% at a time when SPY gained 0.70%. A starting capital of $100,000 at inception on 6/30/2014 would have grown to $263,922 which includes $1,208 cash and excludes $7,751 spent on fees and slippage. |
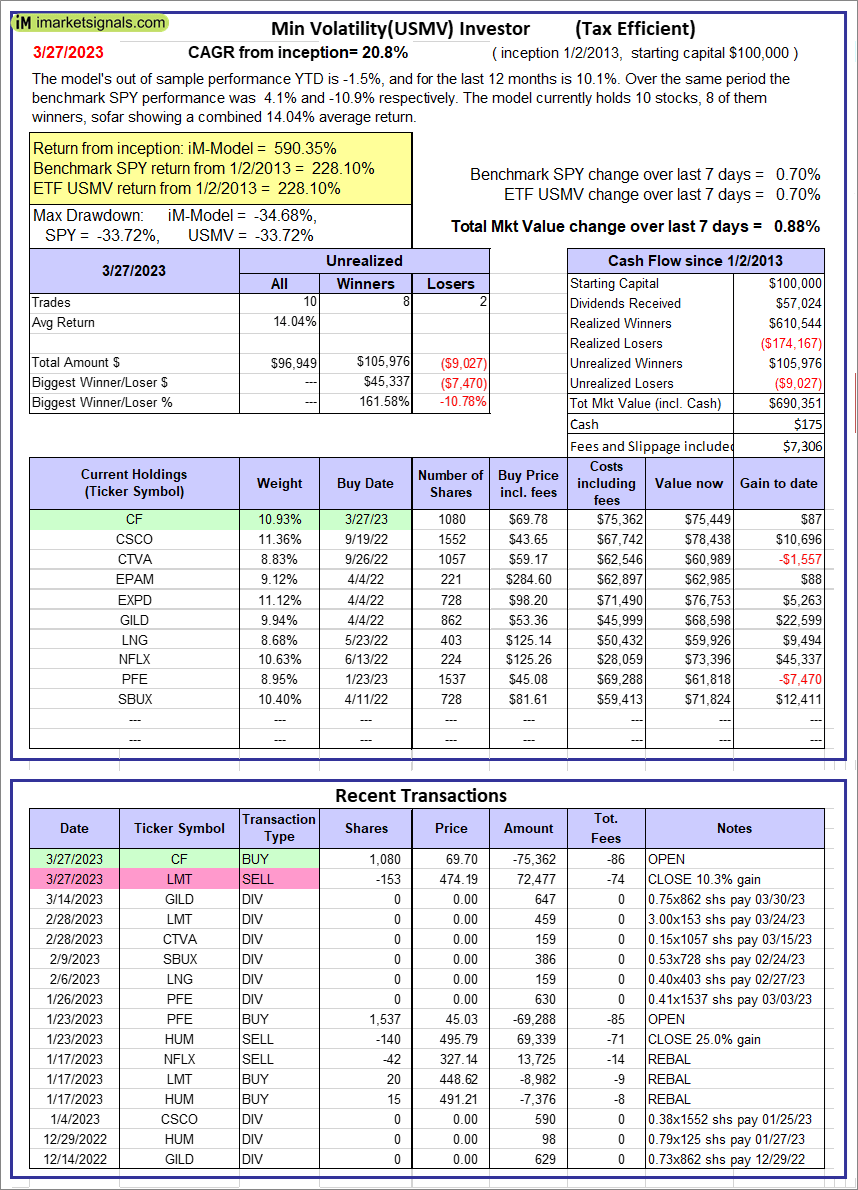 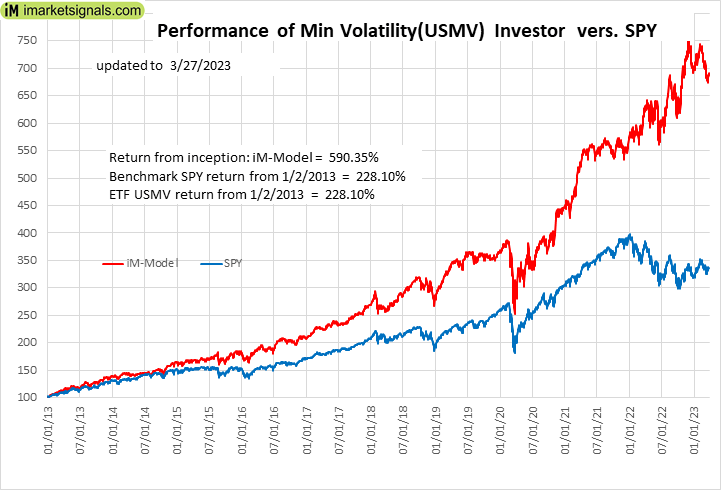 |
iM-Min Volatility(USMV) Investor (Tax Efficient): The model’s out of sample performance YTD is -1.5%, and for the last 12 months is 10.1%. Over the same period the benchmark SPY performance was 4.1% and -10.9% respectively. Since inception, on 1/3/2013, the model gained 590.35% while the benchmark SPY gained 228.10% and the ETF USMV gained 228.10% over the same period. Over the previous week the market value of iM-Best12(USMV)Q1 gained 0.88% at a time when SPY gained 0.70%. A starting capital of $100,000 at inception on 1/3/2013 would have grown to $690,351 which includes $175 cash and excludes $7,306 spent on fees and slippage. |
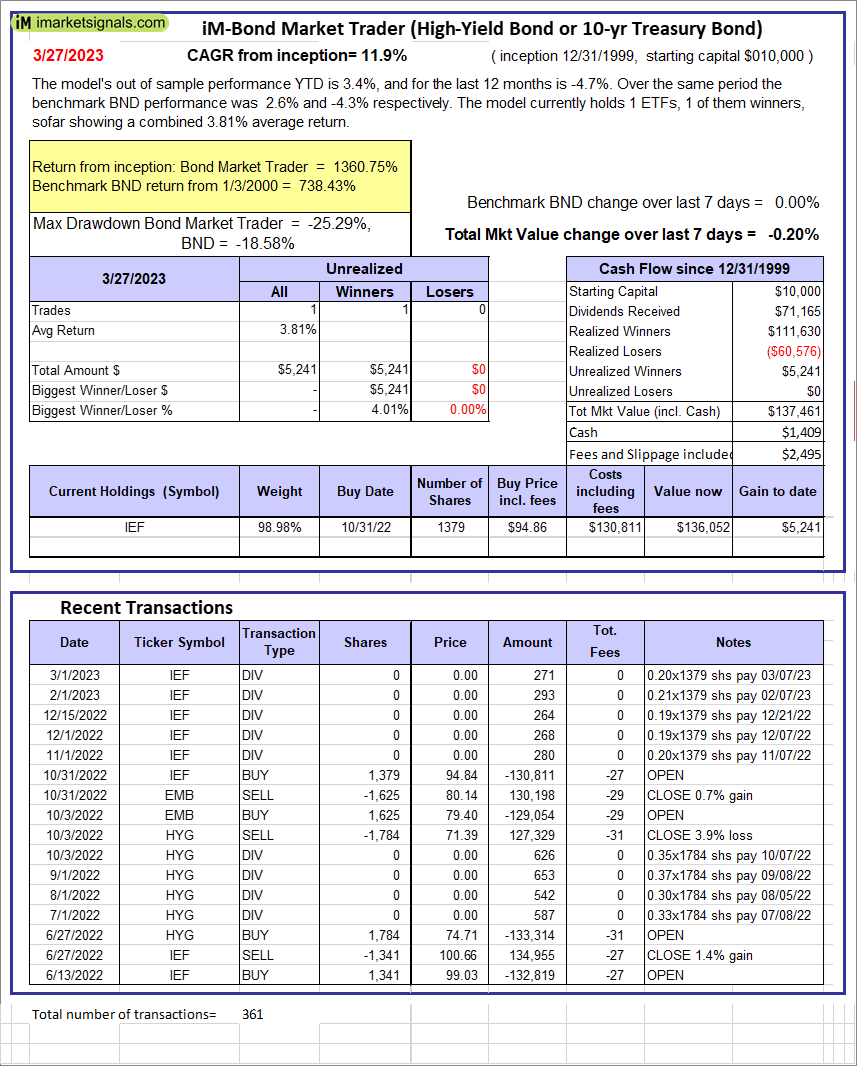 |
iM-Bond Market Trader (High-Yield Bond or 10-yr Treasury Bond): The model’s out of sample performance YTD is 3.4%, and for the last 12 months is -4.7%. Over the same period the benchmark BND performance was 2.6% and -4.3% respectively. Over the previous week the market value of the iM-Bond Market Trader (High-Yield Bond or 10-yr Treasury Bond) gained -0.20% at a time when BND gained 0.00%. A starting capital of $10,000 at inception on 1/3/2000 would have grown to $137,461 which includes $1,409 cash and excludes $2,495 spent on fees and slippage. |
|
|
iM-ModSum/YieldCurve Timer: The model’s out of sample performance YTD is 3.4%, and for the last 12 months is -10.9%. Over the same period the benchmark SPY performance was 4.1% and -10.9% respectively. Over the previous week the market value of iM-PortSum/YieldCurve Timer gained -0.20% at a time when SPY gained 0.70%. A starting capital of $100,000 at inception on 1/1/2016 would have grown to $260,815 which includes $2,622 cash and excludes $1,196 spent on fees and slippage. |
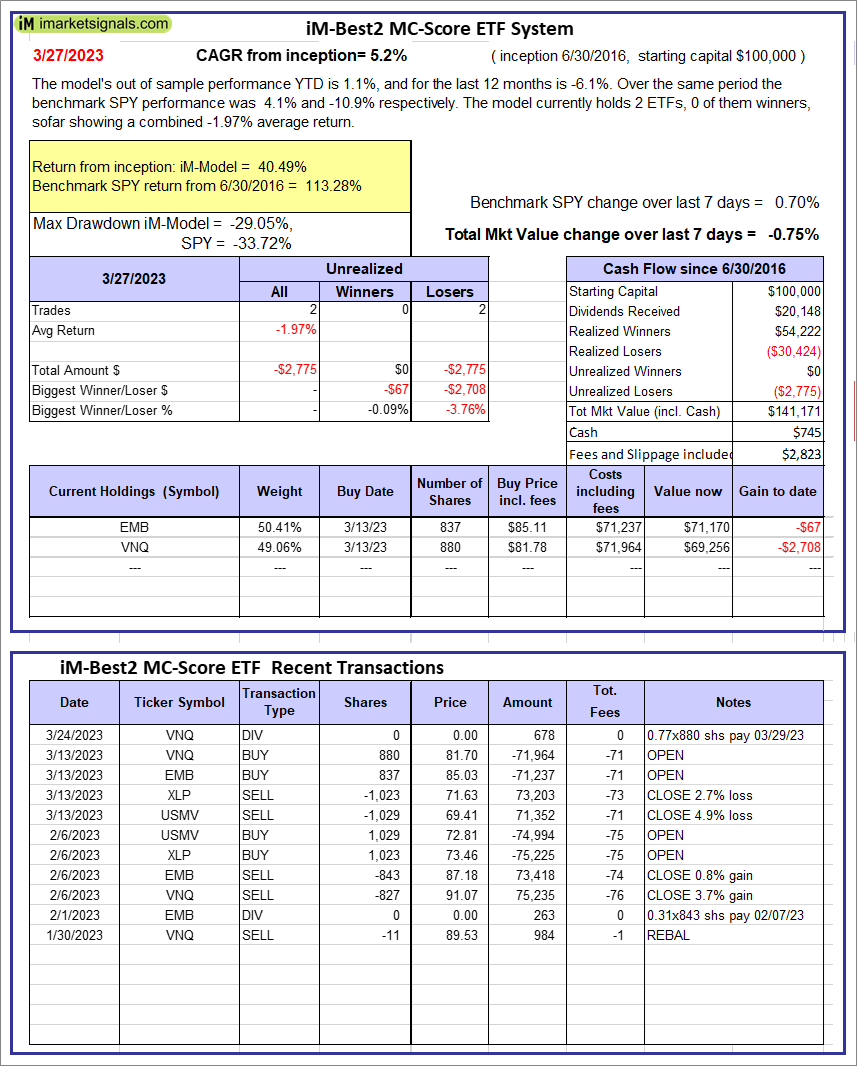 |
iM-Best2 MC-Score ETF System: The model’s out of sample performance YTD is 1.1%, and for the last 12 months is -6.1%. Over the same period the benchmark SPY performance was 4.1% and -10.9% respectively. Over the previous week the market value of the iM-Best2 MC-Score ETF System gained -0.75% at a time when SPY gained 0.70%. A starting capital of $100,000 at inception on 6/30/2016 would have grown to $141,171 which includes $745 cash and excludes $2,823 spent on fees and slippage. |
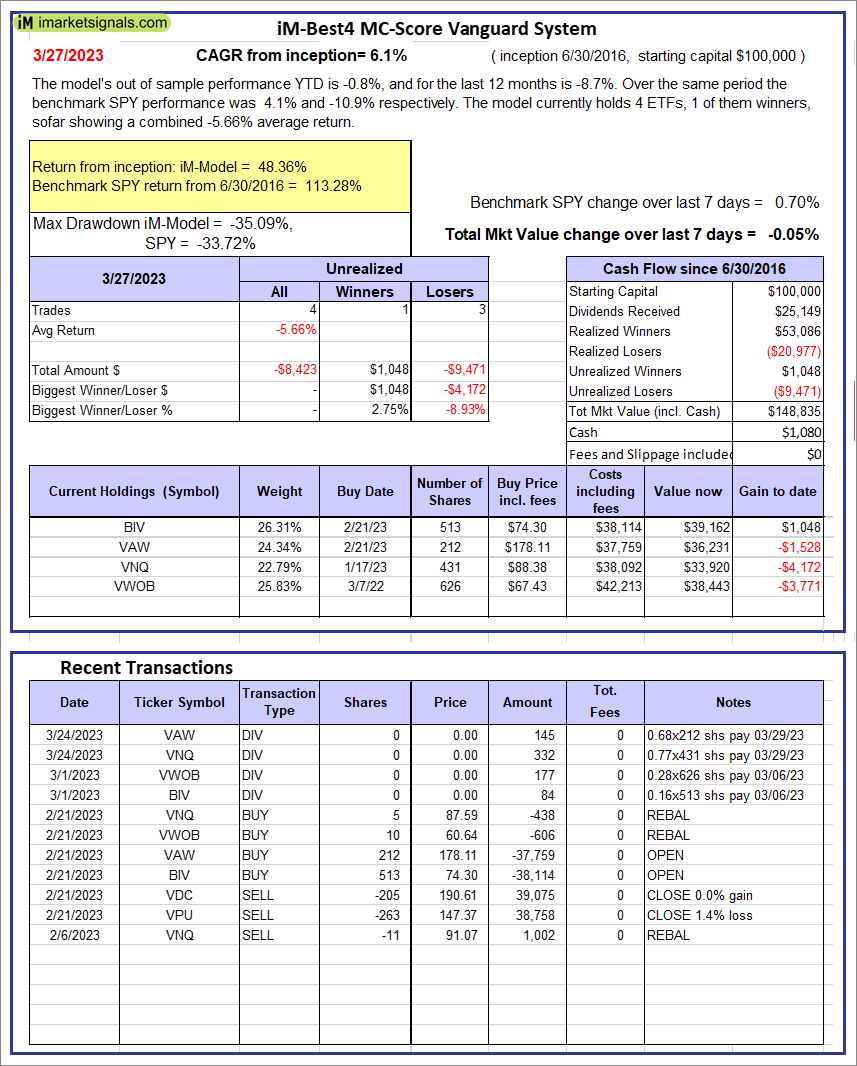 |
iM-Best4 MC-Score Vanguard System: The model’s out of sample performance YTD is -0.8%, and for the last 12 months is -8.7%. Over the same period the benchmark SPY performance was 4.1% and -10.9% respectively. Over the previous week the market value of the iM-Best4 MC-Score Vanguard System gained -0.05% at a time when SPY gained 0.70%. A starting capital of $100,000 at inception on 6/30/2016 would have grown to $148,835 which includes $1,080 cash and excludes $00 spent on fees and slippage. |
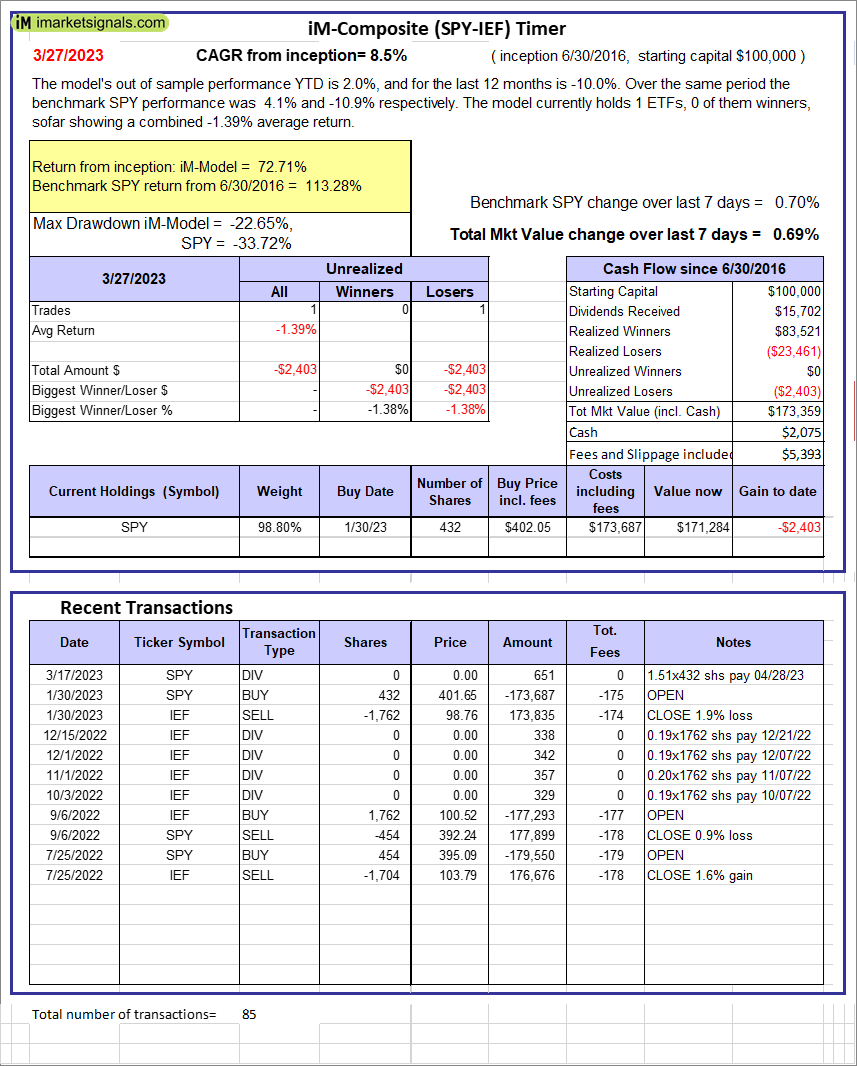 |
iM-Composite (SPY-IEF) Timer: The model’s out of sample performance YTD is 2.0%, and for the last 12 months is -10.0%. Over the same period the benchmark SPY performance was 4.1% and -10.9% respectively. Over the previous week the market value of the iM-Composite (SPY-IEF) Timer gained 0.69% at a time when SPY gained 0.70%. A starting capital of $100,000 at inception on 6/30/2016 would have grown to $173,359 which includes $2,075 cash and excludes $5,393 spent on fees and slippage. |
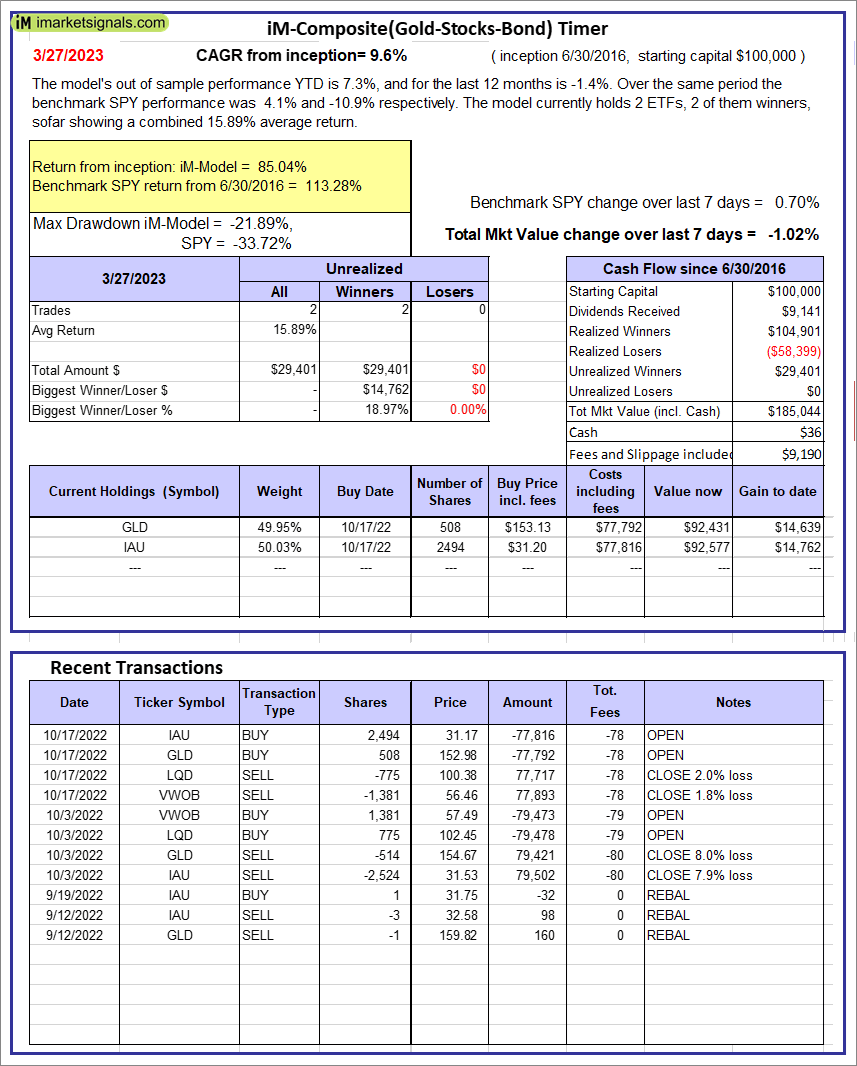 |
iM-Composite(Gold-Stocks-Bond) Timer: The model’s out of sample performance YTD is 7.3%, and for the last 12 months is -1.4%. Over the same period the benchmark SPY performance was 4.1% and -10.9% respectively. Over the previous week the market value of the iM-Composite(Gold-Stocks-Bond) Timer gained -1.02% at a time when SPY gained 0.70%. A starting capital of $100,000 at inception on 6/30/2016 would have grown to $185,044 which includes $36 cash and excludes $9,190 spent on fees and slippage. |
iM-Best Reports – 3/27/2023
Posted in pmp SPY-SH
Leave a Reply
You must be logged in to post a comment.