
  |
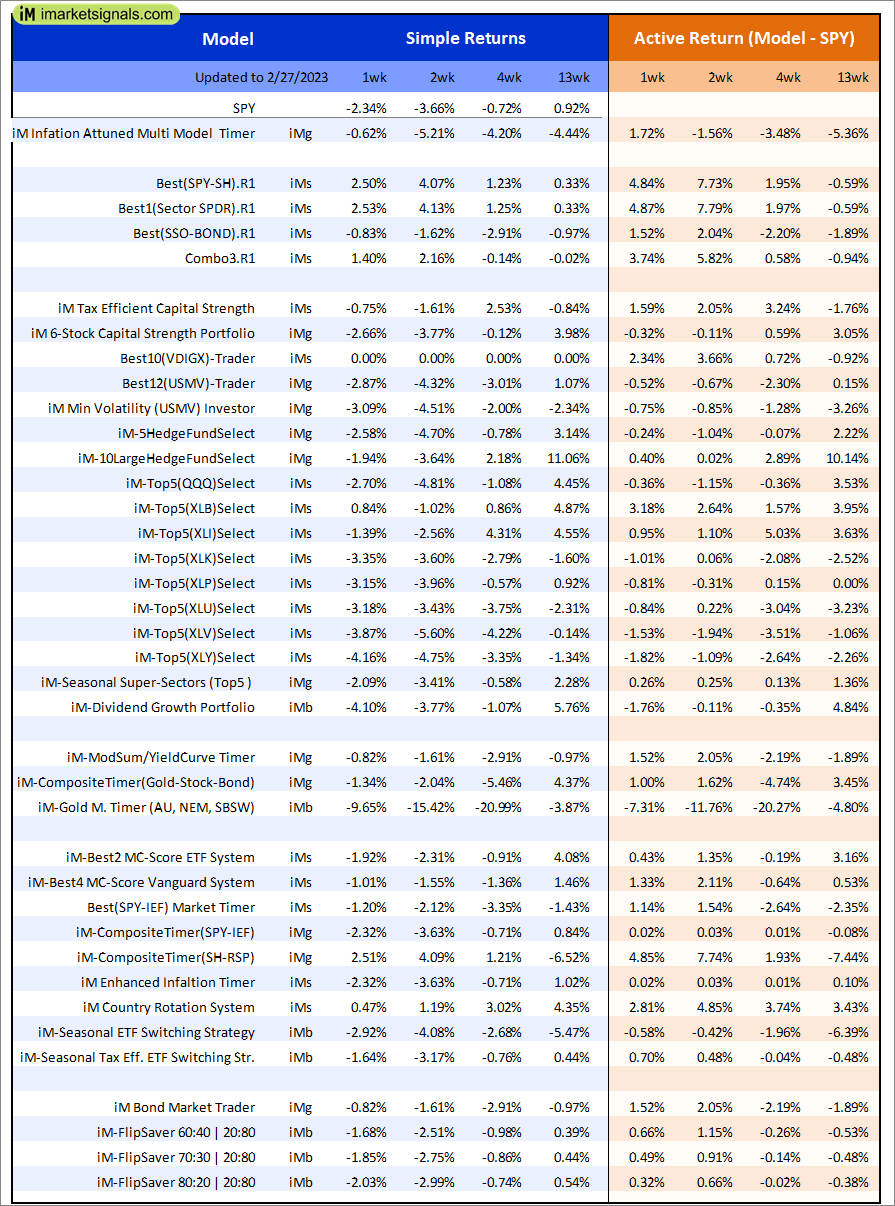
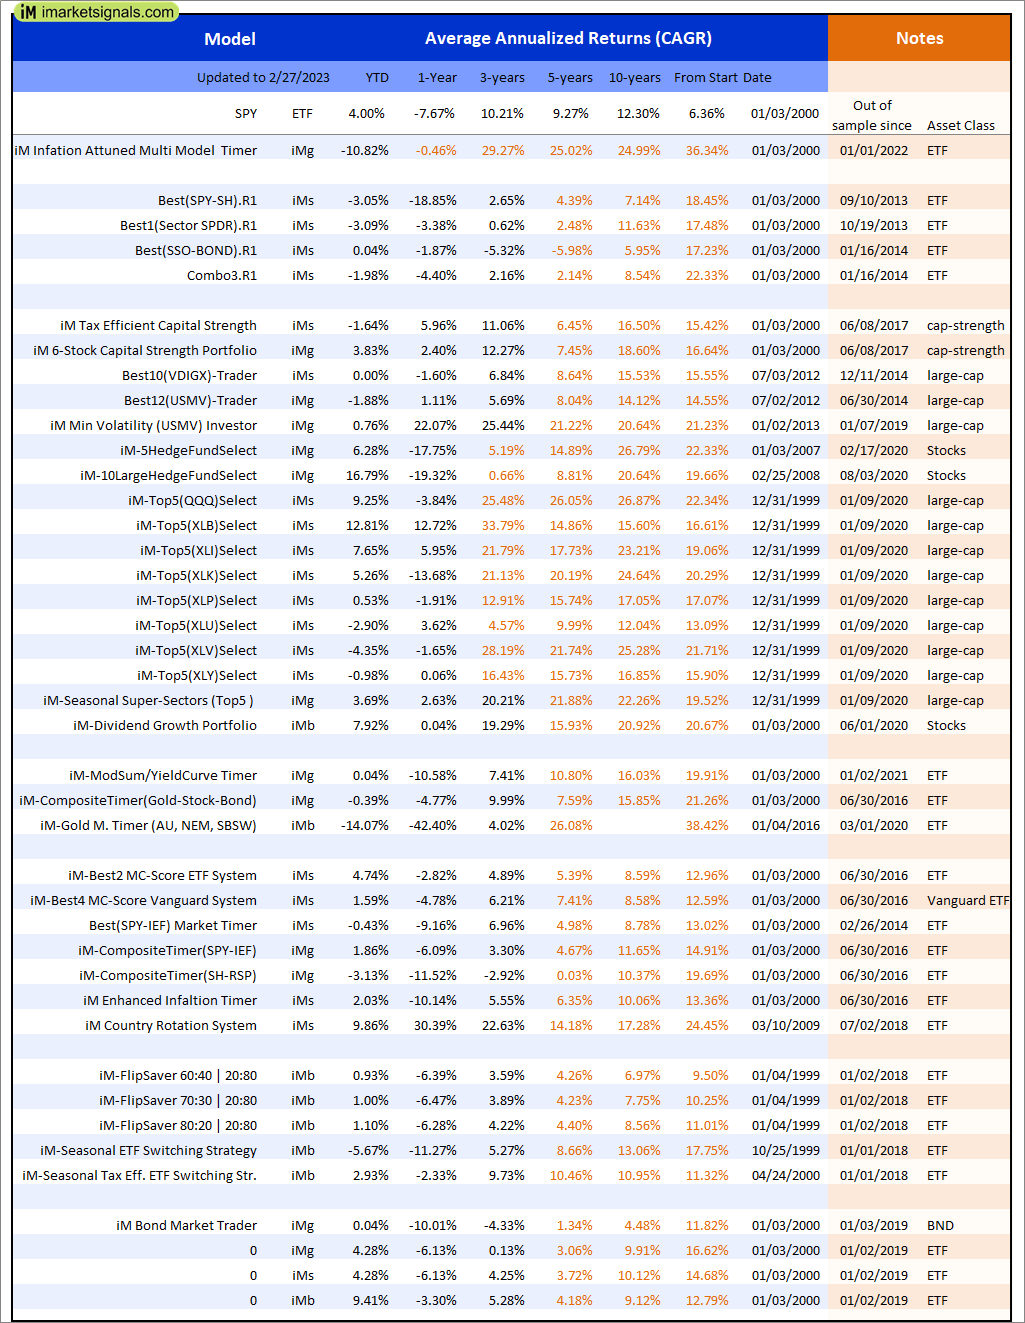
Out of sample performance summary of our models for the past 1, 2, 4 and 13 week periods. The active active return indicates how the models over- or underperformed the benchmark ETF SPY. Also the YTD, and the 1-, 3-, 5- and 10-year annualized returns are shown in the second table |
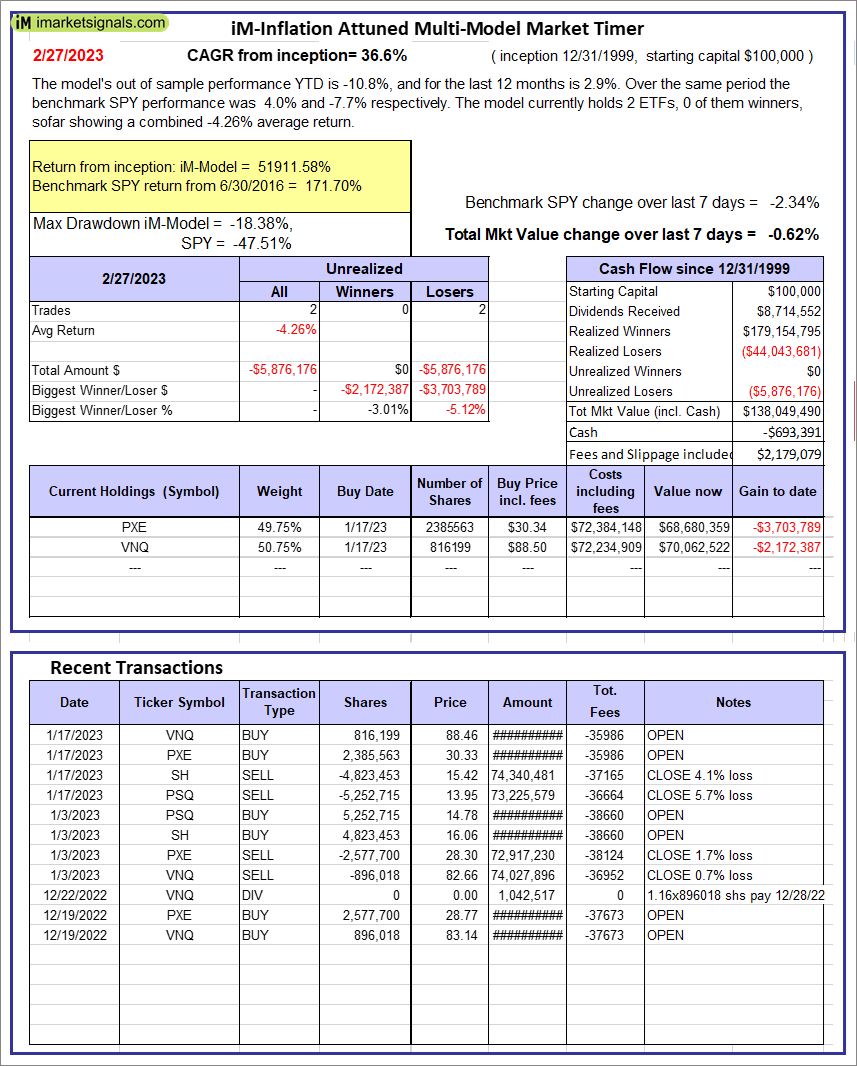 |
iM-Inflation Attuned Multi-Model Market Timer: The model’s out of sample performance YTD is -10.8%, and for the last 12 months is 2.9%. Over the same period the benchmark SPY performance was 4.0% and -7.7% respectively. Over the previous week the market value of the iM-Inflation Attuned Multi-Model Market Timer gained -0.62% at a time when SPY gained -2.34%. A starting capital of $100,000 at inception on 3/24/2017 would have grown to $138,049,490 which includes -$693,391 cash and excludes $2,179,079 spent on fees and slippage. |
 |
iM-FlipSaver 60:40 | 20:80 – 2017: The model’s out of sample performance YTD is 0.9%, and for the last 12 months is -6.7%. Over the same period the benchmark E60B40 performance was 2.6% and -7.7% respectively. Over the previous week the market value of iM-FlipSaver 80:20 | 20:80 gained -1.68% at a time when SPY gained -1.67%. A starting capital of $100,000 at inception on 7/16/2015 would have grown to $142,258 which includes $691 cash and excludes $2,960 spent on fees and slippage. |
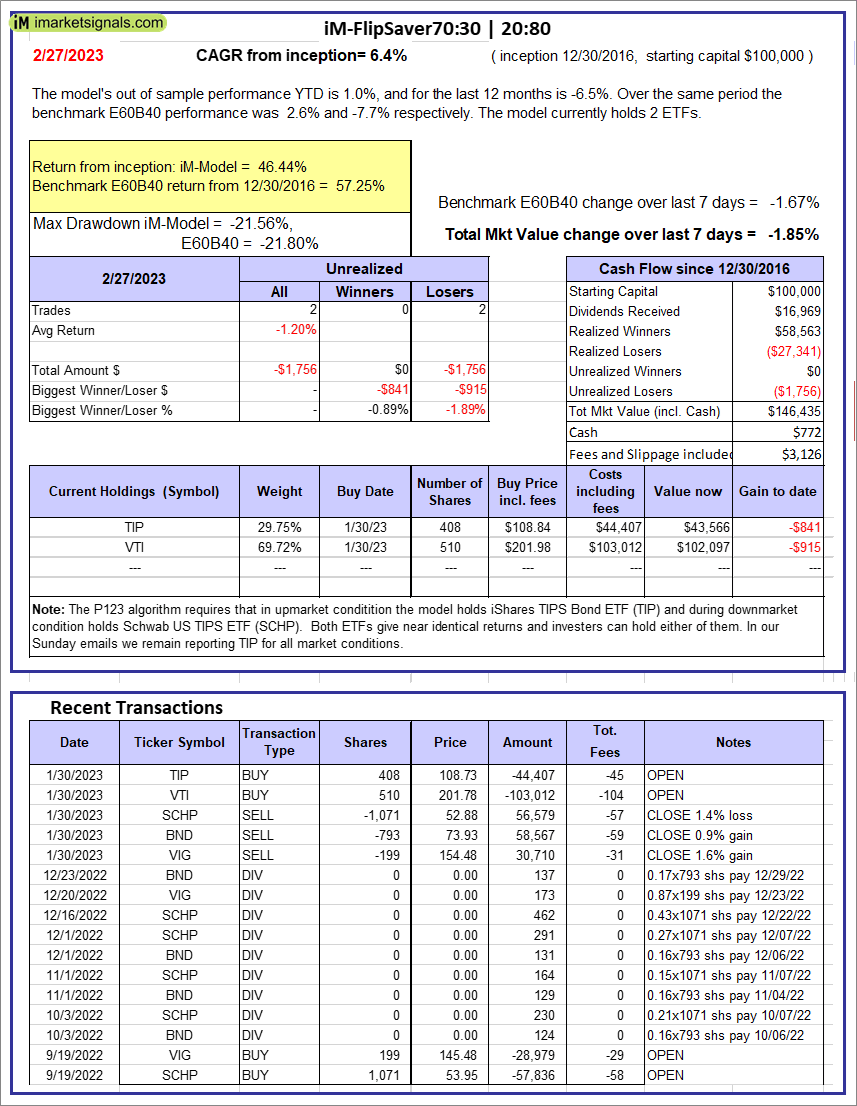 |
iM-FlipSaver 70:30 | 20:80 – 2017: The model’s out of sample performance YTD is 1.0%, and for the last 12 months is -6.5%. Over the same period the benchmark E60B40 performance was 2.6% and -7.7% respectively. Over the previous week the market value of iM-FlipSaver 70:30 | 20:80 gained -1.85% at a time when SPY gained -1.67%. A starting capital of $100,000 at inception on 7/15/2015 would have grown to $146,435 which includes $772 cash and excludes $3,126 spent on fees and slippage. |
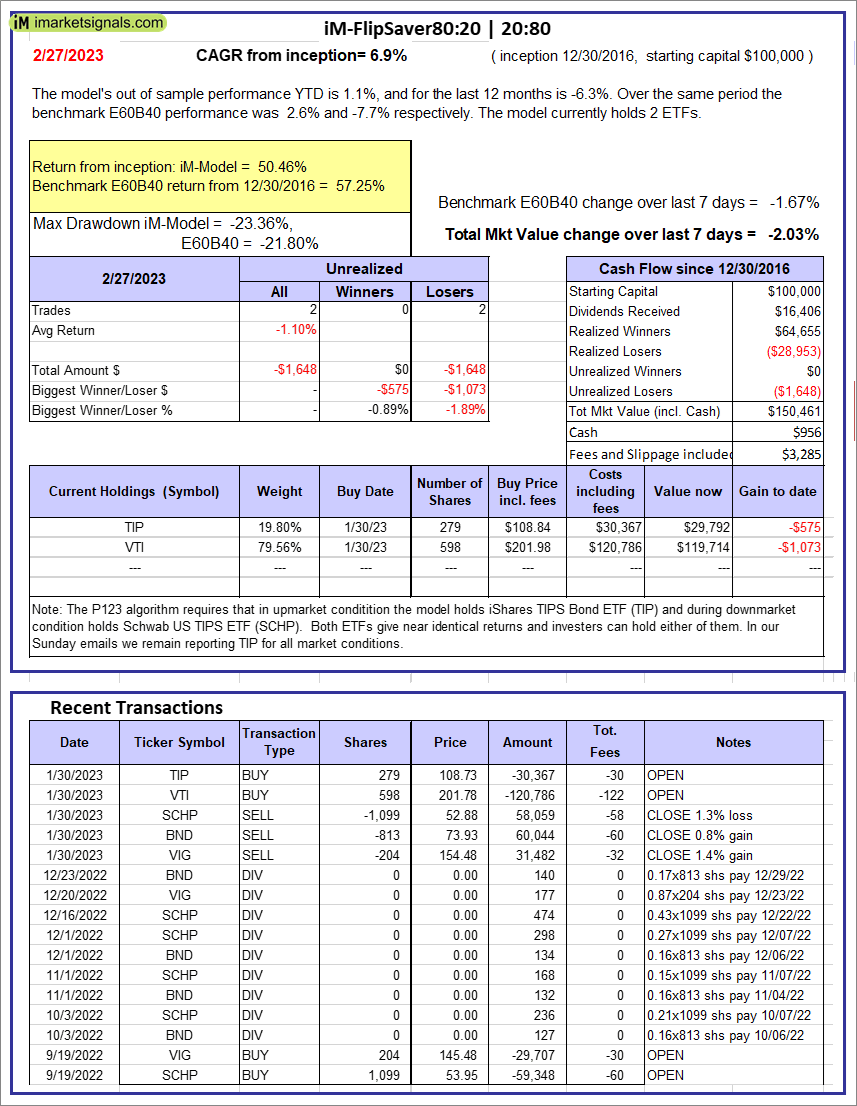 |
iM-FlipSaver 80:20 | 20:80 – 2017: The model’s out of sample performance YTD is 1.1%, and for the last 12 months is -6.3%. Over the same period the benchmark E60B40 performance was 2.6% and -7.7% respectively. Over the previous week the market value of iM-FlipSaver 80:20 | 20:80 gained -2.03% at a time when SPY gained -1.67%. A starting capital of $100,000 at inception on 1/2/2017 would have grown to $150,461 which includes $956 cash and excludes $3,285 spent on fees and slippage. |
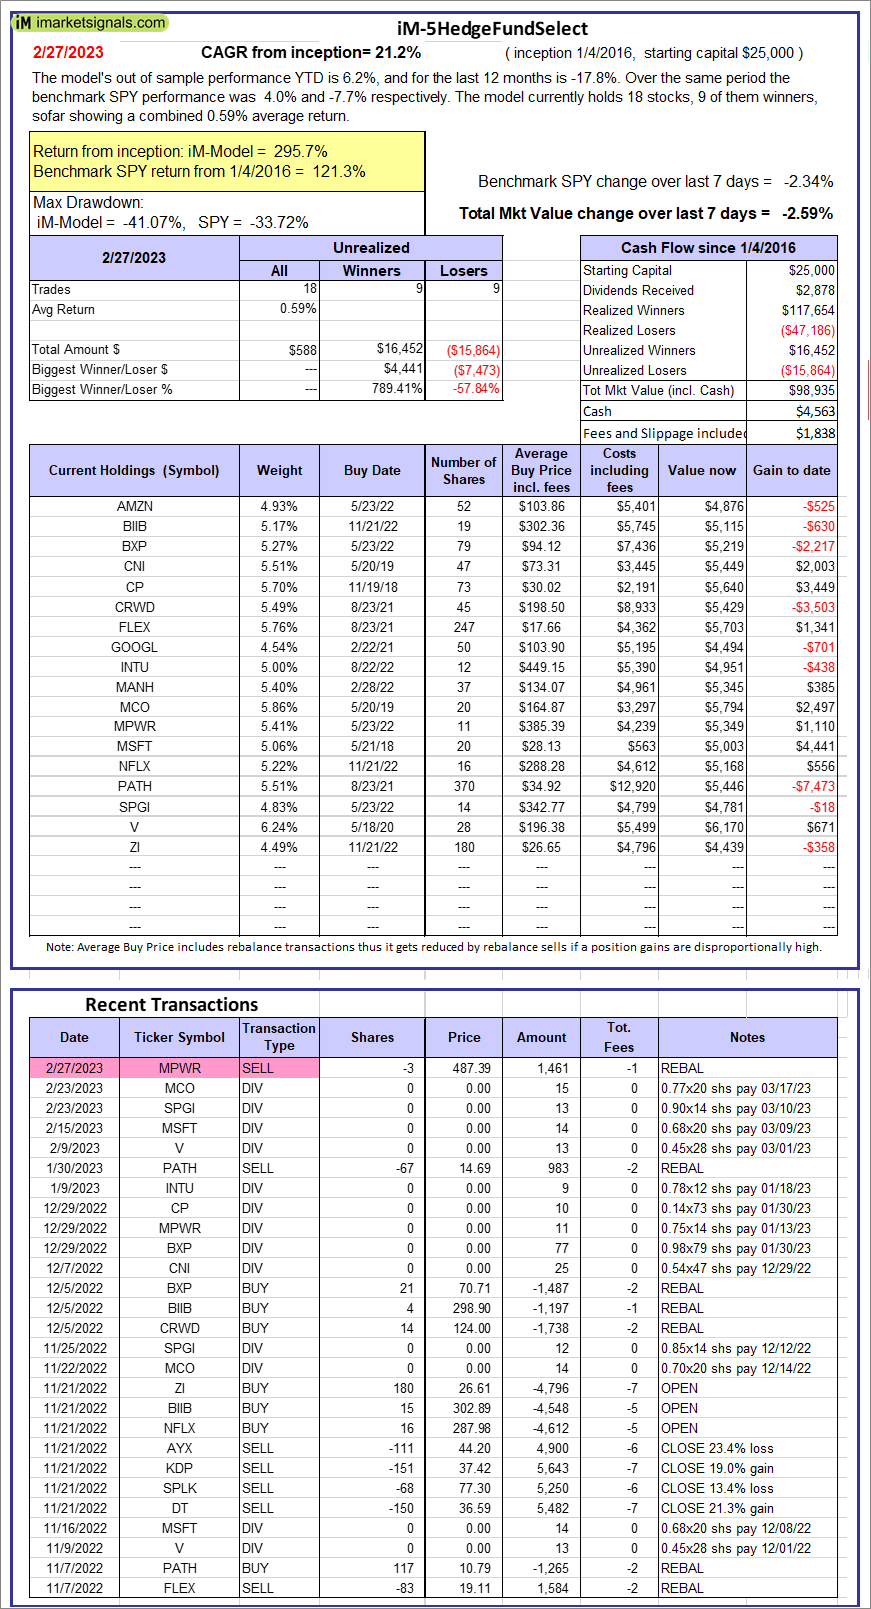 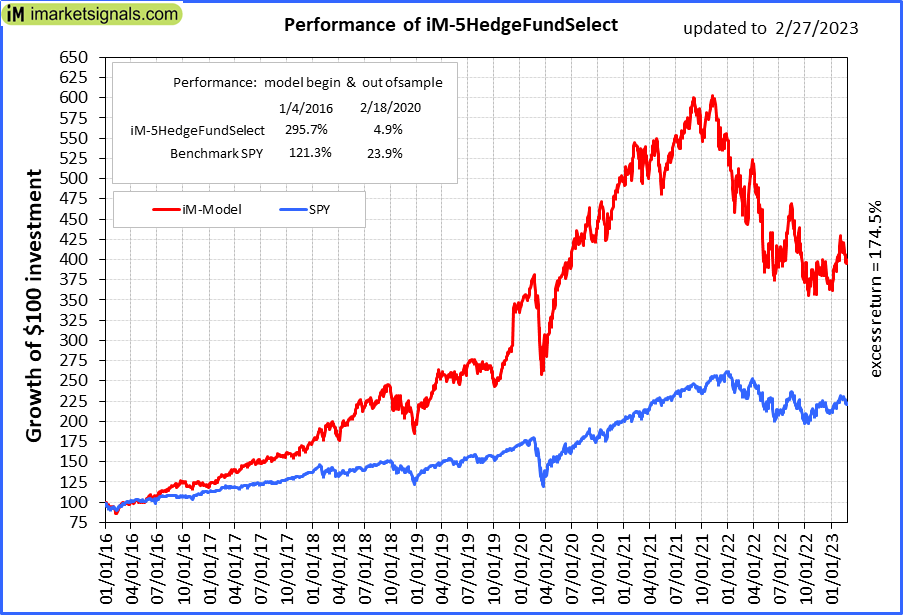 |
iM-5HedgeFundSelect: Since inception, on 1/5/2016, the model gained 295.74% while the benchmark SPY gained 121.27% over the same period. Over the previous week the market value of iM-5HedgeFundSelect gained -2.59% at a time when SPY gained -2.34%. A starting capital of $25,000 at inception on 1/5/2016 would have grown to $98,935 which includes $4,563 cash and excludes $1,838 spent on fees and slippage. |
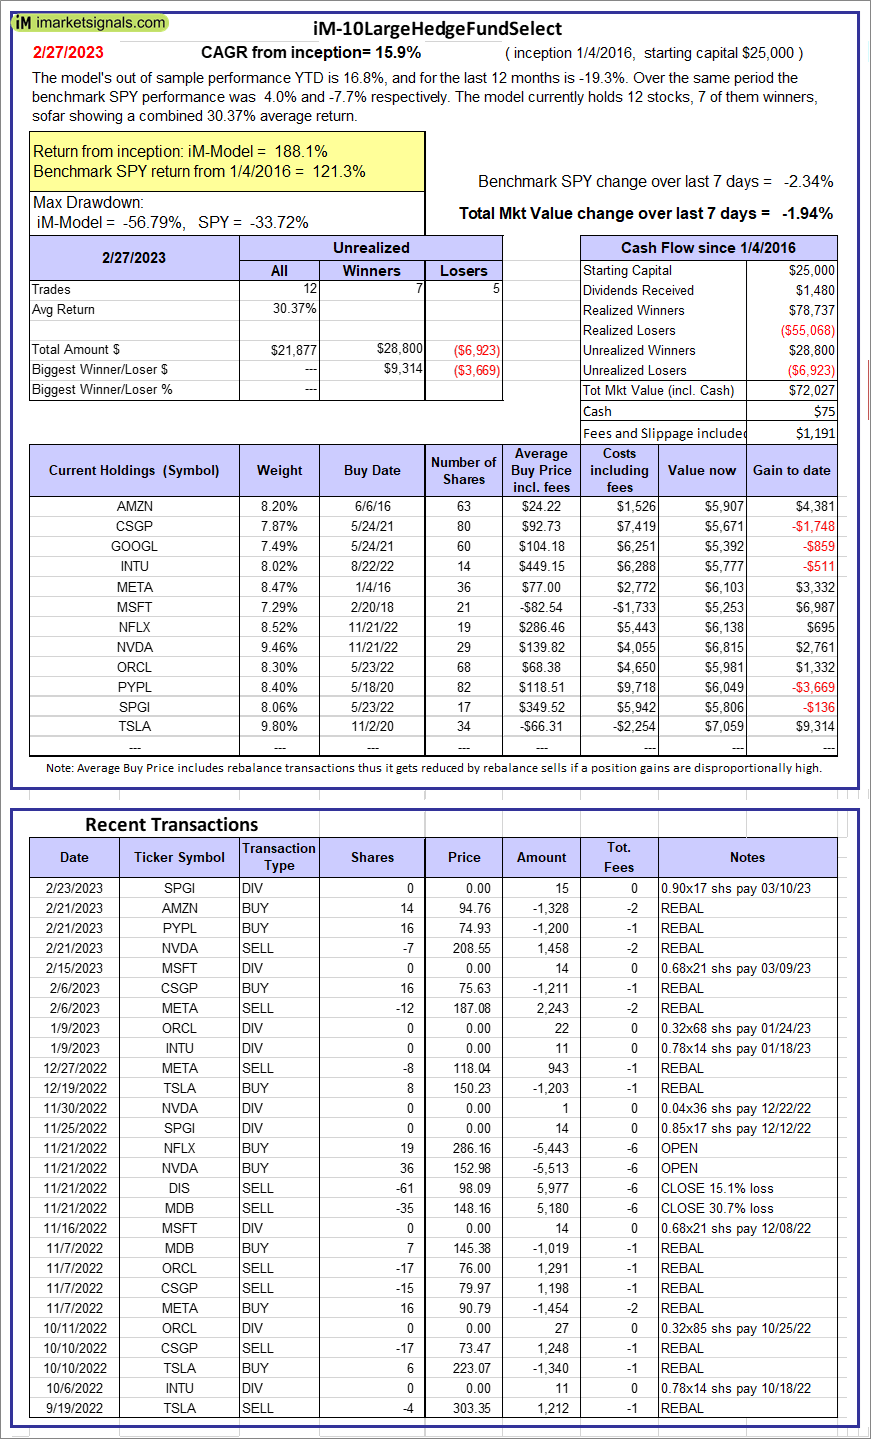 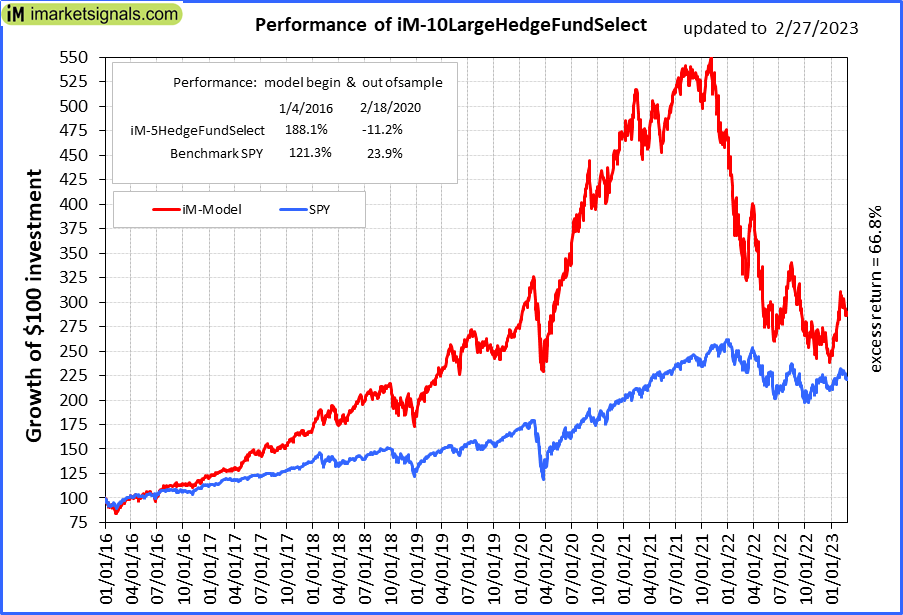 |
iM-10LargeHedgeFundSelect: Since inception, on 1/5/2016, the model gained 188.11% while the benchmark SPY gained 121.27% over the same period. Over the previous week the market value of iM-10LargeHedgeFundSelect gained -1.94% at a time when SPY gained -2.34%. A starting capital of $25,000 at inception on 1/5/2016 would have grown to $72,027 which includes $75 cash and excludes $1,191 spent on fees and slippage. |
 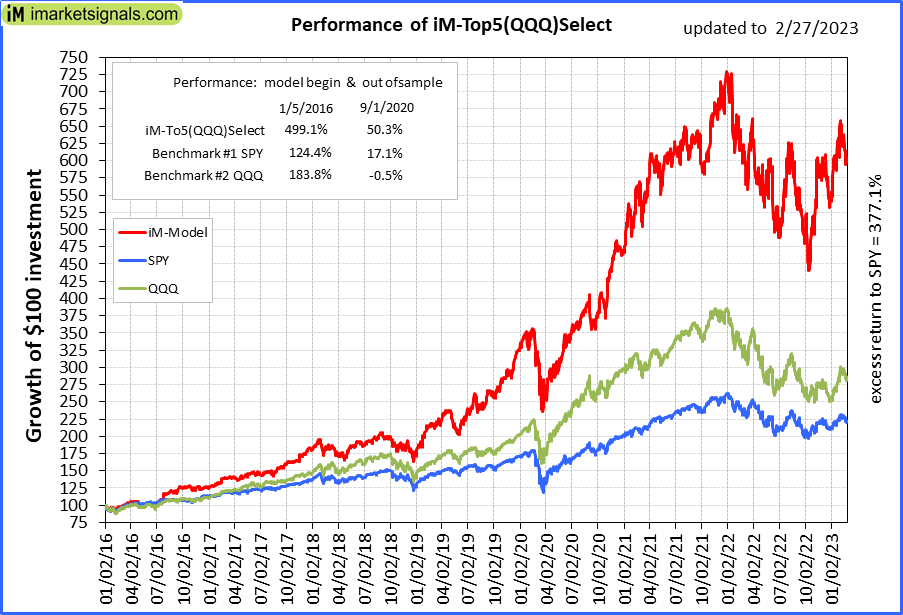 |
iM-Top5(QQQ)Select: Since inception, on 1/5/2016, the model gained 498.37% while the benchmark SPY gained 121.27% over the same period. Over the previous week the market value of iM-Top5(QQQ)Select gained -2.70% at a time when SPY gained -2.34%. A starting capital of $100,000 at inception on 1/5/2016 would have grown to $598,366 which includes $747 cash and excludes $9,482 spent on fees and slippage. |
 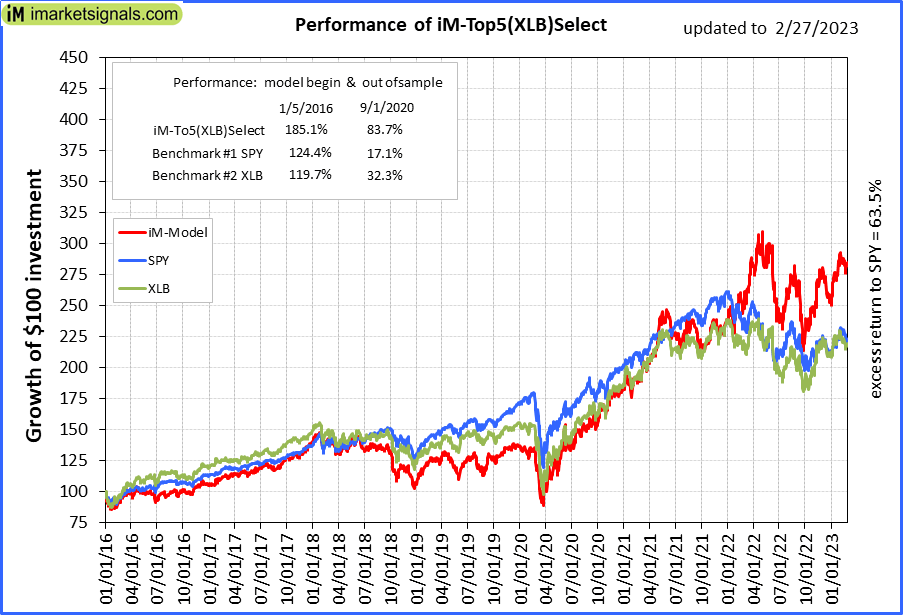 |
iM-Top5(XLB)Select: Since inception, on 1/5/2016, the model gained 184.74% while the benchmark SPY gained 121.27% over the same period. Over the previous week the market value of iM-Top5(XLB)Select gained 0.84% at a time when SPY gained -2.34%. A starting capital of $100,000 at inception on 1/5/2016 would have grown to $284,742 which includes $175 cash and excludes $9,669 spent on fees and slippage. |
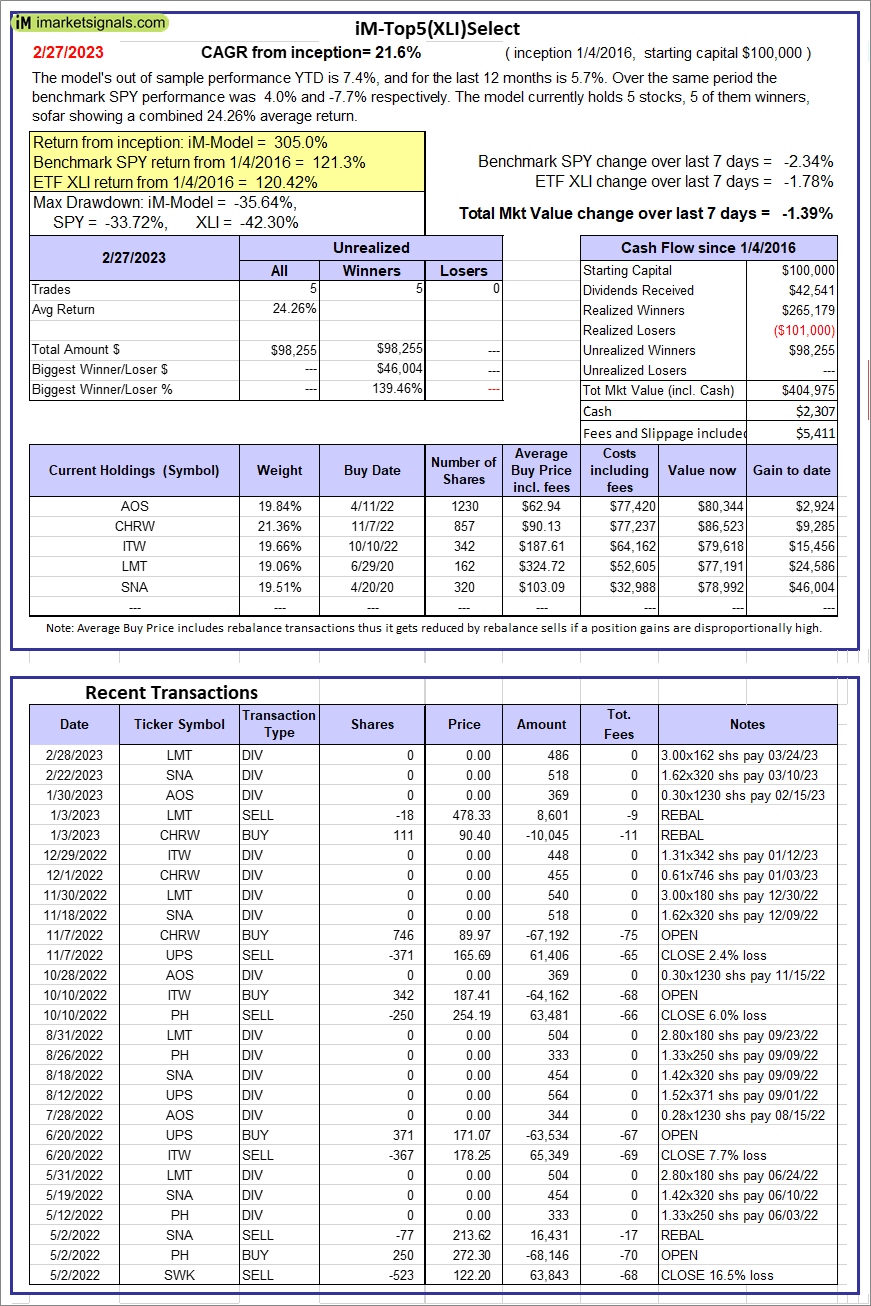 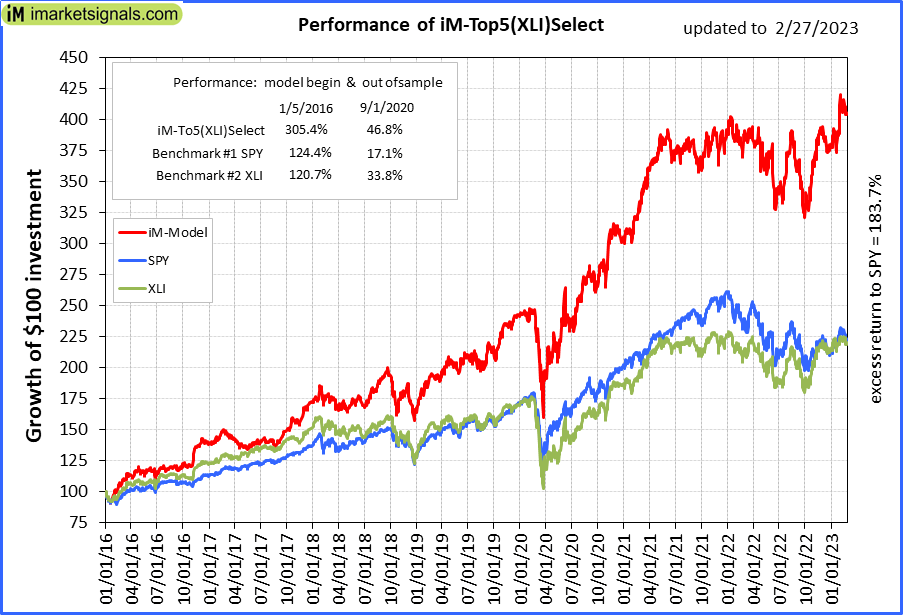 |
iM-Top5(XLI)Select: Since inception, on 1/5/2016, the model gained 304.97% while the benchmark SPY gained 121.27% over the same period. Over the previous week the market value of iM-Top5(XLI)Select gained -1.39% at a time when SPY gained -2.34%. A starting capital of $100,000 at inception on 1/5/2016 would have grown to $404,975 which includes $2,307 cash and excludes $5,411 spent on fees and slippage. |
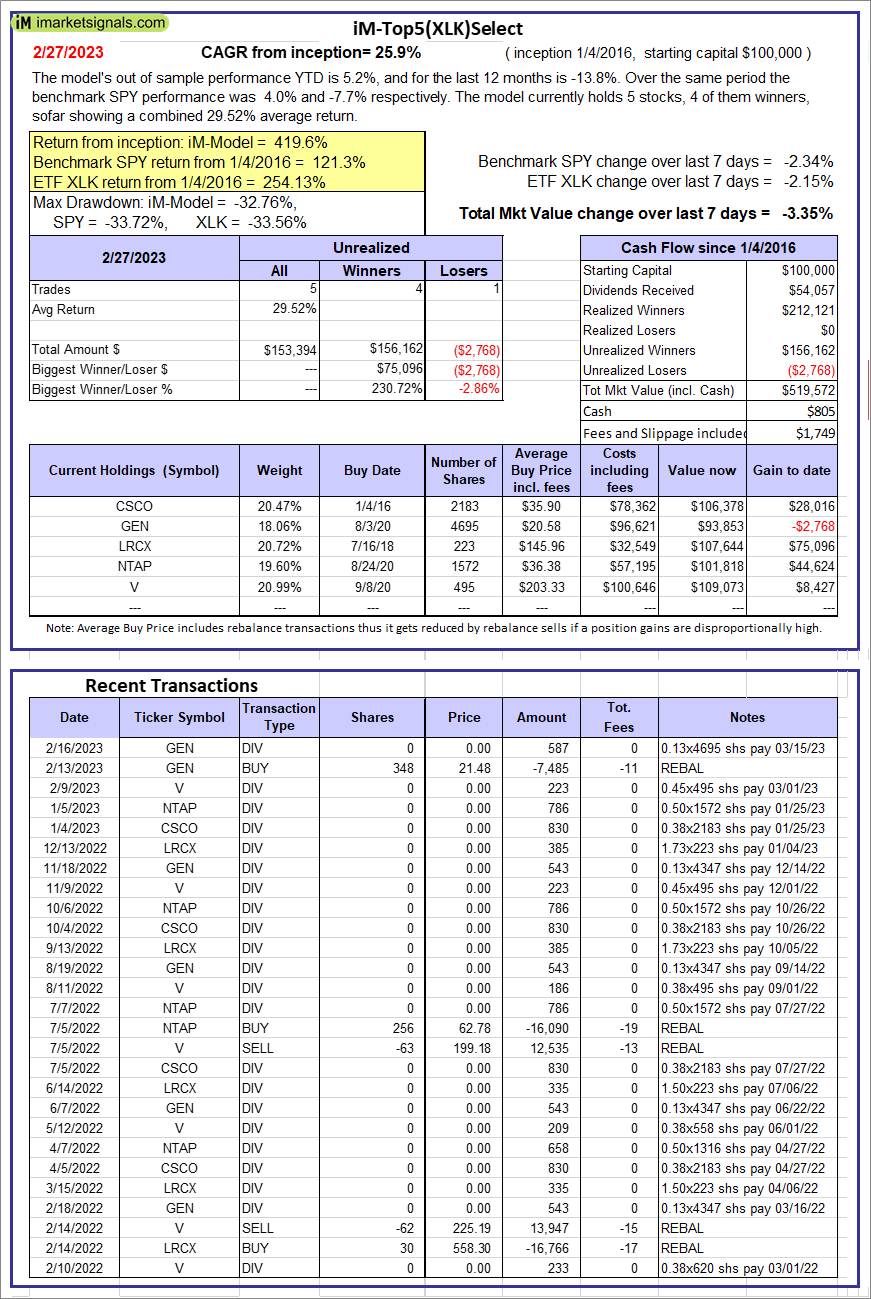  |
iM-Top5(XLK)Select: Since inception, on 1/5/2016, the model gained 419.57% while the benchmark SPY gained 121.27% over the same period. Over the previous week the market value of iM-Top5(XLK)Select gained -3.35% at a time when SPY gained -2.34%. A starting capital of $100,000 at inception on 1/5/2016 would have grown to $519,572 which includes $805 cash and excludes $1,749 spent on fees and slippage. |
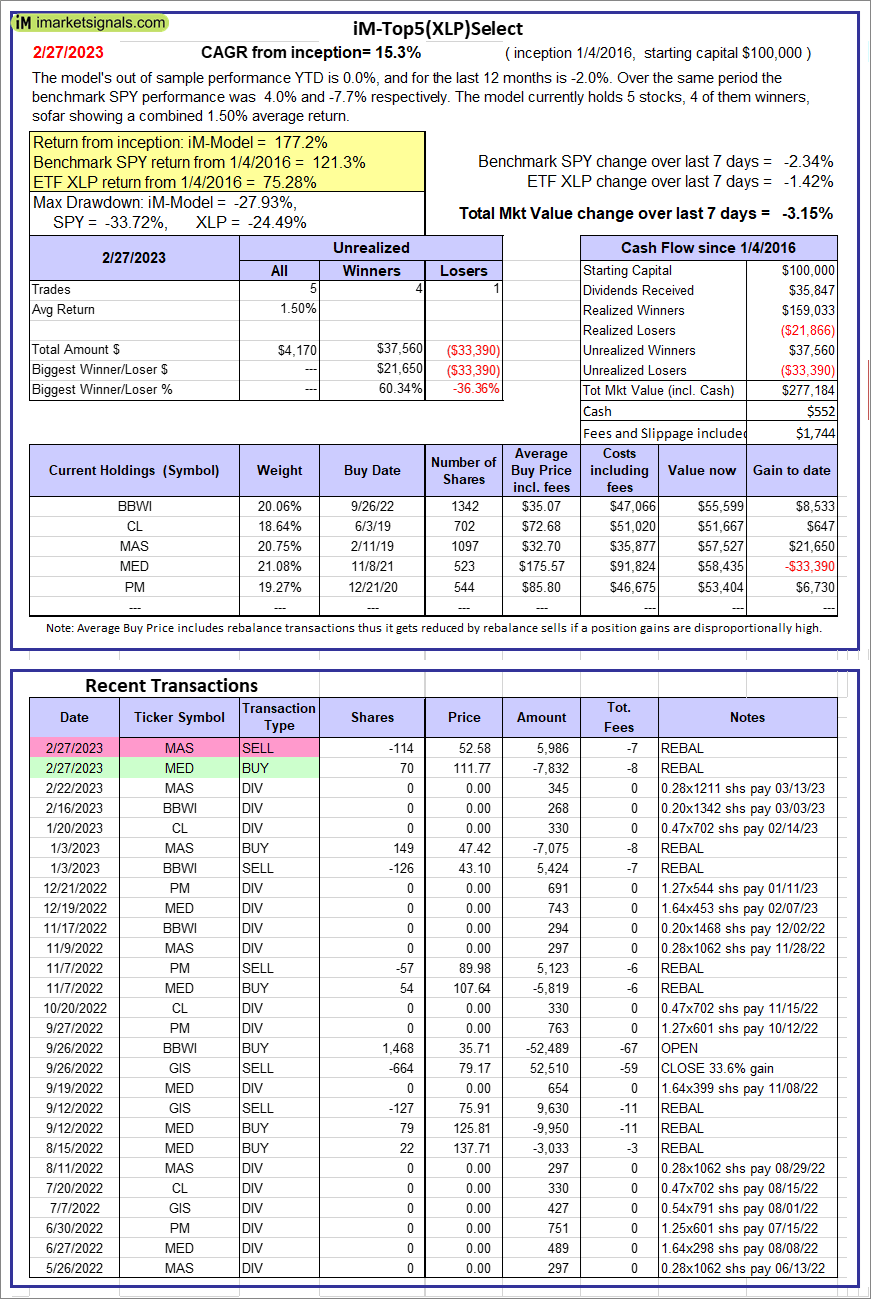 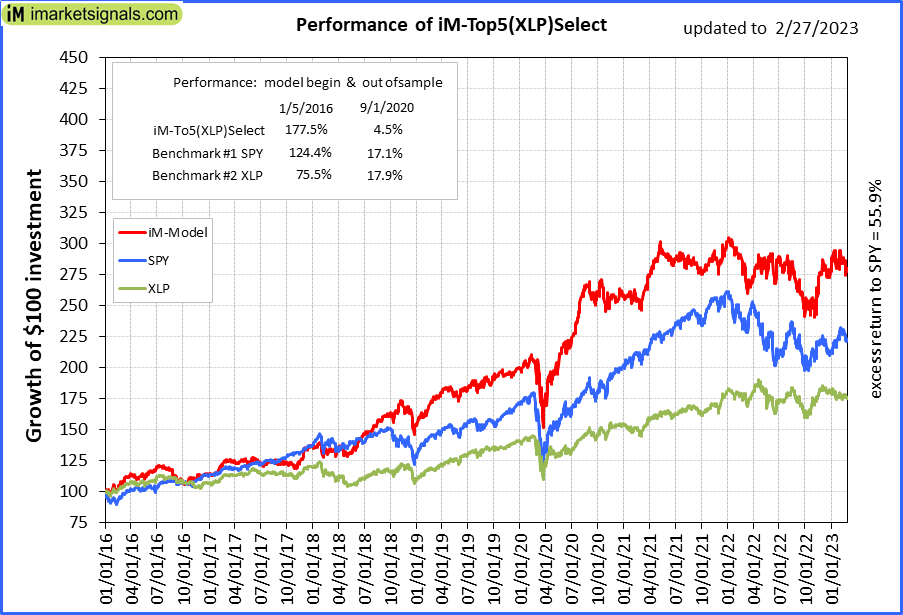 |
iM-Top5(XLP)Select: Since inception, on 1/5/2016, the model gained 177.18% while the benchmark SPY gained 121.27% over the same period. Over the previous week the market value of iM-Top5(XLP)Select gained -3.15% at a time when SPY gained -2.34%. A starting capital of $100,000 at inception on 1/5/2016 would have grown to $277,184 which includes $552 cash and excludes $1,744 spent on fees and slippage. |
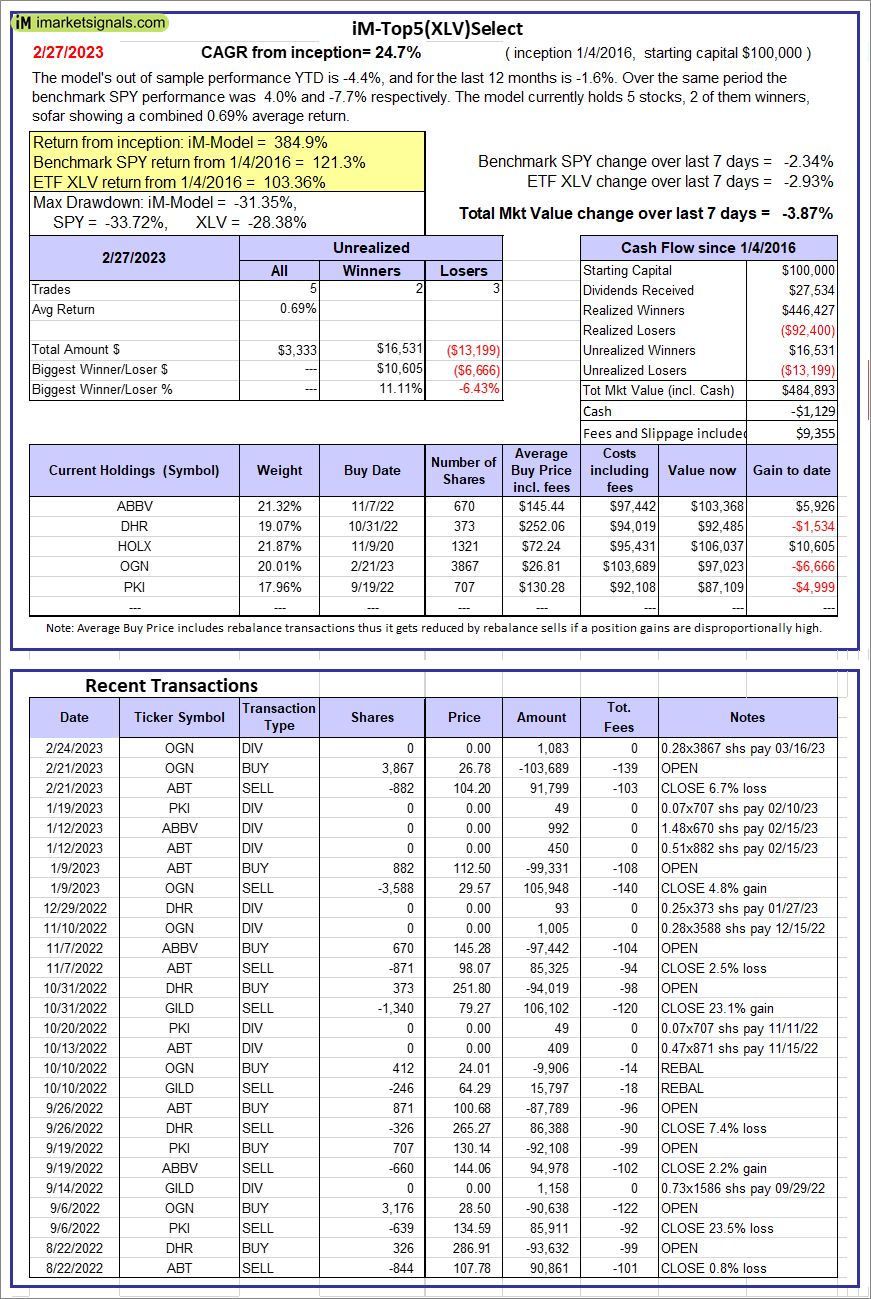 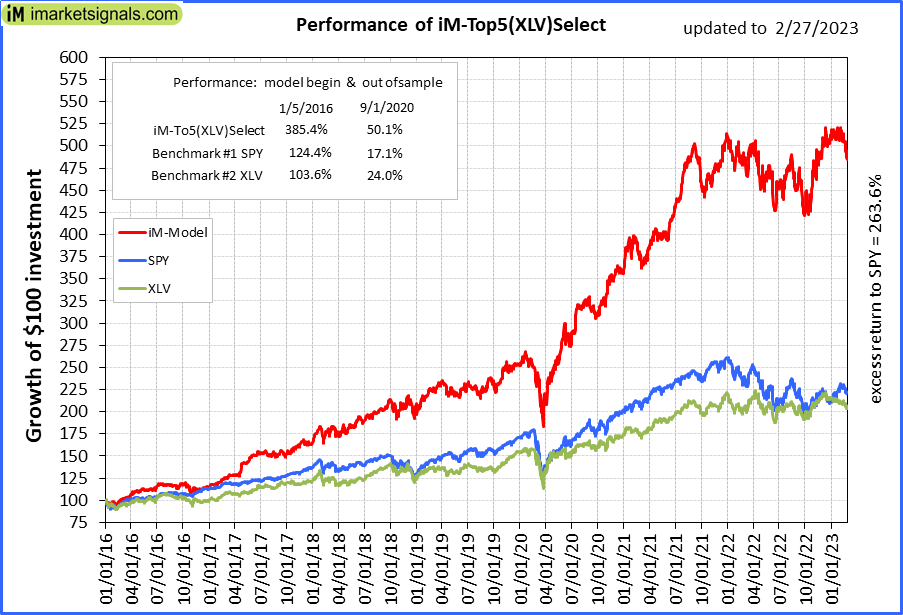 |
iM-Top5(XLV)Select: Since inception, on 1/5/2016, the model gained 384.89% while the benchmark SPY gained 121.27% over the same period. Over the previous week the market value of iM-Top5(XLV)Select gained -3.87% at a time when SPY gained -2.34%. A starting capital of $100,000 at inception on 1/5/2016 would have grown to $484,893 which includes -$1,129 cash and excludes $9,355 spent on fees and slippage. |
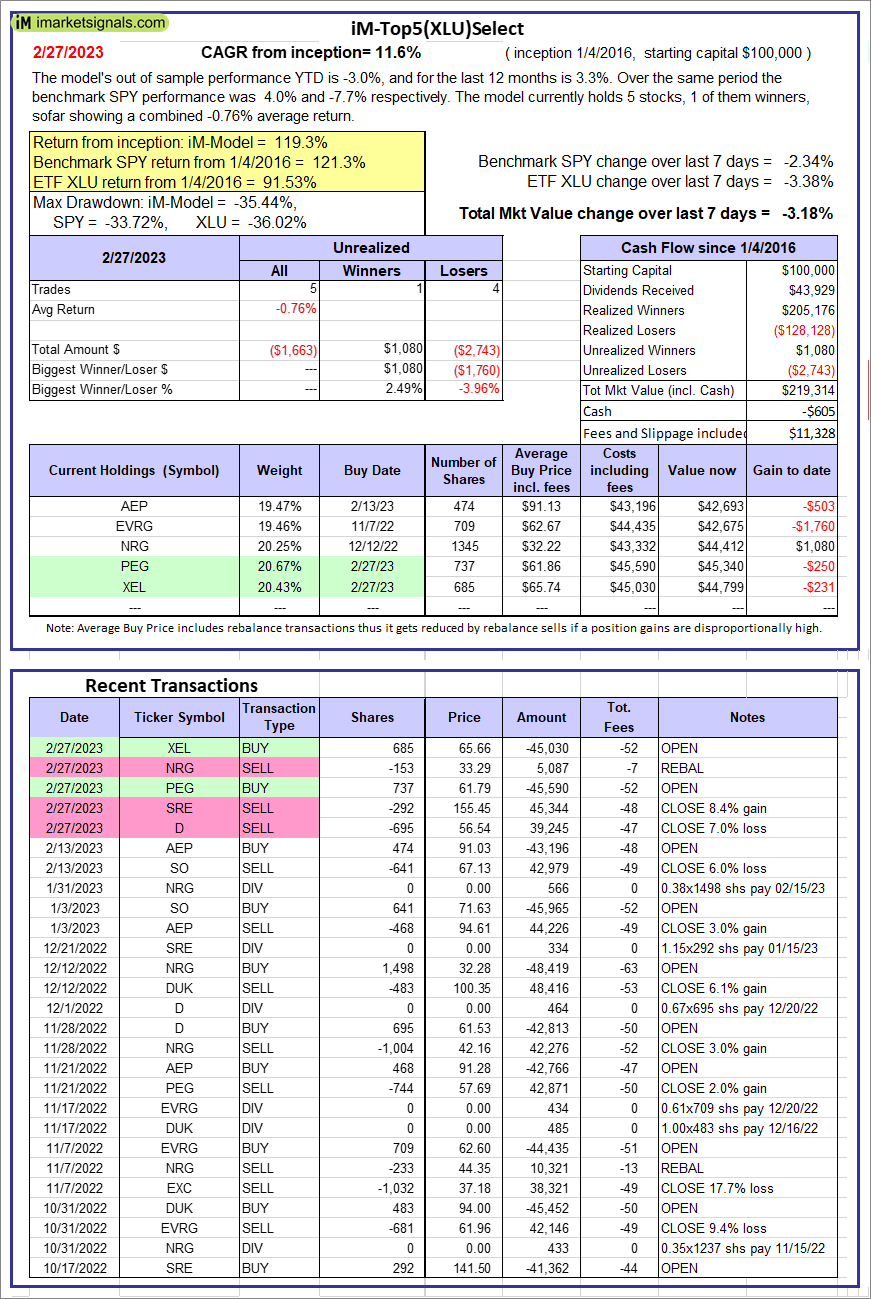 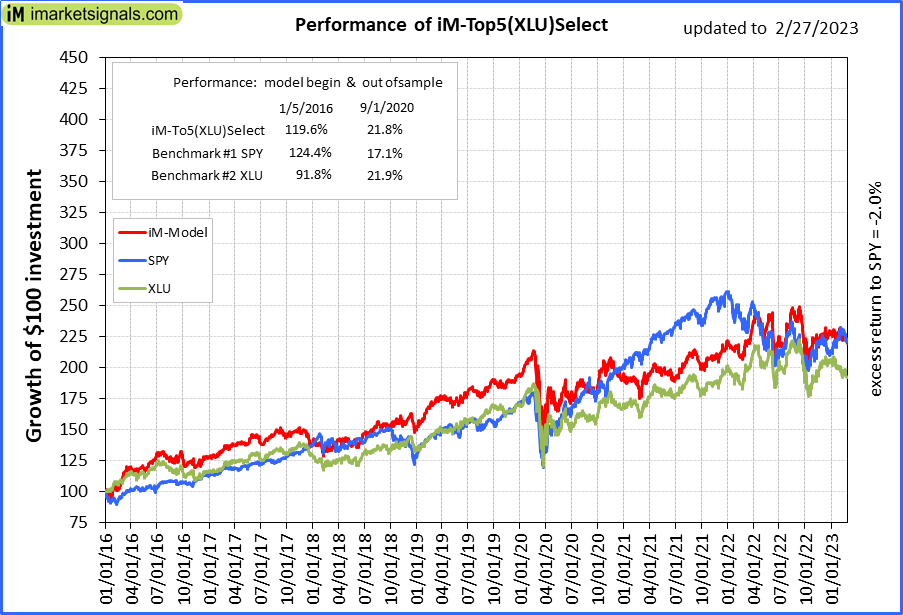 |
iM-Top5(XLU)Select: Since inception, on 1/5/2016, the model gained 119.31% while the benchmark SPY gained 121.27% over the same period. Over the previous week the market value of iM-Top5(XLU)Select gained -3.18% at a time when SPY gained -2.34%. A starting capital of $100,000 at inception on 1/5/2016 would have grown to $219,314 which includes -$605 cash and excludes $11,328 spent on fees and slippage. |
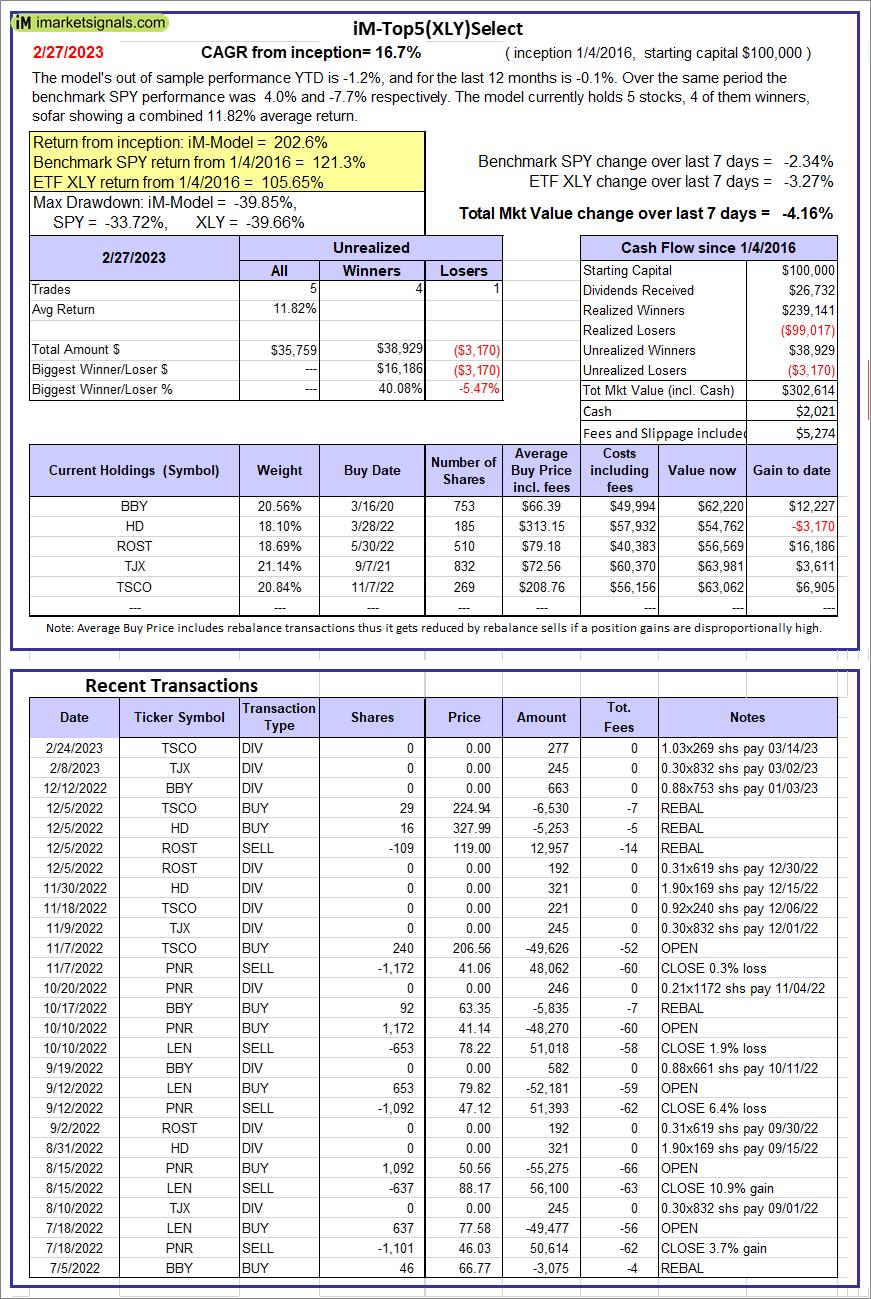 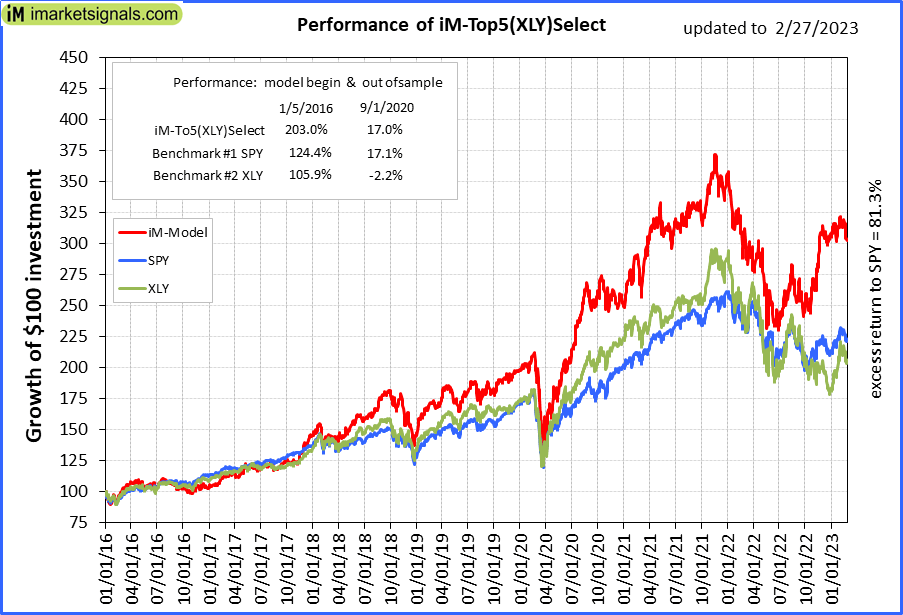 |
iM-Top5(XLY)Select: Since inception, on 1/5/2016, the model gained 202.61% while the benchmark SPY gained 121.27% over the same period. Over the previous week the market value of iM-Top5(XLY)Select gained -4.16% at a time when SPY gained -2.34%. A starting capital of $100,000 at inception on 1/5/2016 would have grown to $302,614 which includes $2,021 cash and excludes $5,274 spent on fees and slippage. |
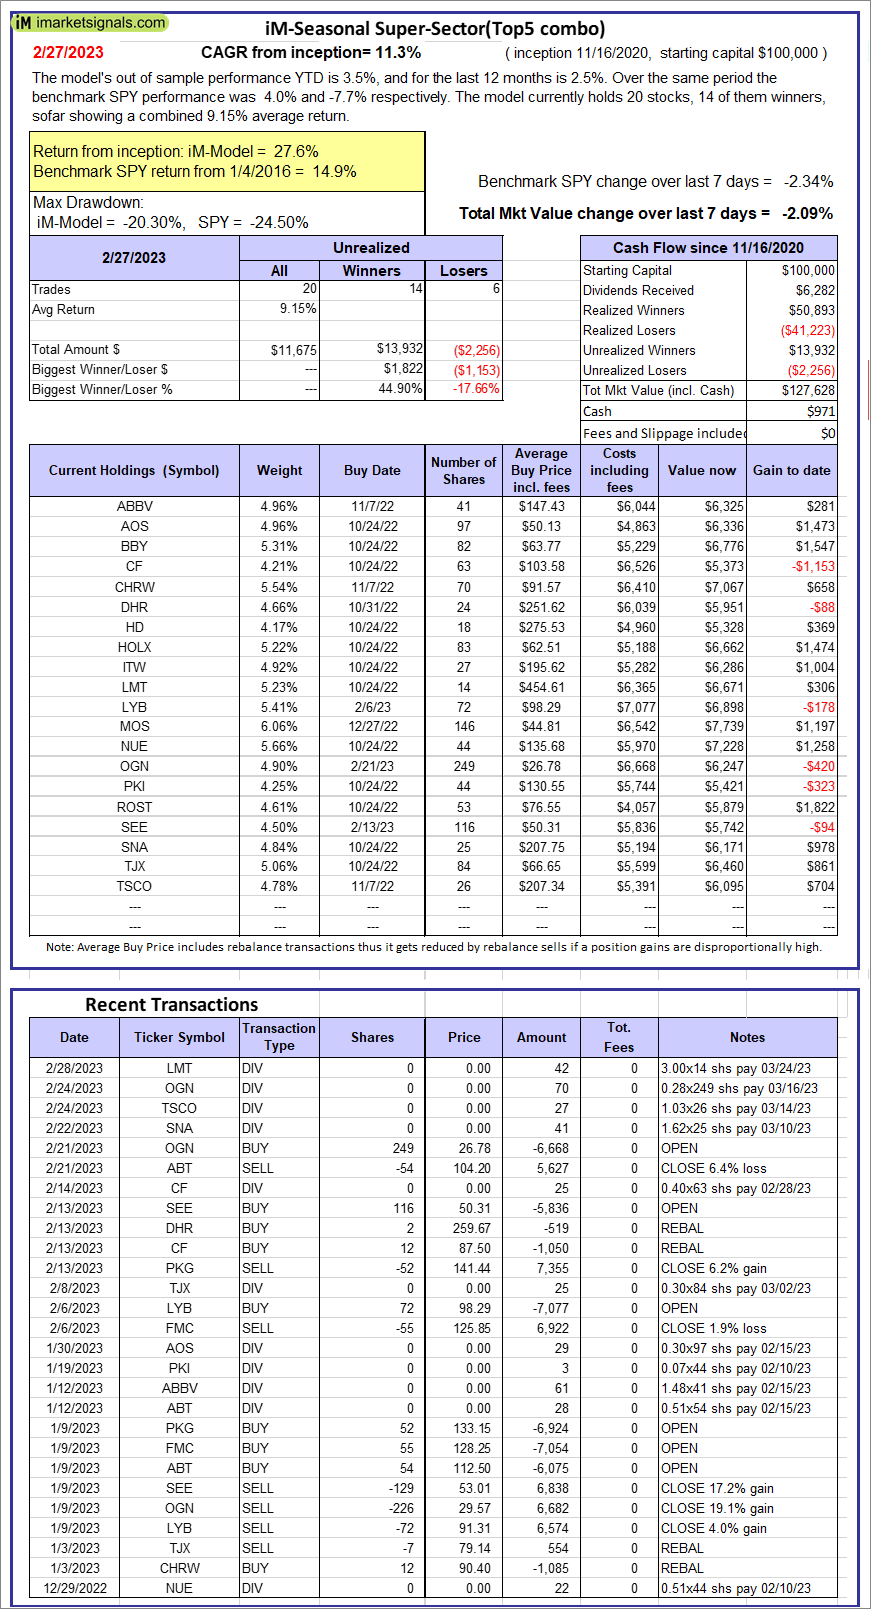 |
iM-Seasonal Super-Sectors (Top5 combo) : Since inception, on 11/17/2020, the model gained 27.63% while the benchmark SPY gained 14.86% over the same period. Over the previous week the market value of iM-Seasonal Super-Sectors (Top5 combo) gained -2.09% at a time when SPY gained -2.34%. A starting capital of $100,000 at inception on 11/17/2020 would have grown to $127,628 which includes $971 cash and excludes $00 spent on fees and slippage. |
 |
iM-Dividend Growth Portfolio: The model’s out of sample performance YTD is 7.0%, and for the last 12 months is -0.3%. Over the same period the benchmark SPY performance was 4.0% and -7.7% respectively. Over the previous week the market value of the iM-Dividend Growth Portfolio gained -4.36% at a time when SPY gained -2.34%. A starting capital of $100,000 at inception on 6/30/2016 would have grown to $388,429 which includes $1,181 cash and excludes $9,330 spent on fees and slippage. |
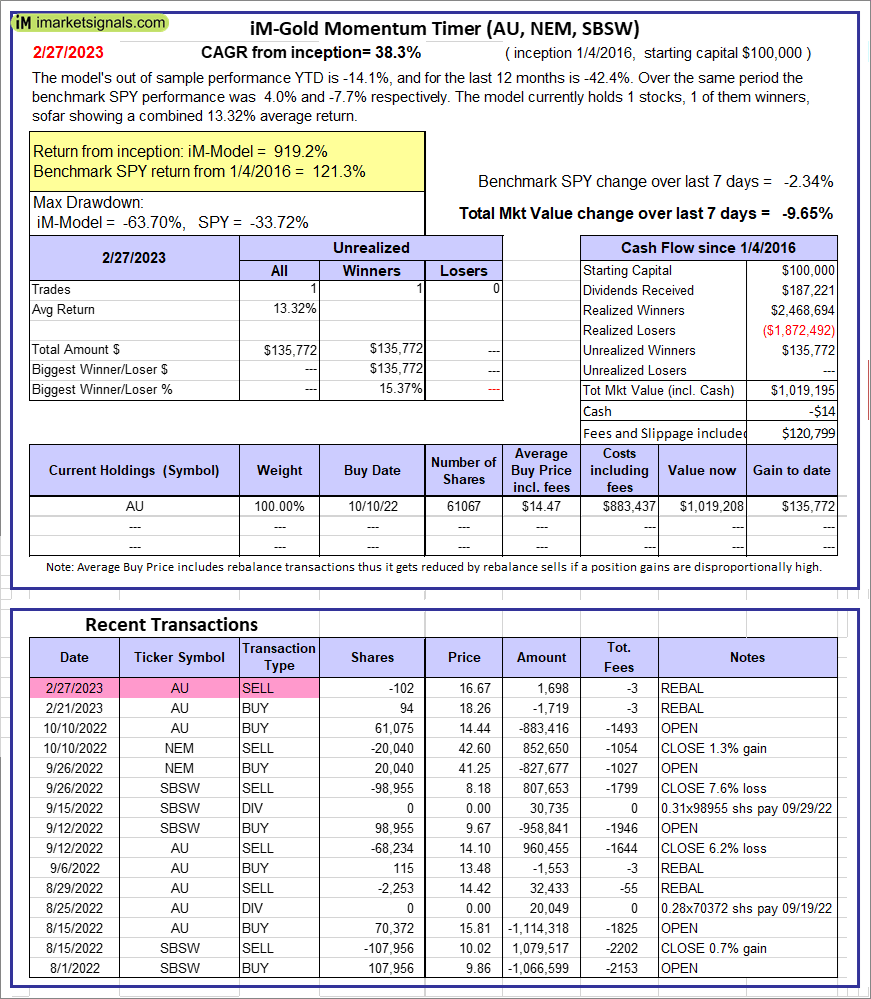 |
iM-Gold Momentum Timer (AU, NEM, SBSW): The model’s out of sample performance YTD is -14.1%, and for the last 12 months is -42.4%. Over the same period the benchmark SPY performance was 4.0% and -7.7% respectively. Over the previous week the market value of iM-Gold Momentum Timer (AU, NEM, SBSW) gained -9.65% at a time when SPY gained -2.34%. A starting capital of $100,000 at inception on 6/30/2016 would have grown to -$14 which includes $120,799 cash and excludes Gain to date spent on fees and slippage. |
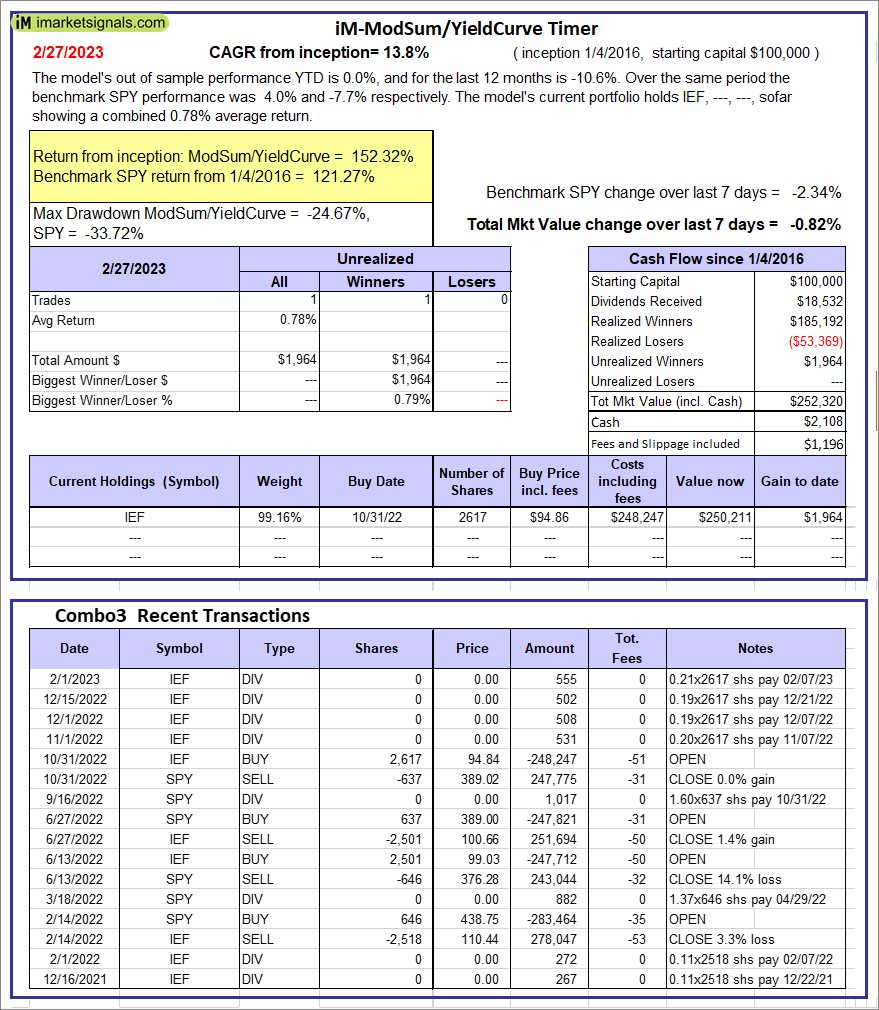 |
iM-ModSum/YieldCurve Timer: The model’s out of sample performance YTD is 0.0%, and for the last 12 months is -10.6%. Over the same period the benchmark SPY performance was 4.0% and -7.7% respectively. Over the previous week the market value of iM-PortSum/YieldCurve Timer gained -0.82% at a time when SPY gained -2.34%. A starting capital of $100,000 at inception on 1/1/2016 would have grown to $252,320 which includes $2,108 cash and excludes $1,196 spent on fees and slippage. |
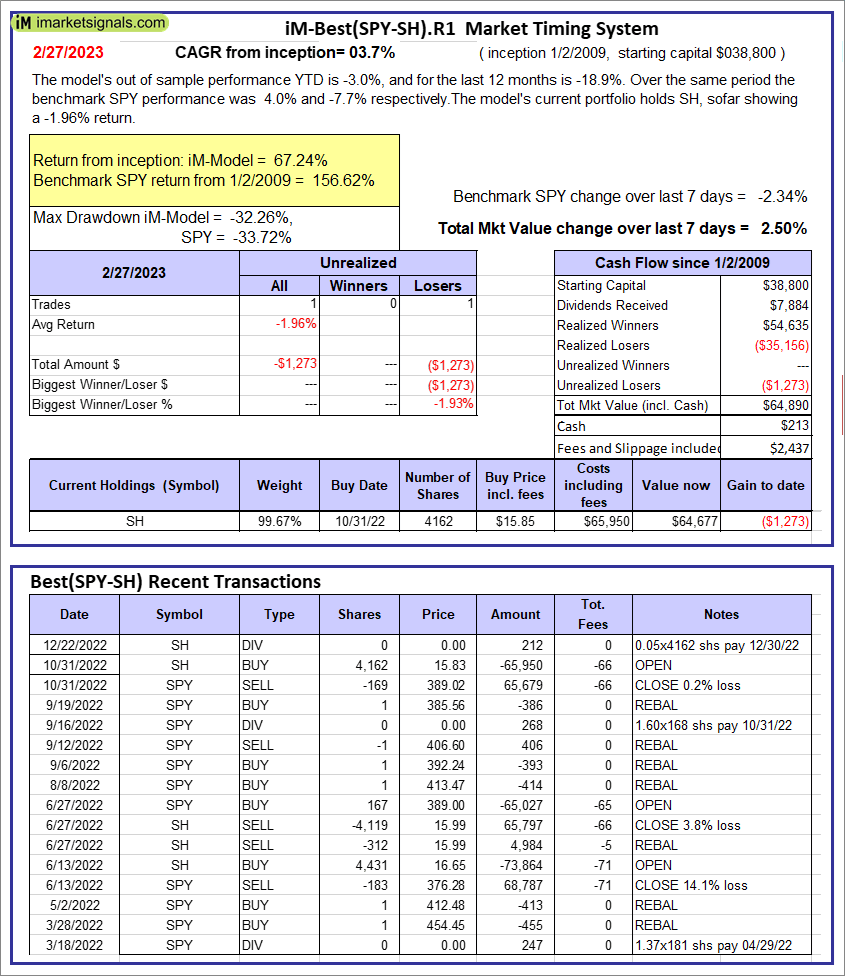 |
iM-Best(SPY-SH).R1: The model’s out of sample performance YTD is -3.0%, and for the last 12 months is -18.9%. Over the same period the benchmark SPY performance was 4.0% and -7.7% respectively. Over the previous week the market value of Best(SPY-SH) gained 2.50% at a time when SPY gained -2.34%. A starting capital of $100,000 at inception on 1/2/2009 would have grown to $64,890 which includes $213 cash and excludes $2,437 spent on fees and slippage. |
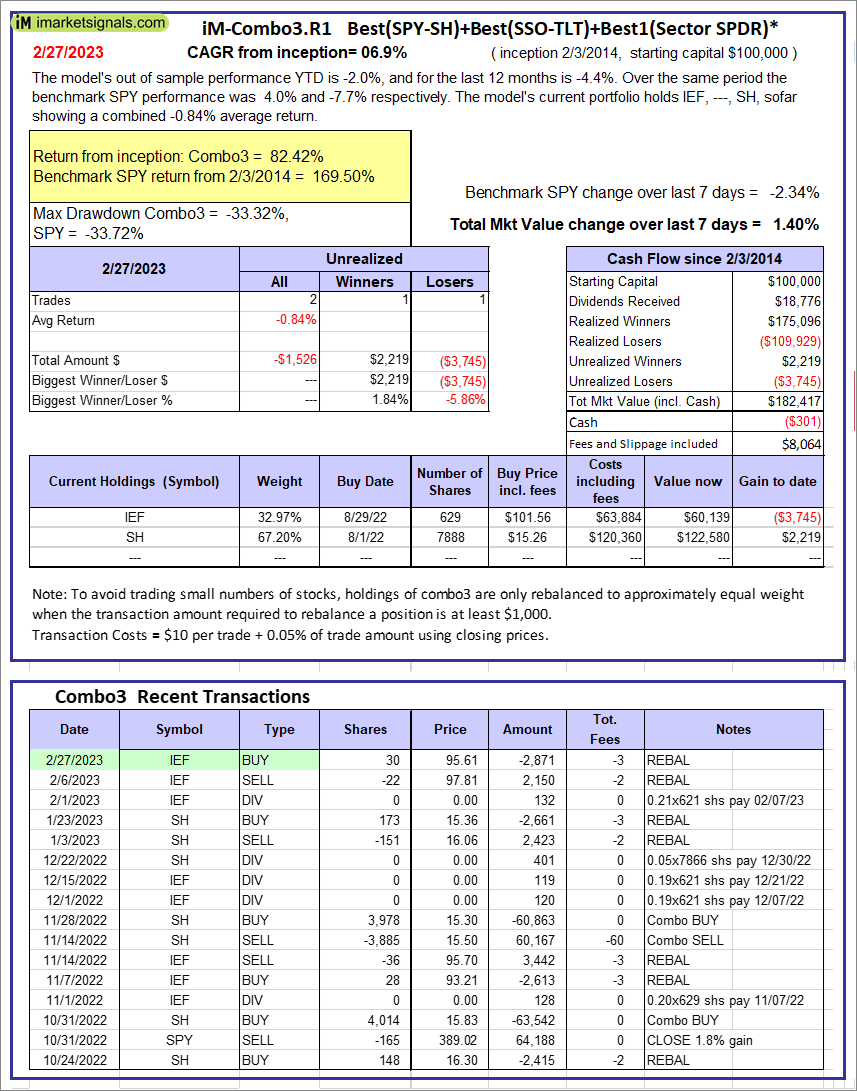 |
iM-Combo3.R1: The model’s out of sample performance YTD is -2.0%, and for the last 12 months is -4.4%. Over the same period the benchmark SPY performance was 4.0% and -7.7% respectively. Over the previous week the market value of iM-Combo3.R1 gained 1.40% at a time when SPY gained -2.34%. A starting capital of $100,000 at inception on 2/3/2014 would have grown to $182,417 which includes -$301 cash and excludes $8,064 spent on fees and slippage. |
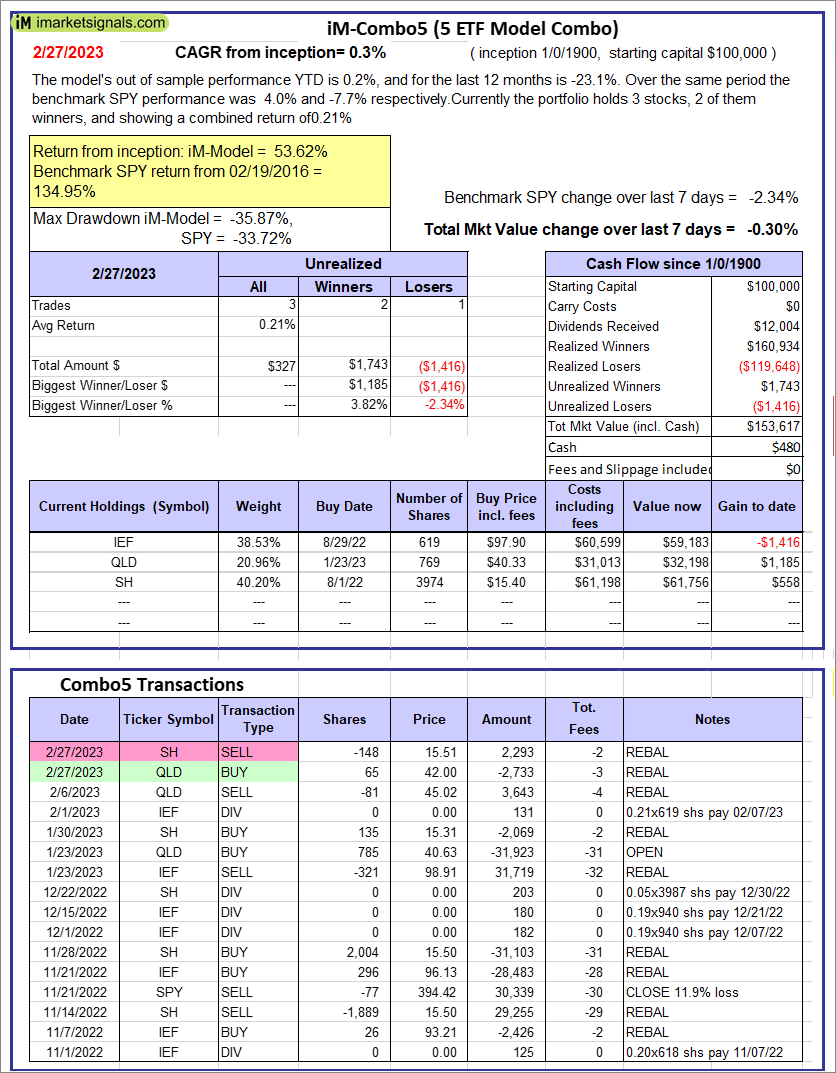 |
iM-Combo5: The model’s out of sample performance YTD is 0.2%, and for the last 12 months is -23.1%. Over the same period the benchmark SPY performance was 4.0% and -7.7% respectively. Over the previous week the market value of iM-Combo5 gained -0.30% at a time when SPY gained -2.34%. A starting capital of $100,000 at inception on 2/22/2016 would have grown to $153,617 which includes $480 cash and excludes $0 spent on fees and slippage. |
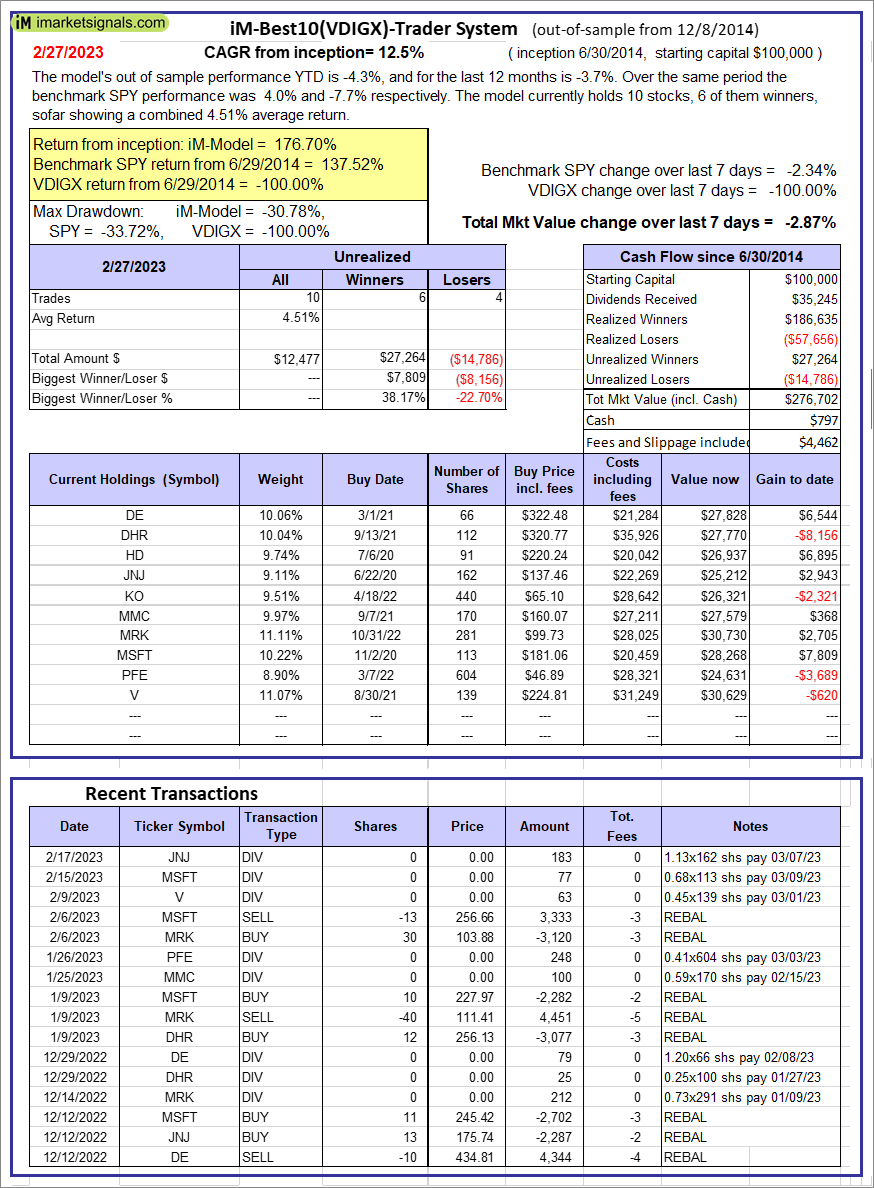 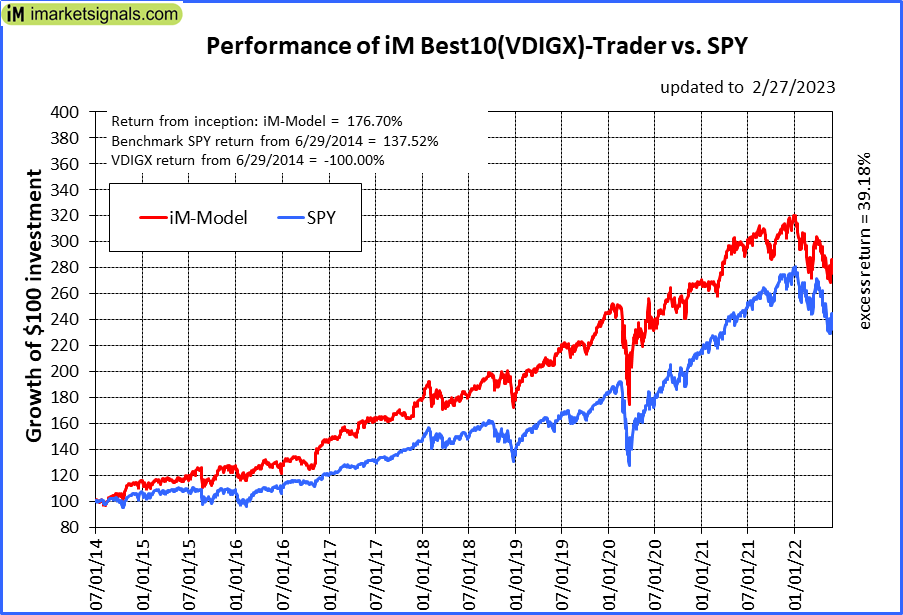 |
iM-Best10(VDIGX)-Trader: The model’s out of sample performance YTD is -4.3%, and for the last 12 months is -3.7%. Over the same period the benchmark SPY performance was 4.0% and -7.7% respectively. Since inception, on 7/1/2014, the model gained 176.70% while the benchmark SPY gained 137.52% and VDIGX gained -100.00% over the same period. Over the previous week the market value of iM-Best10(VDIGX) gained -2.87% at a time when SPY gained -2.34%. A starting capital of $100,000 at inception on 7/1/2014 would have grown to $276,702 which includes $797 cash and excludes $4,462 spent on fees and slippage. |
 |
iM 6-Stock Capital Strength Portfolio: The model’s out of sample performance YTD is 3.5%, and for the last 12 months is 2.1%. Over the same period the benchmark SPY performance was 4.0% and -7.7% respectively. Over the previous week the market value of the iM 6-Stock Capital Strength Portfolio gained -3.07% at a time when SPY gained -2.34%. A starting capital of $100,000 at inception on 10/28/2016 would have grown to $223,723 which includes $1,341 cash and excludes $2,675 spent on fees and slippage. |
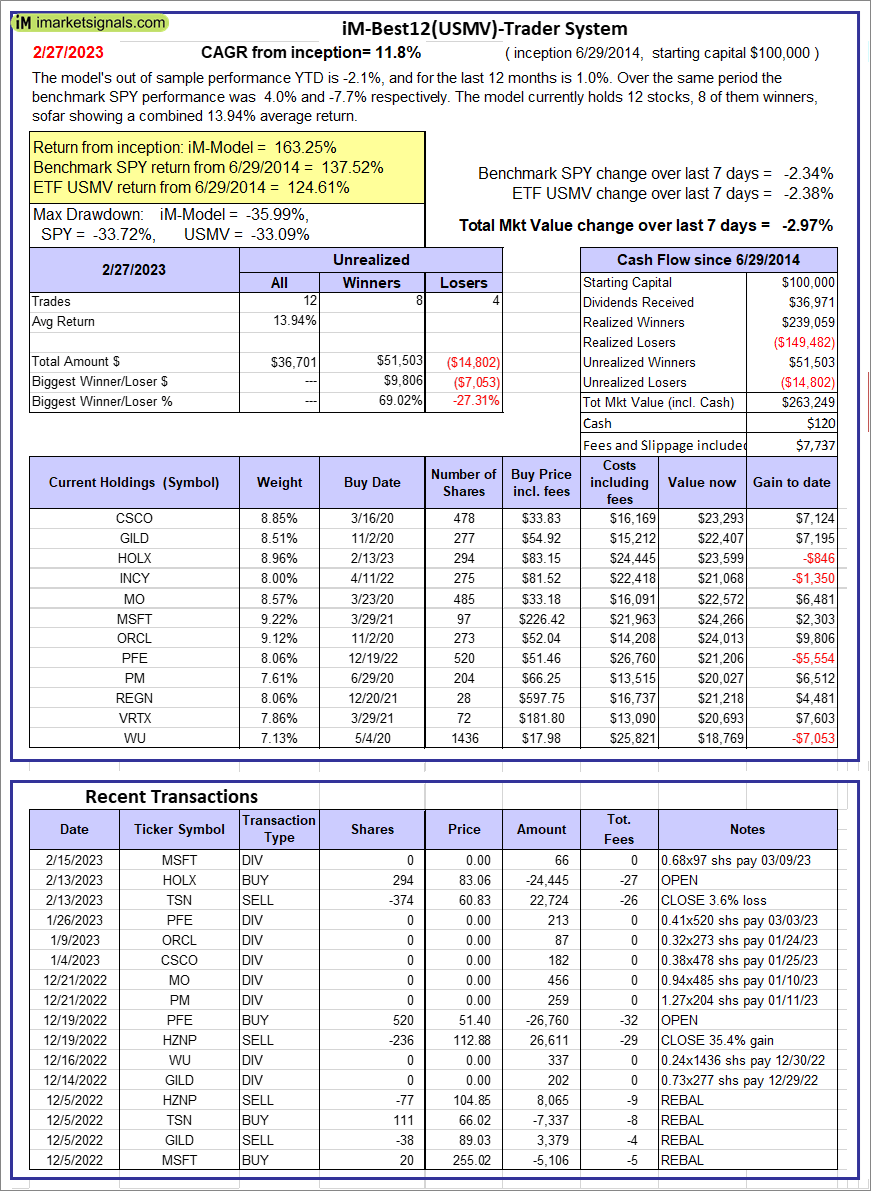 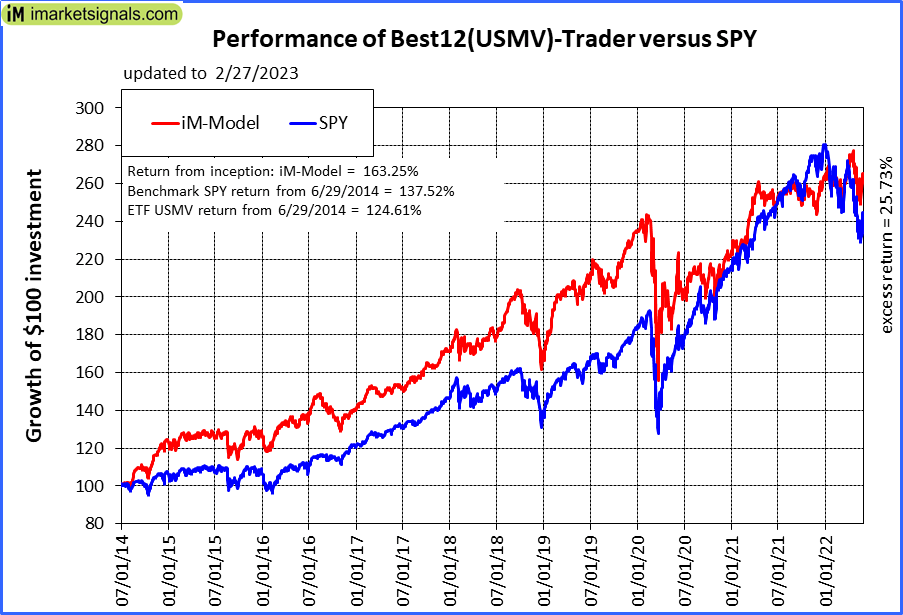 |
iM-Best12(USMV)-Trader: The model’s out of sample performance YTD is -2.1%, and for the last 12 months is 1.0%. Over the same period the benchmark SPY performance was 4.0% and -7.7% respectively. Since inception, on 6/30/2014, the model gained 163.25% while the benchmark SPY gained 137.52% and the ETF USMV gained 124.61% over the same period. Over the previous week the market value of iM-Best12(USMV)-Trader gained -2.97% at a time when SPY gained -2.34%. A starting capital of $100,000 at inception on 6/30/2014 would have grown to $263,249 which includes $120 cash and excludes $7,737 spent on fees and slippage. |
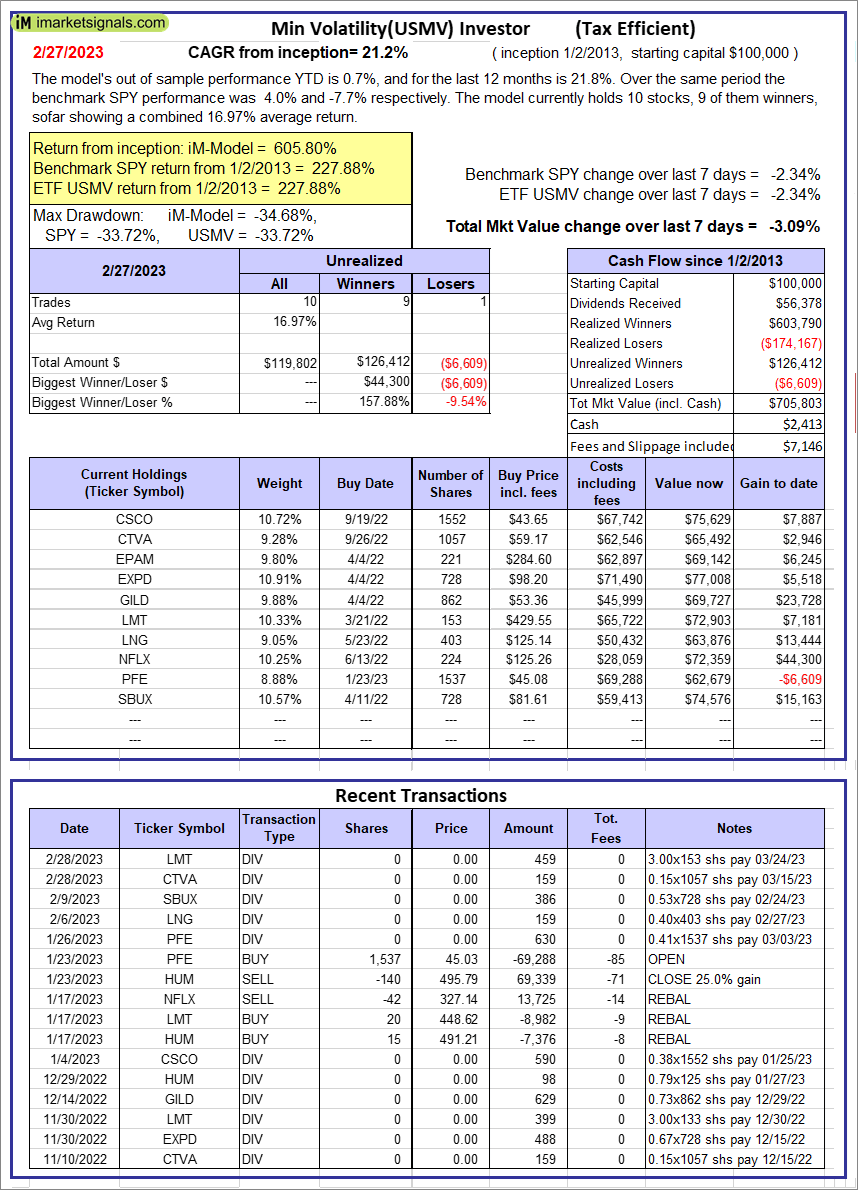 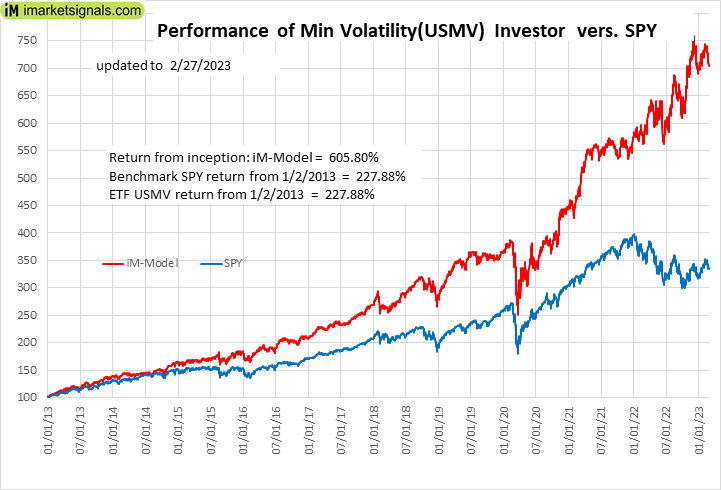 |
iM-Min Volatility(USMV) Investor (Tax Efficient): The model’s out of sample performance YTD is 0.7%, and for the last 12 months is 21.8%. Over the same period the benchmark SPY performance was 4.0% and -7.7% respectively. Since inception, on 1/3/2013, the model gained 605.80% while the benchmark SPY gained 227.88% and the ETF USMV gained 227.88% over the same period. Over the previous week the market value of iM-Best12(USMV)Q1 gained -3.09% at a time when SPY gained -2.34%. A starting capital of $100,000 at inception on 1/3/2013 would have grown to $705,803 which includes $2,413 cash and excludes $7,146 spent on fees and slippage. |
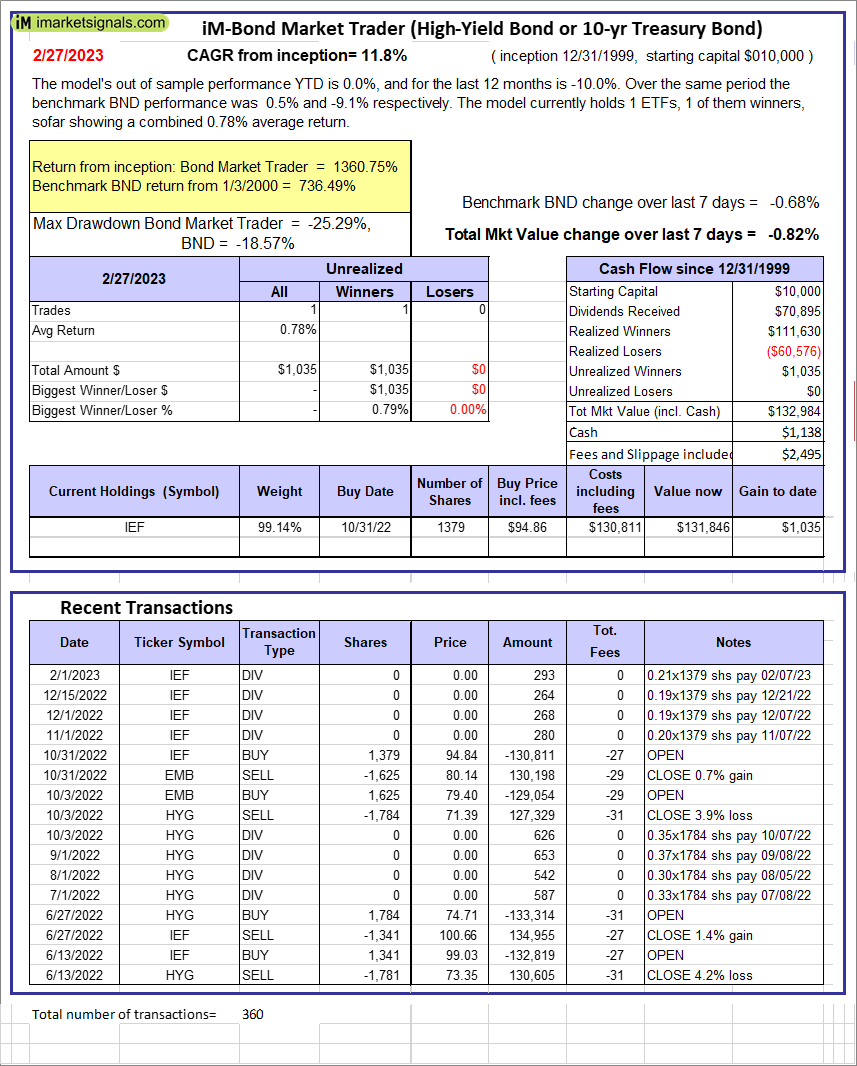 |
iM-Bond Market Trader (High-Yield Bond or 10-yr Treasury Bond): The model’s out of sample performance YTD is 0.0%, and for the last 12 months is -10.0%. Over the same period the benchmark BND performance was 0.5% and -9.1% respectively. Over the previous week the market value of the iM-Bond Market Trader (High-Yield Bond or 10-yr Treasury Bond) gained -0.82% at a time when BND gained -0.68%. A starting capital of $10,000 at inception on 1/3/2000 would have grown to $132,984 which includes $1,138 cash and excludes $2,495 spent on fees and slippage. |
|
|
iM-ModSum/YieldCurve Timer: The model’s out of sample performance YTD is 0.0%, and for the last 12 months is -10.6%. Over the same period the benchmark SPY performance was 4.0% and -7.7% respectively. Over the previous week the market value of iM-PortSum/YieldCurve Timer gained -0.82% at a time when SPY gained -2.34%. A starting capital of $100,000 at inception on 1/1/2016 would have grown to $252,320 which includes $2,108 cash and excludes $1,196 spent on fees and slippage. |
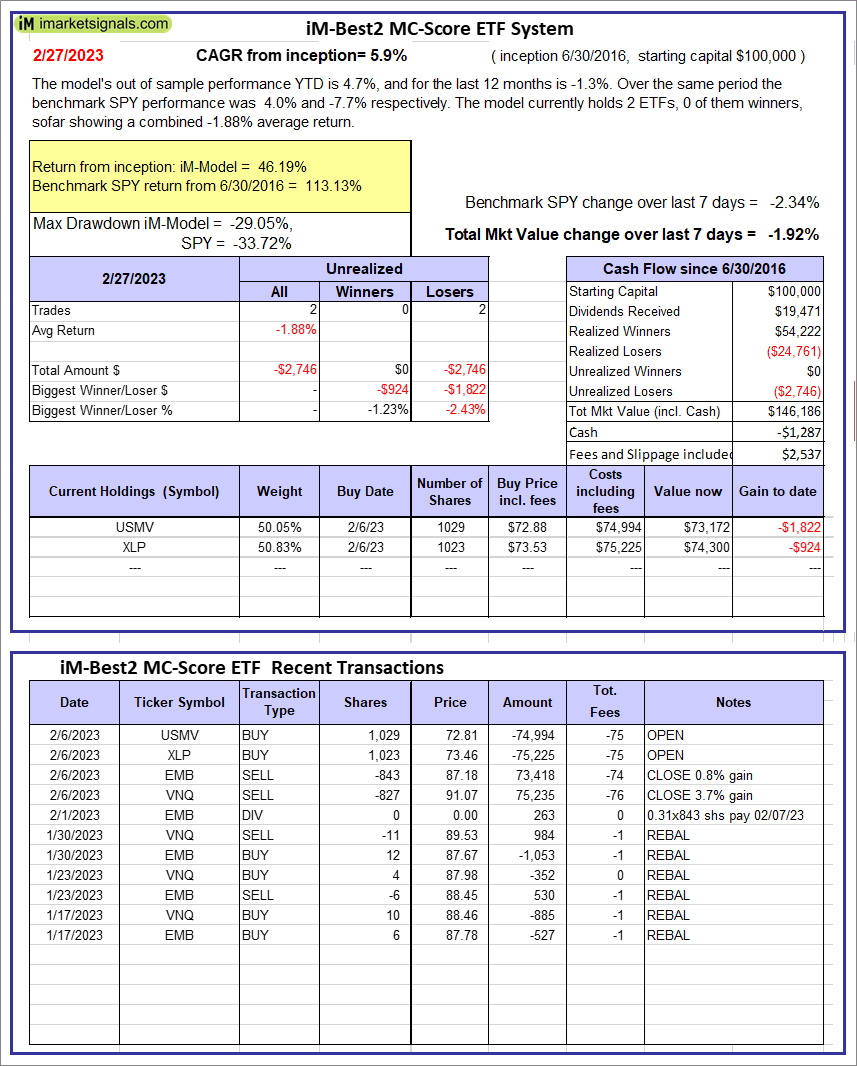 |
iM-Best2 MC-Score ETF System: The model’s out of sample performance YTD is 4.7%, and for the last 12 months is -1.3%. Over the same period the benchmark SPY performance was 4.0% and -7.7% respectively. Over the previous week the market value of the iM-Best2 MC-Score ETF System gained -1.92% at a time when SPY gained -2.34%. A starting capital of $100,000 at inception on 6/30/2016 would have grown to $146,186 which includes -$1,287 cash and excludes $2,537 spent on fees and slippage. |
 |
iM-Best4 MC-Score Vanguard System: The model’s out of sample performance YTD is 1.6%, and for the last 12 months is -4.7%. Over the same period the benchmark SPY performance was 4.0% and -7.7% respectively. Over the previous week the market value of the iM-Best4 MC-Score Vanguard System gained -1.01% at a time when SPY gained -2.34%. A starting capital of $100,000 at inception on 6/30/2016 would have grown to $152,363 which includes $342 cash and excludes $00 spent on fees and slippage. |
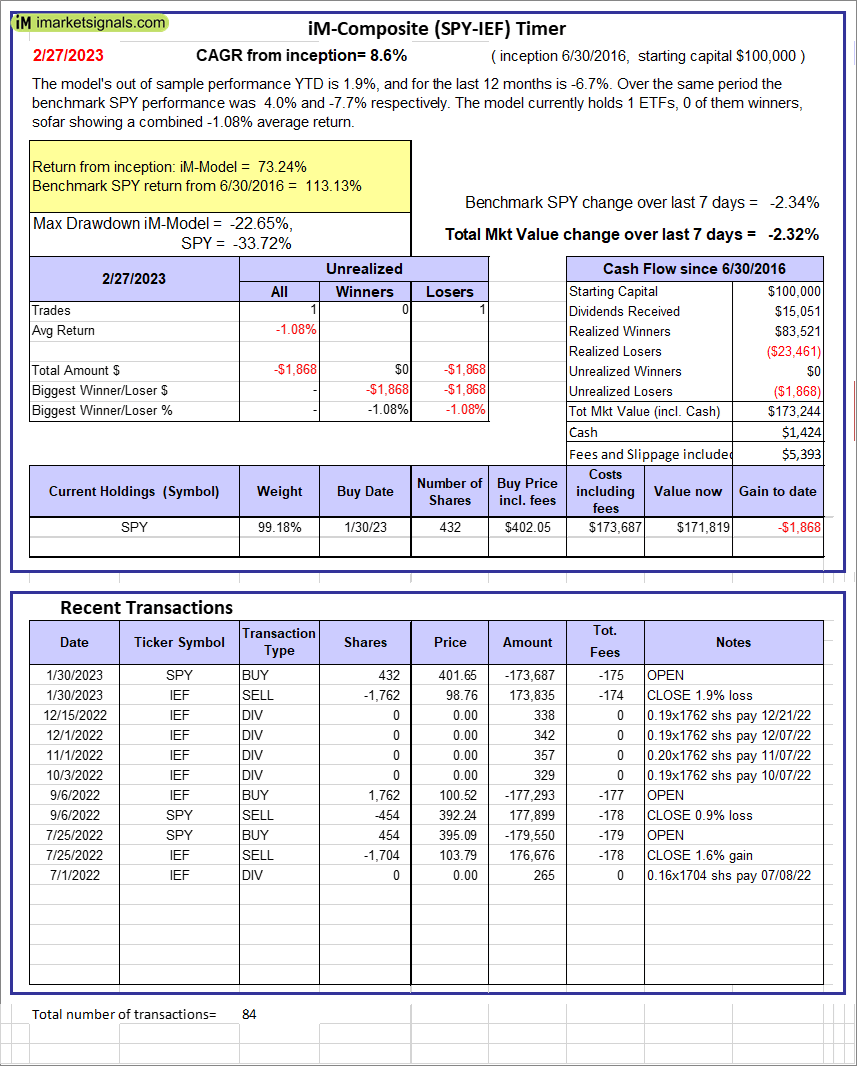 |
iM-Composite (SPY-IEF) Timer: The model’s out of sample performance YTD is 1.9%, and for the last 12 months is -6.7%. Over the same period the benchmark SPY performance was 4.0% and -7.7% respectively. Over the previous week the market value of the iM-Composite (SPY-IEF) Timer gained -2.32% at a time when SPY gained -2.34%. A starting capital of $100,000 at inception on 6/30/2016 would have grown to $173,244 which includes $1,424 cash and excludes $5,393 spent on fees and slippage. |
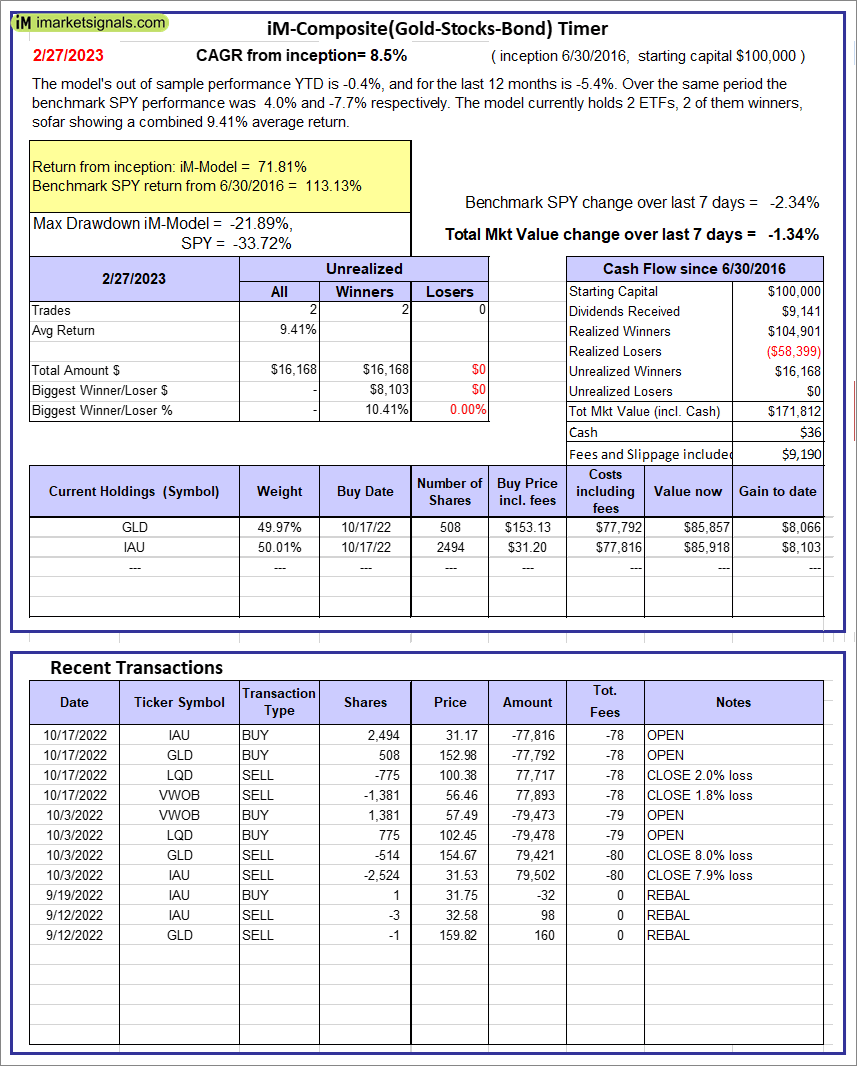 |
iM-Composite(Gold-Stocks-Bond) Timer: The model’s out of sample performance YTD is -0.4%, and for the last 12 months is -5.4%. Over the same period the benchmark SPY performance was 4.0% and -7.7% respectively. Over the previous week the market value of the iM-Composite(Gold-Stocks-Bond) Timer gained -1.34% at a time when SPY gained -2.34%. A starting capital of $100,000 at inception on 6/30/2016 would have grown to $171,812 which includes $36 cash and excludes $9,190 spent on fees and slippage. |
iM-Best Reports – 2/27/2023
Posted in pmp SPY-SH
Leave a Reply
You must be logged in to post a comment.