
  |
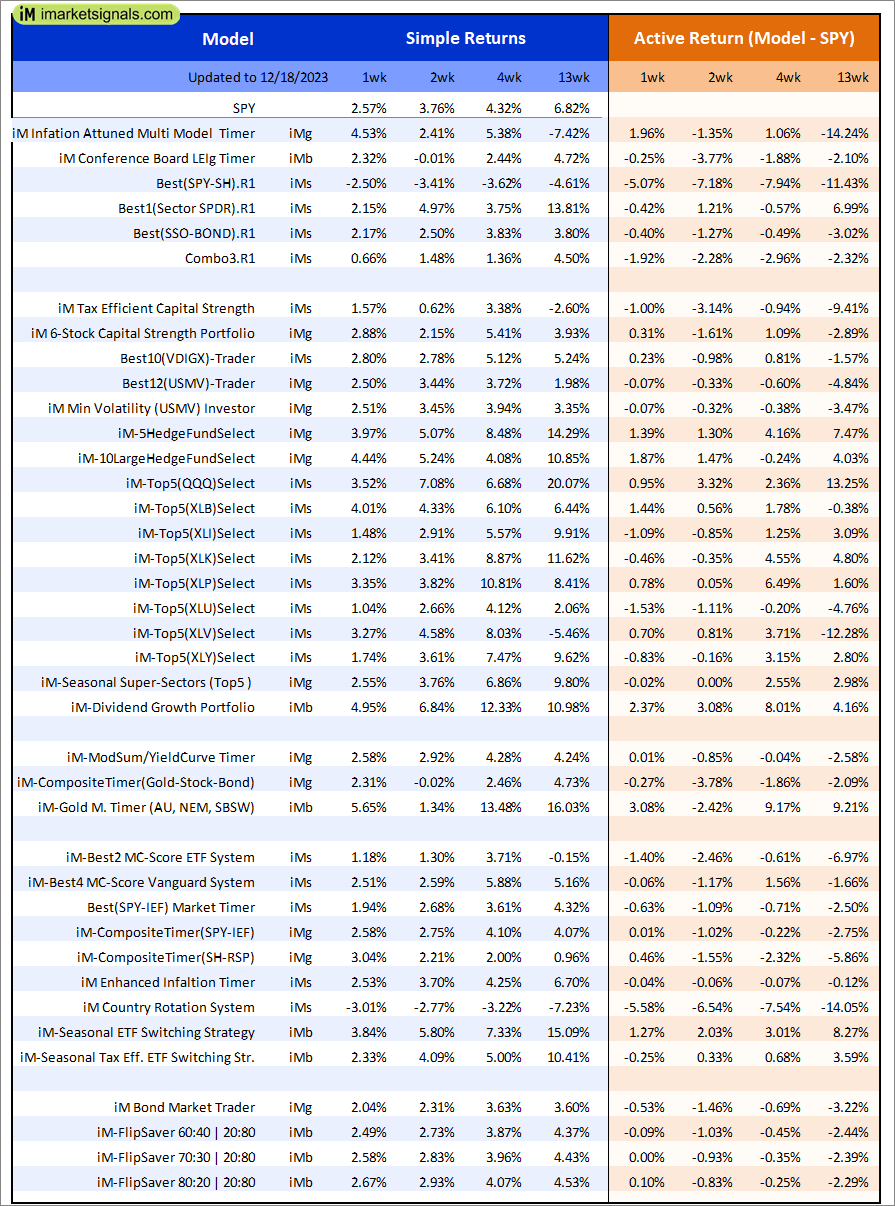
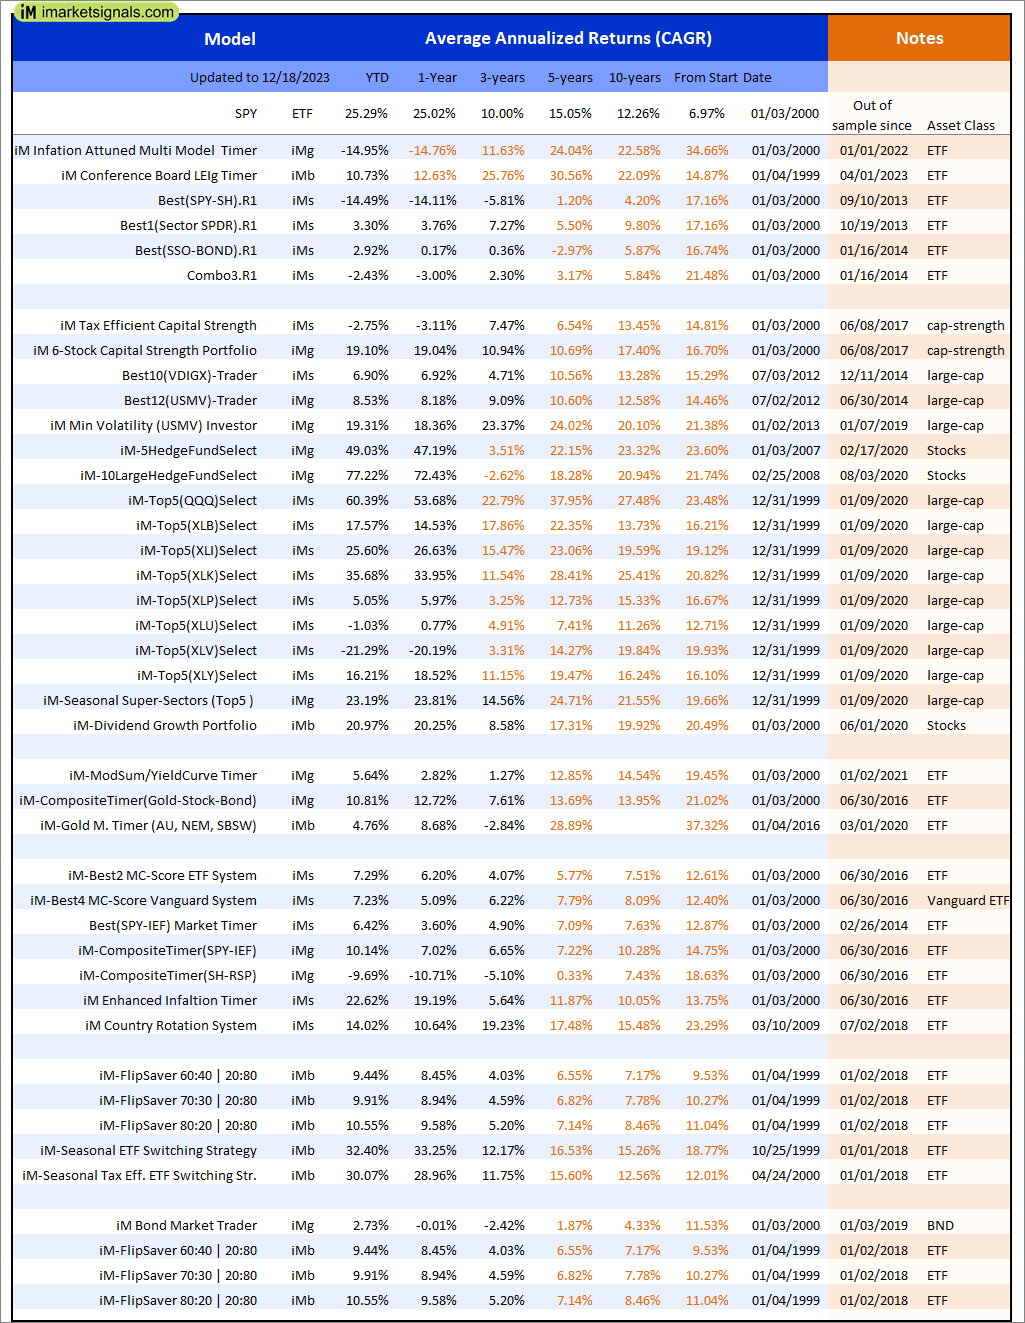
Out of sample performance summary of our models for the past 1, 2, 4 and 13 week periods. The active active return indicates how the models over- or underperformed the benchmark ETF SPY. Also the YTD, and the 1-, 3-, 5- and 10-year annualized returns are shown in the second table |
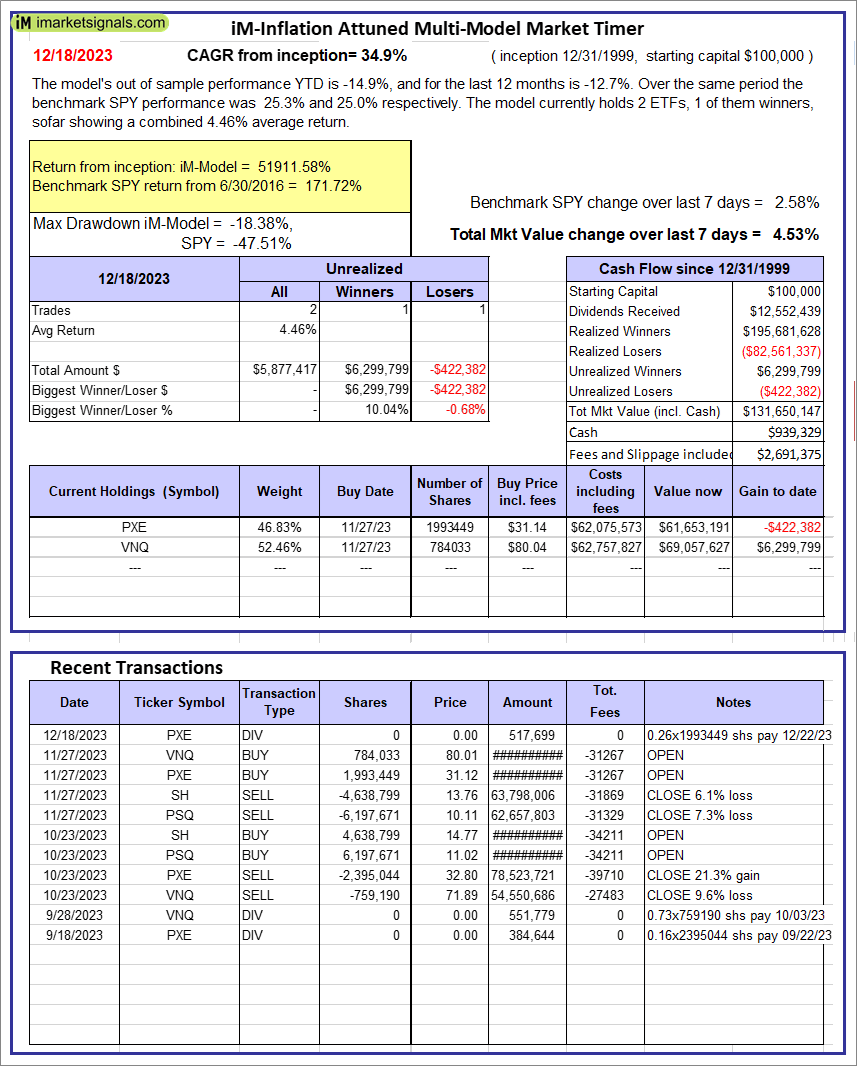 |
iM-Inflation Attuned Multi-Model Market Timer: The model’s out of sample performance YTD is -14.9%, and for the last 12 months is -12.7%. Over the same period the benchmark SPY performance was 25.3% and 25.0% respectively. Over the previous week the market value of the iM-Inflation Attuned Multi-Model Market Timer gained 4.53% at a time when SPY gained 2.58%. A starting capital of $100,000 at inception on 3/24/2017 would have grown to $131,650,147 which includes $939,329 cash and excludes $2,691,375 spent on fees and slippage. |
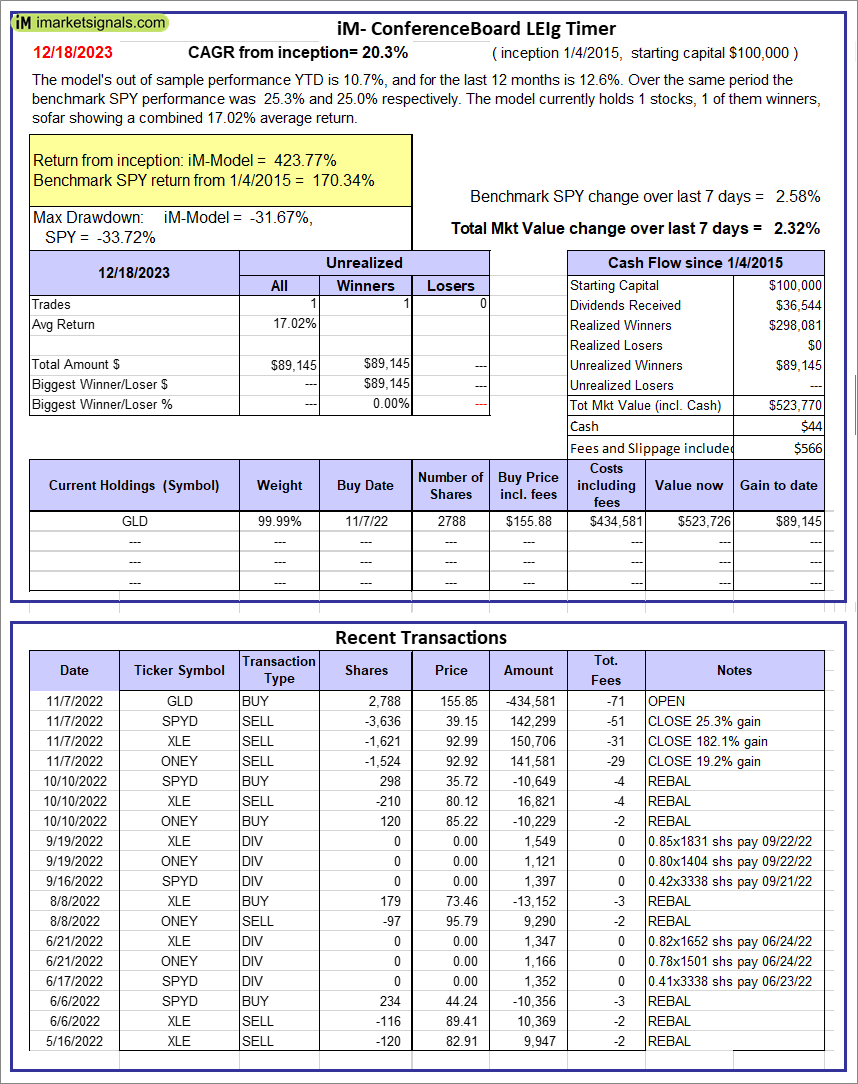 |
iM-Conference Board LEIg Timer: The model’s performance YTD is 14.3%, and for the last 12 months is 7.3%. Over the same period the benchmark SPY performance was 20.1% and 9.4% respectively. Over the previous week the market value of the iM-Conference Board LEIg Timer gained 2.32% at a time when SPY gained 2.58%. A starting capital of $100,000 at inception on 4/5/2017 would have grown to $523,770 which includes $44 cash and excludes $566 spent on fees and slippage. |
 |
iM-FlipSaver 60:40 | 20:80 – 2017: The model’s out of sample performance YTD is 9.3%, and for the last 12 months is 8.0%. Over the same period the benchmark E60B40 performance was 17.0% and 15.8% respectively. Over the previous week the market value of iM-FlipSaver 80:20 | 20:80 gained 2.48% at a time when SPY gained 2.33%. A starting capital of $100,000 at inception on 7/16/2015 would have grown to $154,058 which includes $121 cash and excludes $3,553 spent on fees and slippage. |
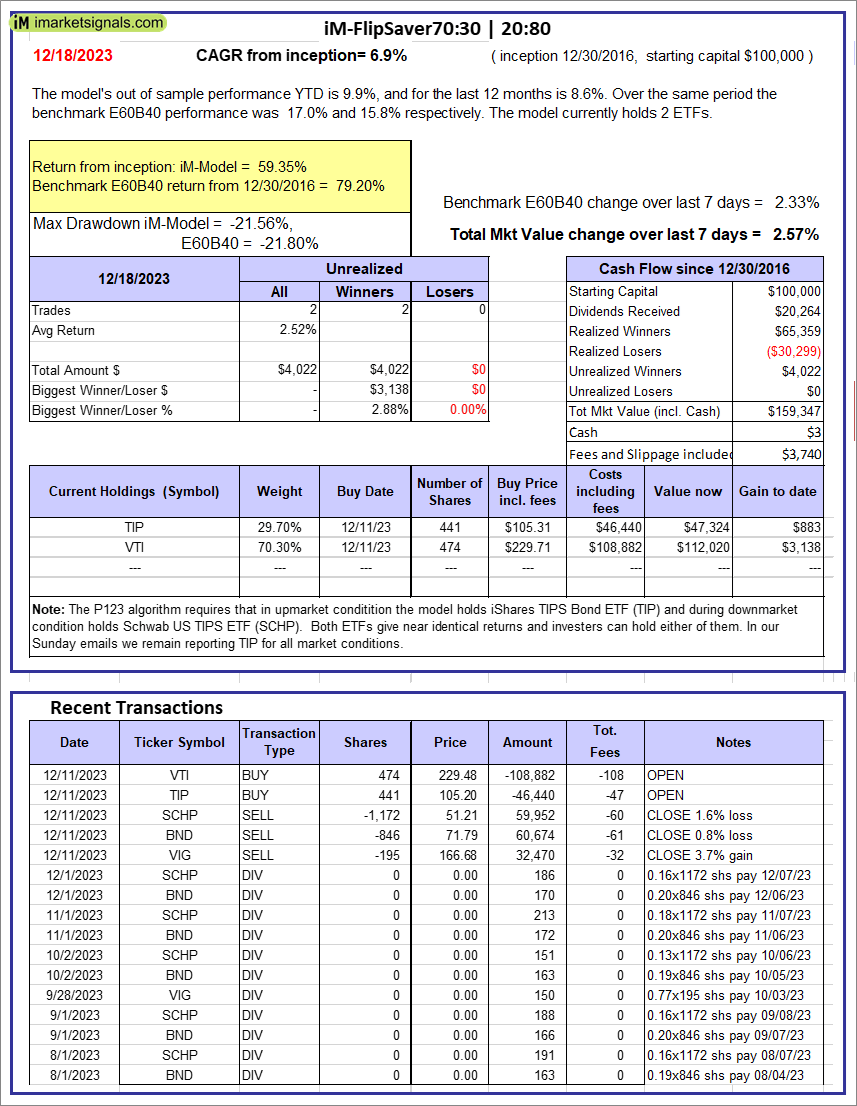 |
iM-FlipSaver 70:30 | 20:80 – 2017: The model’s out of sample performance YTD is 9.9%, and for the last 12 months is 8.6%. Over the same period the benchmark E60B40 performance was 17.0% and 15.8% respectively. Over the previous week the market value of iM-FlipSaver 70:30 | 20:80 gained 2.57% at a time when SPY gained 2.33%. A starting capital of $100,000 at inception on 7/15/2015 would have grown to $159,347 which includes $3 cash and excludes $3,740 spent on fees and slippage. |
 |
iM-FlipSaver 80:20 | 20:80 – 2017: The model’s out of sample performance YTD is 10.5%, and for the last 12 months is 9.2%. Over the same period the benchmark E60B40 performance was 17.0% and 15.8% respectively. Over the previous week the market value of iM-FlipSaver 80:20 | 20:80 gained 2.67% at a time when SPY gained 2.33%. A starting capital of $100,000 at inception on 1/2/2017 would have grown to $164,511 which includes -$112 cash and excludes $3,918 spent on fees and slippage. |
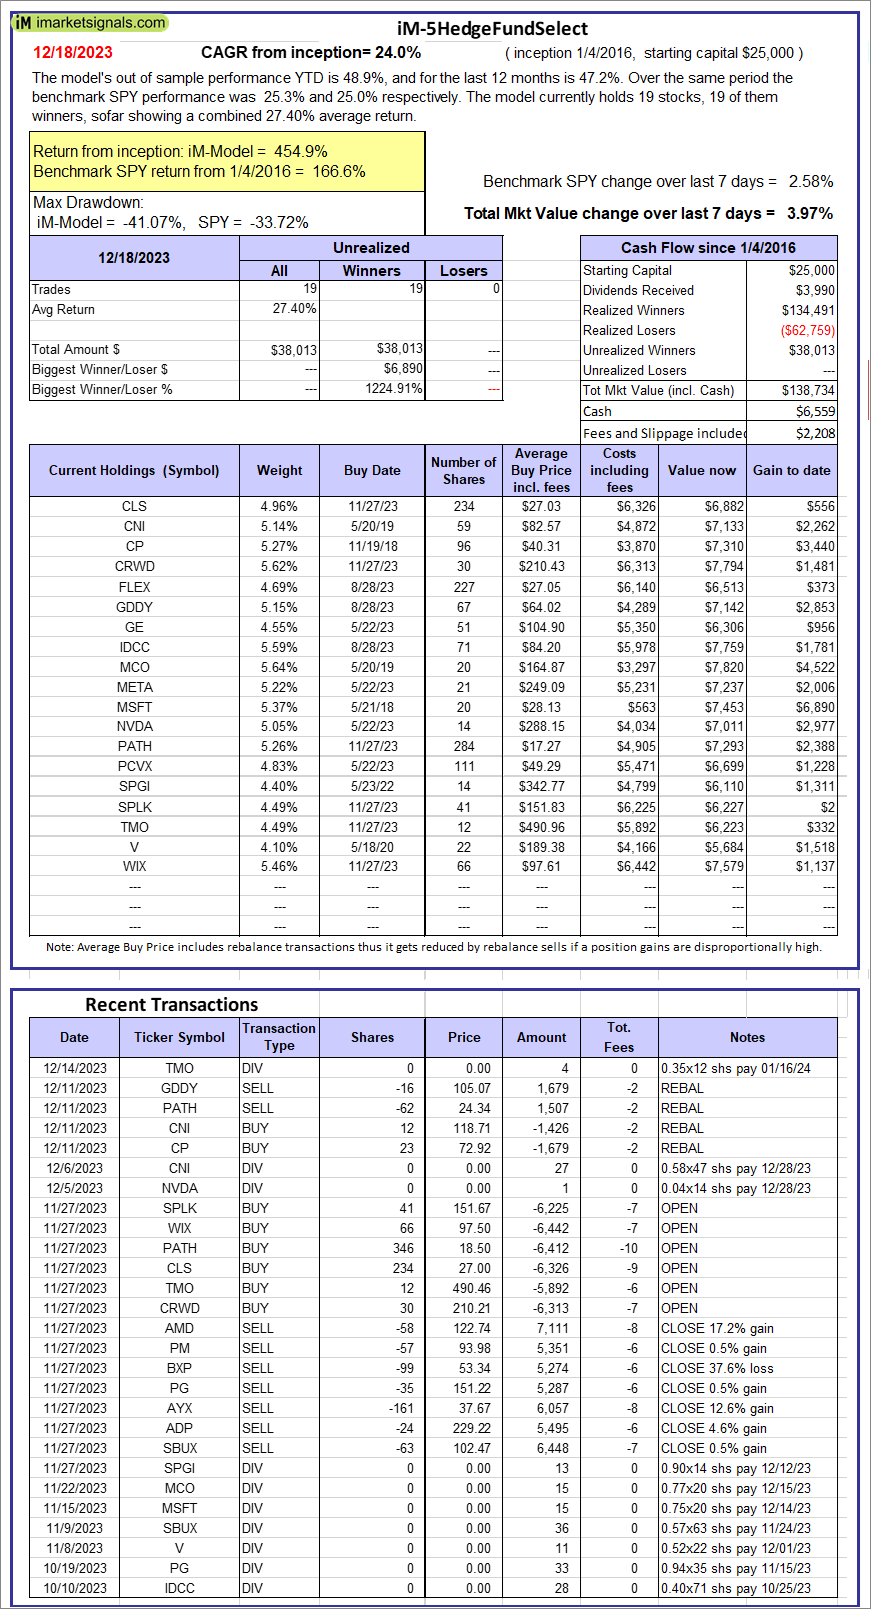 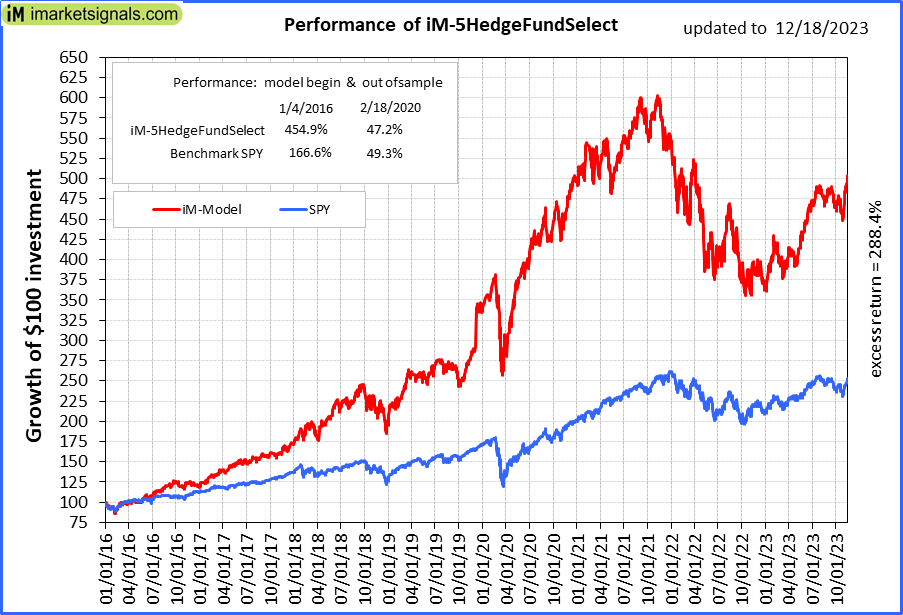 |
iM-5HedgeFundSelect: Since inception, on 1/5/2016, the model gained 454.94% while the benchmark SPY gained 166.56% over the same period. Over the previous week the market value of iM-5HedgeFundSelect gained 3.97% at a time when SPY gained 2.58%. A starting capital of $25,000 at inception on 1/5/2016 would have grown to $138,734 which includes $6,559 cash and excludes $2,208 spent on fees and slippage. |
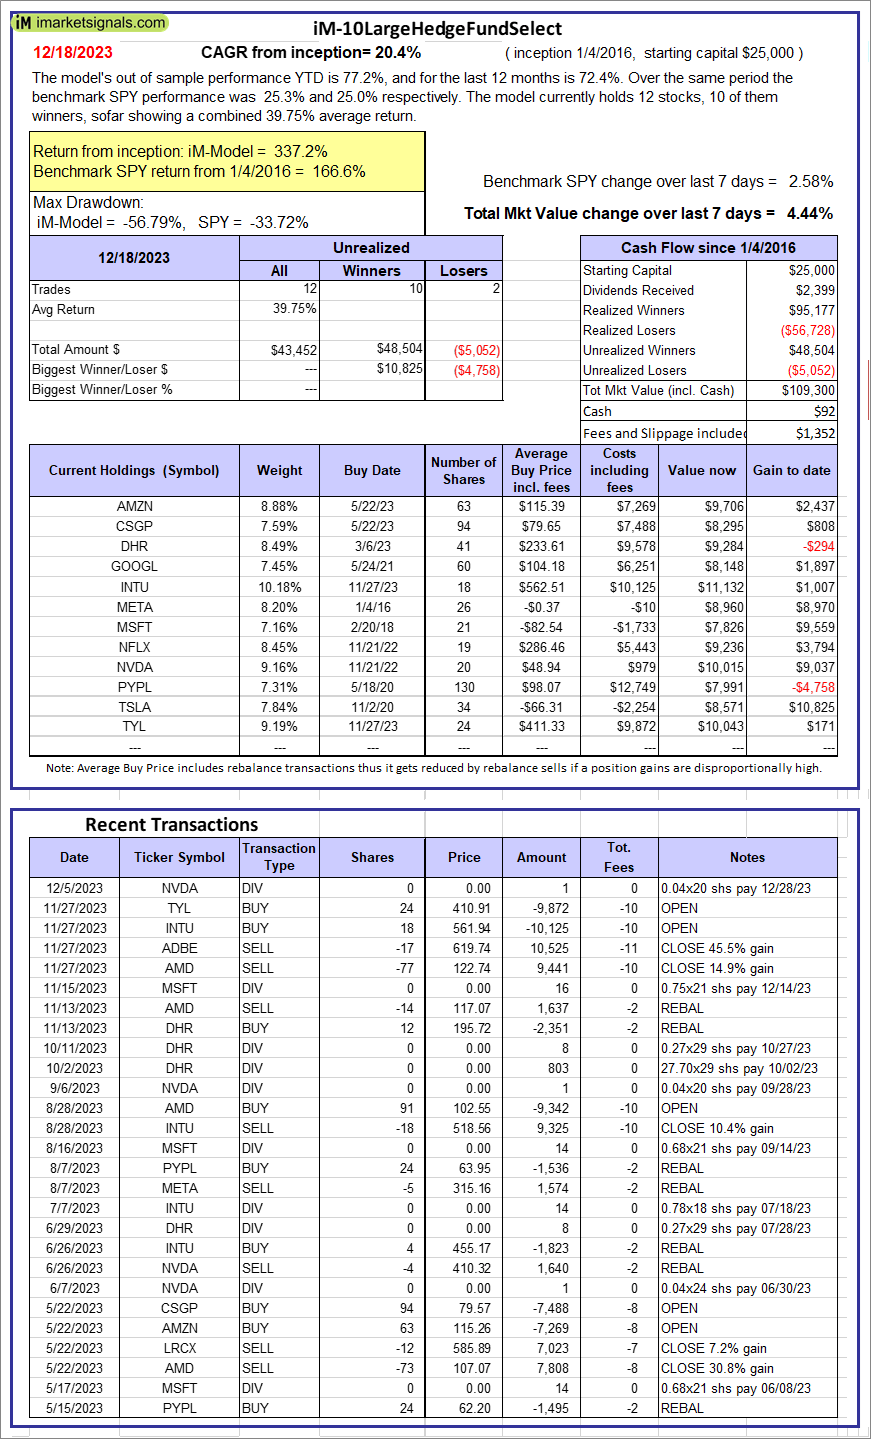 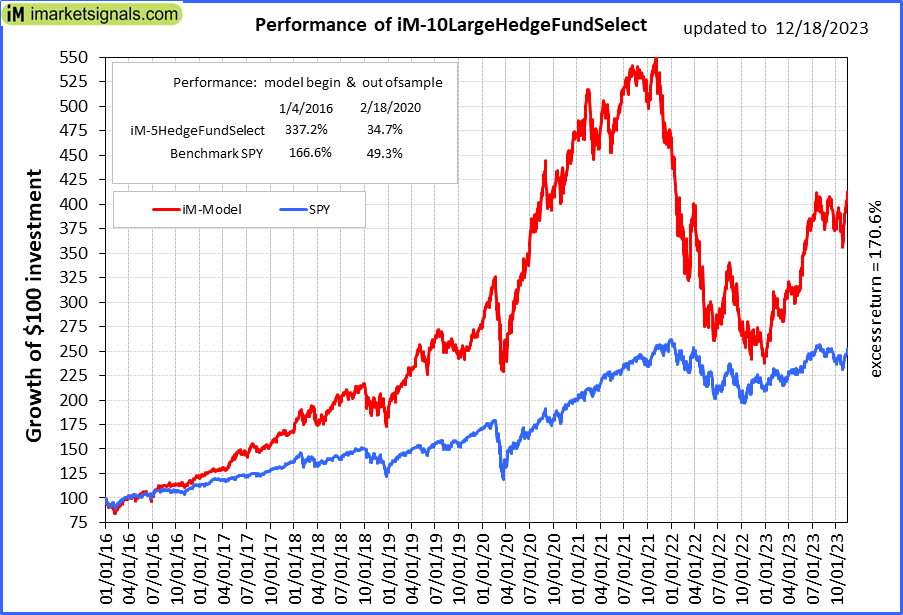 |
iM-10LargeHedgeFundSelect: Since inception, on 1/5/2016, the model gained 337.20% while the benchmark SPY gained 166.56% over the same period. Over the previous week the market value of iM-10LargeHedgeFundSelect gained 4.44% at a time when SPY gained 2.58%. A starting capital of $25,000 at inception on 1/5/2016 would have grown to $109,300 which includes $92 cash and excludes $1,352 spent on fees and slippage. |
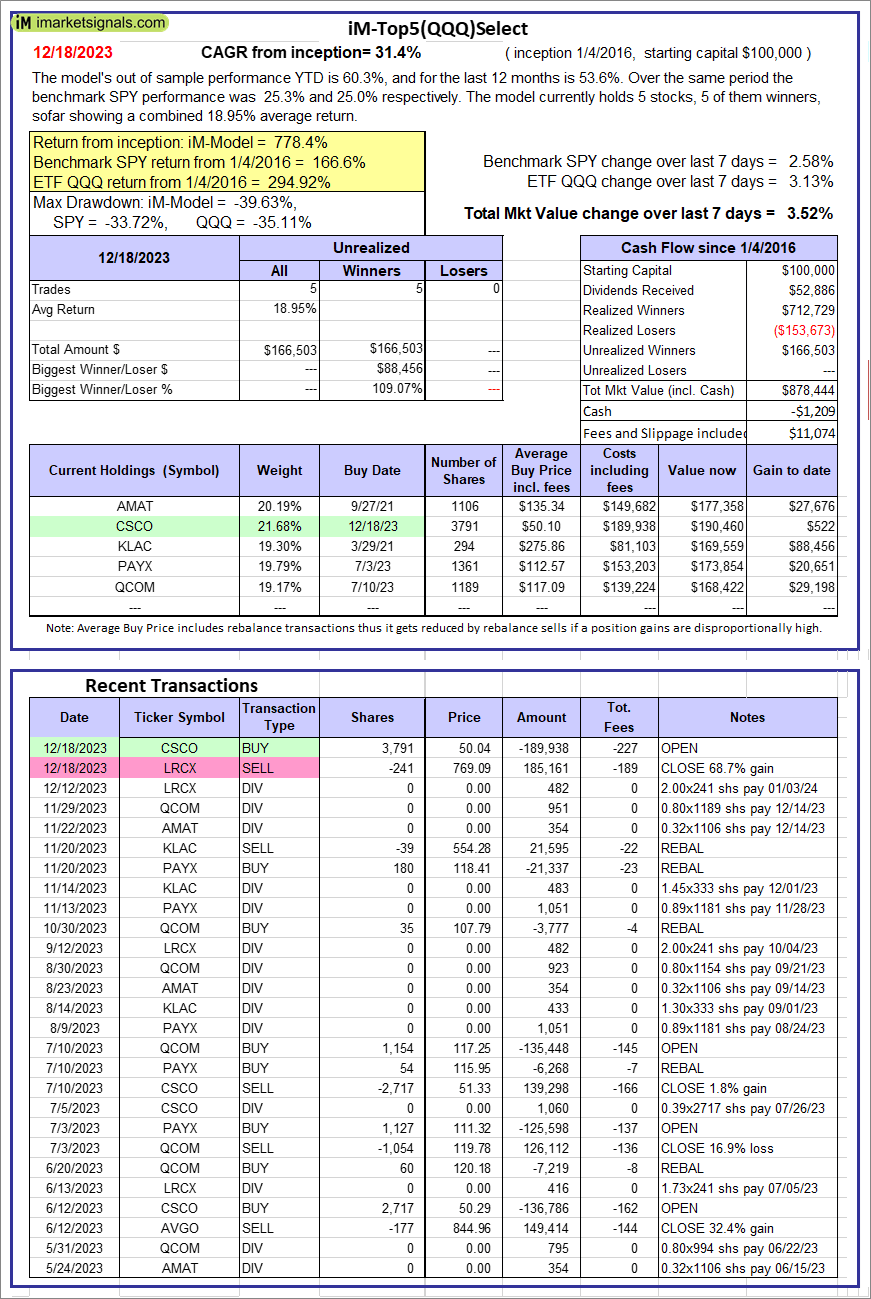 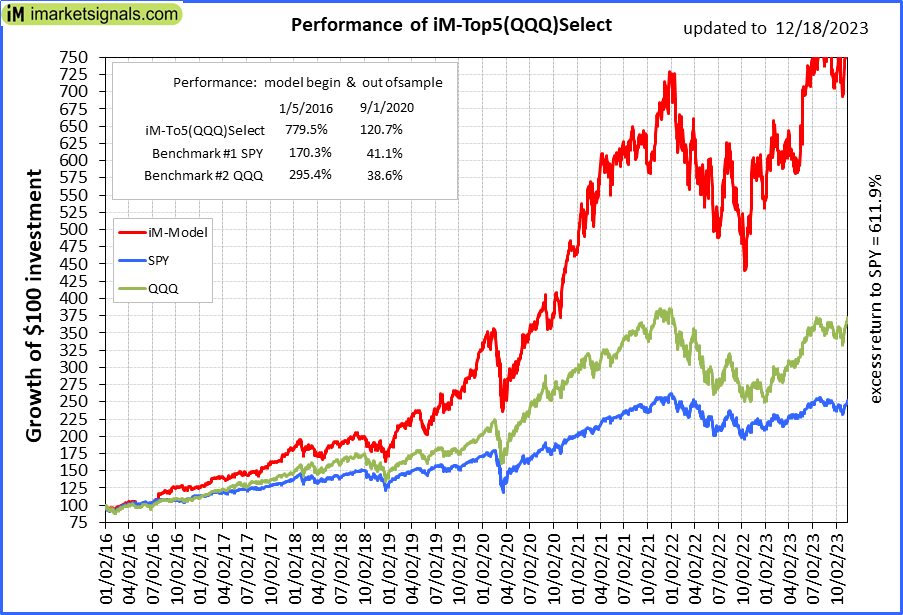 |
iM-Top5(QQQ)Select: Since inception, on 1/5/2016, the model gained 778.44% while the benchmark SPY gained 166.56% over the same period. Over the previous week the market value of iM-Top5(QQQ)Select gained 3.52% at a time when SPY gained 2.58%. A starting capital of $100,000 at inception on 1/5/2016 would have grown to $878,444 which includes -$1,209 cash and excludes $11,074 spent on fees and slippage. |
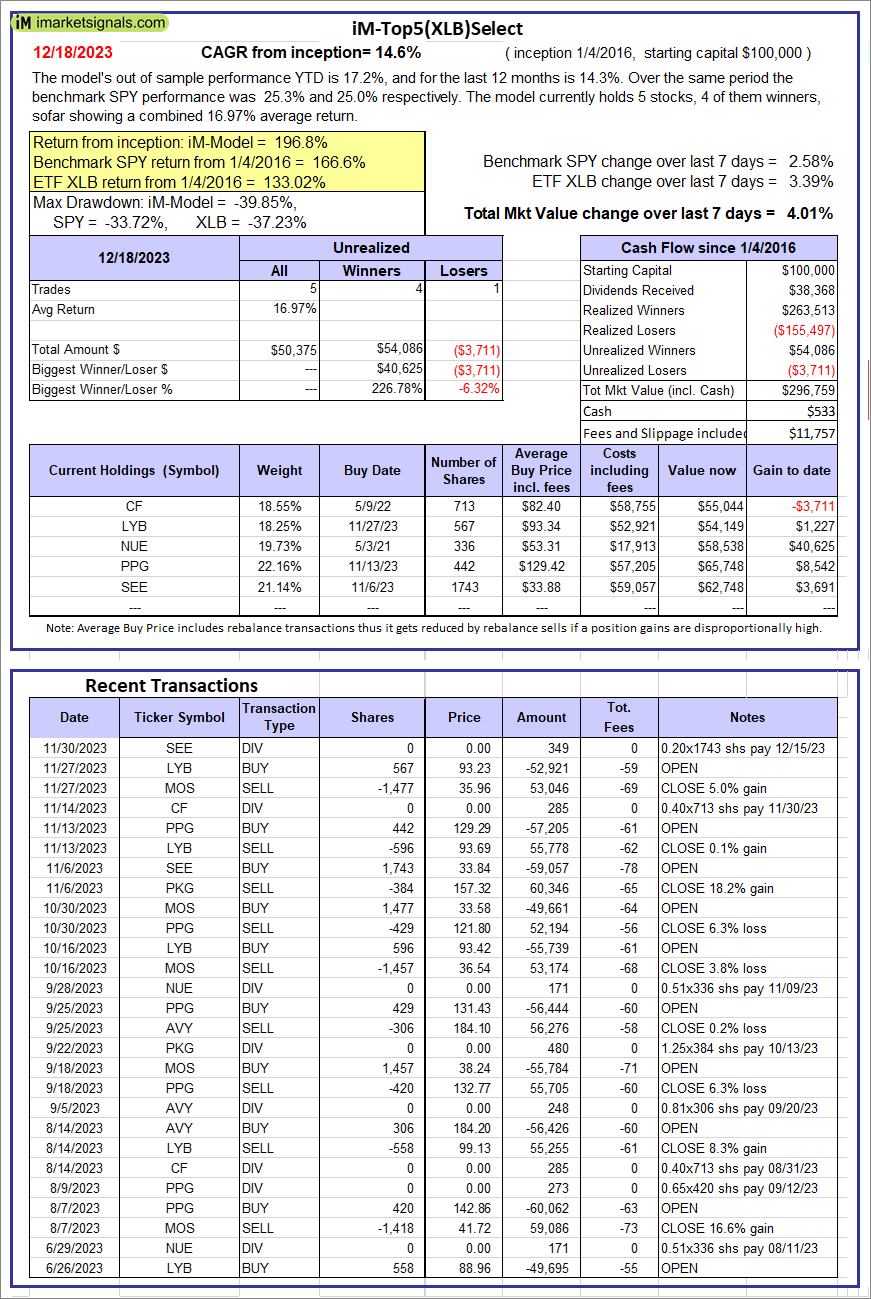 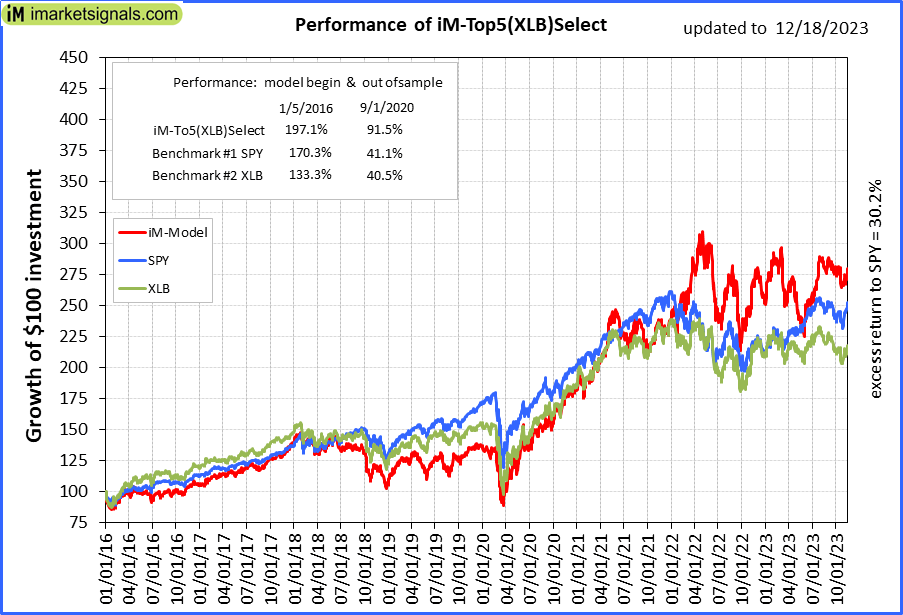 |
iM-Top5(XLB)Select: Since inception, on 1/5/2016, the model gained 196.76% while the benchmark SPY gained 166.56% over the same period. Over the previous week the market value of iM-Top5(XLB)Select gained 4.01% at a time when SPY gained 2.58%. A starting capital of $100,000 at inception on 1/5/2016 would have grown to $296,759 which includes $533 cash and excludes $11,757 spent on fees and slippage. |
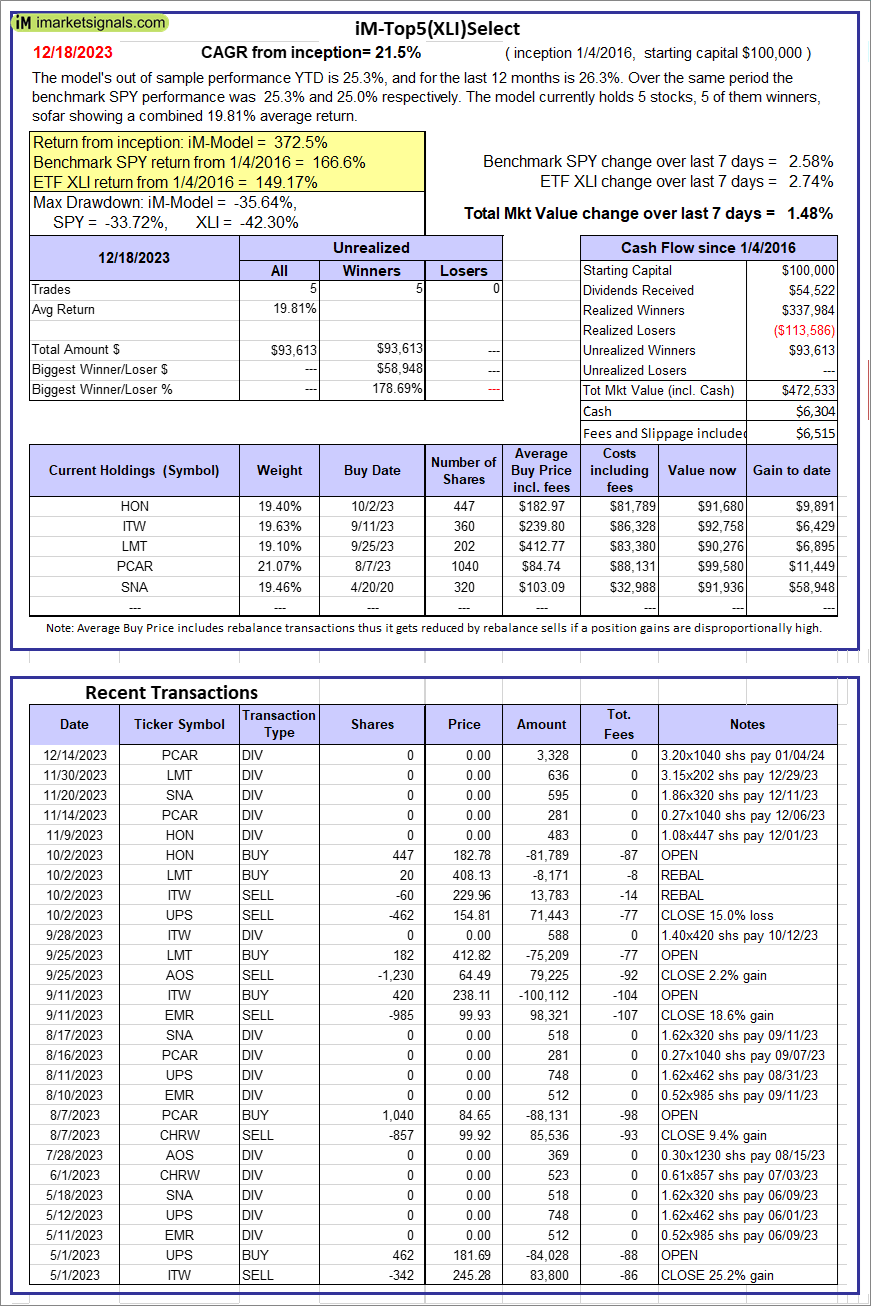 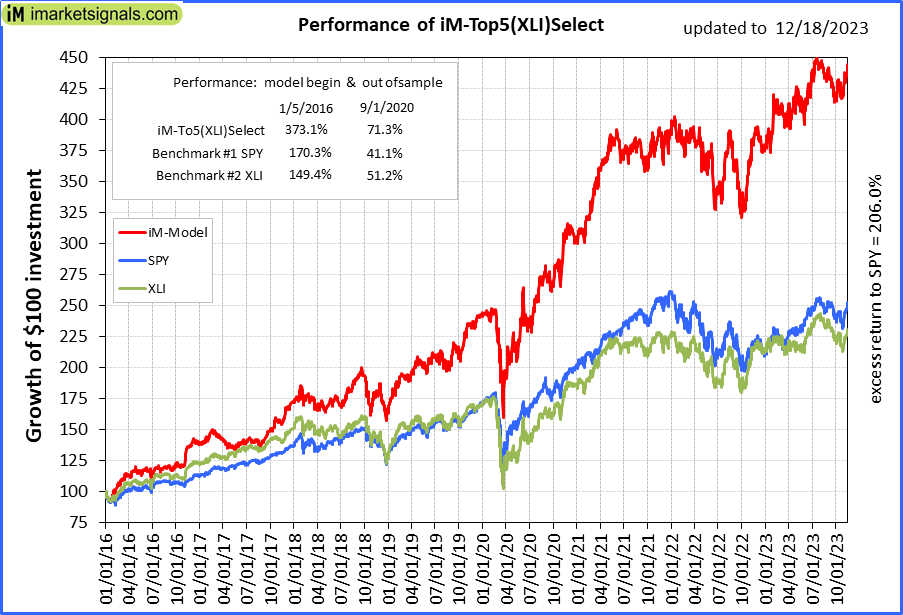 |
iM-Top5(XLI)Select: Since inception, on 1/5/2016, the model gained 372.53% while the benchmark SPY gained 166.56% over the same period. Over the previous week the market value of iM-Top5(XLI)Select gained 1.48% at a time when SPY gained 2.58%. A starting capital of $100,000 at inception on 1/5/2016 would have grown to $472,533 which includes $6,304 cash and excludes $6,515 spent on fees and slippage. |
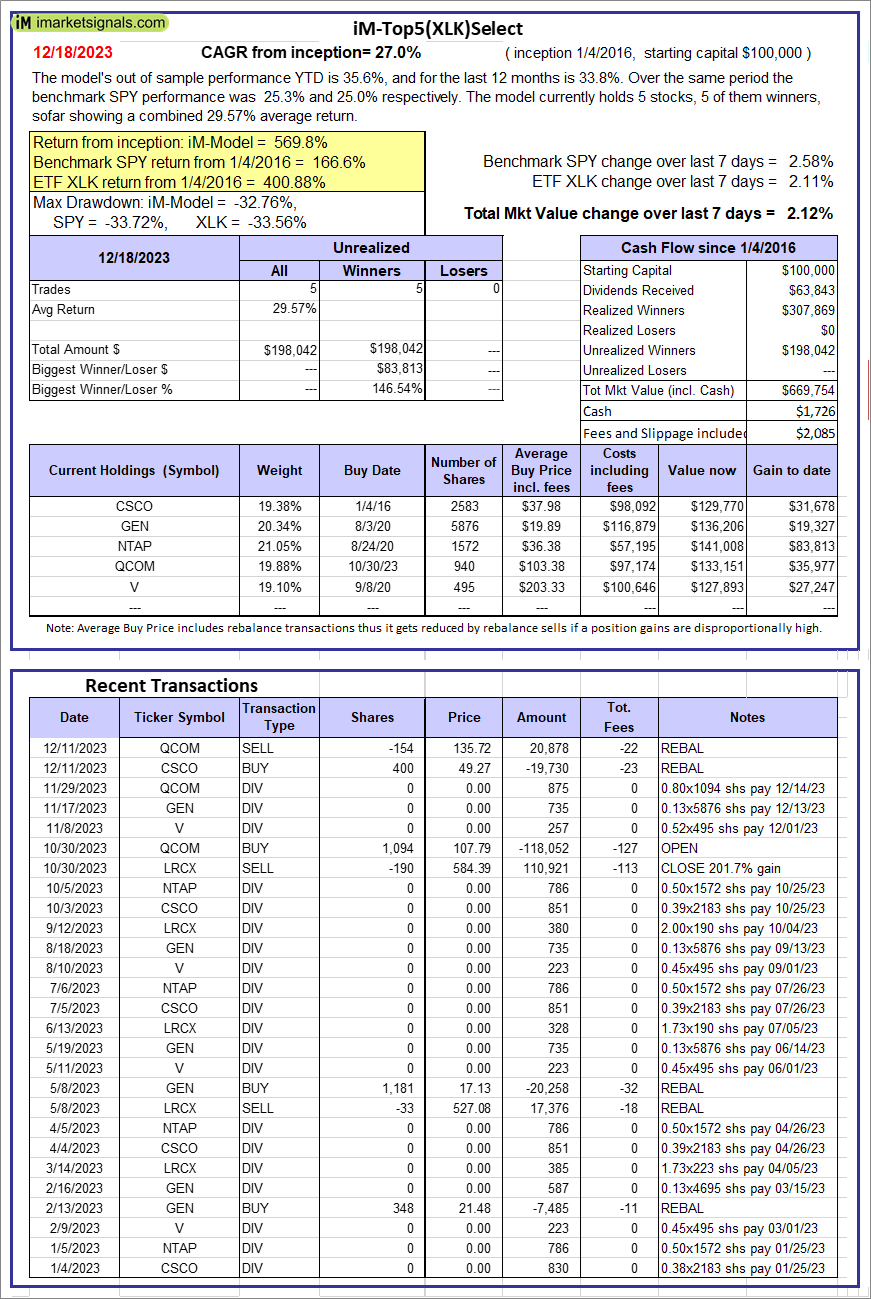 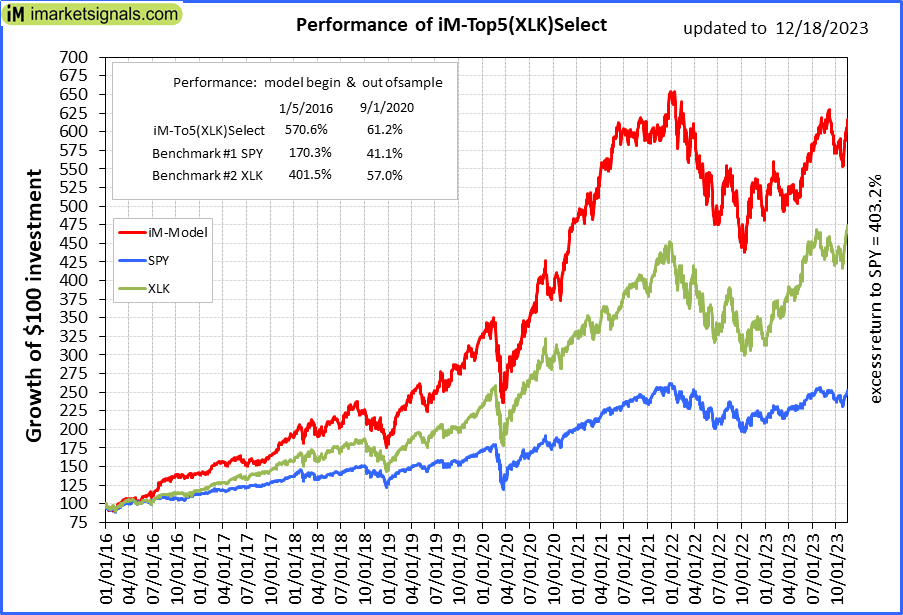 |
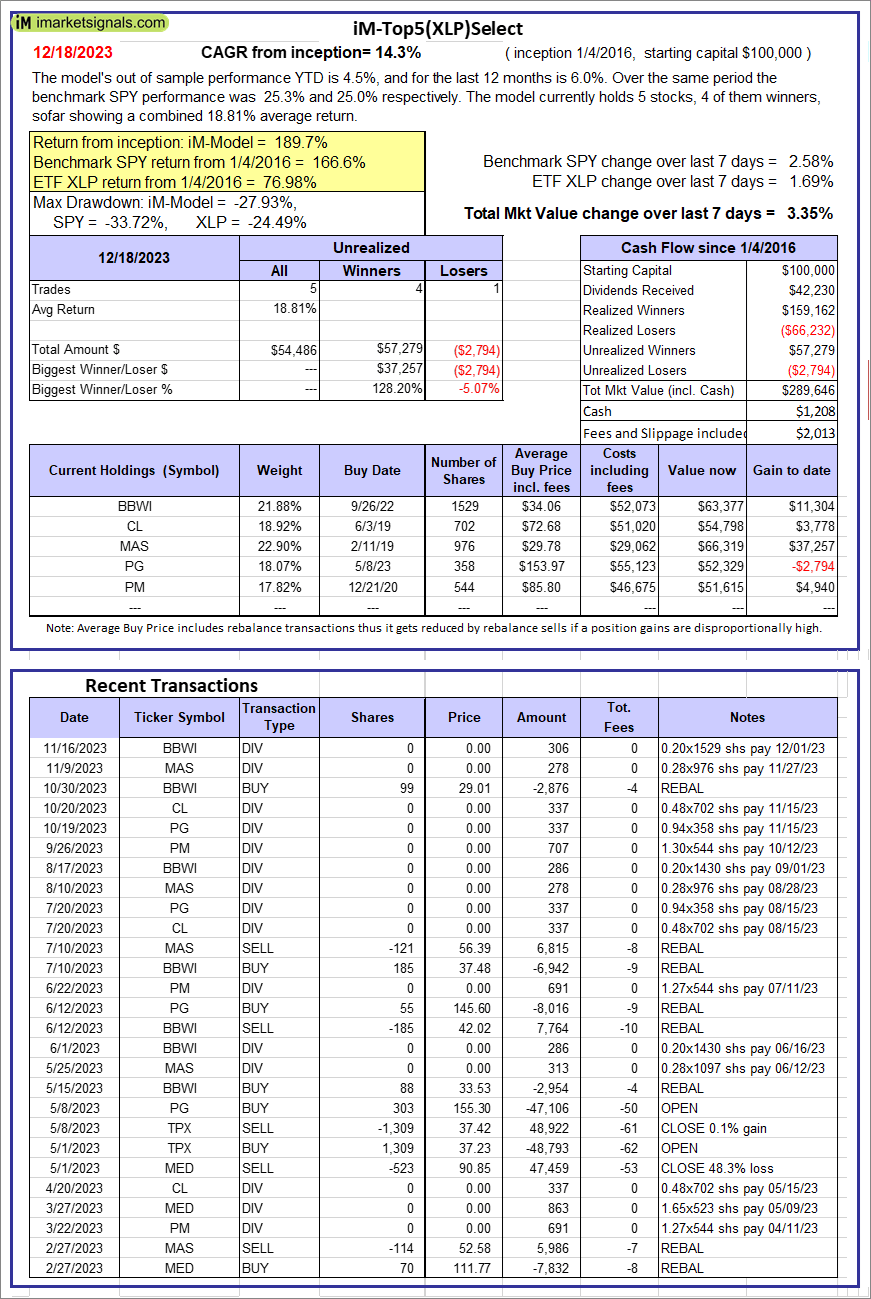
iM-Top5(XLK)Select: Since inception, on 1/5/2016, the model gained 569.75% while the benchmark SPY gained 166.56% over the same period. Over the previous week the market value of iM-Top5(XLK)Select gained 2.12% at a time when SPY gained 2.58%. A starting capital of $100,000 at inception on 1/5/2016 would have grown to $669,754 which includes $1,726 cash and excludes $2,085 spent on fees and slippage. |
 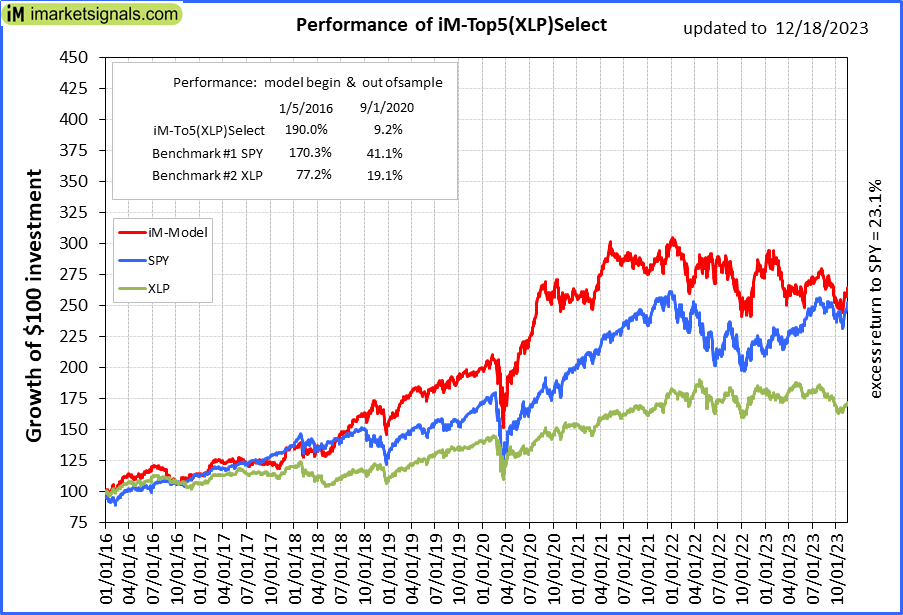 |
iM-Top5(XLP)Select: Since inception, on 1/5/2016, the model gained 189.65% while the benchmark SPY gained 166.56% over the same period. Over the previous week the market value of iM-Top5(XLP)Select gained 3.35% at a time when SPY gained 2.58%. A starting capital of $100,000 at inception on 1/5/2016 would have grown to $289,646 which includes $1,208 cash and excludes $2,013 spent on fees and slippage. |
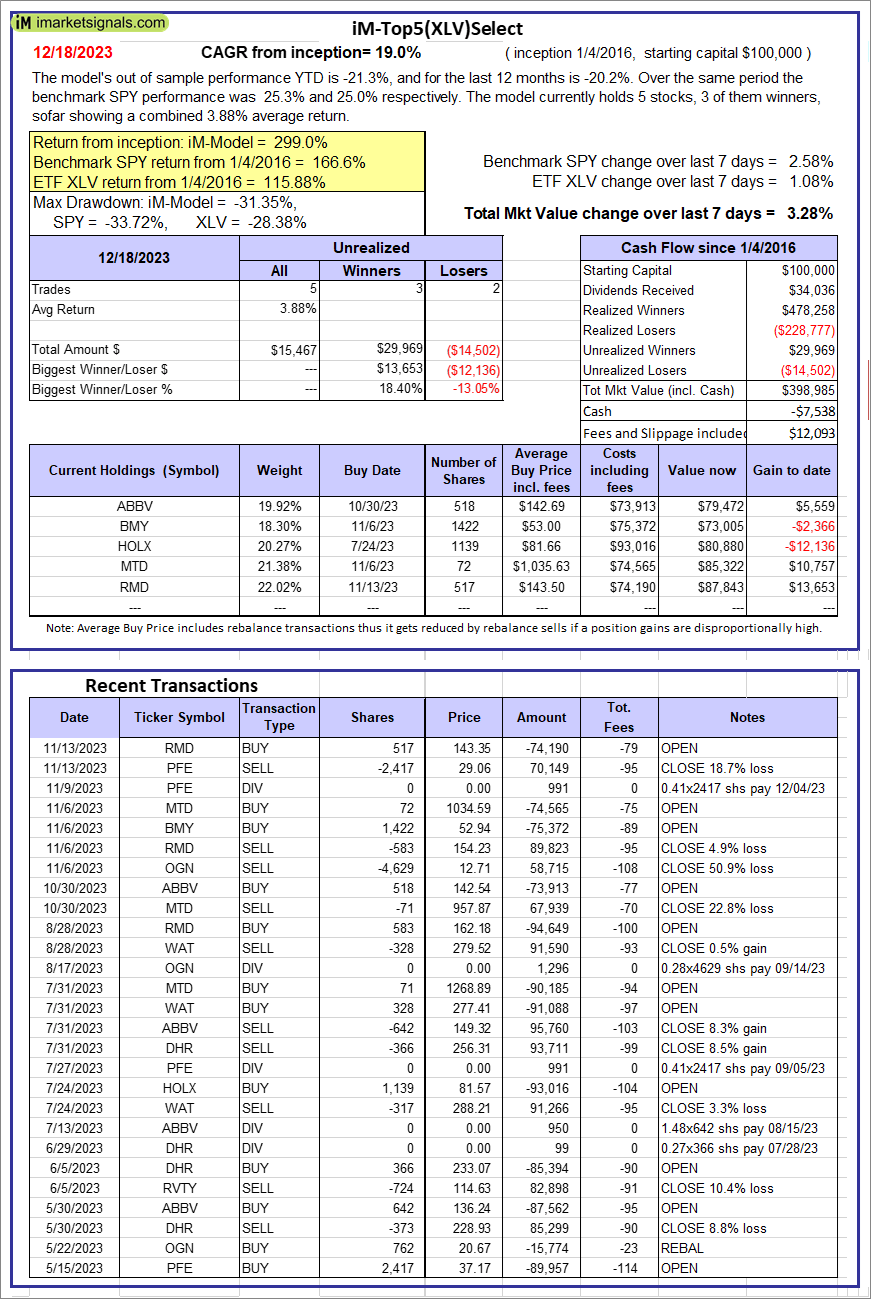 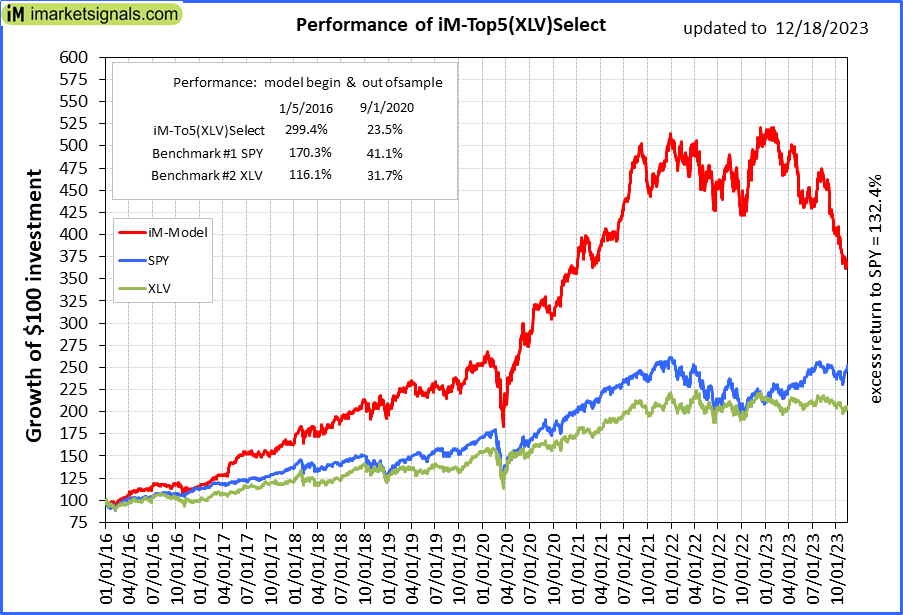 |
iM-Top5(XLV)Select: Since inception, on 1/5/2016, the model gained 298.98% while the benchmark SPY gained 166.56% over the same period. Over the previous week the market value of iM-Top5(XLV)Select gained 3.28% at a time when SPY gained 2.58%. A starting capital of $100,000 at inception on 1/5/2016 would have grown to $398,985 which includes -$7,538 cash and excludes $12,093 spent on fees and slippage. |
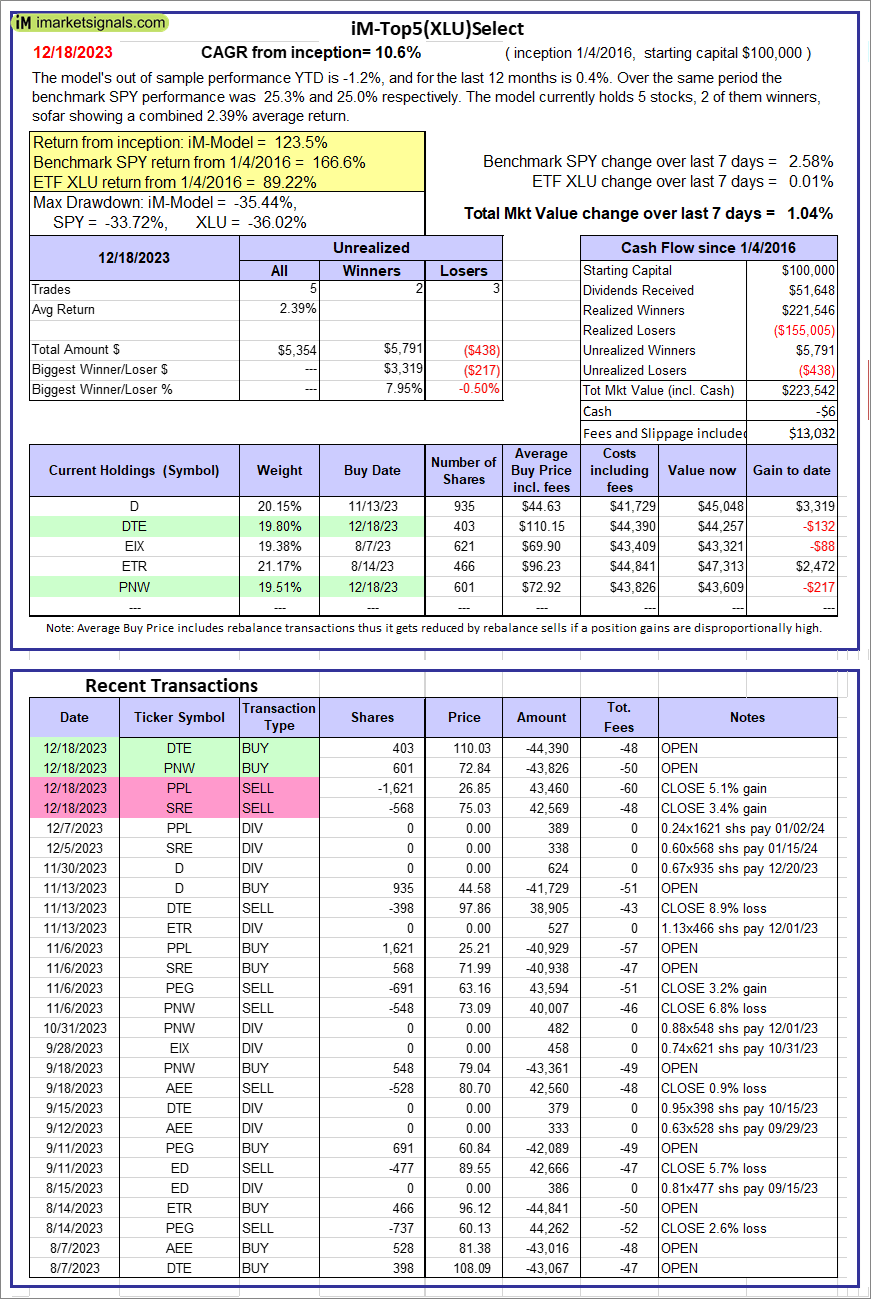 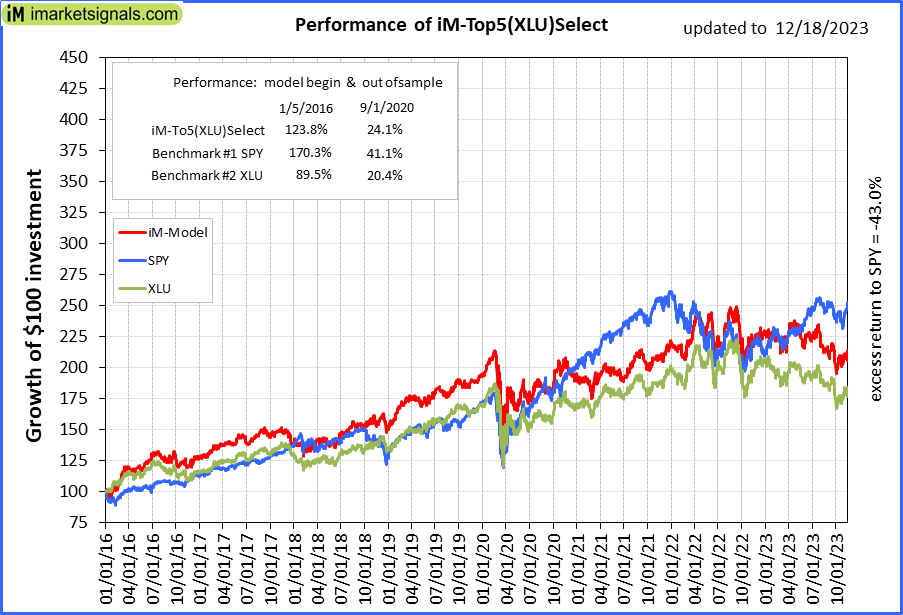 |
iM-Top5(XLU)Select: Since inception, on 1/5/2016, the model gained 123.54% while the benchmark SPY gained 166.56% over the same period. Over the previous week the market value of iM-Top5(XLU)Select gained 1.04% at a time when SPY gained 2.58%. A starting capital of $100,000 at inception on 1/5/2016 would have grown to $223,542 which includes -$6 cash and excludes $13,032 spent on fees and slippage. |
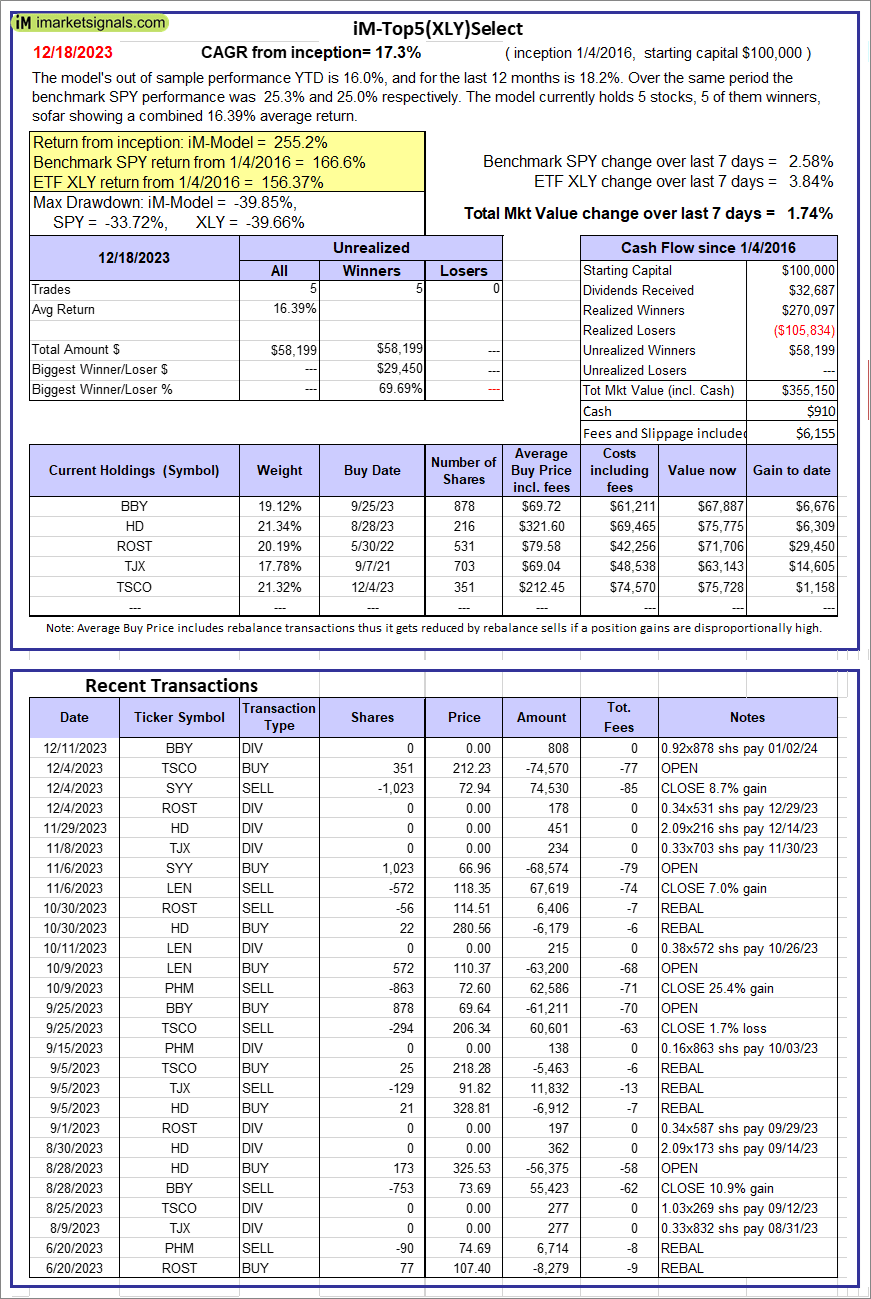  |
iM-Top5(XLY)Select: Since inception, on 1/5/2016, the model gained 255.15% while the benchmark SPY gained 166.56% over the same period. Over the previous week the market value of iM-Top5(XLY)Select gained 1.74% at a time when SPY gained 2.58%. A starting capital of $100,000 at inception on 1/5/2016 would have grown to $355,150 which includes $910 cash and excludes $6,155 spent on fees and slippage. |
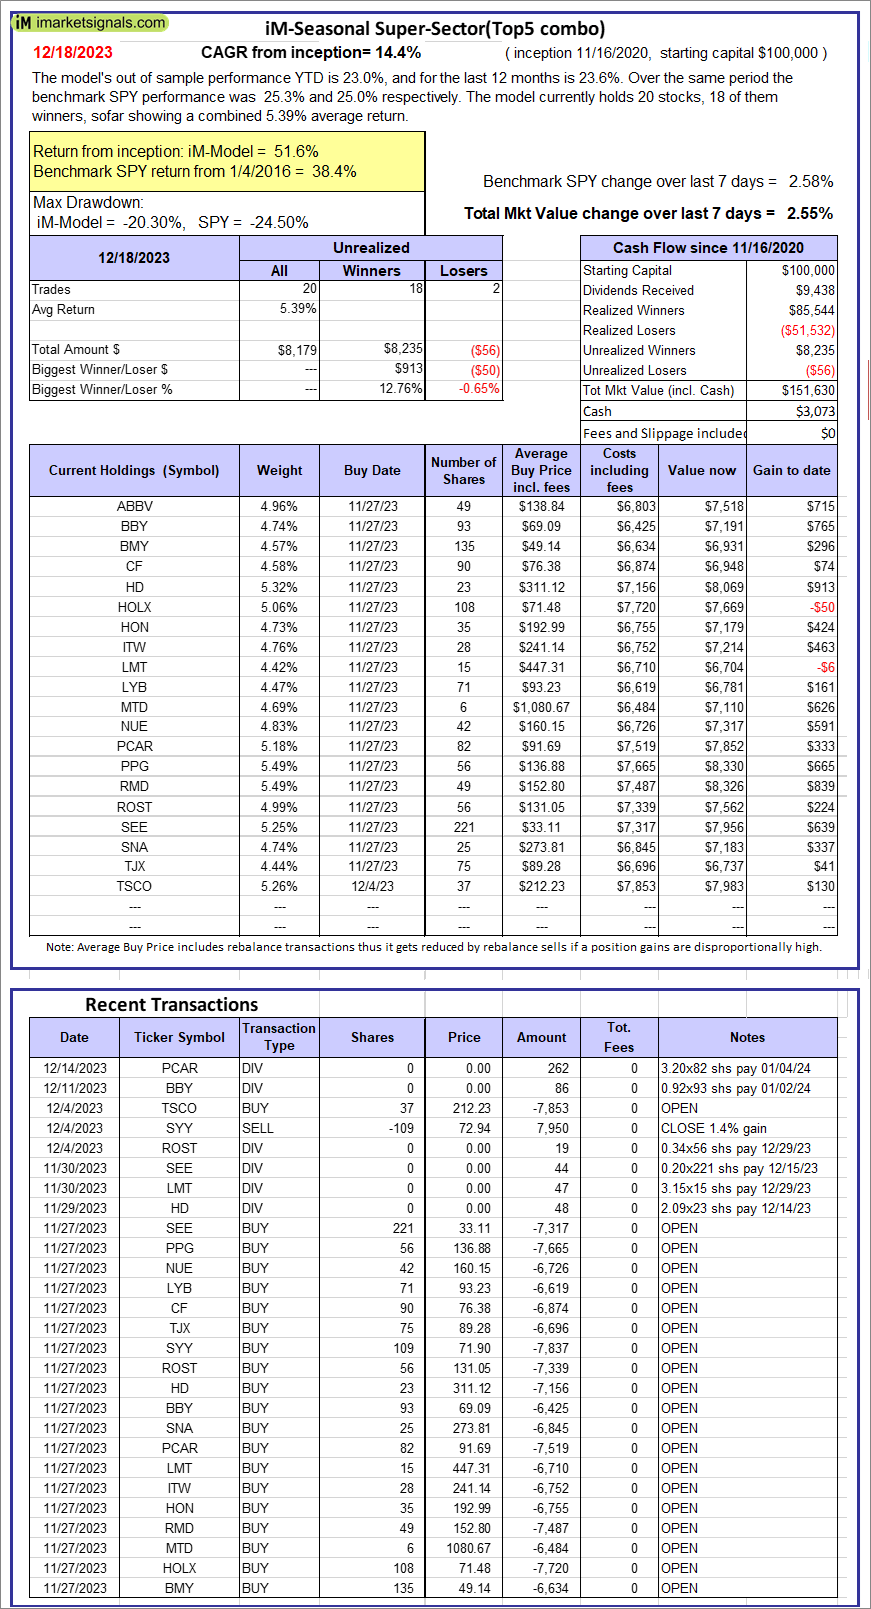 |
iM-Seasonal Super-Sectors (Top5 combo) : Since inception, on 11/17/2020, the model gained 51.63% while the benchmark SPY gained 38.37% over the same period. Over the previous week the market value of iM-Seasonal Super-Sectors (Top5 combo) gained 2.55% at a time when SPY gained 2.58%. A starting capital of $100,000 at inception on 11/17/2020 would have grown to $151,630 which includes $3,073 cash and excludes $00 spent on fees and slippage. |
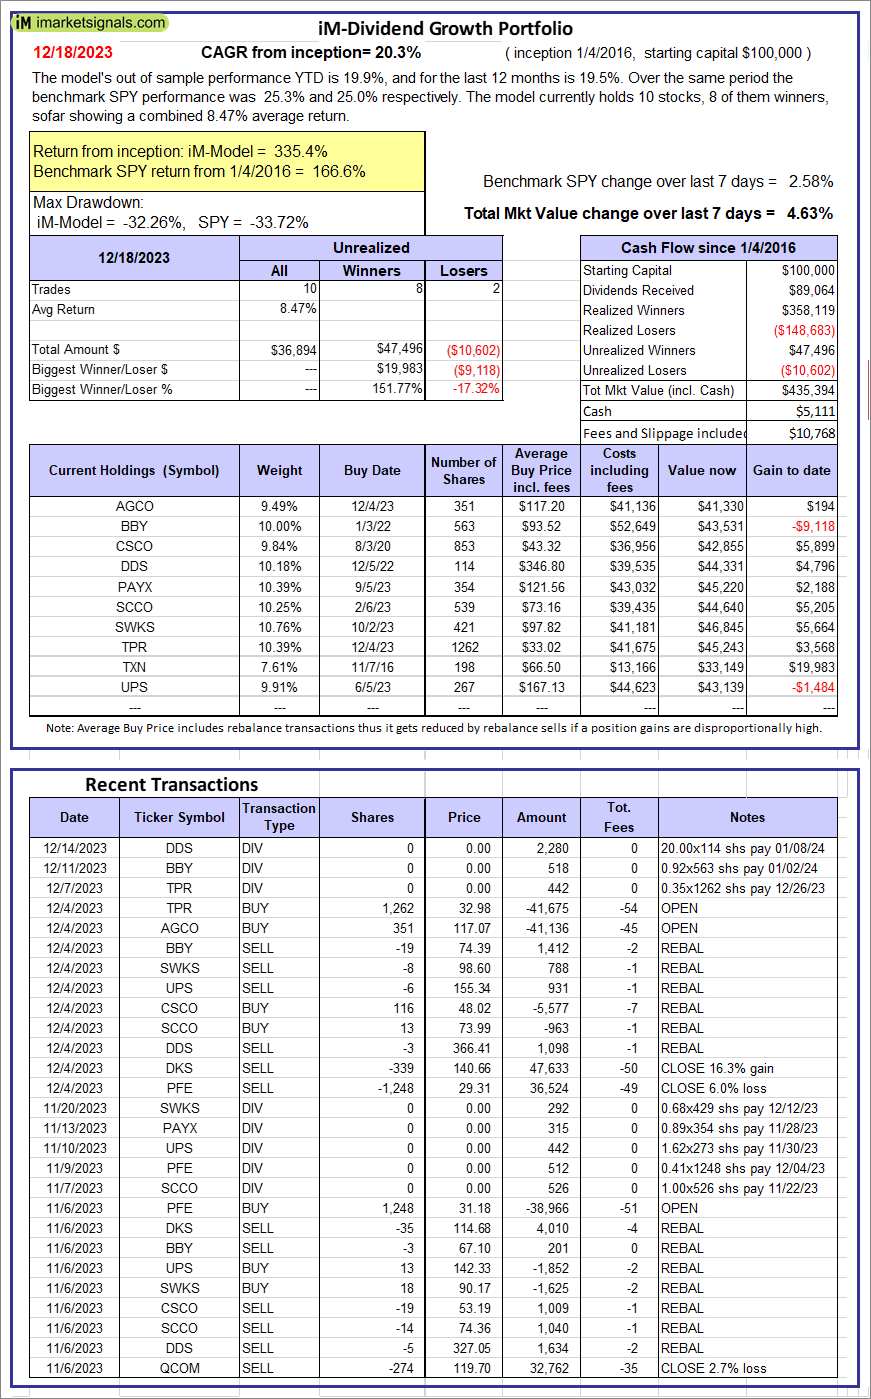 |
iM-Dividend Growth Portfolio: The model’s out of sample performance YTD is 19.9%, and for the last 12 months is 19.5%. Over the same period the benchmark SPY performance was 25.3% and 25.0% respectively. Over the previous week the market value of the iM-Dividend Growth Portfolio gained 4.63% at a time when SPY gained 2.58%. A starting capital of $100,000 at inception on 6/30/2016 would have grown to $435,394 which includes $5,111 cash and excludes $10,768 spent on fees and slippage. |
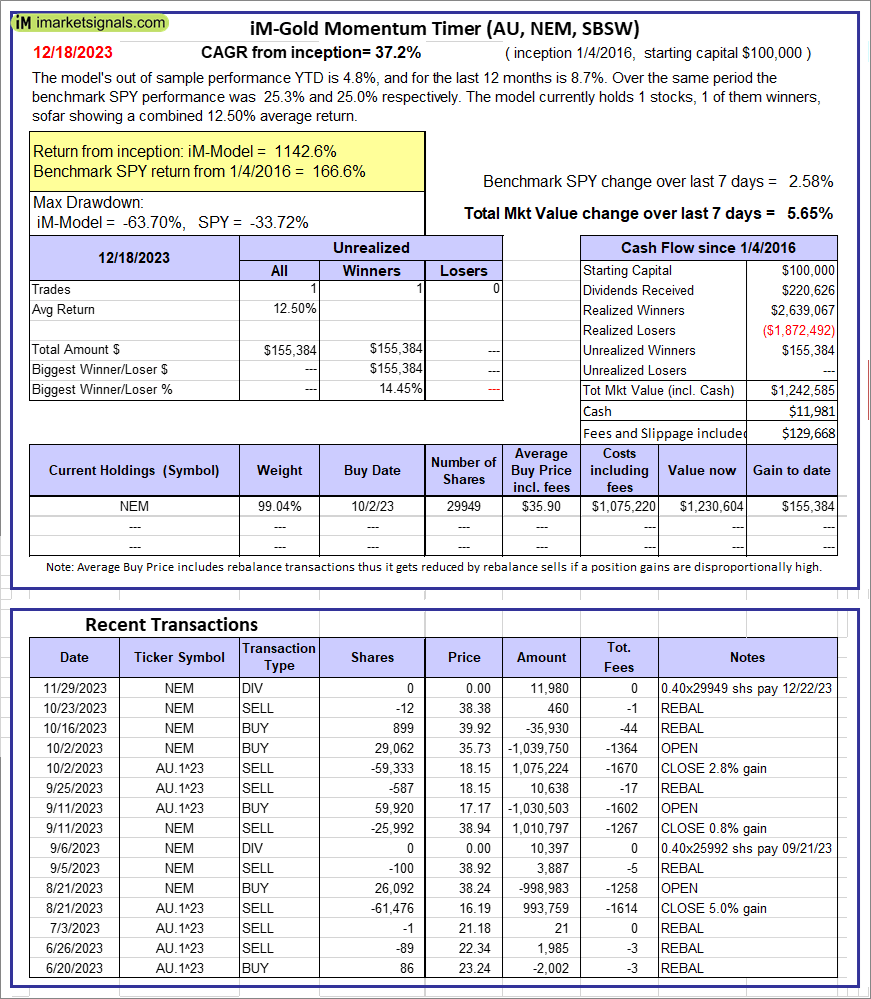 |
iM-Gold Momentum Timer (AU, NEM, SBSW): The model’s out of sample performance YTD is 4.8%, and for the last 12 months is 8.7%. Over the same period the benchmark SPY performance was 25.3% and 25.0% respectively. Over the previous week the market value of iM-Gold Momentum Timer (AU, NEM, SBSW) gained 5.65% at a time when SPY gained 2.58%. A starting capital of $100,000 at inception on 6/30/2016 would have grown to $11,981 which includes $129,668 cash and excludes Gain to date spent on fees and slippage. |
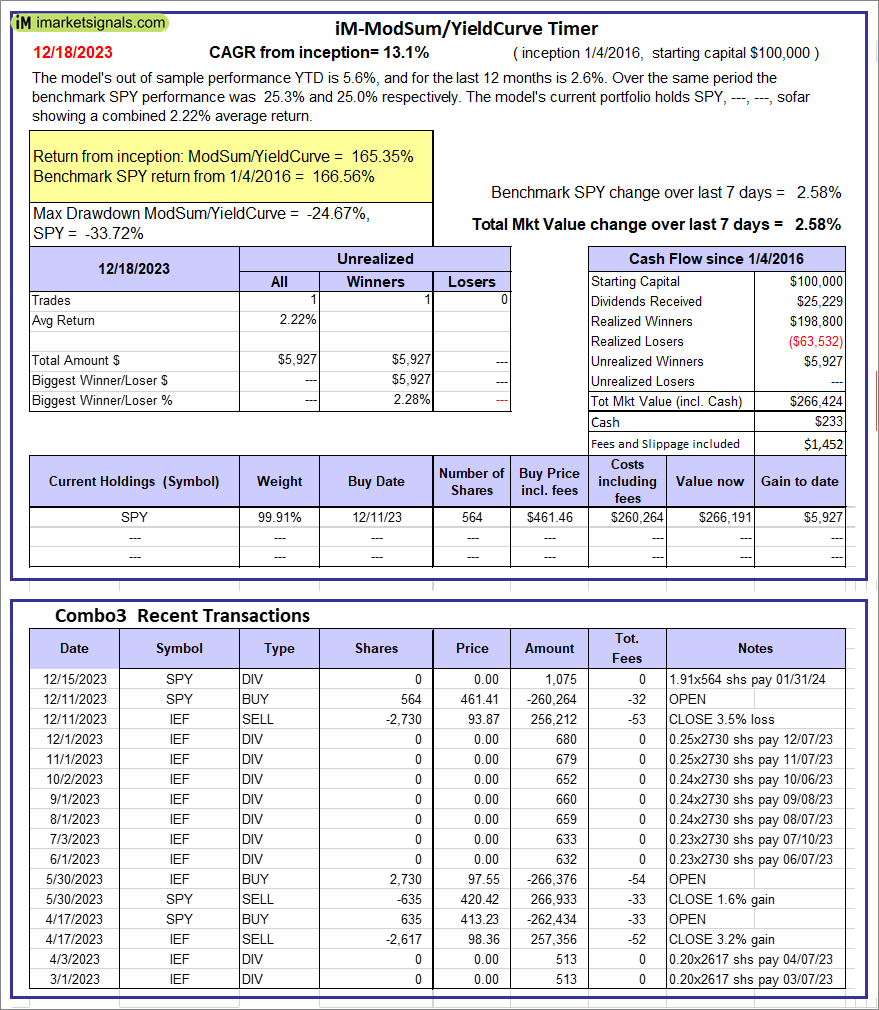 |
iM-ModSum/YieldCurve Timer: The model’s out of sample performance YTD is 5.6%, and for the last 12 months is 2.6%. Over the same period the benchmark SPY performance was 25.3% and 25.0% respectively. Over the previous week the market value of iM-PortSum/YieldCurve Timer gained 2.58% at a time when SPY gained 2.58%. A starting capital of $100,000 at inception on 1/1/2016 would have grown to $266,424 which includes $233 cash and excludes $1,452 spent on fees and slippage. |
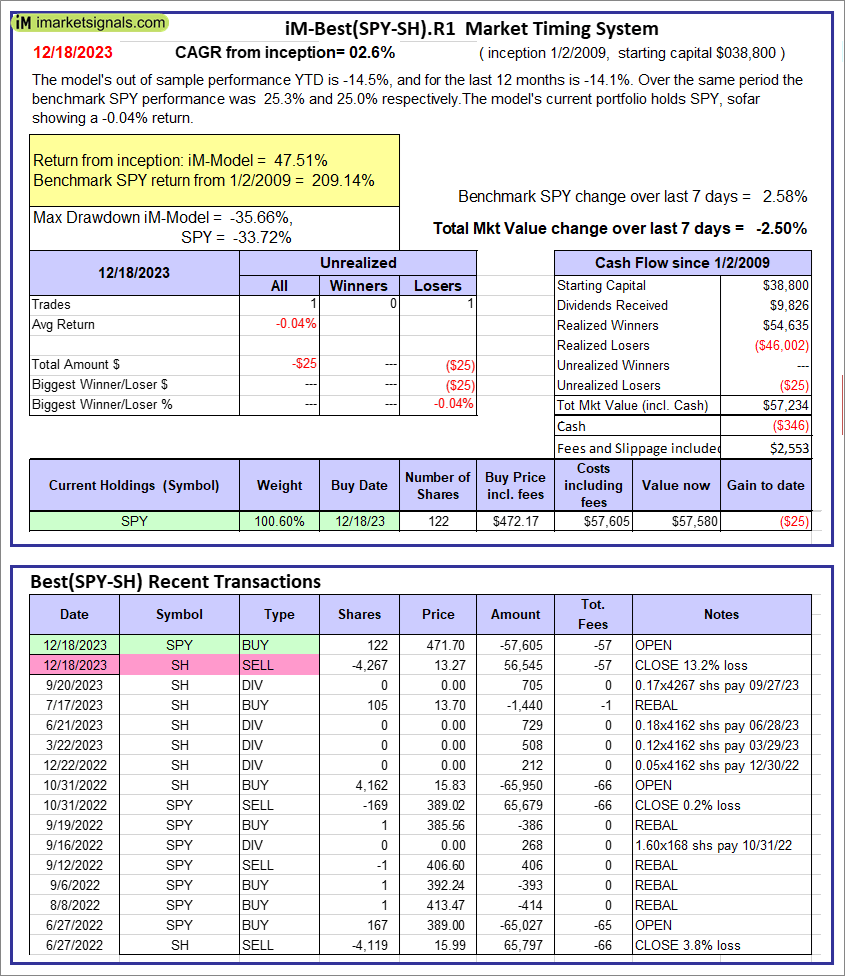 |
iM-Best(SPY-SH).R1: The model’s out of sample performance YTD is -14.5%, and for the last 12 months is -14.1%. Over the same period the benchmark SPY performance was 25.3% and 25.0% respectively. Over the previous week the market value of Best(SPY-SH) gained -2.50% at a time when SPY gained 2.58%. A starting capital of $100,000 at inception on 1/2/2009 would have grown to $57,234 which includes -$346 cash and excludes $2,553 spent on fees and slippage. |
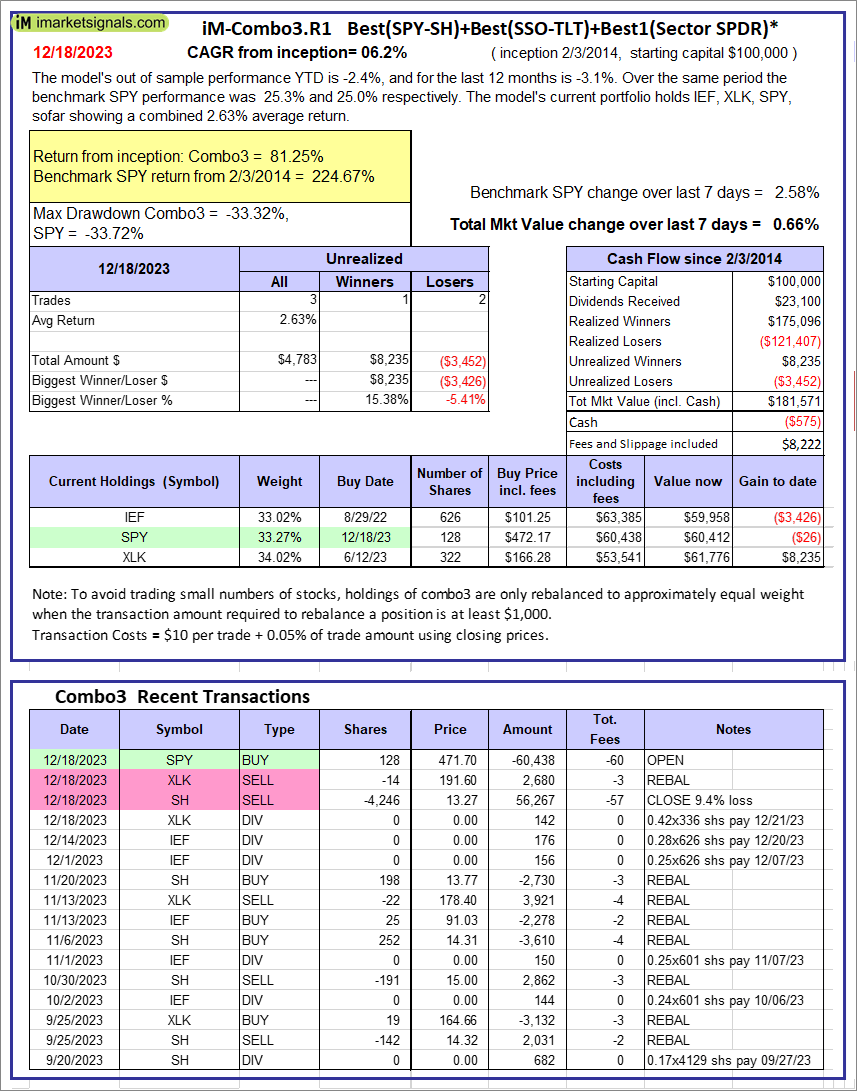 |
iM-Combo3.R1: The model’s out of sample performance YTD is -2.4%, and for the last 12 months is -3.1%. Over the same period the benchmark SPY performance was 25.3% and 25.0% respectively. Over the previous week the market value of iM-Combo3.R1 gained 0.66% at a time when SPY gained 2.58%. A starting capital of $100,000 at inception on 2/3/2014 would have grown to $181,571 which includes -$575 cash and excludes $8,222 spent on fees and slippage. |
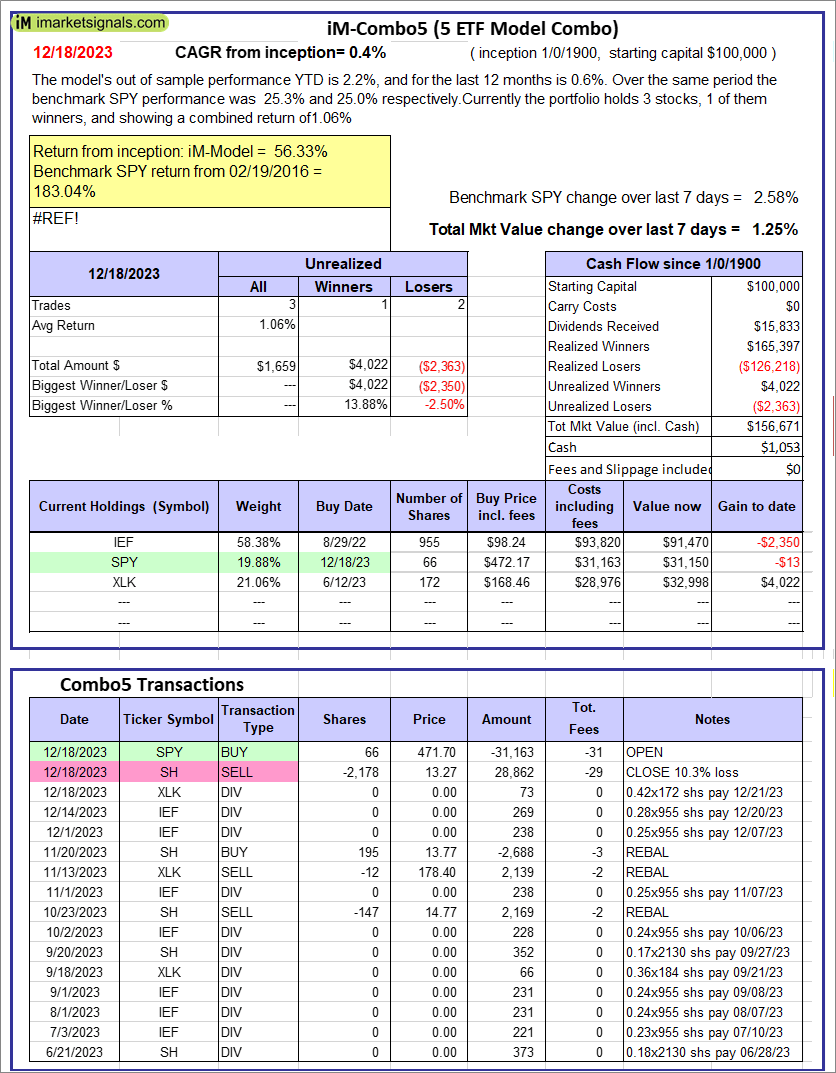 |
iM-Combo5: The model’s out of sample performance YTD is 2.2%, and for the last 12 months is 0.6%. Over the same period the benchmark SPY performance was 25.3% and 25.0% respectively. Over the previous week the market value of iM-Combo5 gained 1.25% at a time when SPY gained 2.58%. A starting capital of $100,000 at inception on 2/22/2016 would have grown to $156,671 which includes $1,053 cash and excludes $0 spent on fees and slippage. |
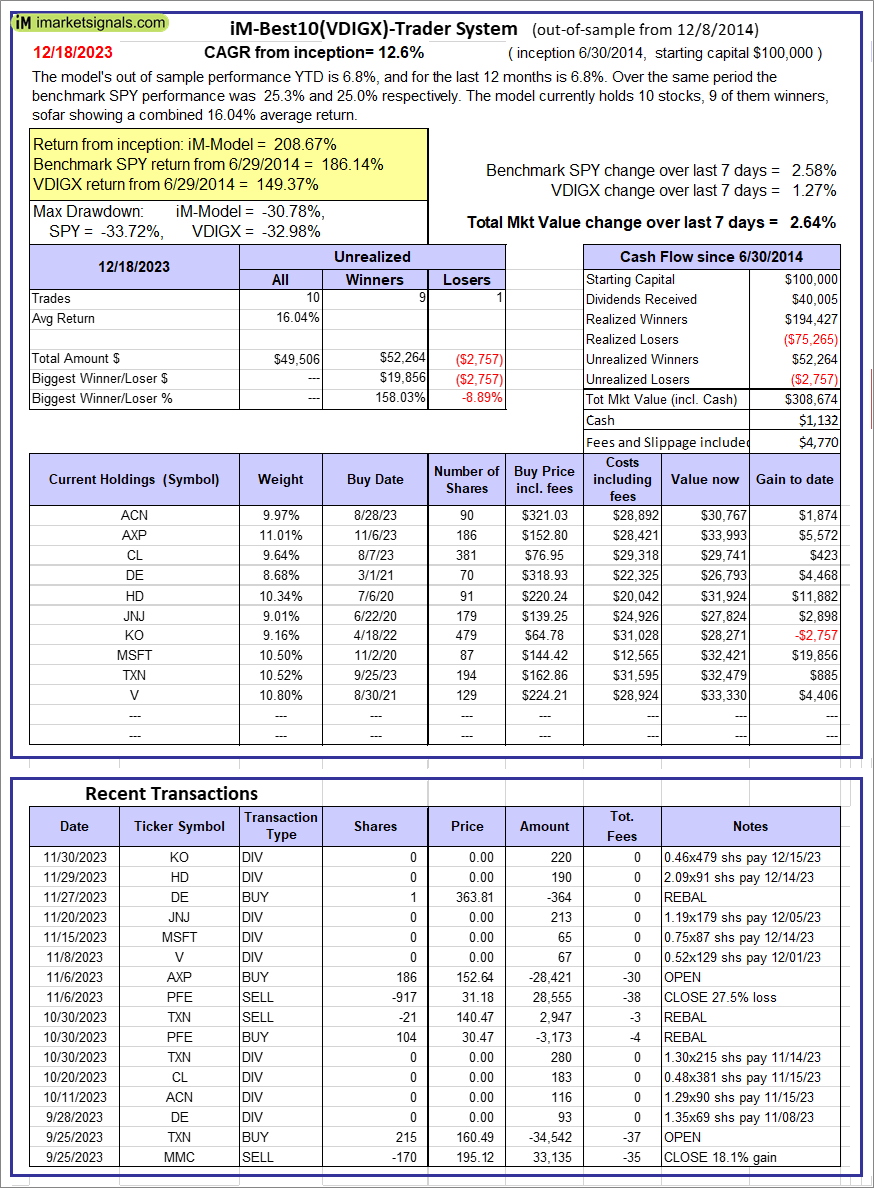 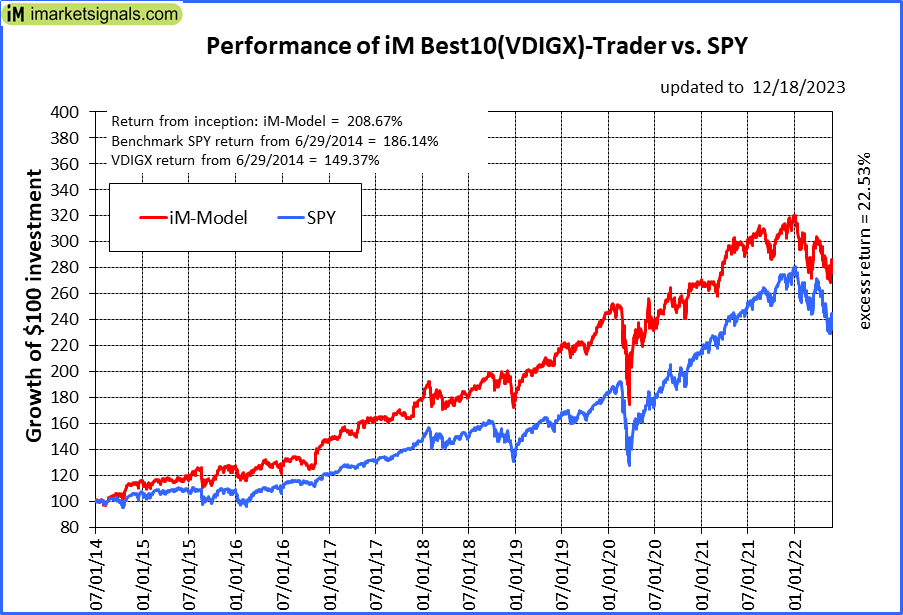 |
iM-Best10(VDIGX)-Trader: The model’s out of sample performance YTD is 6.8%, and for the last 12 months is 6.8%. Over the same period the benchmark SPY performance was 25.3% and 25.0% respectively. Since inception, on 7/1/2014, the model gained 208.67% while the benchmark SPY gained 186.14% and VDIGX gained 149.37% over the same period. Over the previous week the market value of iM-Best10(VDIGX) gained 2.64% at a time when SPY gained 2.58%. A starting capital of $100,000 at inception on 7/1/2014 would have grown to $308,674 which includes $1,132 cash and excludes $4,770 spent on fees and slippage. |
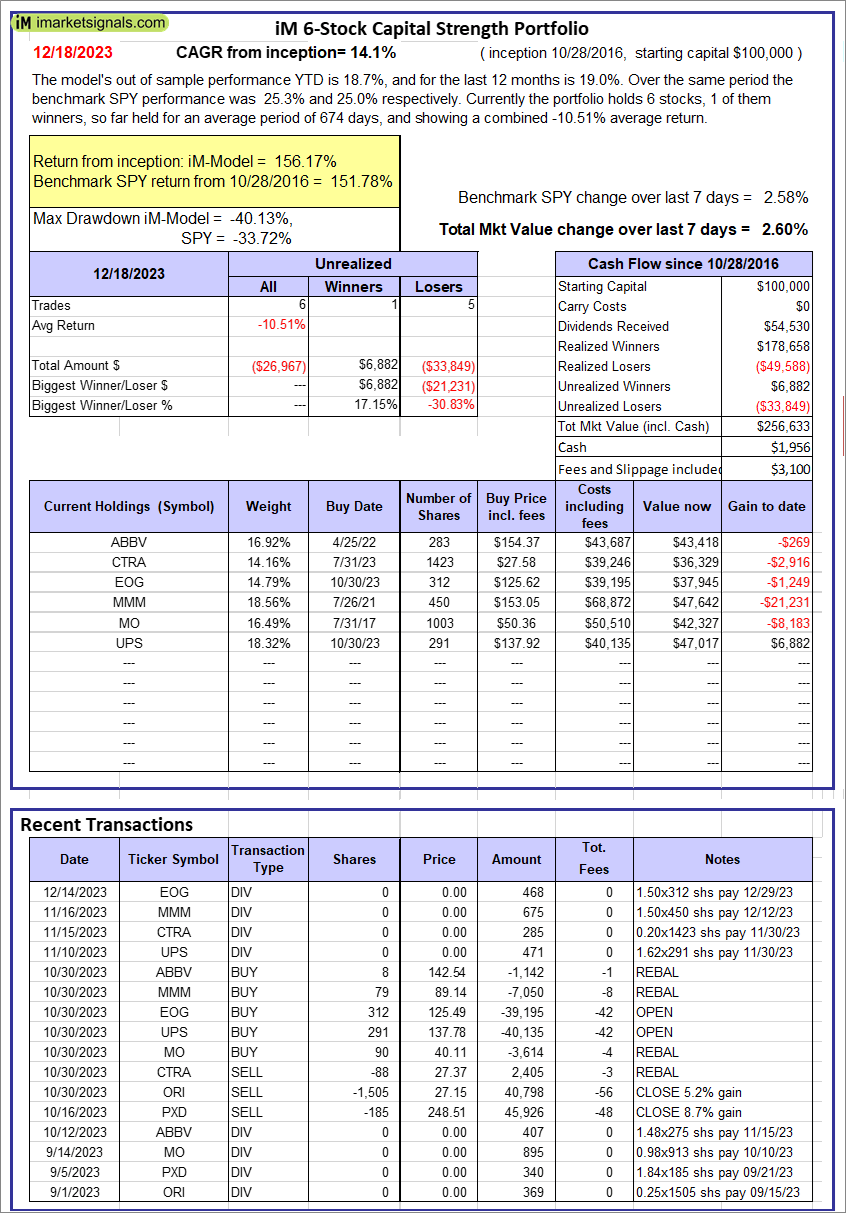 |
iM 6-Stock Capital Strength Portfolio: The model’s out of sample performance YTD is 18.7%, and for the last 12 months is 19.0%. Over the same period the benchmark SPY performance was 25.3% and 25.0% respectively. Over the previous week the market value of the iM 6-Stock Capital Strength Portfolio gained 2.60% at a time when SPY gained 2.58%. A starting capital of $100,000 at inception on 10/28/2016 would have grown to $256,633 which includes $1,956 cash and excludes $3,100 spent on fees and slippage. |
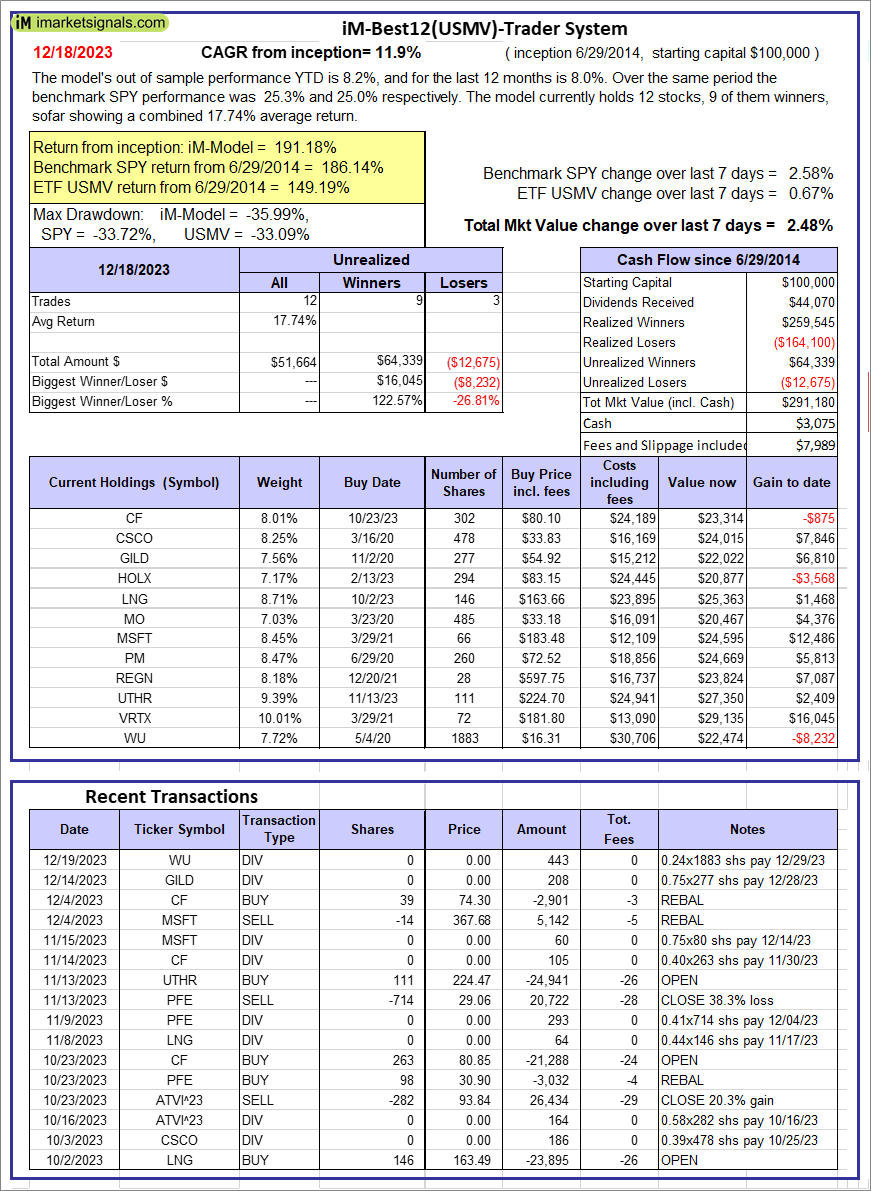 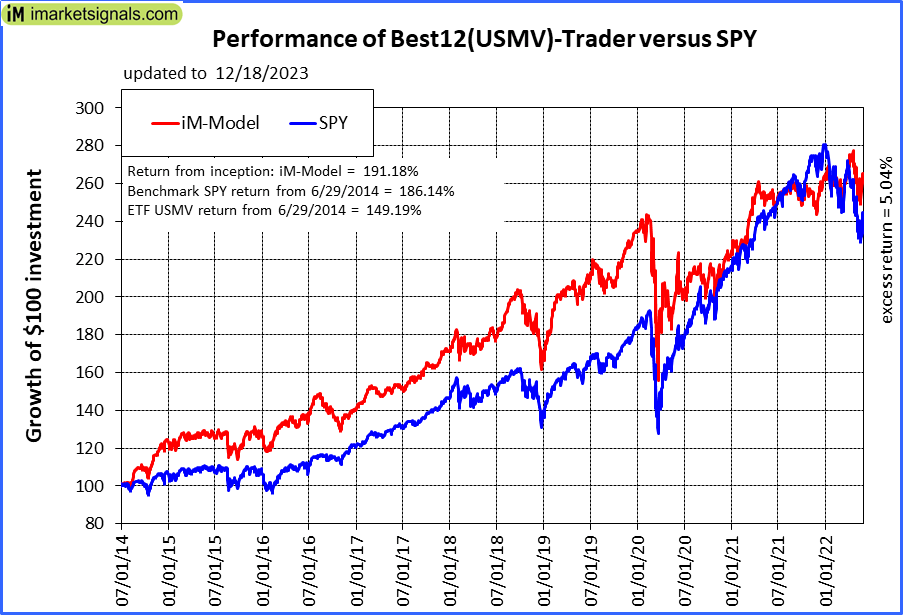 |
iM-Best12(USMV)-Trader: The model’s out of sample performance YTD is 8.2%, and for the last 12 months is 8.0%. Over the same period the benchmark SPY performance was 25.3% and 25.0% respectively. Since inception, on 6/30/2014, the model gained 191.18% while the benchmark SPY gained 186.14% and the ETF USMV gained 149.19% over the same period. Over the previous week the market value of iM-Best12(USMV)-Trader gained 2.48% at a time when SPY gained 2.58%. A starting capital of $100,000 at inception on 6/30/2014 would have grown to $291,180 which includes $3,075 cash and excludes $7,989 spent on fees and slippage. |
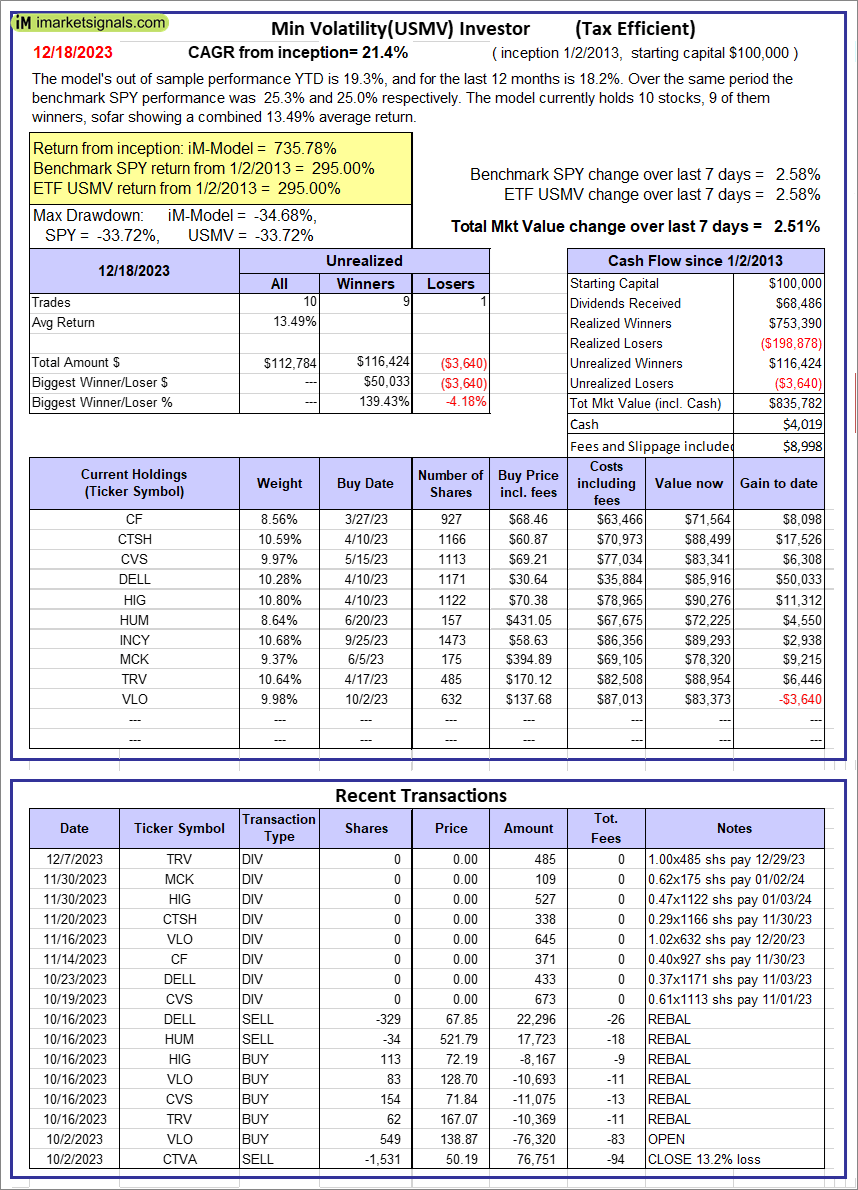 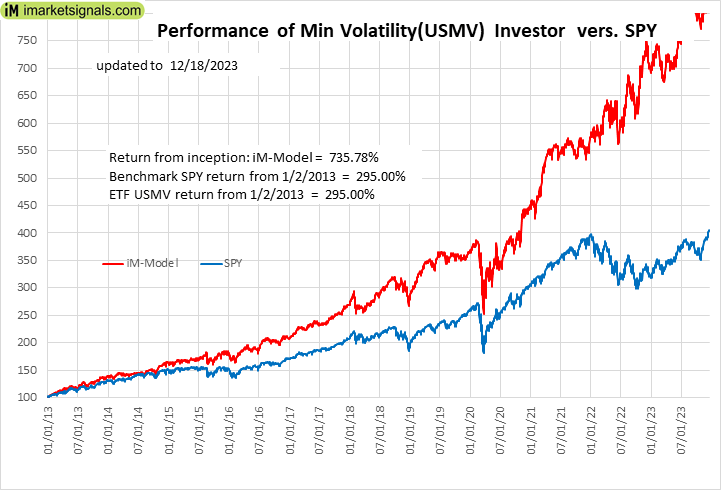 |
iM-Min Volatility(USMV) Investor (Tax Efficient): The model’s out of sample performance YTD is 19.3%, and for the last 12 months is 18.2%. Over the same period the benchmark SPY performance was 25.3% and 25.0% respectively. Since inception, on 1/3/2013, the model gained 735.78% while the benchmark SPY gained 295.00% and the ETF USMV gained 295.00% over the same period. Over the previous week the market value of iM-Best12(USMV)Q1 gained 2.51% at a time when SPY gained 2.58%. A starting capital of $100,000 at inception on 1/3/2013 would have grown to $835,782 which includes $4,019 cash and excludes $8,998 spent on fees and slippage. |
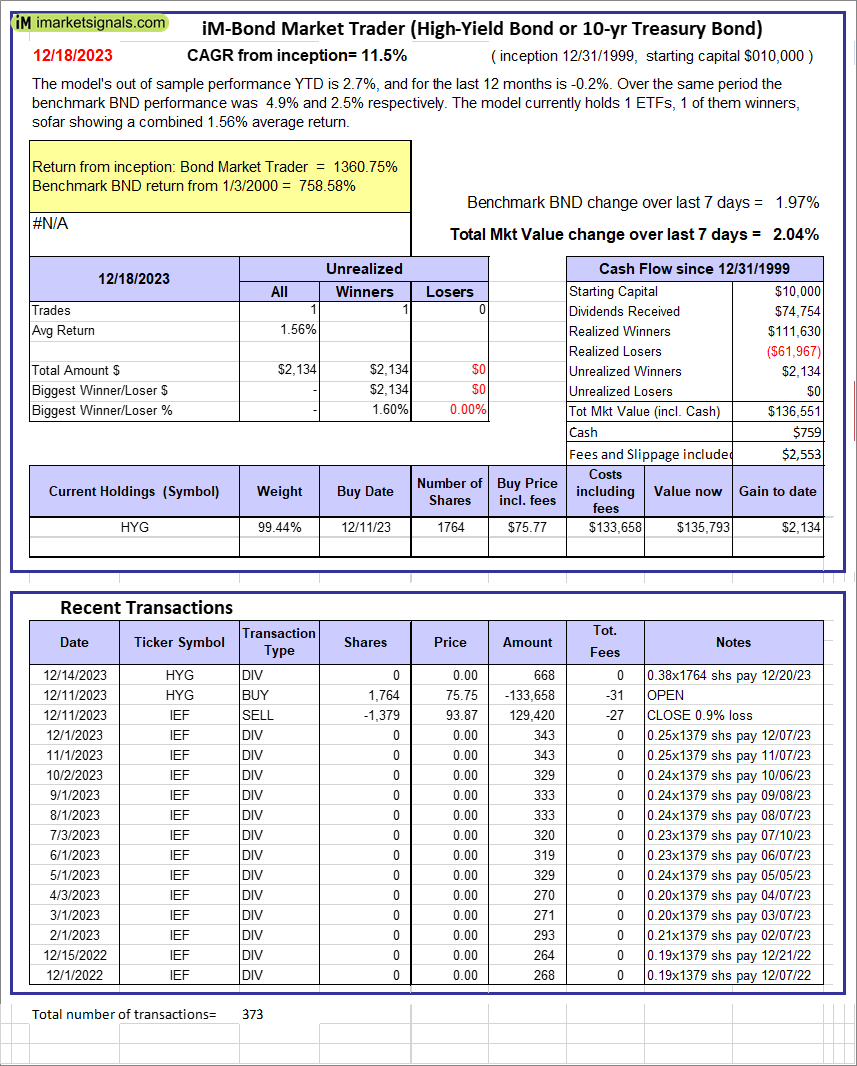 |
iM-Bond Market Trader (High-Yield Bond or 10-yr Treasury Bond): The model’s out of sample performance YTD is 2.7%, and for the last 12 months is -0.2%. Over the same period the benchmark BND performance was 4.9% and 2.5% respectively. Over the previous week the market value of the iM-Bond Market Trader (High-Yield Bond or 10-yr Treasury Bond) gained 2.04% at a time when BND gained 1.97%. A starting capital of $10,000 at inception on 1/3/2000 would have grown to $136,551 which includes $759 cash and excludes $2,553 spent on fees and slippage. |
|
|
iM-ModSum/YieldCurve Timer: The model’s out of sample performance YTD is 5.6%, and for the last 12 months is 2.6%. Over the same period the benchmark SPY performance was 25.3% and 25.0% respectively. Over the previous week the market value of iM-PortSum/YieldCurve Timer gained 2.58% at a time when SPY gained 2.58%. A starting capital of $100,000 at inception on 1/1/2016 would have grown to $266,424 which includes $233 cash and excludes $1,452 spent on fees and slippage. |
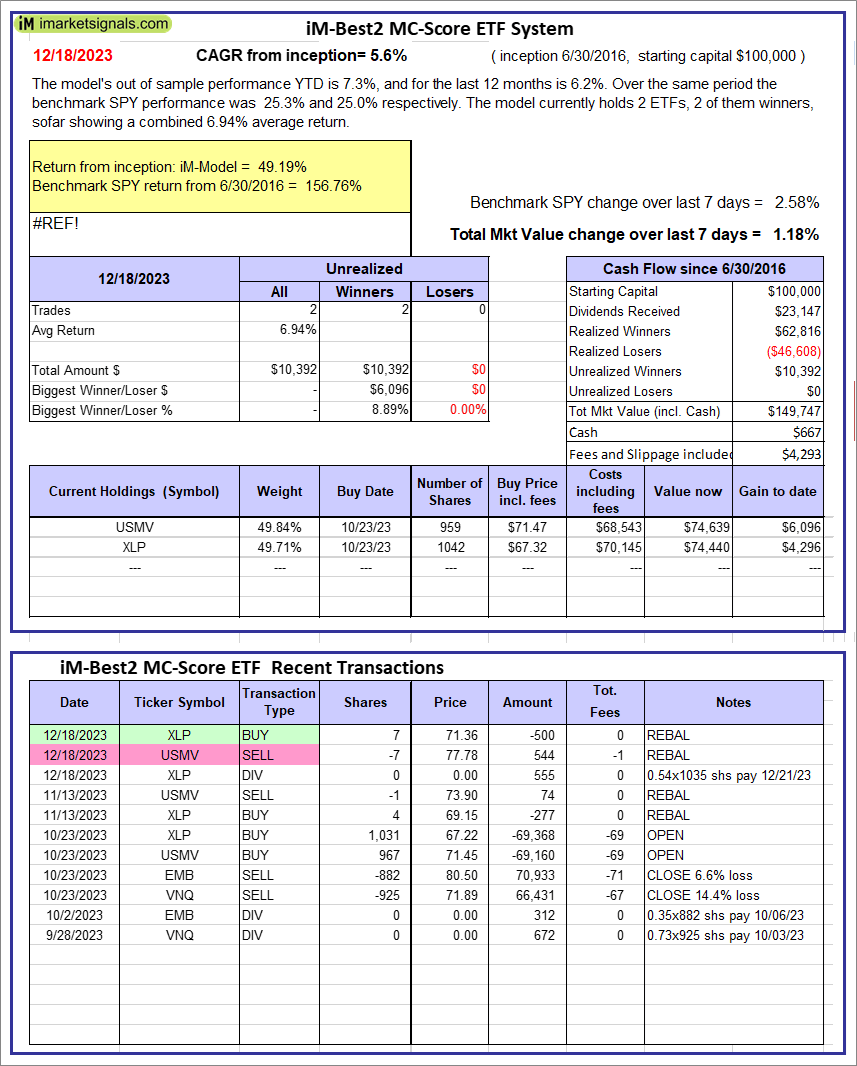 |
iM-Best2 MC-Score ETF System: The model’s out of sample performance YTD is 7.3%, and for the last 12 months is 6.2%. Over the same period the benchmark SPY performance was 25.3% and 25.0% respectively. Over the previous week the market value of the iM-Best2 MC-Score ETF System gained 1.18% at a time when SPY gained 2.58%. A starting capital of $100,000 at inception on 6/30/2016 would have grown to $149,747 which includes $667 cash and excludes $4,293 spent on fees and slippage. |
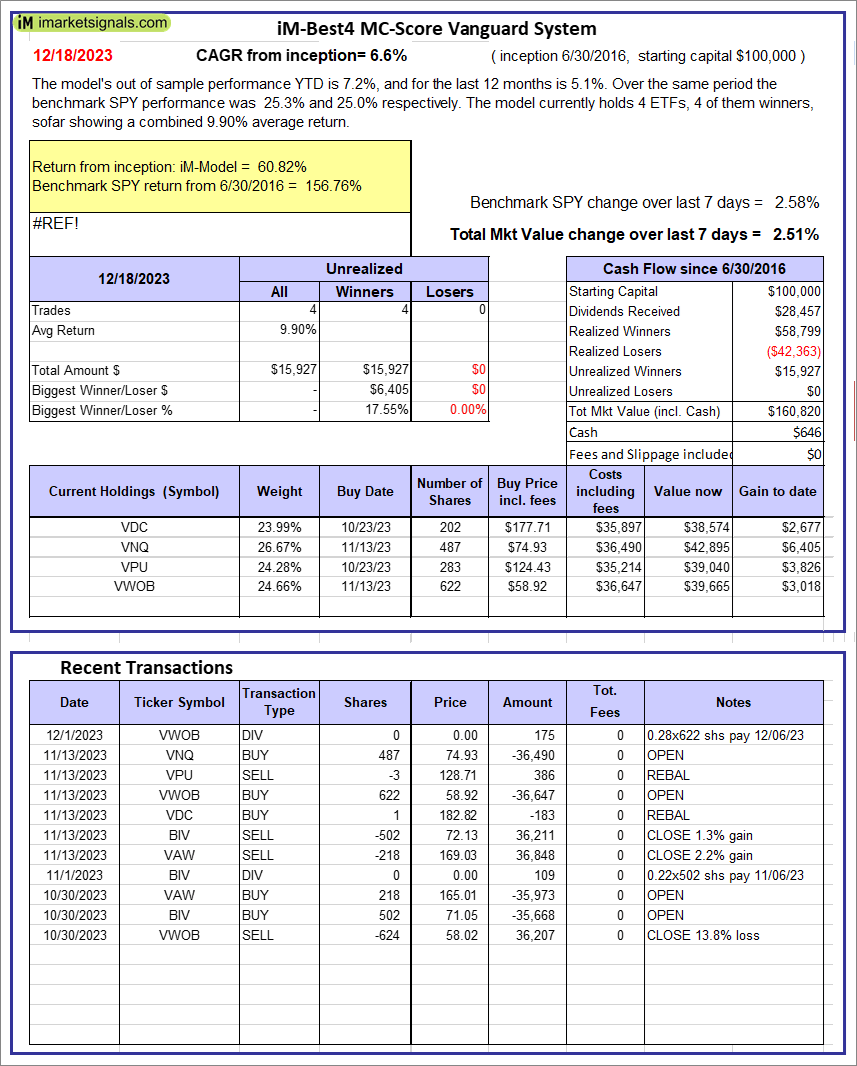 |
iM-Best4 MC-Score Vanguard System: The model’s out of sample performance YTD is 7.2%, and for the last 12 months is 5.1%. Over the same period the benchmark SPY performance was 25.3% and 25.0% respectively. Over the previous week the market value of the iM-Best4 MC-Score Vanguard System gained 2.51% at a time when SPY gained 2.58%. A starting capital of $100,000 at inception on 6/30/2016 would have grown to $160,820 which includes $646 cash and excludes $00 spent on fees and slippage. |
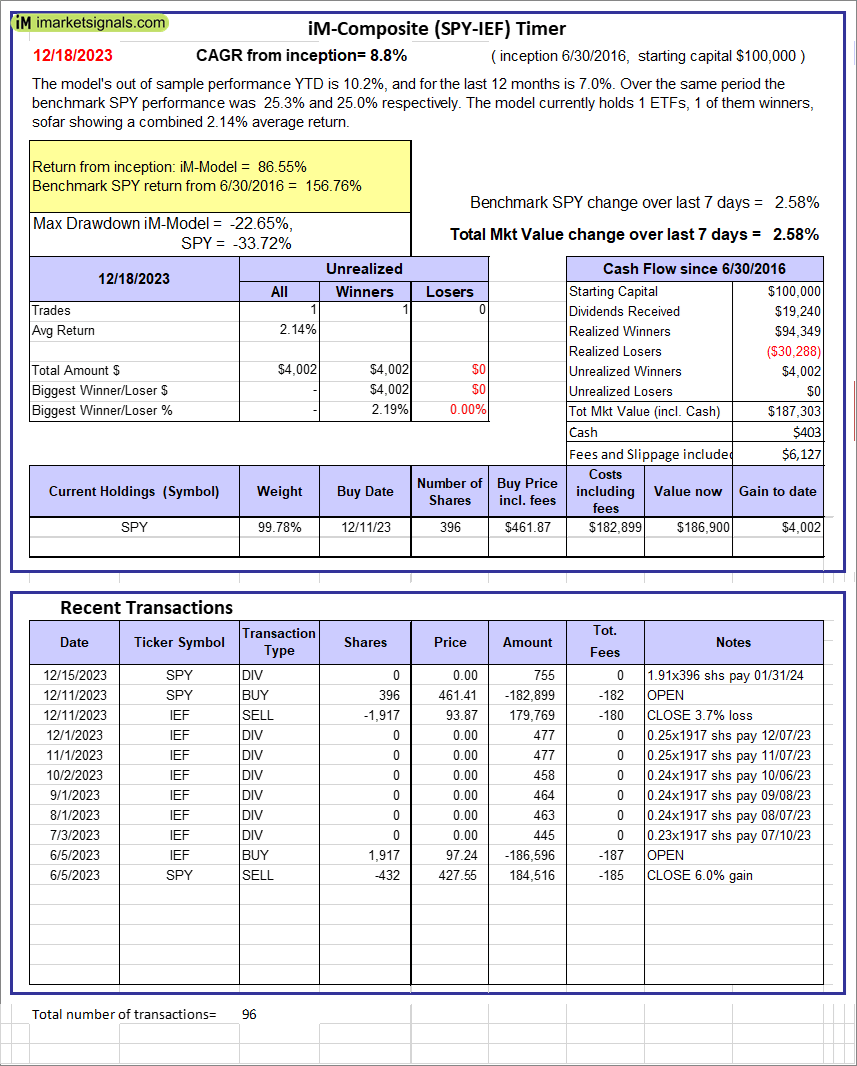 |
iM-Composite (SPY-IEF) Timer: The model’s out of sample performance YTD is 10.2%, and for the last 12 months is 7.0%. Over the same period the benchmark SPY performance was 25.3% and 25.0% respectively. Over the previous week the market value of the iM-Composite (SPY-IEF) Timer gained 2.58% at a time when SPY gained 2.58%. A starting capital of $100,000 at inception on 6/30/2016 would have grown to $187,303 which includes $403 cash and excludes $6,127 spent on fees and slippage. |
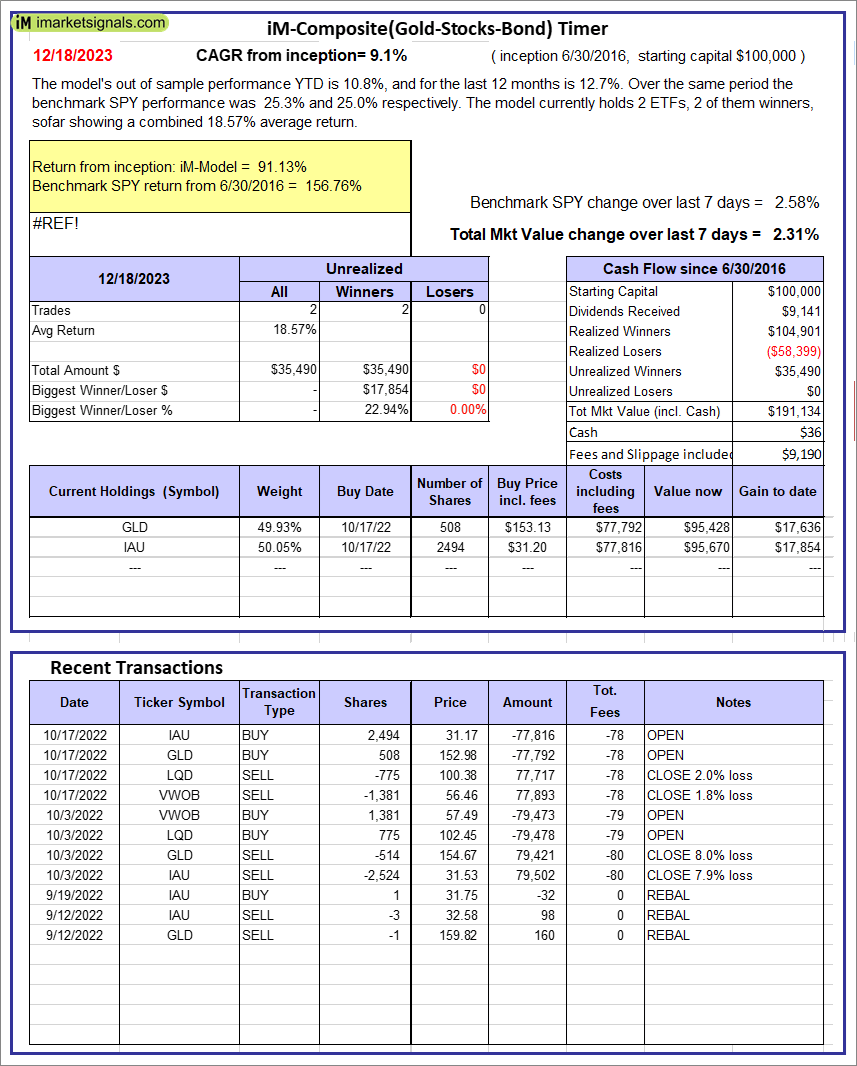 |
iM-Composite(Gold-Stocks-Bond) Timer: The model’s out of sample performance YTD is 10.8%, and for the last 12 months is 12.7%. Over the same period the benchmark SPY performance was 25.3% and 25.0% respectively. Over the previous week the market value of the iM-Composite(Gold-Stocks-Bond) Timer gained 2.31% at a time when SPY gained 2.58%. A starting capital of $100,000 at inception on 6/30/2016 would have grown to $191,134 which includes $36 cash and excludes $9,190 spent on fees and slippage. |
iM-Best Reports – 12/18/2023
Posted in pmp SPY-SH
Leave a Reply
You must be logged in to post a comment.