
  |
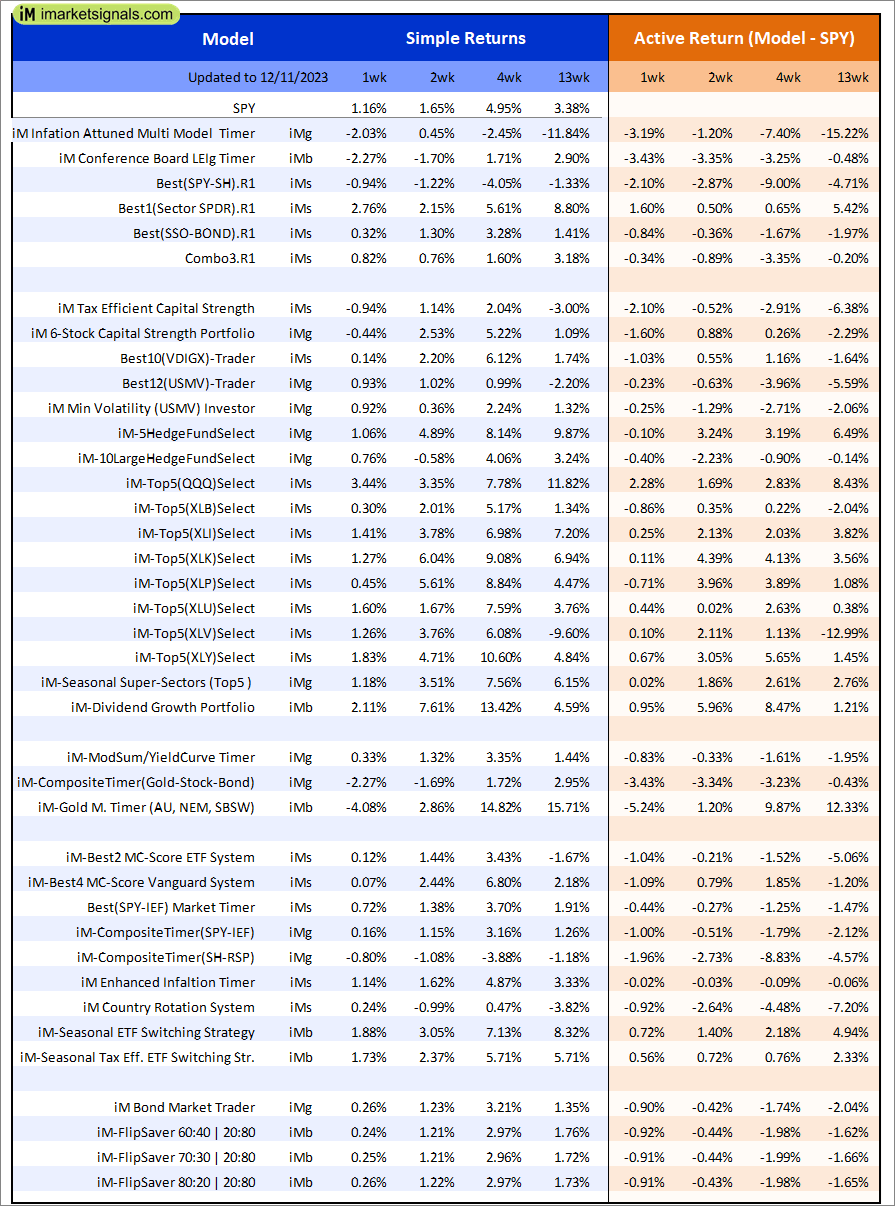
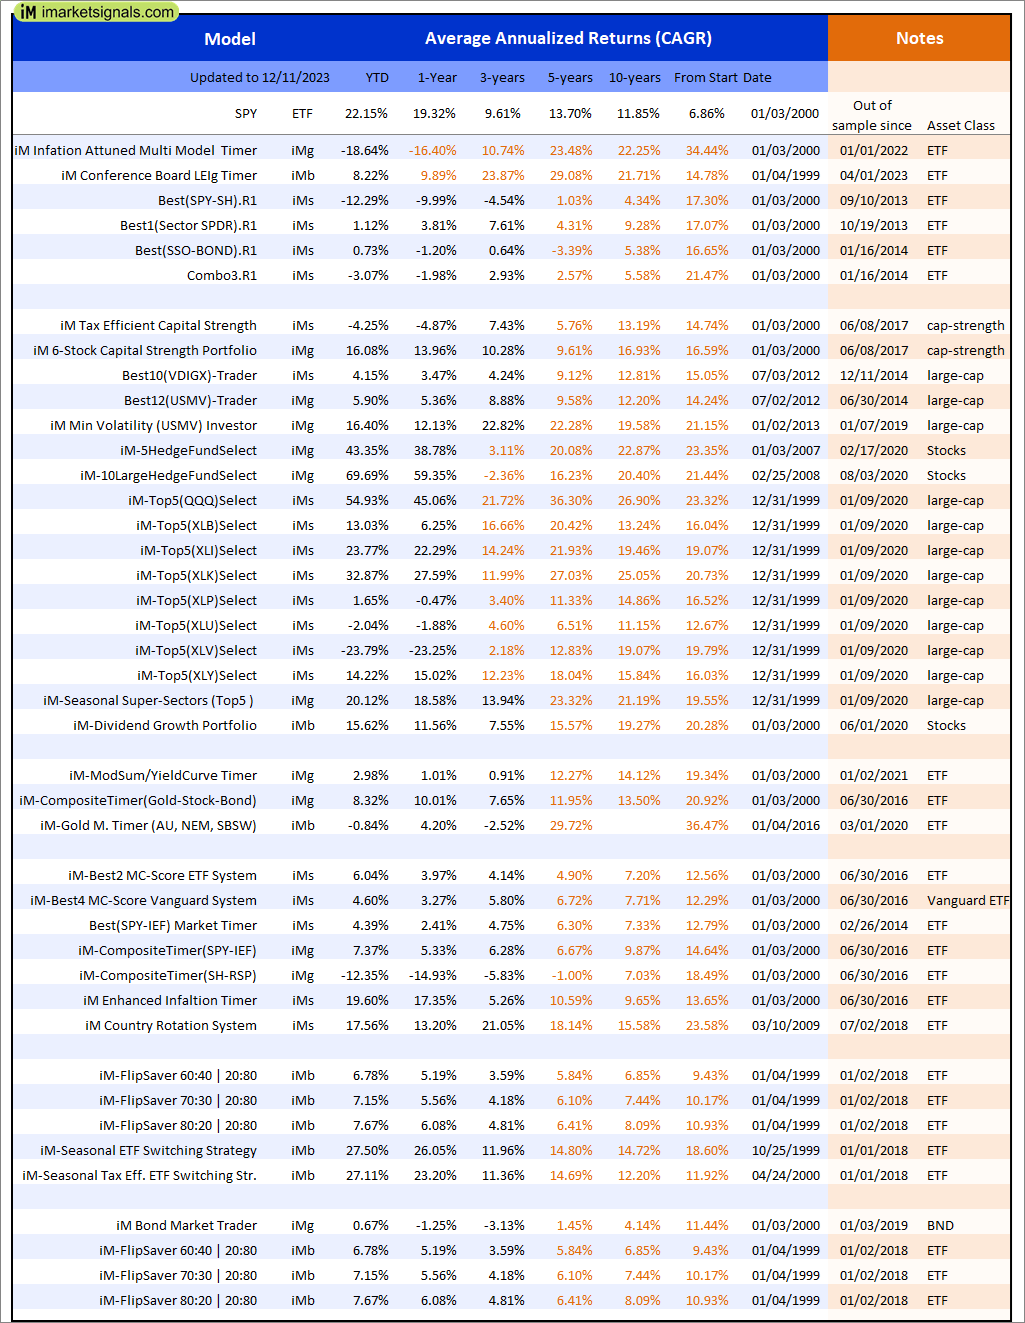
Out of sample performance summary of our models for the past 1, 2, 4 and 13 week periods. The active active return indicates how the models over- or underperformed the benchmark ETF SPY. Also the YTD, and the 1-, 3-, 5- and 10-year annualized returns are shown in the second table |
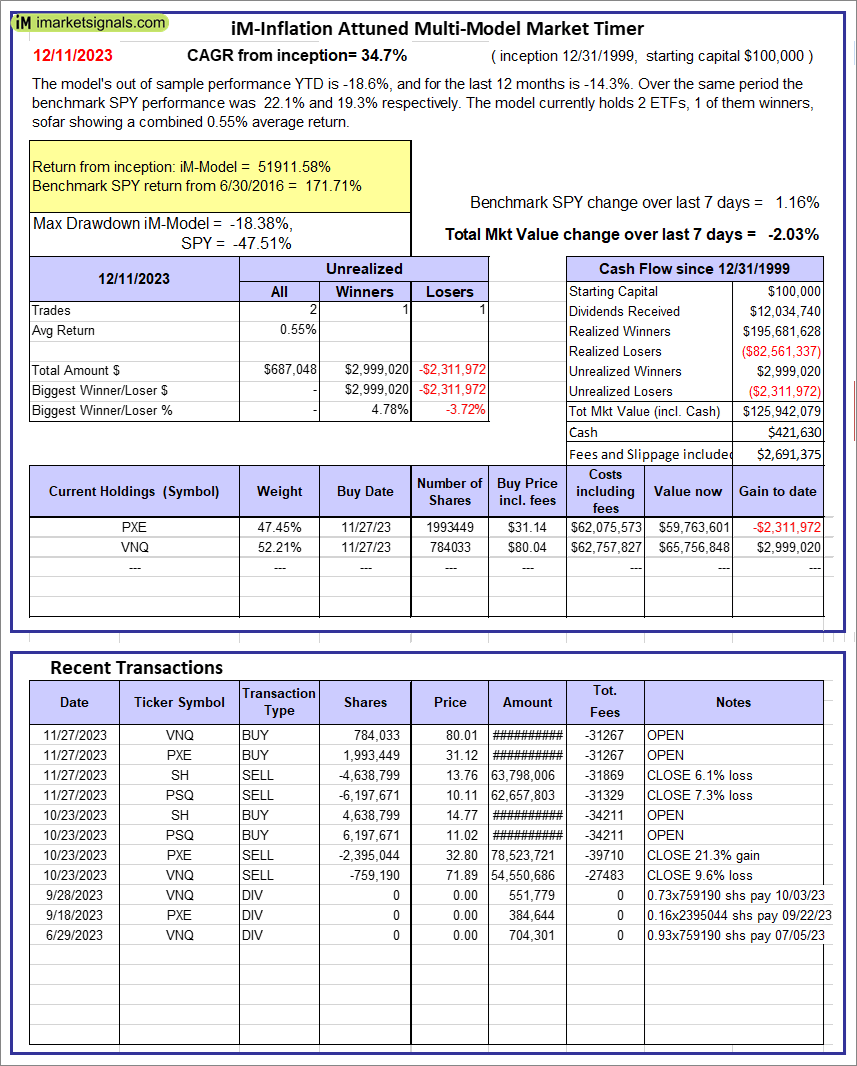 |
iM-Inflation Attuned Multi-Model Market Timer: The model’s out of sample performance YTD is -18.6%, and for the last 12 months is -14.3%. Over the same period the benchmark SPY performance was 22.1% and 19.3% respectively. Over the previous week the market value of the iM-Inflation Attuned Multi-Model Market Timer gained -2.03% at a time when SPY gained 1.16%. A starting capital of $100,000 at inception on 3/24/2017 would have grown to $125,942,079 which includes $421,630 cash and excludes $2,691,375 spent on fees and slippage. |
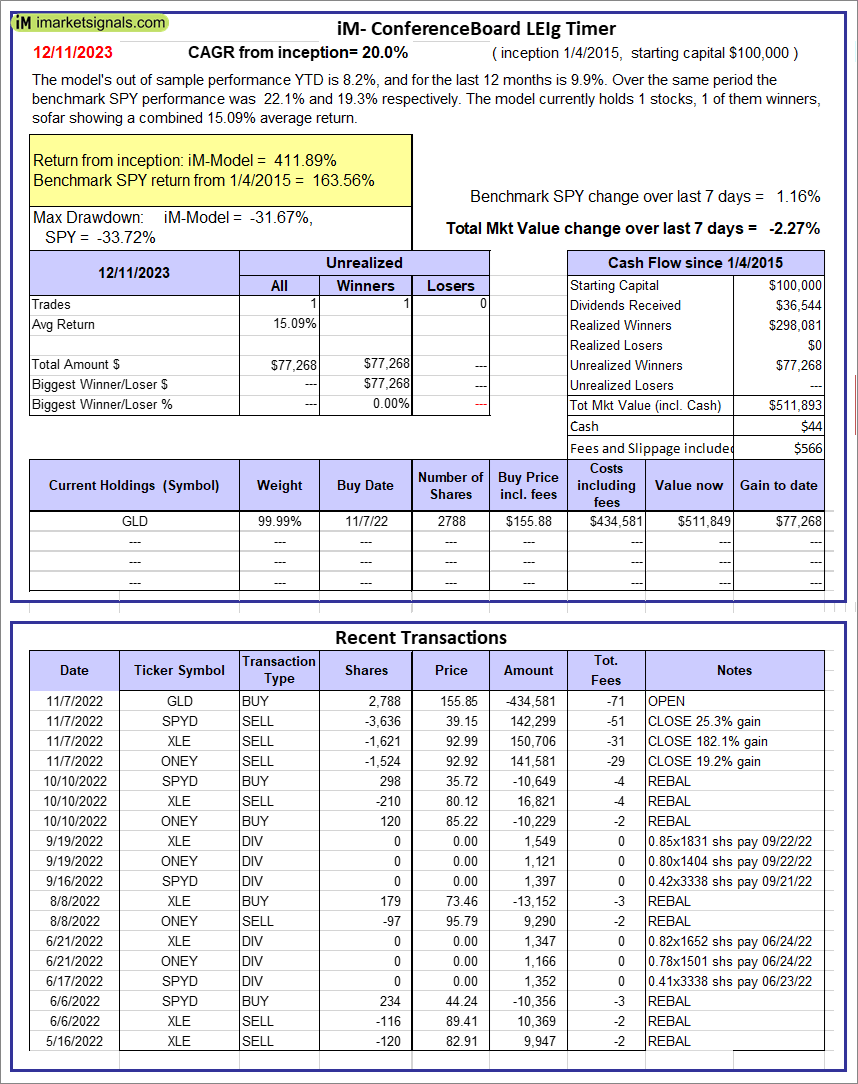 |
iM-Conference Board LEIg Timer: The model’s performance YTD is 14.3%, and for the last 12 months is 7.3%. Over the same period the benchmark SPY performance was 20.1% and 9.4% respectively. Over the previous week the market value of the iM-Conference Board LEIg Timer gained -2.27% at a time when SPY gained 1.16%. A starting capital of $100,000 at inception on 4/5/2017 would have grown to $511,893 which includes $44 cash and excludes $566 spent on fees and slippage. |
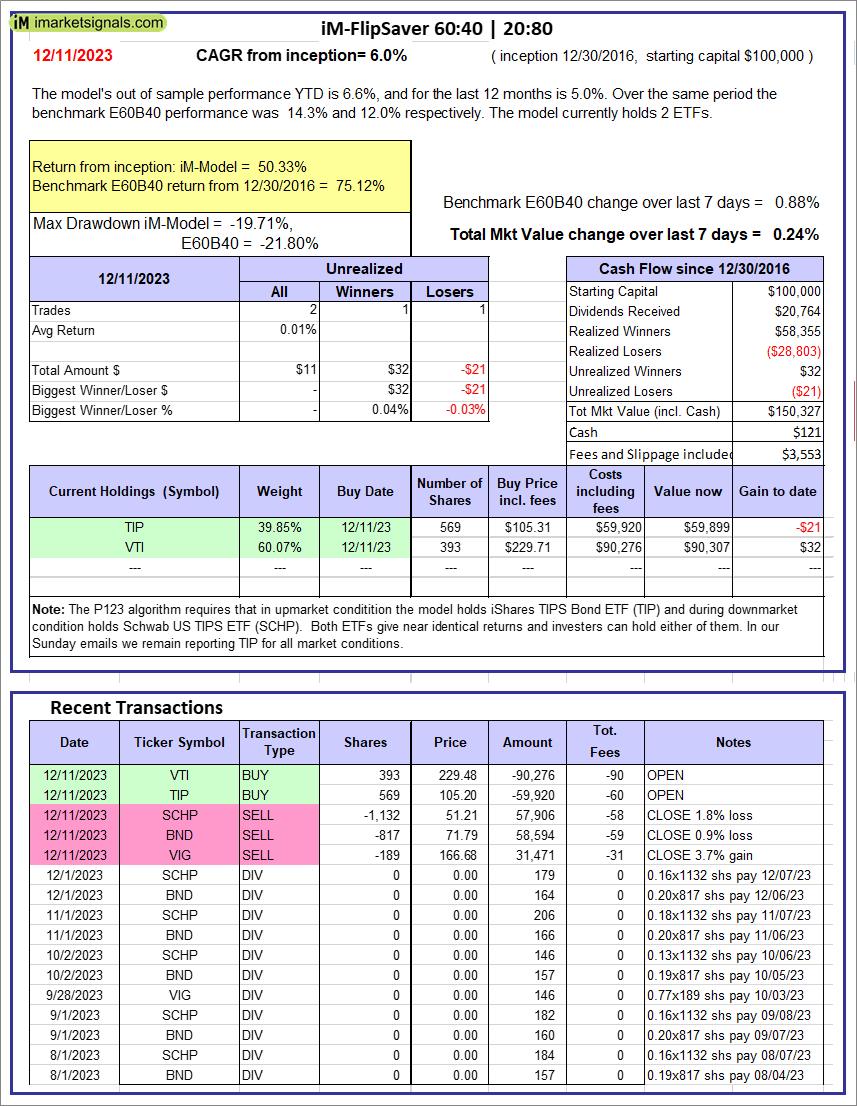 |
iM-FlipSaver 60:40 | 20:80 – 2017: The model’s out of sample performance YTD is 6.6%, and for the last 12 months is 5.0%. Over the same period the benchmark E60B40 performance was 14.3% and 12.0% respectively. Over the previous week the market value of iM-FlipSaver 80:20 | 20:80 gained 0.24% at a time when SPY gained 0.88%. A starting capital of $100,000 at inception on 7/16/2015 would have grown to $150,327 which includes $121 cash and excludes $3,553 spent on fees and slippage. |
 |
iM-FlipSaver 70:30 | 20:80 – 2017: The model’s out of sample performance YTD is 7.1%, and for the last 12 months is 5.6%. Over the same period the benchmark E60B40 performance was 14.3% and 12.0% respectively. Over the previous week the market value of iM-FlipSaver 70:30 | 20:80 gained 0.25% at a time when SPY gained 0.88%. A starting capital of $100,000 at inception on 7/15/2015 would have grown to $155,347 which includes $3 cash and excludes $3,740 spent on fees and slippage. |
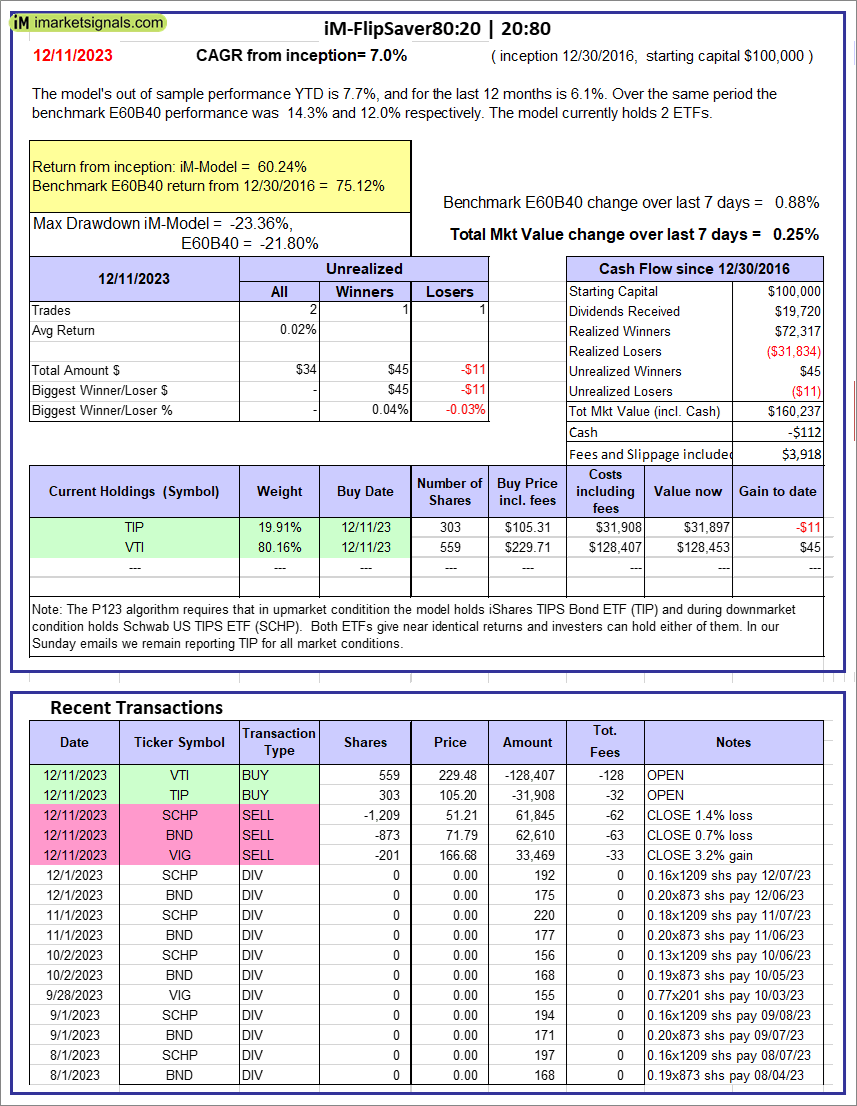 |
iM-FlipSaver 80:20 | 20:80 – 2017: The model’s out of sample performance YTD is 7.7%, and for the last 12 months is 6.1%. Over the same period the benchmark E60B40 performance was 14.3% and 12.0% respectively. Over the previous week the market value of iM-FlipSaver 80:20 | 20:80 gained 0.25% at a time when SPY gained 0.88%. A starting capital of $100,000 at inception on 1/2/2017 would have grown to $160,237 which includes -$112 cash and excludes $3,918 spent on fees and slippage. |
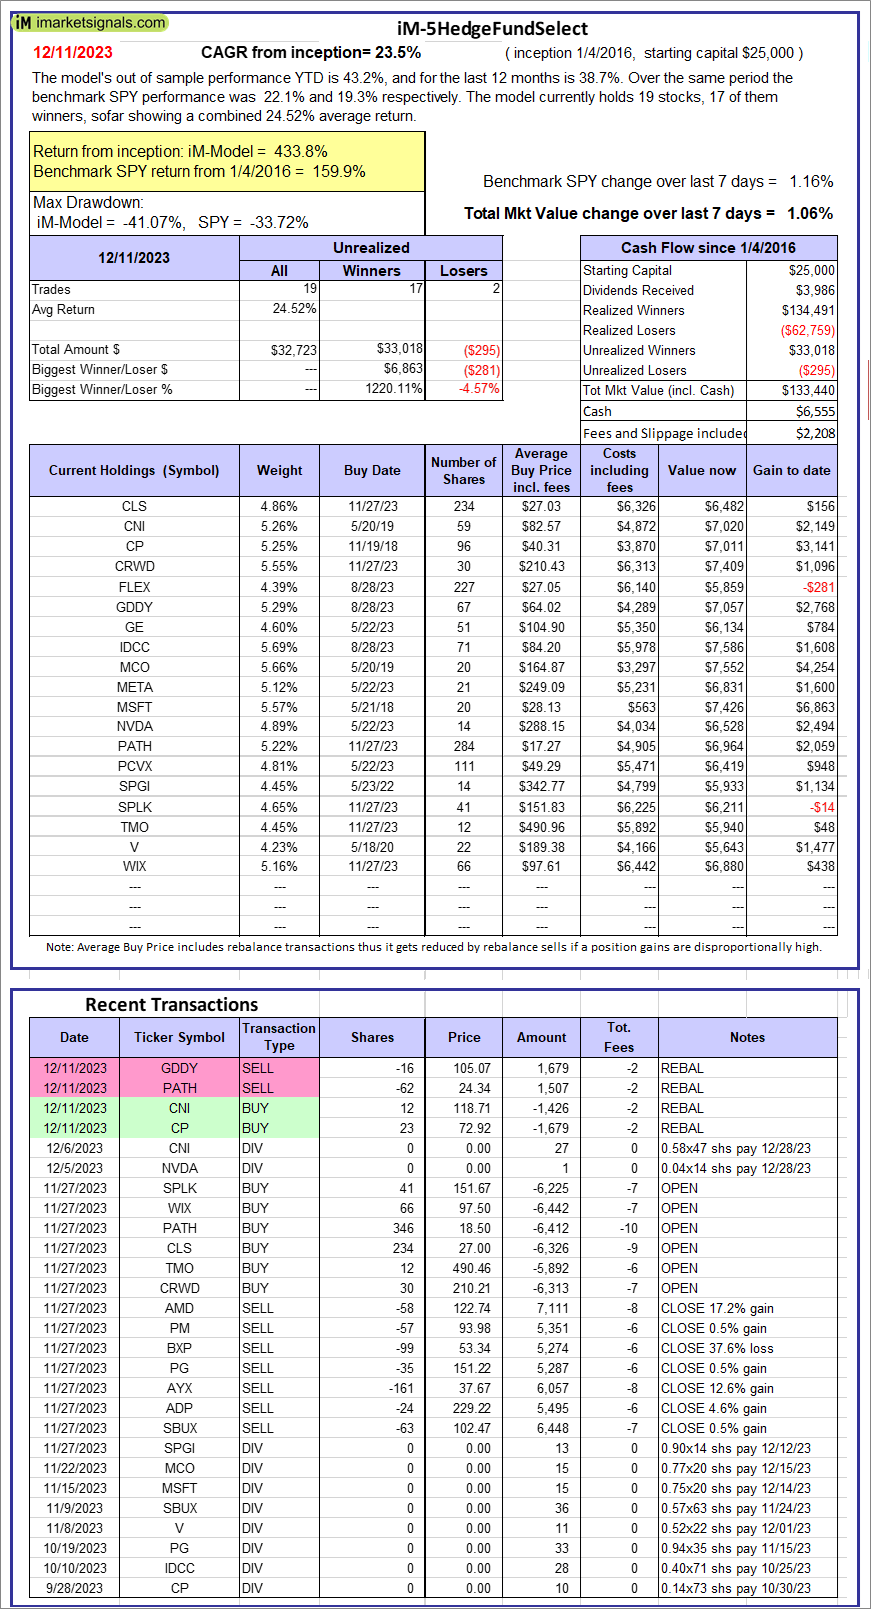 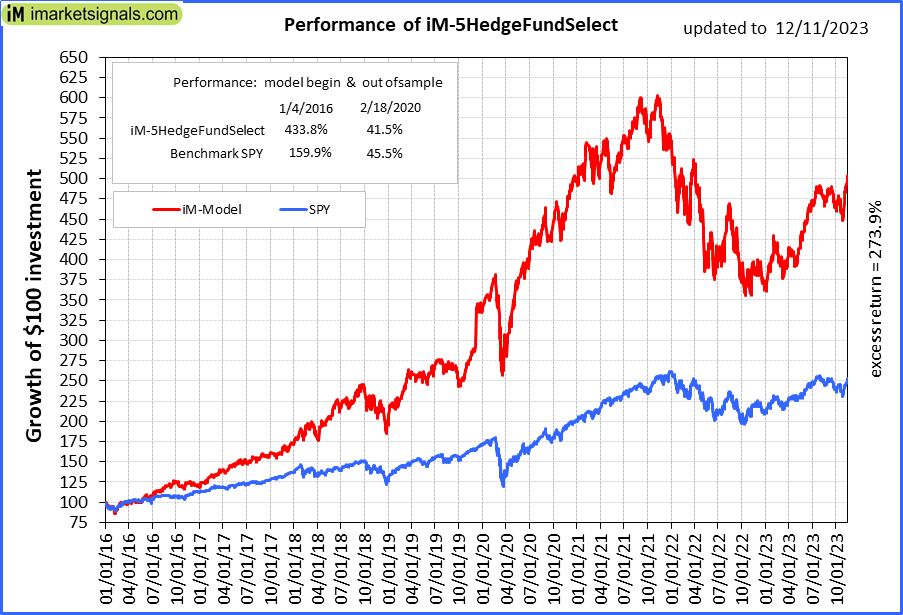 |
iM-5HedgeFundSelect: Since inception, on 1/5/2016, the model gained 433.76% while the benchmark SPY gained 159.87% over the same period. Over the previous week the market value of iM-5HedgeFundSelect gained 1.06% at a time when SPY gained 1.16%. A starting capital of $25,000 at inception on 1/5/2016 would have grown to $133,440 which includes $6,555 cash and excludes $2,208 spent on fees and slippage. |
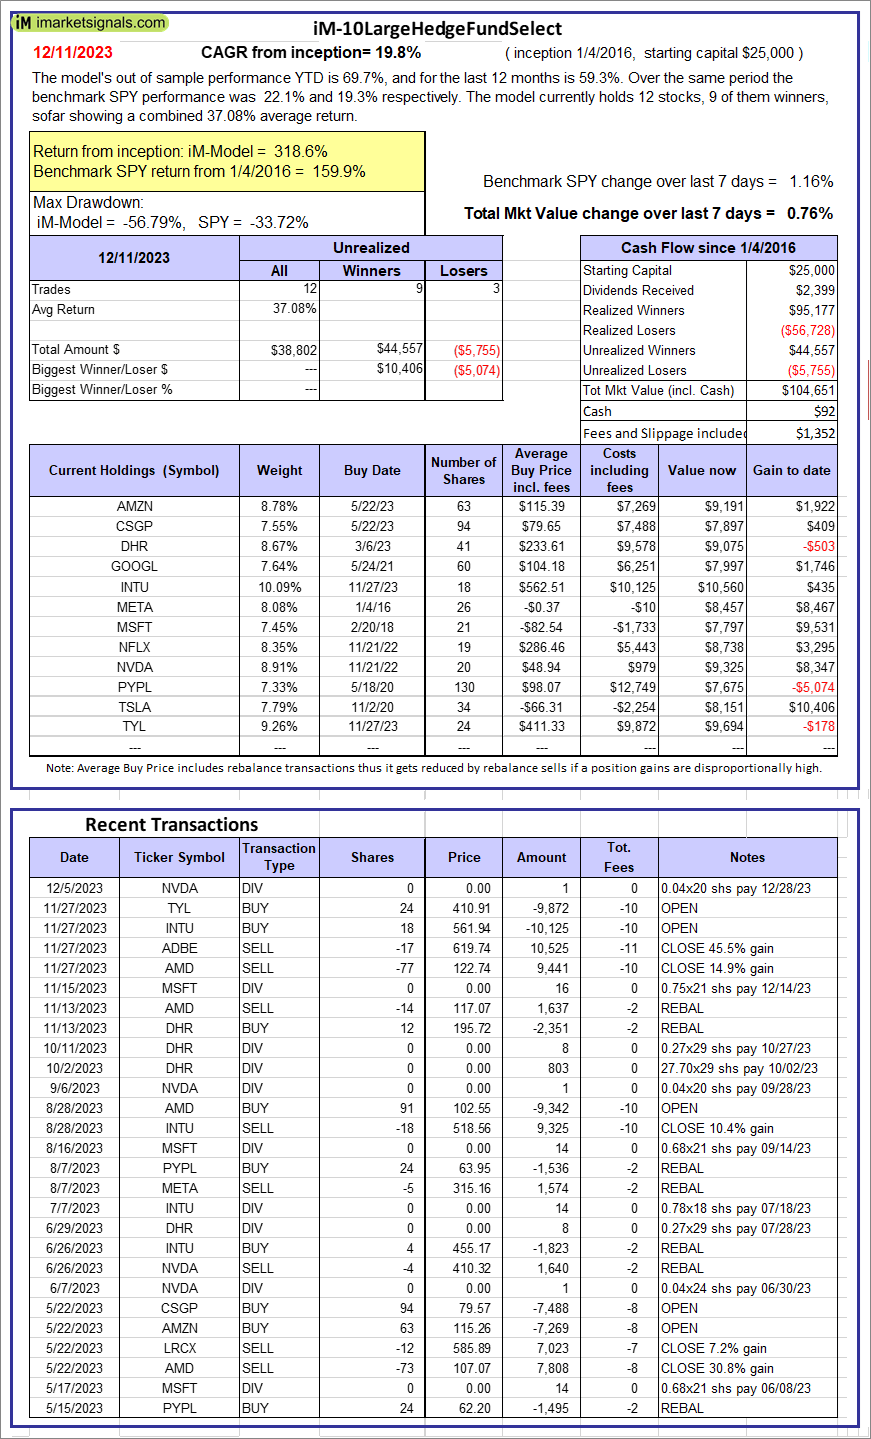 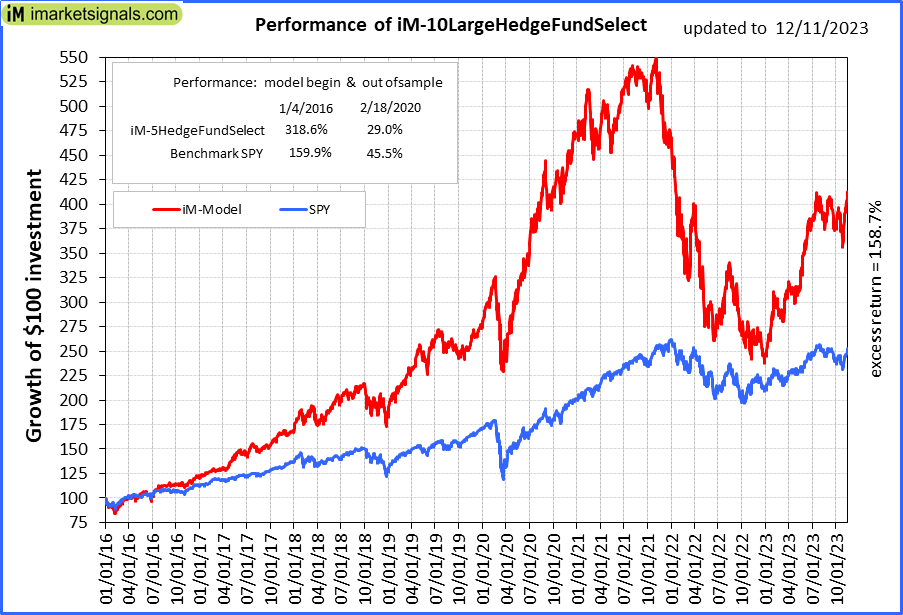 |
iM-10LargeHedgeFundSelect: Since inception, on 1/5/2016, the model gained 318.60% while the benchmark SPY gained 159.87% over the same period. Over the previous week the market value of iM-10LargeHedgeFundSelect gained 0.76% at a time when SPY gained 1.16%. A starting capital of $25,000 at inception on 1/5/2016 would have grown to $104,651 which includes $92 cash and excludes $1,352 spent on fees and slippage. |
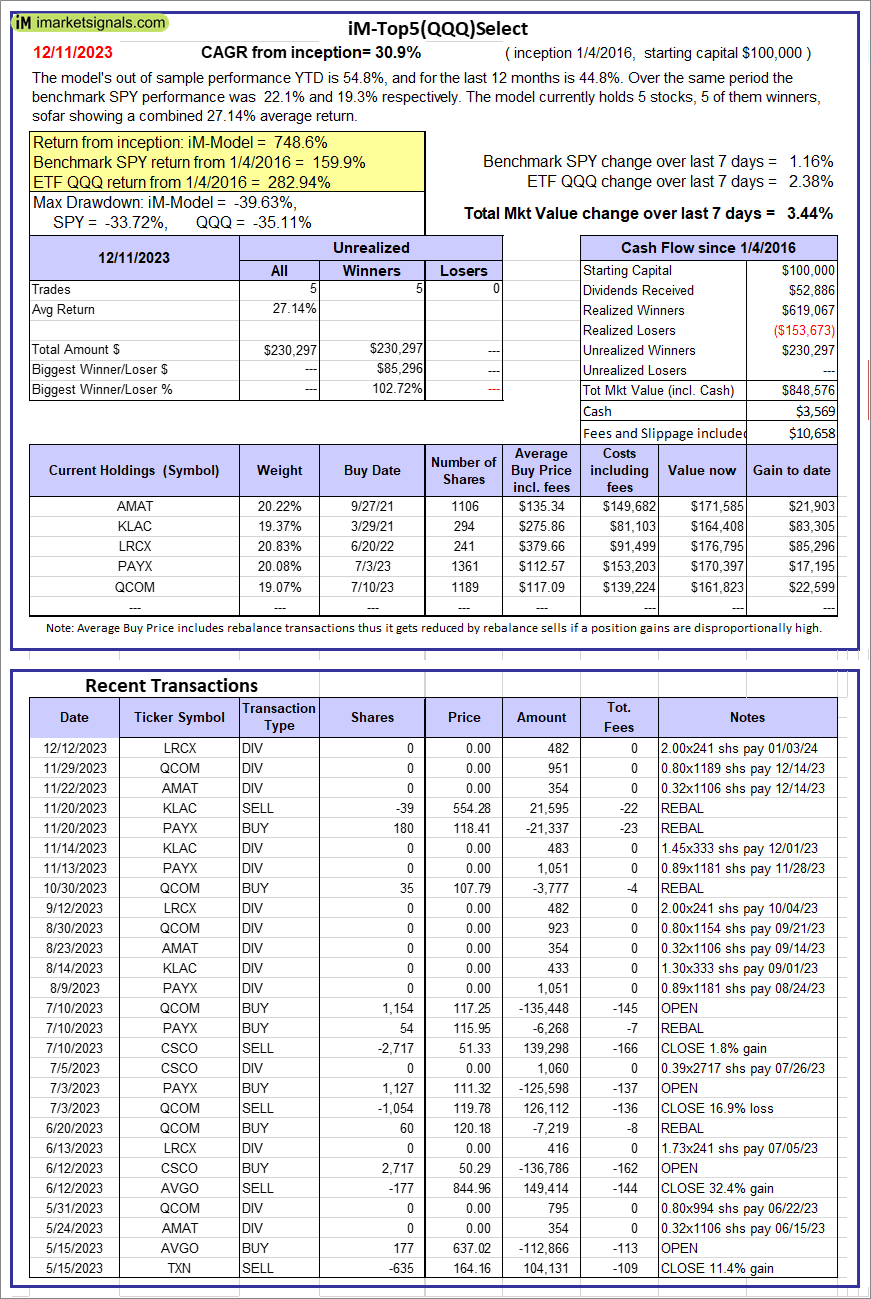 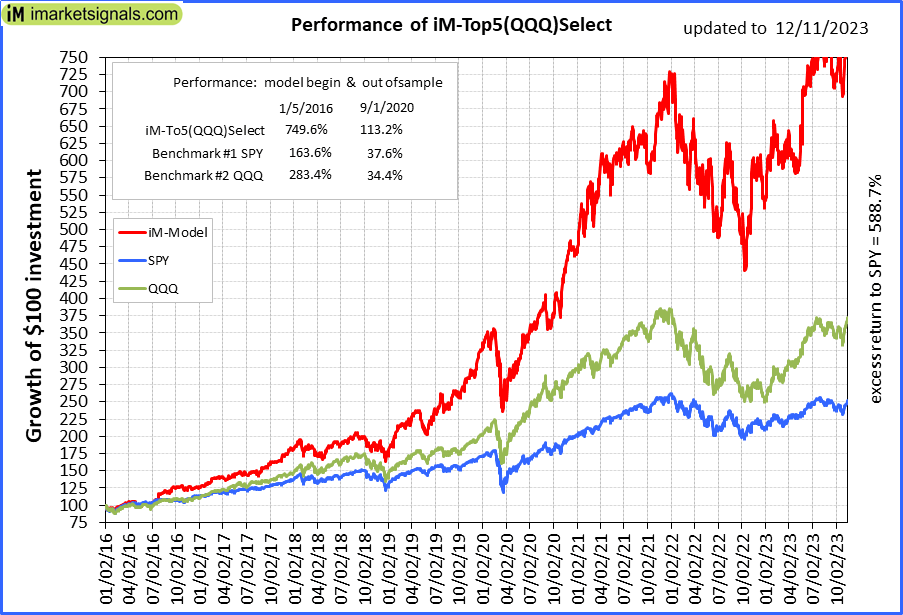 |
iM-Top5(QQQ)Select: Since inception, on 1/5/2016, the model gained 748.58% while the benchmark SPY gained 159.87% over the same period. Over the previous week the market value of iM-Top5(QQQ)Select gained 3.44% at a time when SPY gained 1.16%. A starting capital of $100,000 at inception on 1/5/2016 would have grown to $848,576 which includes $3,569 cash and excludes $10,658 spent on fees and slippage. |
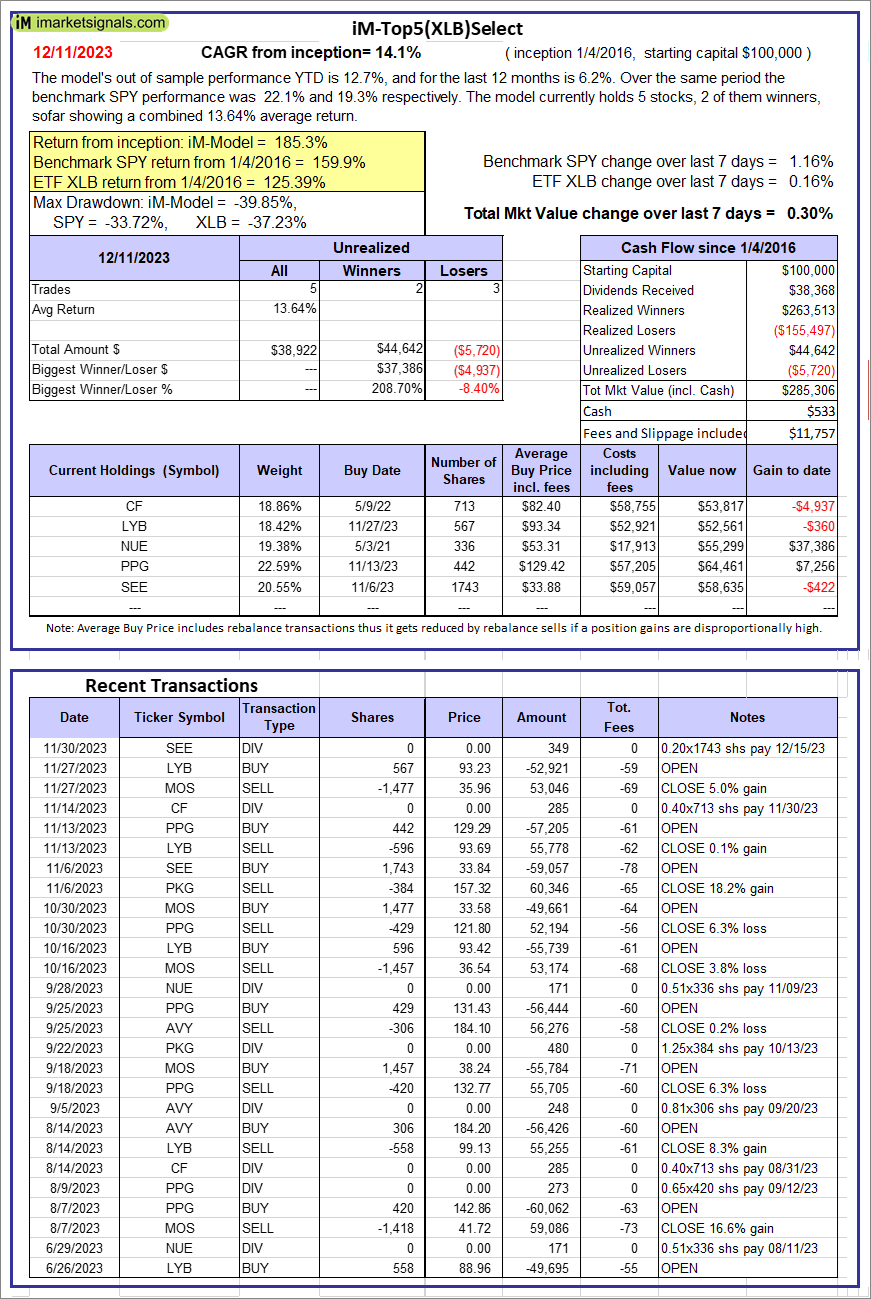 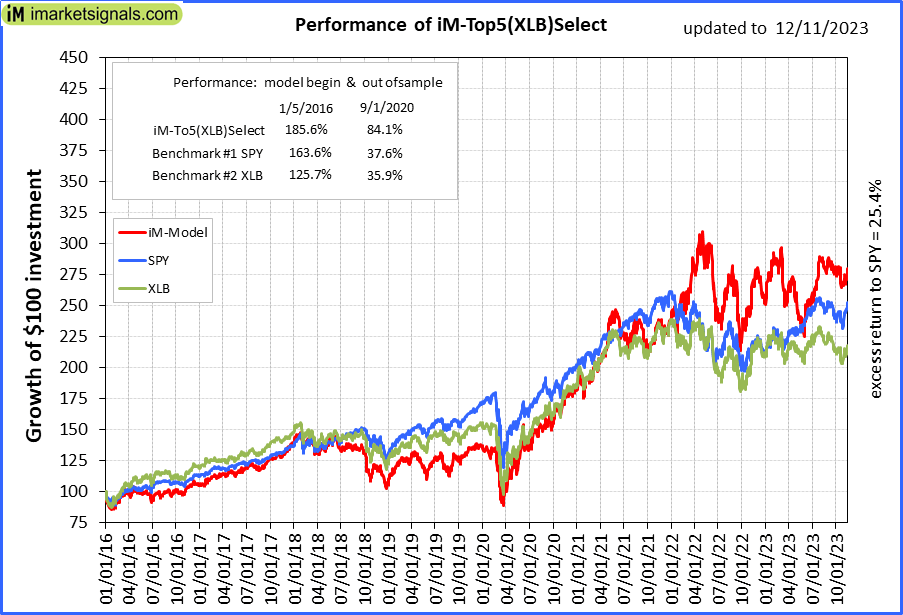 |
iM-Top5(XLB)Select: Since inception, on 1/5/2016, the model gained 185.31% while the benchmark SPY gained 159.87% over the same period. Over the previous week the market value of iM-Top5(XLB)Select gained 0.30% at a time when SPY gained 1.16%. A starting capital of $100,000 at inception on 1/5/2016 would have grown to $285,306 which includes $533 cash and excludes $11,757 spent on fees and slippage. |
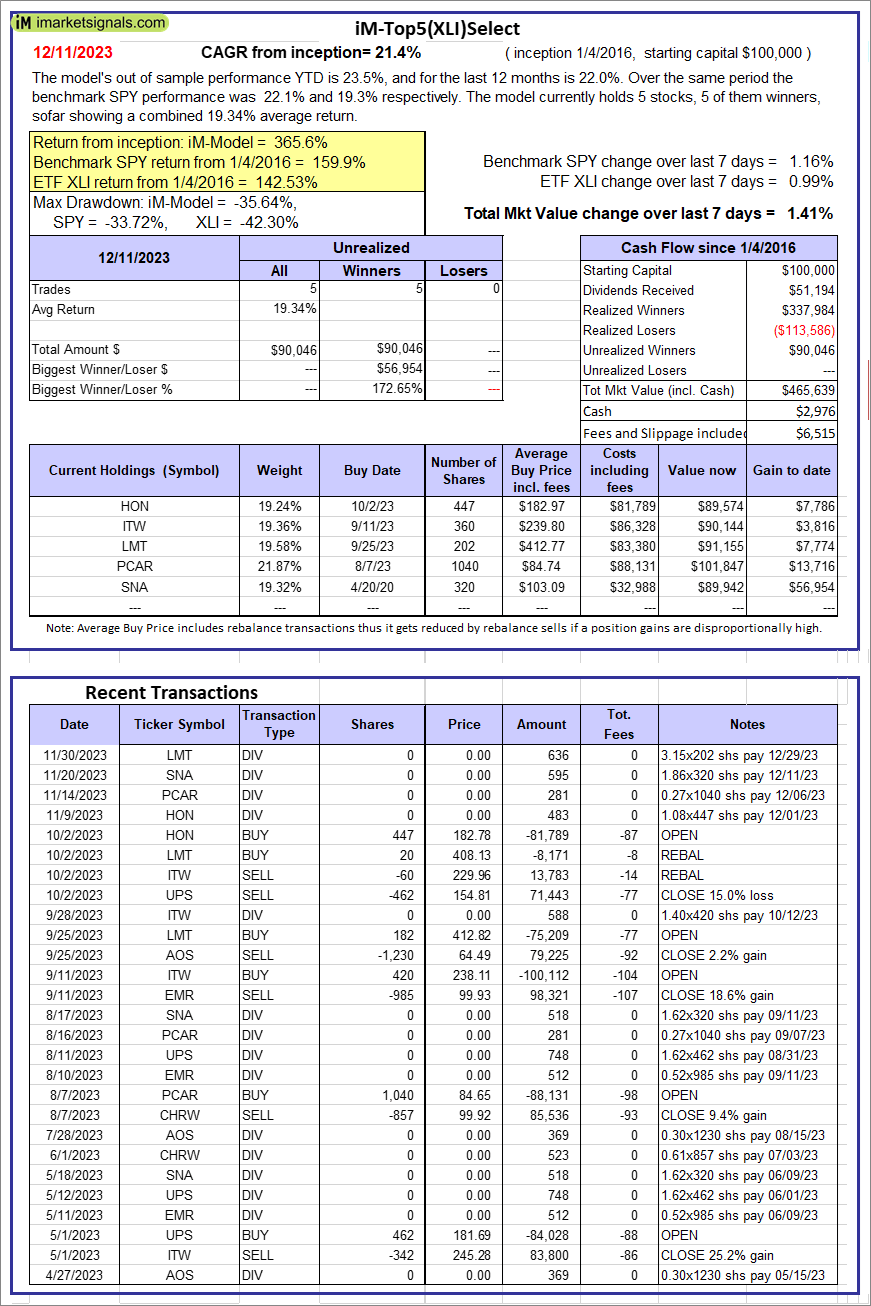 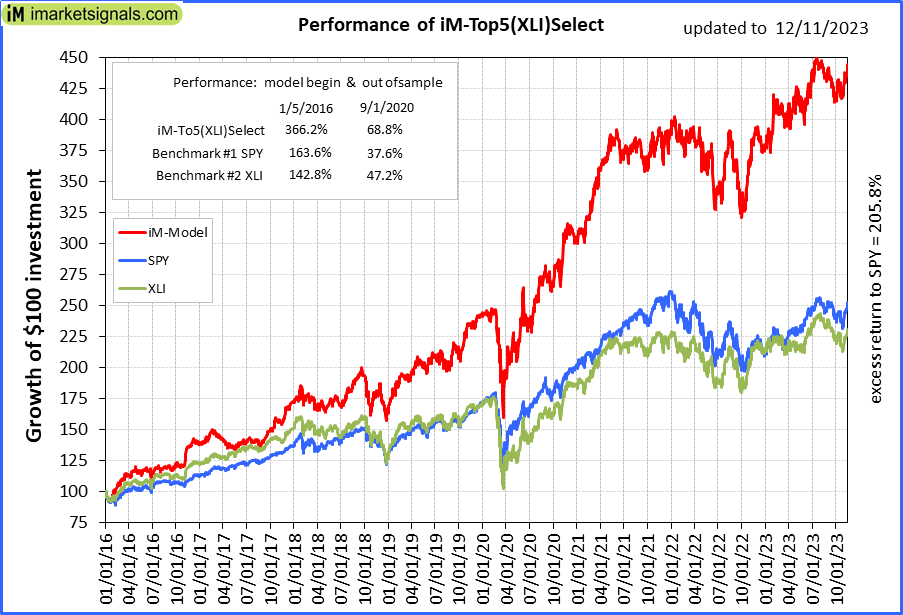 |
iM-Top5(XLI)Select: Since inception, on 1/5/2016, the model gained 365.64% while the benchmark SPY gained 159.87% over the same period. Over the previous week the market value of iM-Top5(XLI)Select gained 1.41% at a time when SPY gained 1.16%. A starting capital of $100,000 at inception on 1/5/2016 would have grown to $465,639 which includes $2,976 cash and excludes $6,515 spent on fees and slippage. |
 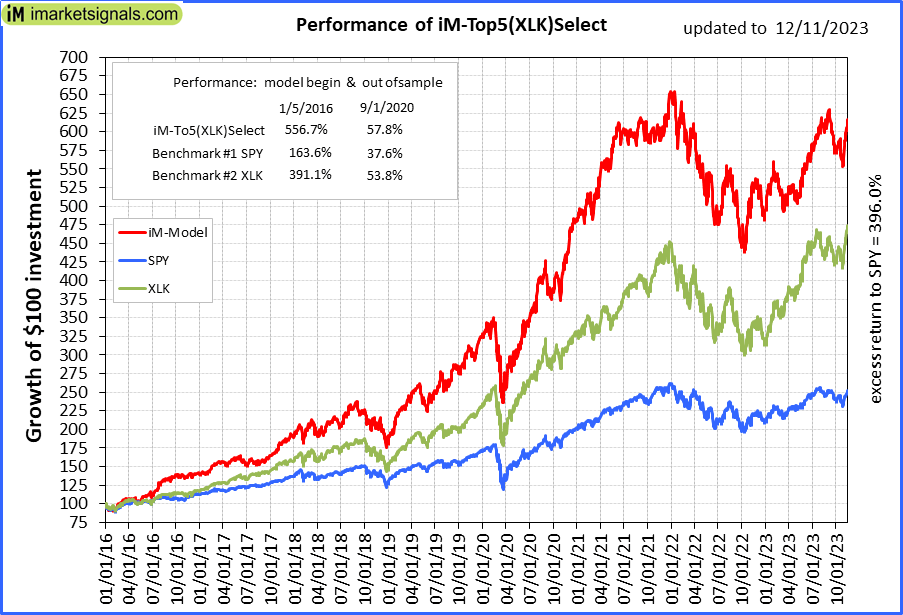 |
iM-Top5(XLK)Select: Since inception, on 1/5/2016, the model gained 555.86% while the benchmark SPY gained 159.87% over the same period. Over the previous week the market value of iM-Top5(XLK)Select gained 1.27% at a time when SPY gained 1.16%. A starting capital of $100,000 at inception on 1/5/2016 would have grown to $655,863 which includes $1,726 cash and excludes $2,085 spent on fees and slippage. |
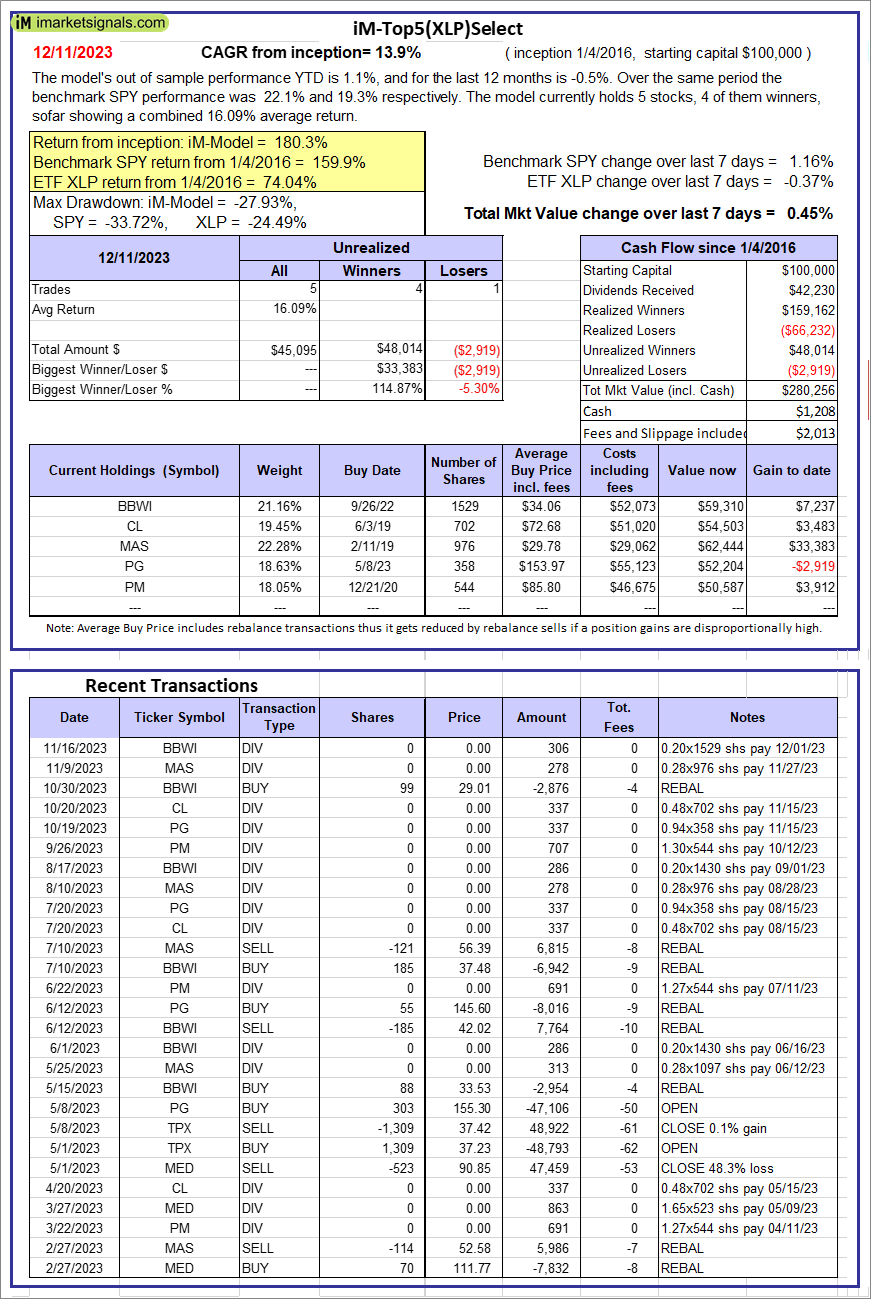  |
iM-Top5(XLP)Select: Since inception, on 1/5/2016, the model gained 180.26% while the benchmark SPY gained 159.87% over the same period. Over the previous week the market value of iM-Top5(XLP)Select gained 0.45% at a time when SPY gained 1.16%. A starting capital of $100,000 at inception on 1/5/2016 would have grown to $280,256 which includes $1,208 cash and excludes $2,013 spent on fees and slippage. |
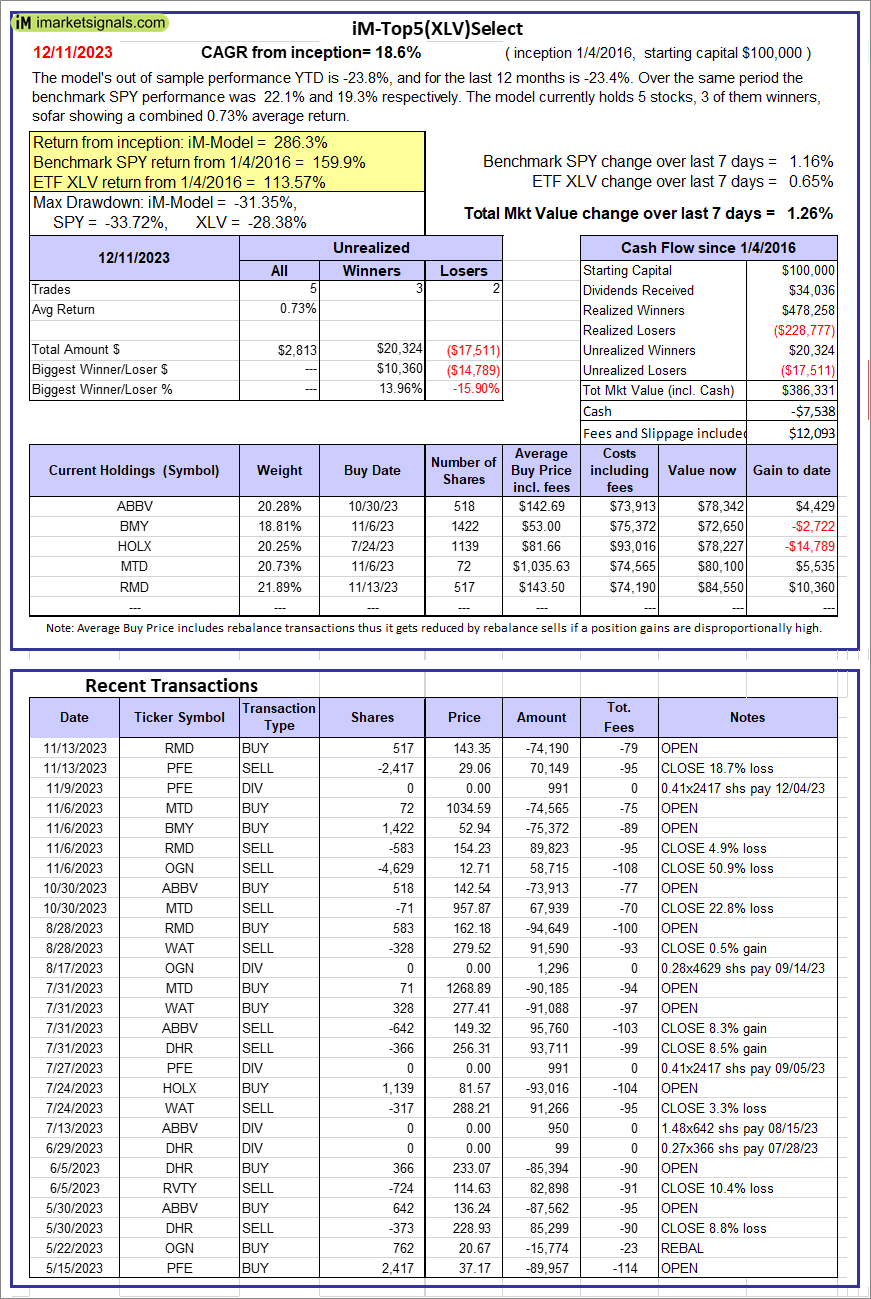 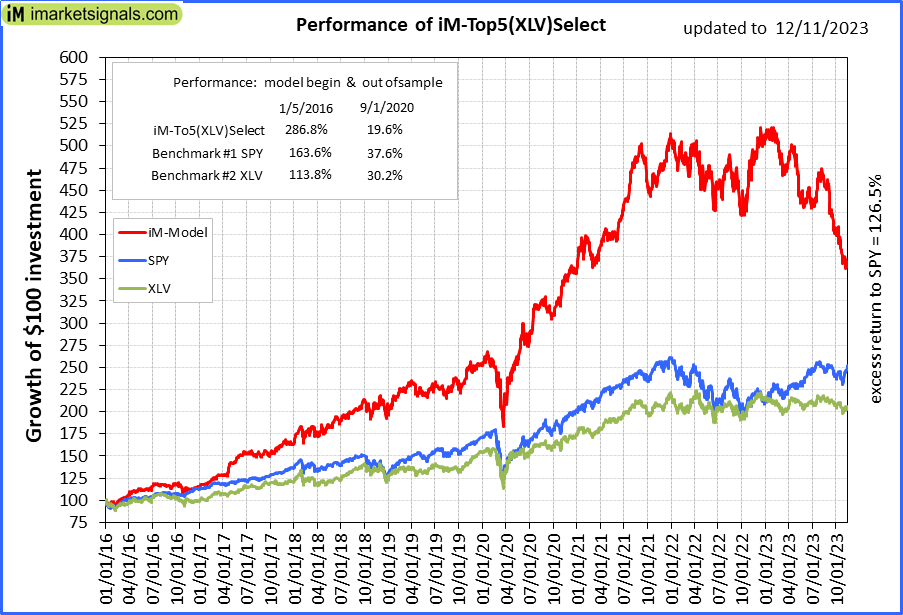 |
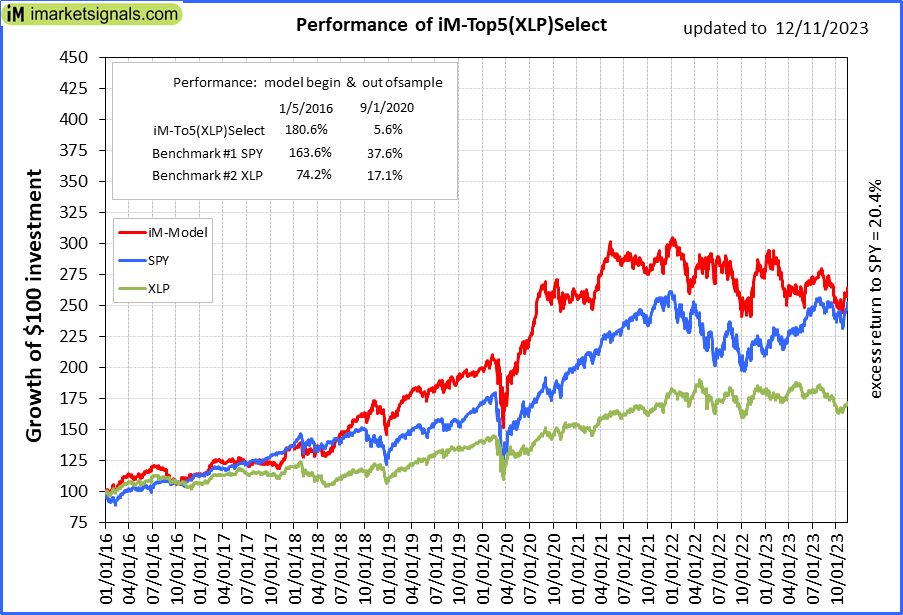
iM-Top5(XLV)Select: Since inception, on 1/5/2016, the model gained 286.33% while the benchmark SPY gained 159.87% over the same period. Over the previous week the market value of iM-Top5(XLV)Select gained 1.26% at a time when SPY gained 1.16%. A starting capital of $100,000 at inception on 1/5/2016 would have grown to $386,331 which includes -$7,538 cash and excludes $12,093 spent on fees and slippage. |
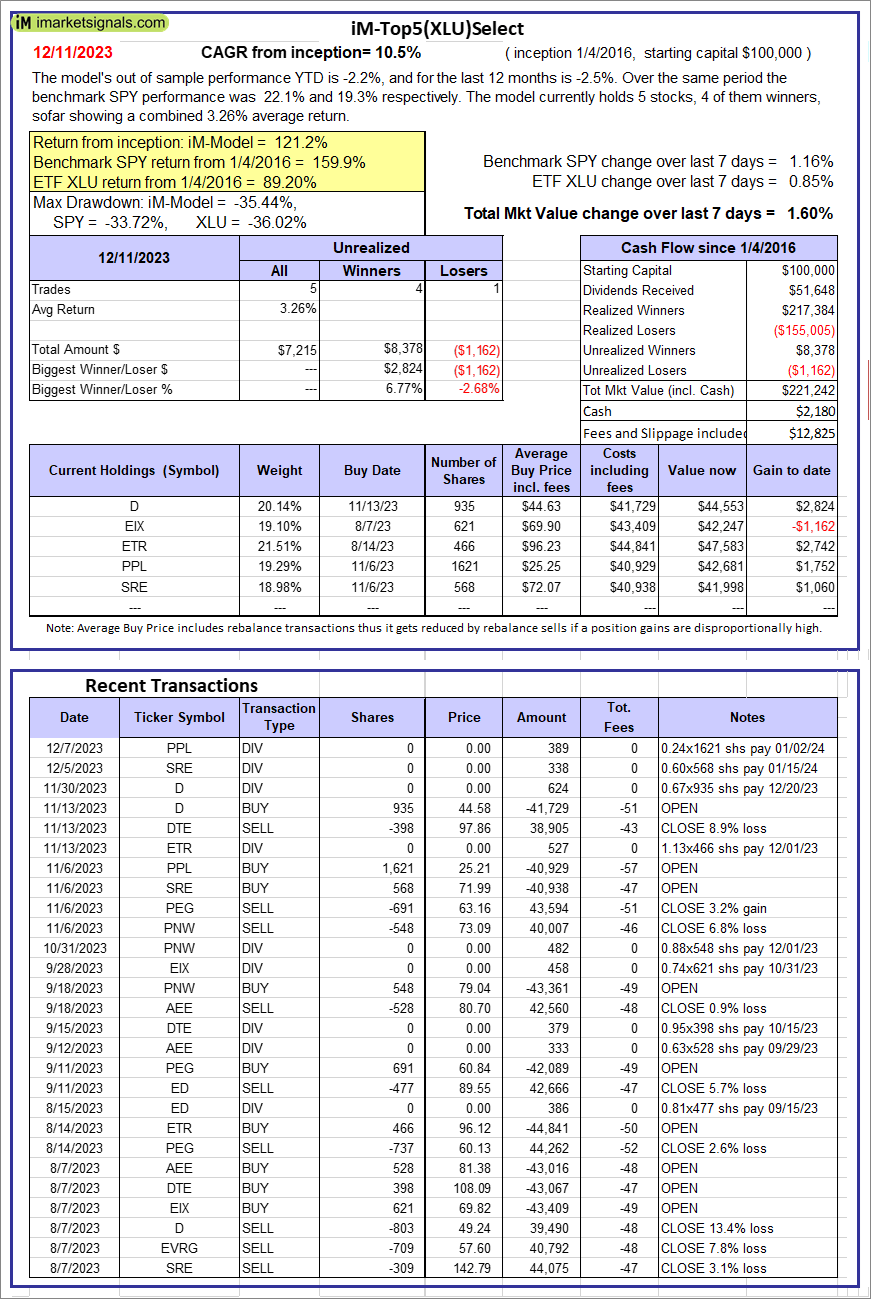 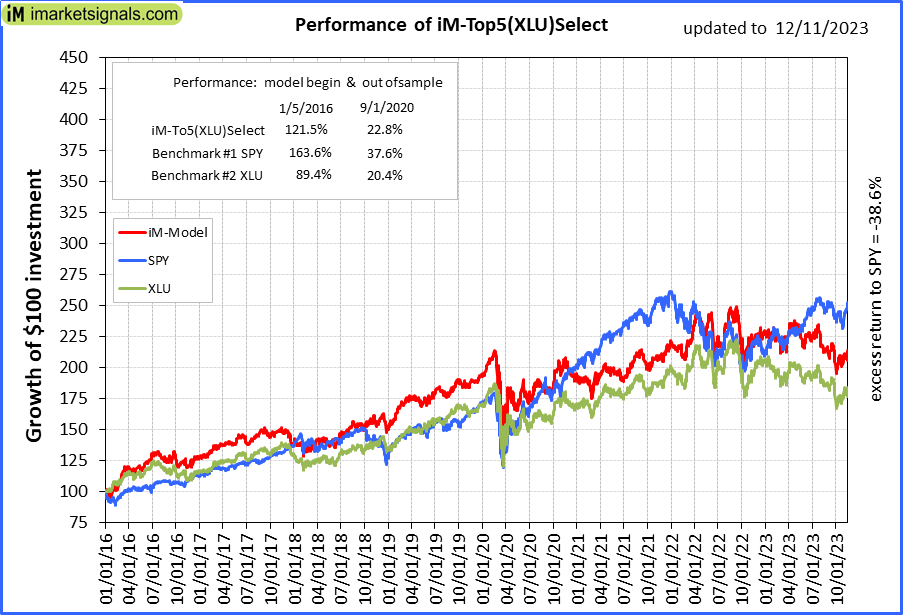 |
iM-Top5(XLU)Select: Since inception, on 1/5/2016, the model gained 121.24% while the benchmark SPY gained 159.87% over the same period. Over the previous week the market value of iM-Top5(XLU)Select gained 1.60% at a time when SPY gained 1.16%. A starting capital of $100,000 at inception on 1/5/2016 would have grown to $221,242 which includes $2,180 cash and excludes $12,825 spent on fees and slippage. |
 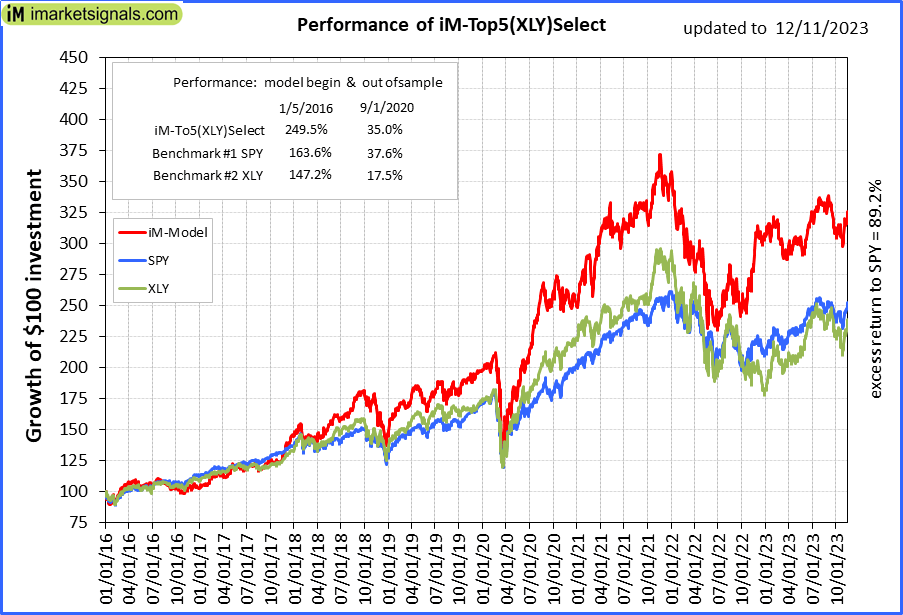 |
iM-Top5(XLY)Select: Since inception, on 1/5/2016, the model gained 249.06% while the benchmark SPY gained 159.87% over the same period. Over the previous week the market value of iM-Top5(XLY)Select gained 1.83% at a time when SPY gained 1.16%. A starting capital of $100,000 at inception on 1/5/2016 would have grown to $349,063 which includes $910 cash and excludes $6,155 spent on fees and slippage. |
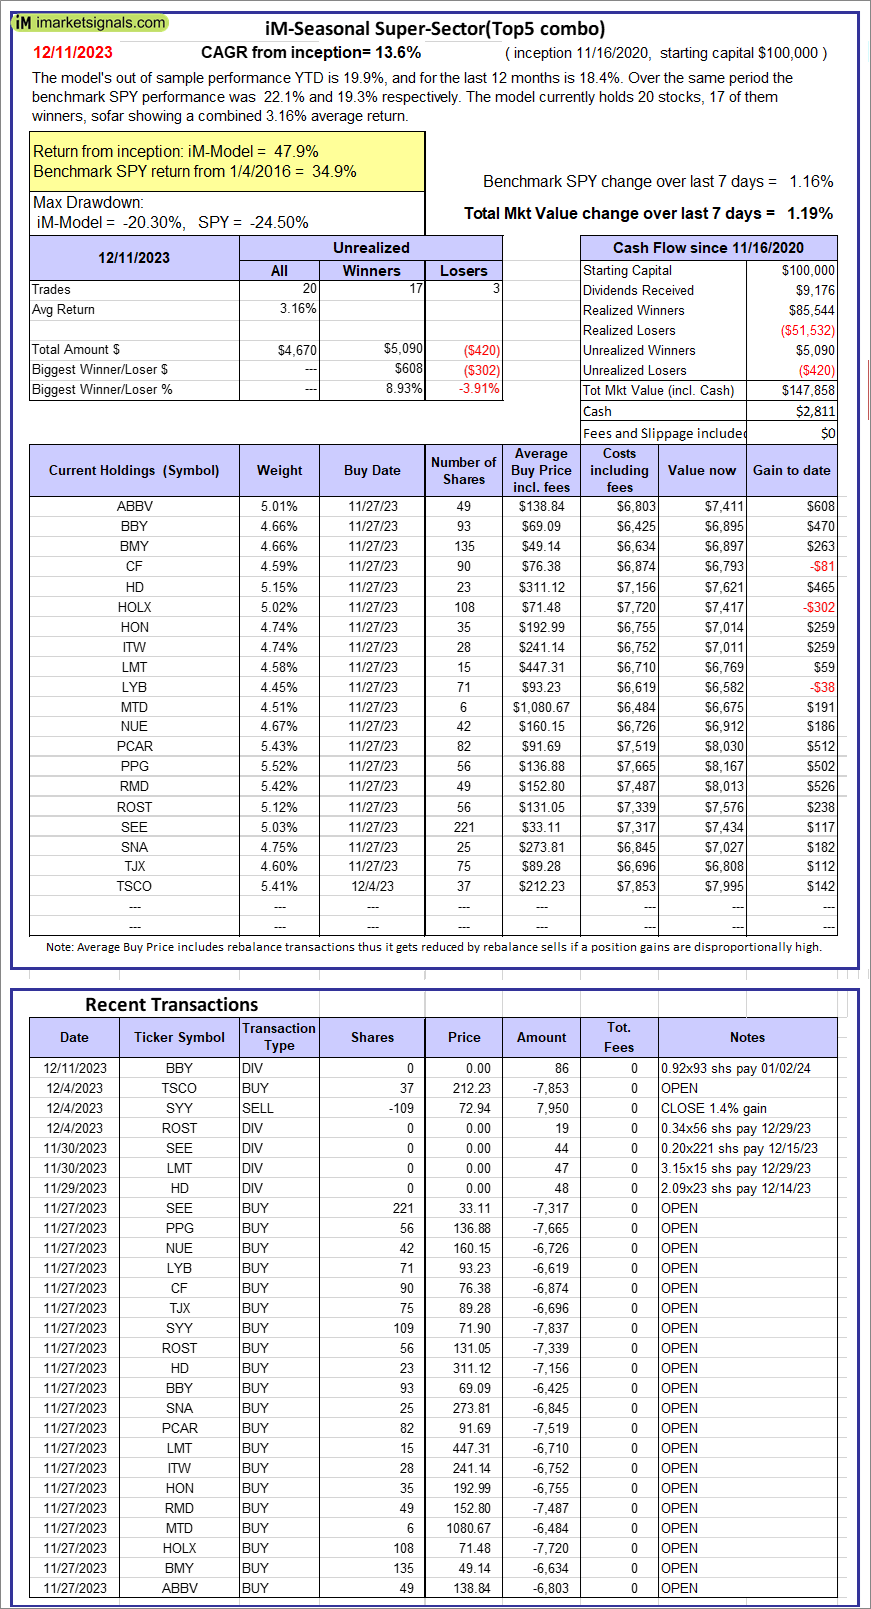 |
iM-Seasonal Super-Sectors (Top5 combo) : Since inception, on 11/17/2020, the model gained 47.86% while the benchmark SPY gained 34.90% over the same period. Over the previous week the market value of iM-Seasonal Super-Sectors (Top5 combo) gained 1.19% at a time when SPY gained 1.16%. A starting capital of $100,000 at inception on 11/17/2020 would have grown to $147,858 which includes $2,811 cash and excludes $00 spent on fees and slippage. |
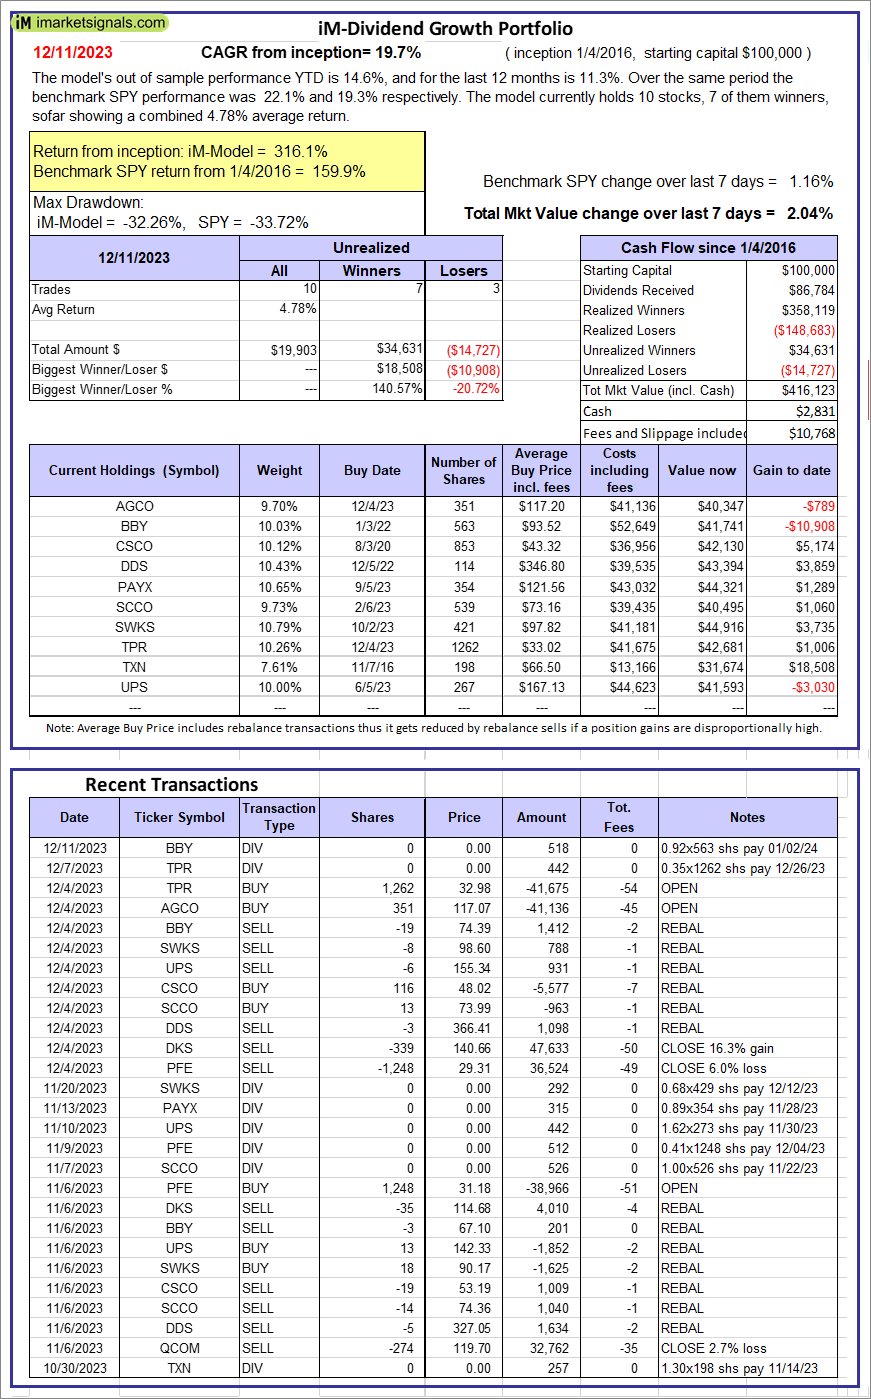 |
iM-Dividend Growth Portfolio: The model’s out of sample performance YTD is 14.6%, and for the last 12 months is 11.3%. Over the same period the benchmark SPY performance was 22.1% and 19.3% respectively. Over the previous week the market value of the iM-Dividend Growth Portfolio gained 2.04% at a time when SPY gained 1.16%. A starting capital of $100,000 at inception on 6/30/2016 would have grown to $416,123 which includes $2,831 cash and excludes $10,768 spent on fees and slippage. |
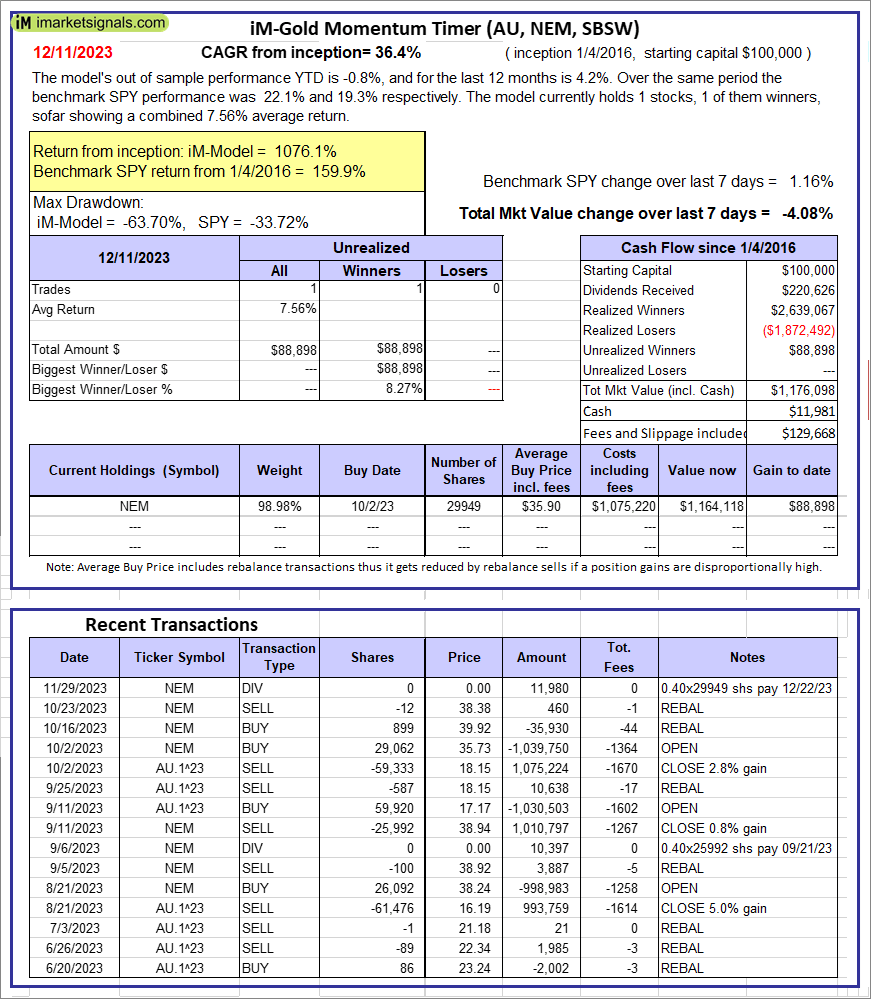 |
iM-Gold Momentum Timer (AU, NEM, SBSW): The model’s out of sample performance YTD is -0.8%, and for the last 12 months is 4.2%. Over the same period the benchmark SPY performance was 22.1% and 19.3% respectively. Over the previous week the market value of iM-Gold Momentum Timer (AU, NEM, SBSW) gained -4.08% at a time when SPY gained 1.16%. A starting capital of $100,000 at inception on 6/30/2016 would have grown to $11,981 which includes $129,668 cash and excludes Gain to date spent on fees and slippage. |
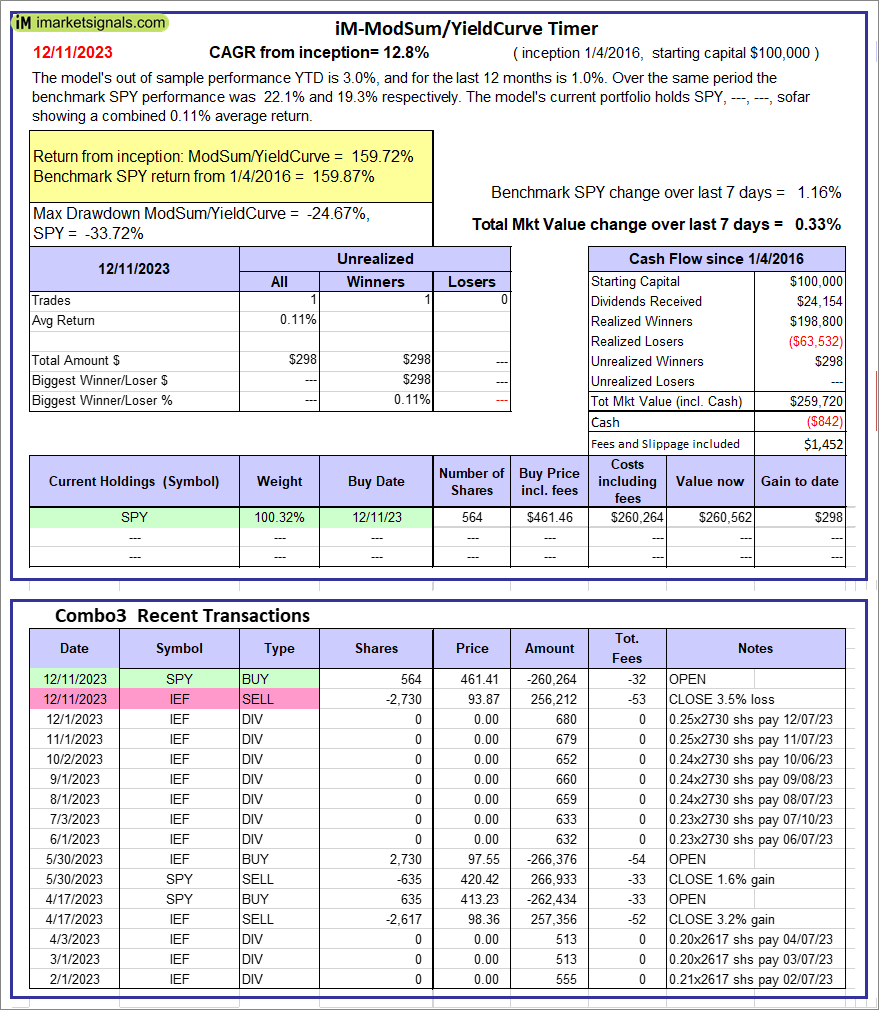 |
iM-ModSum/YieldCurve Timer: The model’s out of sample performance YTD is 3.0%, and for the last 12 months is 1.0%. Over the same period the benchmark SPY performance was 22.1% and 19.3% respectively. Over the previous week the market value of iM-PortSum/YieldCurve Timer gained 0.33% at a time when SPY gained 1.16%. A starting capital of $100,000 at inception on 1/1/2016 would have grown to $259,720 which includes -$842 cash and excludes $1,452 spent on fees and slippage. |
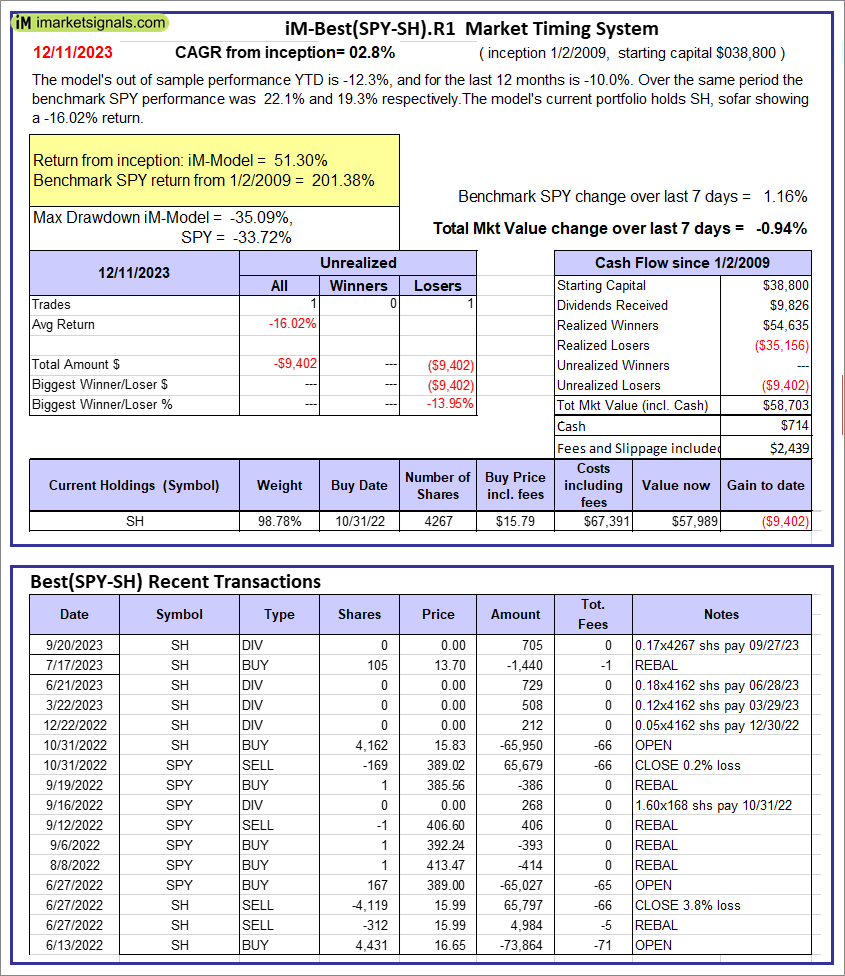 |
iM-Best(SPY-SH).R1: The model’s out of sample performance YTD is -12.3%, and for the last 12 months is -10.0%. Over the same period the benchmark SPY performance was 22.1% and 19.3% respectively. Over the previous week the market value of Best(SPY-SH) gained -0.94% at a time when SPY gained 1.16%. A starting capital of $100,000 at inception on 1/2/2009 would have grown to $58,703 which includes $714 cash and excludes $2,439 spent on fees and slippage. |
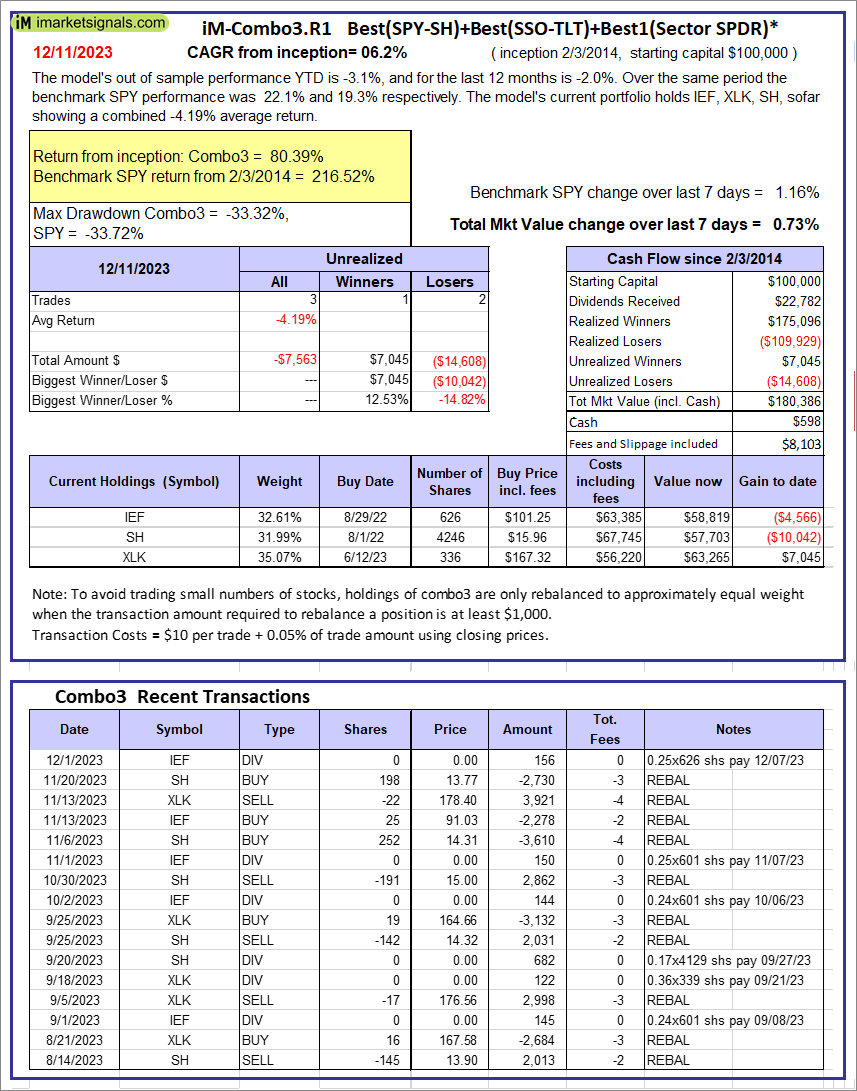 |
iM-Combo3.R1: The model’s out of sample performance YTD is -3.1%, and for the last 12 months is -2.0%. Over the same period the benchmark SPY performance was 22.1% and 19.3% respectively. Over the previous week the market value of iM-Combo3.R1 gained 0.73% at a time when SPY gained 1.16%. A starting capital of $100,000 at inception on 2/3/2014 would have grown to $180,386 which includes $598 cash and excludes $8,103 spent on fees and slippage. |
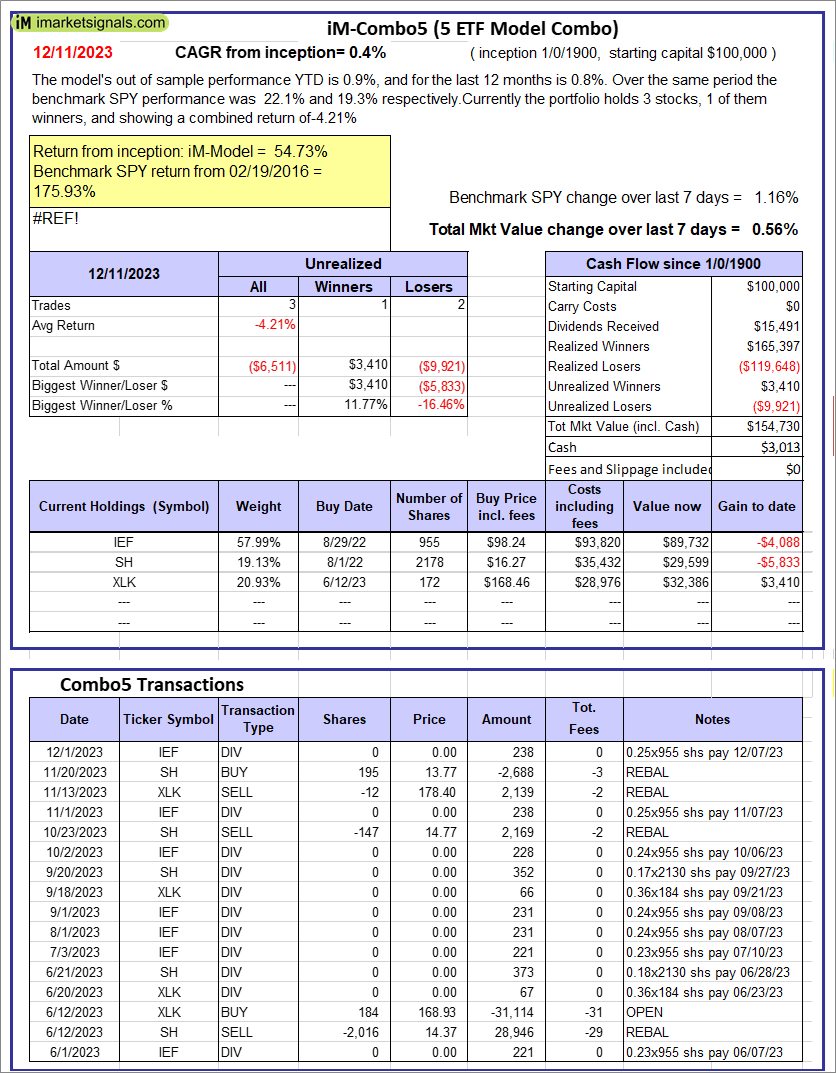 |
iM-Combo5: The model’s out of sample performance YTD is 0.9%, and for the last 12 months is 0.8%. Over the same period the benchmark SPY performance was 22.1% and 19.3% respectively. Over the previous week the market value of iM-Combo5 gained 0.56% at a time when SPY gained 1.16%. A starting capital of $100,000 at inception on 2/22/2016 would have grown to $154,730 which includes $3,013 cash and excludes $0 spent on fees and slippage. |
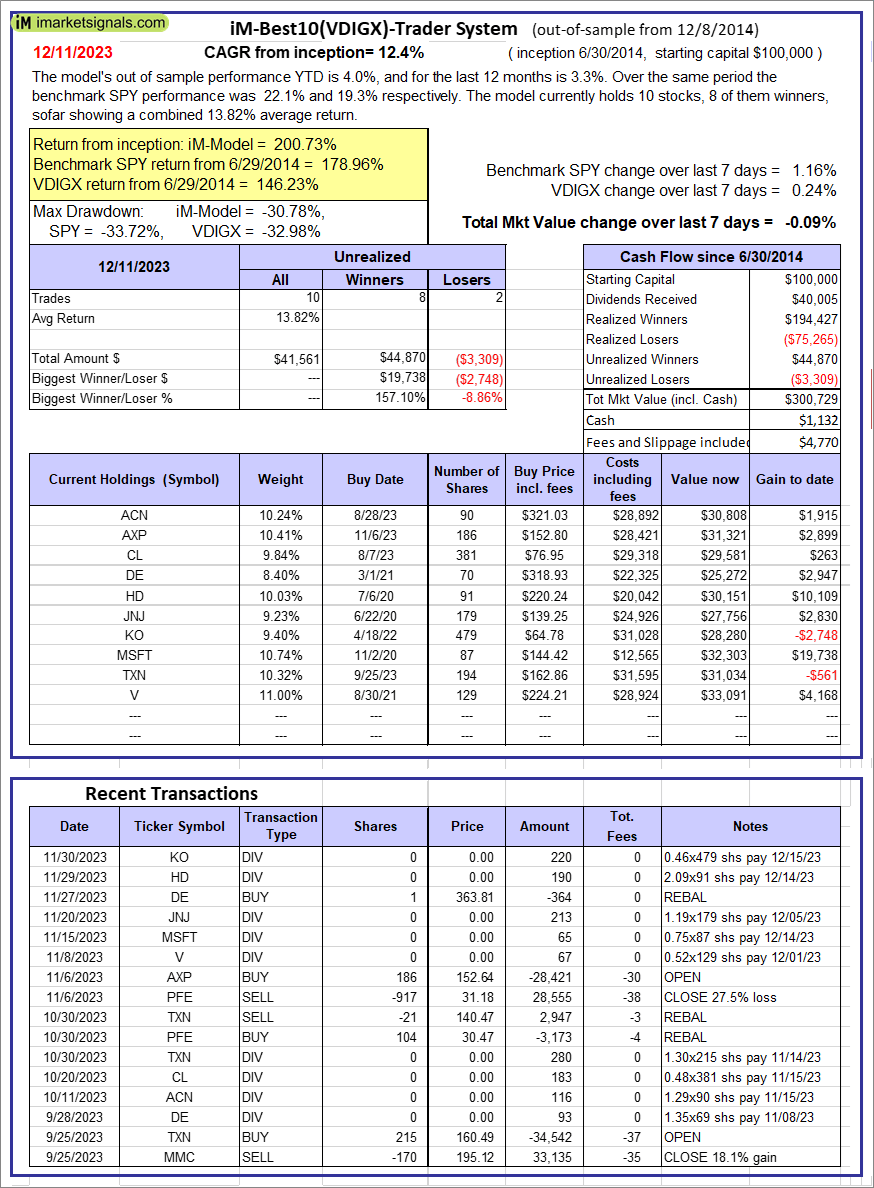 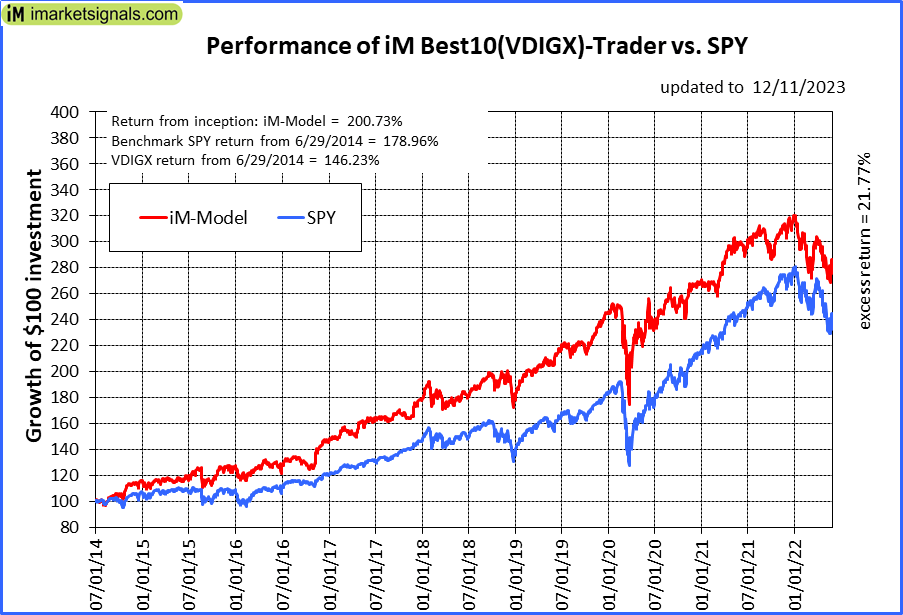 |
iM-Best10(VDIGX)-Trader: The model’s out of sample performance YTD is 4.0%, and for the last 12 months is 3.3%. Over the same period the benchmark SPY performance was 22.1% and 19.3% respectively. Since inception, on 7/1/2014, the model gained 200.73% while the benchmark SPY gained 178.96% and VDIGX gained 146.23% over the same period. Over the previous week the market value of iM-Best10(VDIGX) gained -0.09% at a time when SPY gained 1.16%. A starting capital of $100,000 at inception on 7/1/2014 would have grown to $300,729 which includes $1,132 cash and excludes $4,770 spent on fees and slippage. |
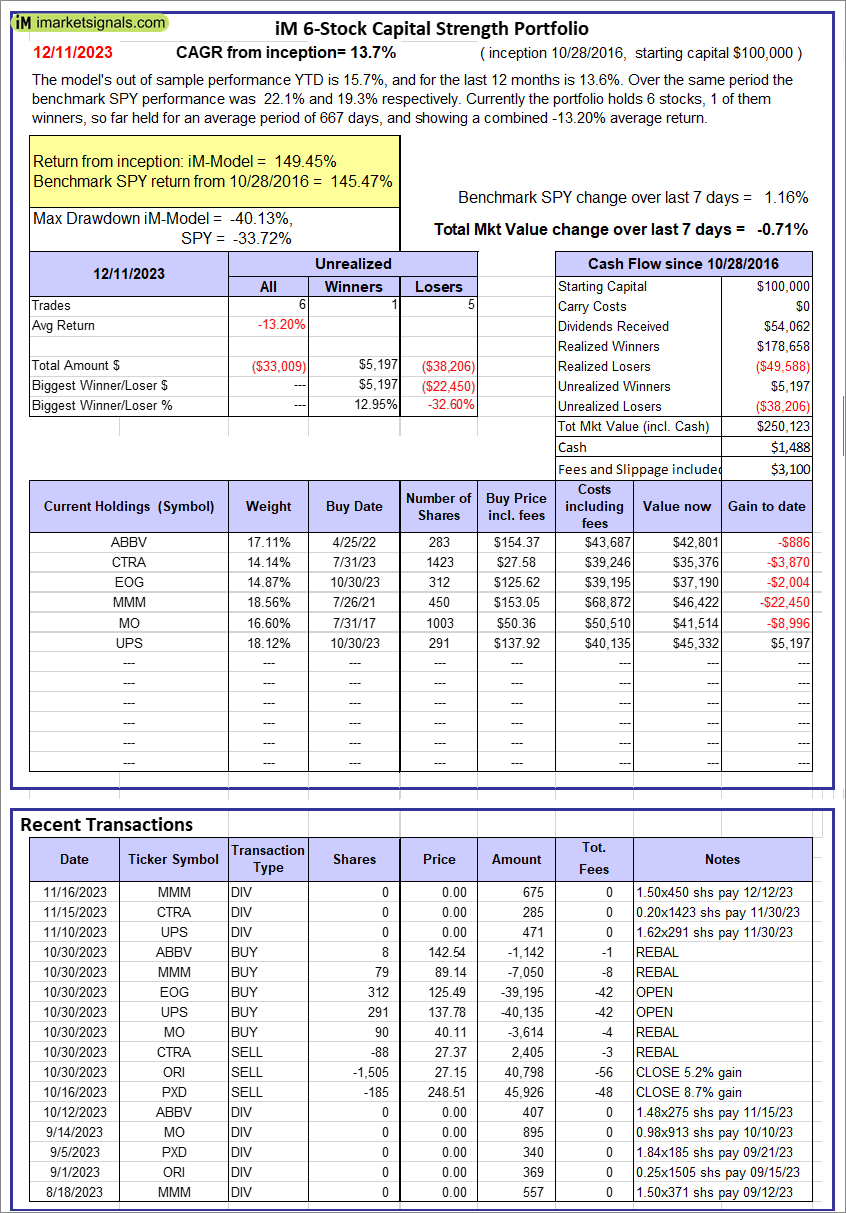 |
iM 6-Stock Capital Strength Portfolio: The model’s out of sample performance YTD is 15.7%, and for the last 12 months is 13.6%. Over the same period the benchmark SPY performance was 22.1% and 19.3% respectively. Over the previous week the market value of the iM 6-Stock Capital Strength Portfolio gained -0.71% at a time when SPY gained 1.16%. A starting capital of $100,000 at inception on 10/28/2016 would have grown to $250,123 which includes $1,488 cash and excludes $3,100 spent on fees and slippage. |
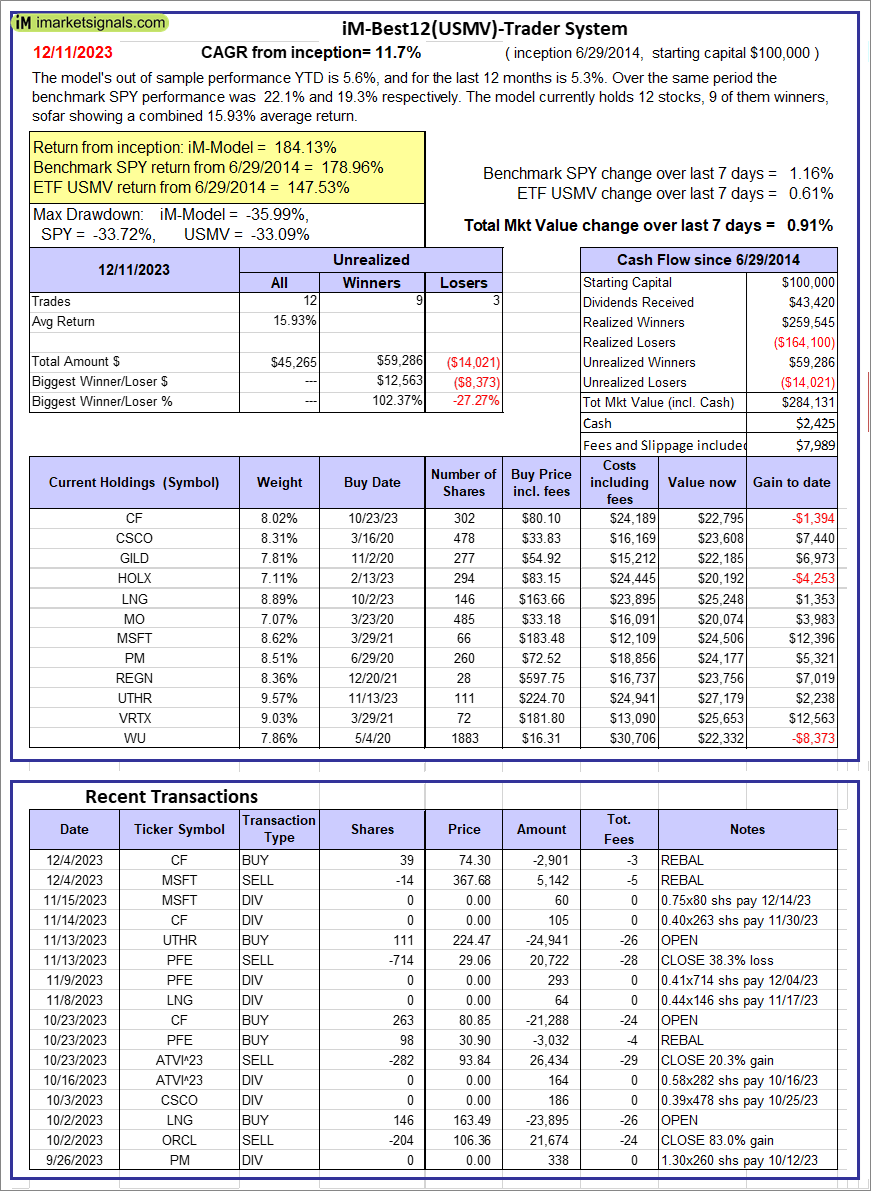 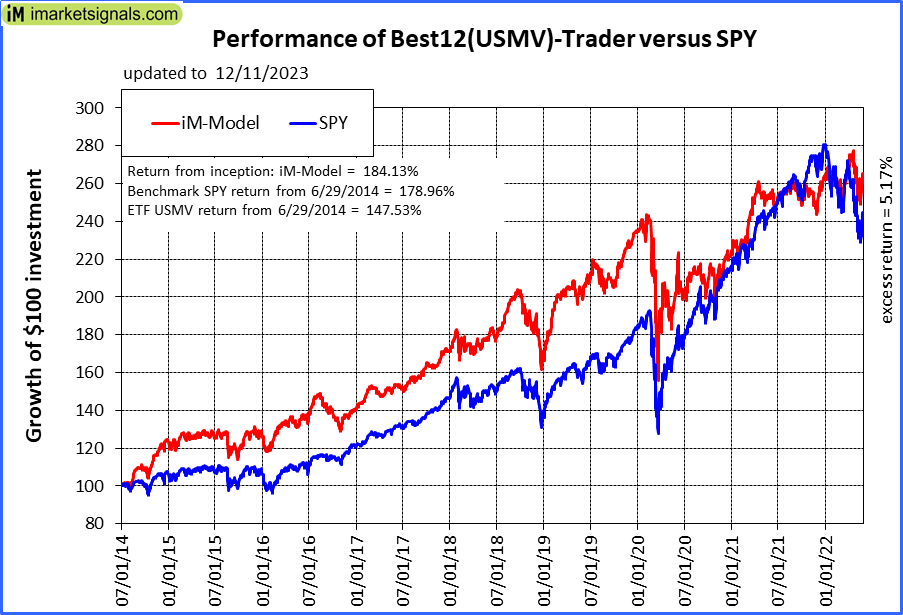 |
iM-Best12(USMV)-Trader: The model’s out of sample performance YTD is 5.6%, and for the last 12 months is 5.3%. Over the same period the benchmark SPY performance was 22.1% and 19.3% respectively. Since inception, on 6/30/2014, the model gained 184.13% while the benchmark SPY gained 178.96% and the ETF USMV gained 147.53% over the same period. Over the previous week the market value of iM-Best12(USMV)-Trader gained 0.91% at a time when SPY gained 1.16%. A starting capital of $100,000 at inception on 6/30/2014 would have grown to $284,131 which includes $2,425 cash and excludes $7,989 spent on fees and slippage. |
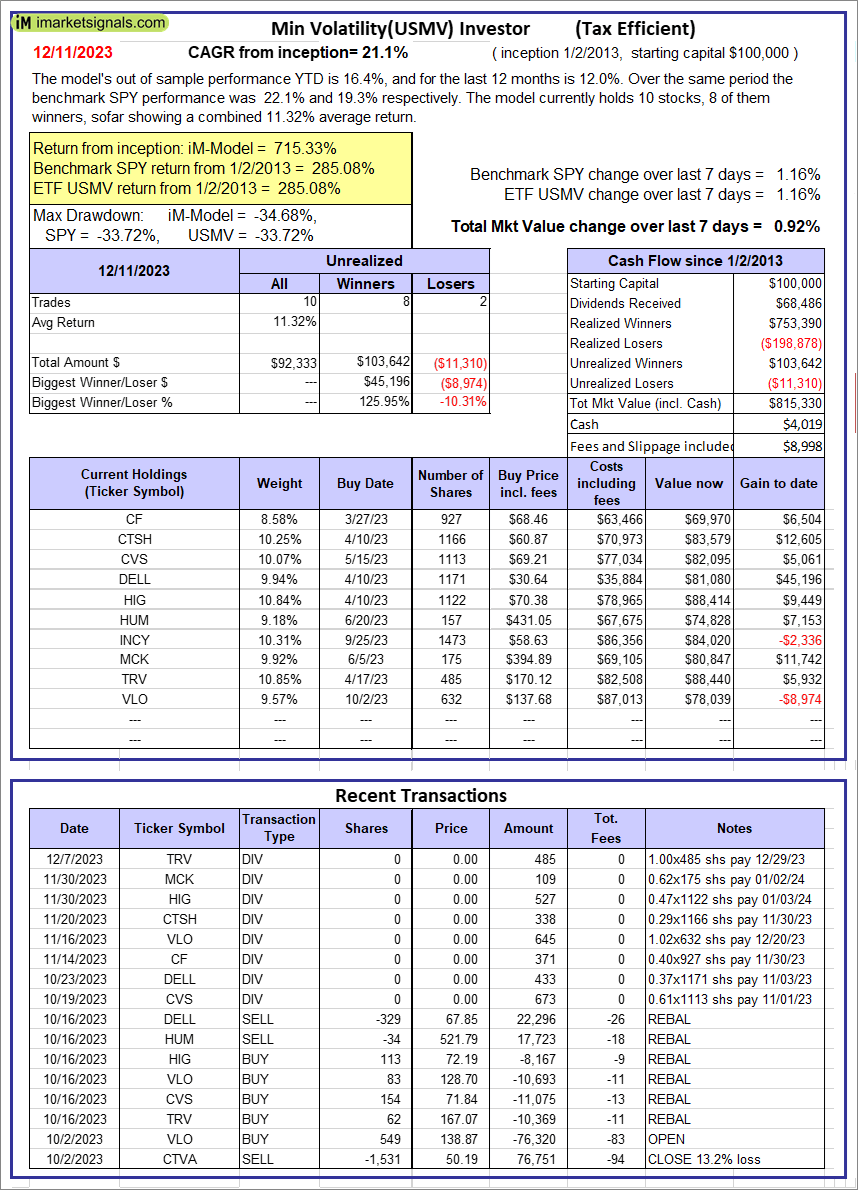 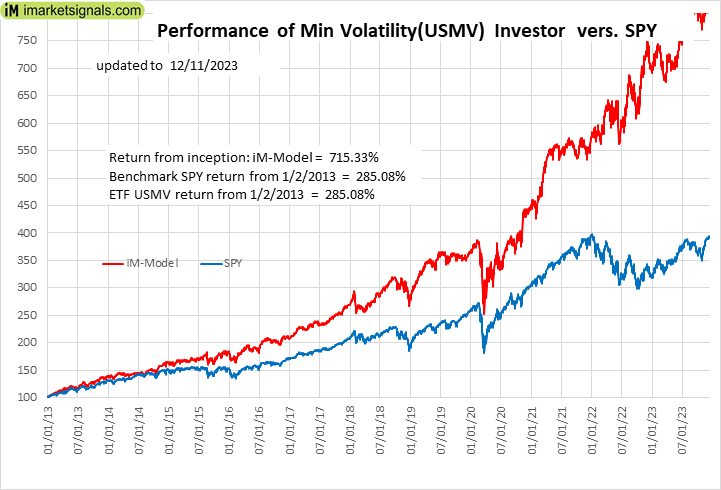 |
iM-Min Volatility(USMV) Investor (Tax Efficient): The model’s out of sample performance YTD is 16.4%, and for the last 12 months is 12.0%. Over the same period the benchmark SPY performance was 22.1% and 19.3% respectively. Since inception, on 1/3/2013, the model gained 715.33% while the benchmark SPY gained 285.08% and the ETF USMV gained 285.08% over the same period. Over the previous week the market value of iM-Best12(USMV)Q1 gained 0.92% at a time when SPY gained 1.16%. A starting capital of $100,000 at inception on 1/3/2013 would have grown to $815,330 which includes $4,019 cash and excludes $8,998 spent on fees and slippage. |
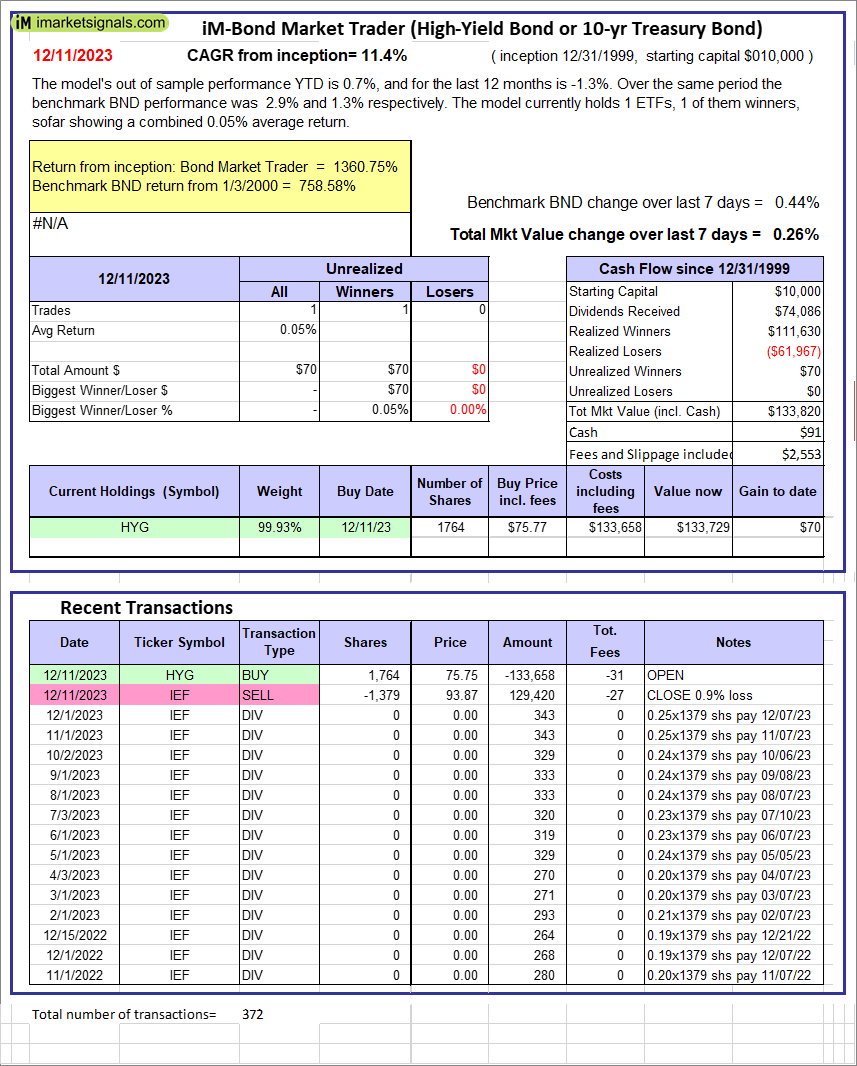 |
iM-Bond Market Trader (High-Yield Bond or 10-yr Treasury Bond): The model’s out of sample performance YTD is 0.7%, and for the last 12 months is -1.3%. Over the same period the benchmark BND performance was 2.9% and 1.3% respectively. Over the previous week the market value of the iM-Bond Market Trader (High-Yield Bond or 10-yr Treasury Bond) gained 0.26% at a time when BND gained 0.44%. A starting capital of $10,000 at inception on 1/3/2000 would have grown to $133,820 which includes $91 cash and excludes $2,553 spent on fees and slippage. |
|
|
iM-ModSum/YieldCurve Timer: The model’s out of sample performance YTD is 3.0%, and for the last 12 months is 1.0%. Over the same period the benchmark SPY performance was 22.1% and 19.3% respectively. Over the previous week the market value of iM-PortSum/YieldCurve Timer gained 0.33% at a time when SPY gained 1.16%. A starting capital of $100,000 at inception on 1/1/2016 would have grown to $259,720 which includes -$842 cash and excludes $1,452 spent on fees and slippage. |
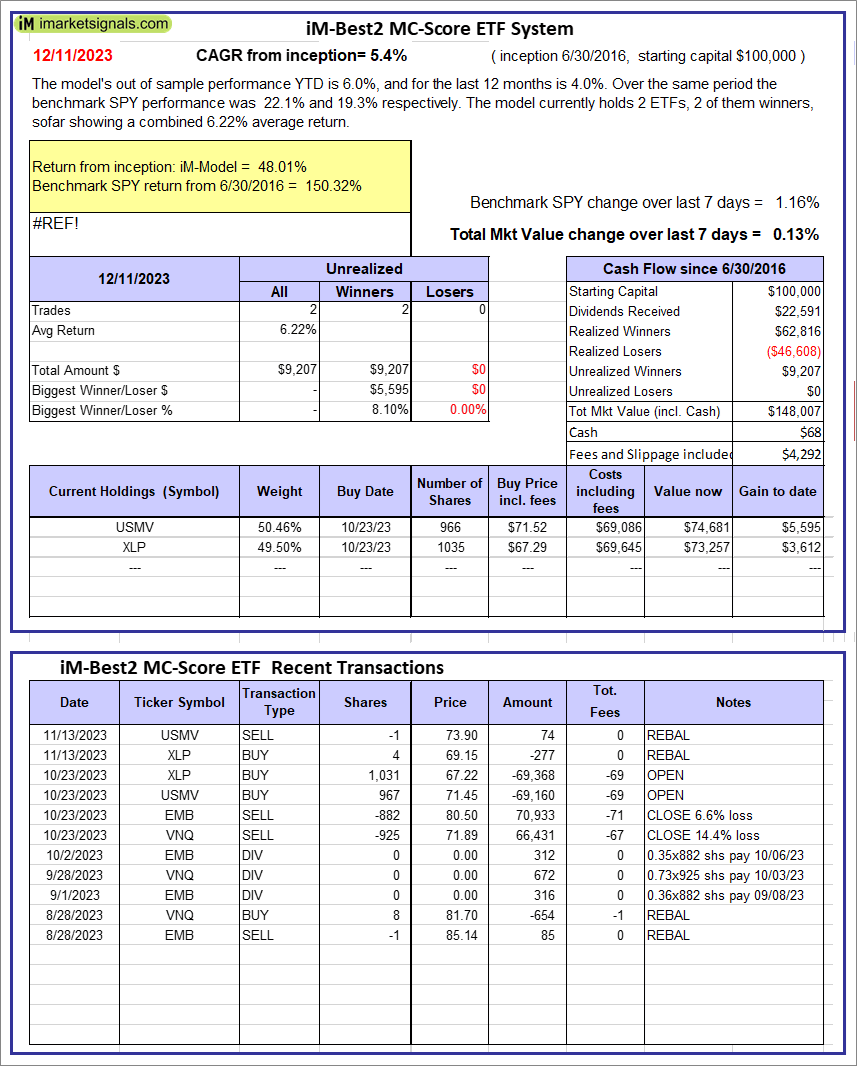 |
iM-Best2 MC-Score ETF System: The model’s out of sample performance YTD is 6.0%, and for the last 12 months is 4.0%. Over the same period the benchmark SPY performance was 22.1% and 19.3% respectively. Over the previous week the market value of the iM-Best2 MC-Score ETF System gained 0.13% at a time when SPY gained 1.16%. A starting capital of $100,000 at inception on 6/30/2016 would have grown to $148,007 which includes $68 cash and excludes $4,292 spent on fees and slippage. |
 |
iM-Best4 MC-Score Vanguard System: The model’s out of sample performance YTD is 4.6%, and for the last 12 months is 3.3%. Over the same period the benchmark SPY performance was 22.1% and 19.3% respectively. Over the previous week the market value of the iM-Best4 MC-Score Vanguard System gained 0.07% at a time when SPY gained 1.16%. A starting capital of $100,000 at inception on 6/30/2016 would have grown to $156,877 which includes $646 cash and excludes $00 spent on fees and slippage. |
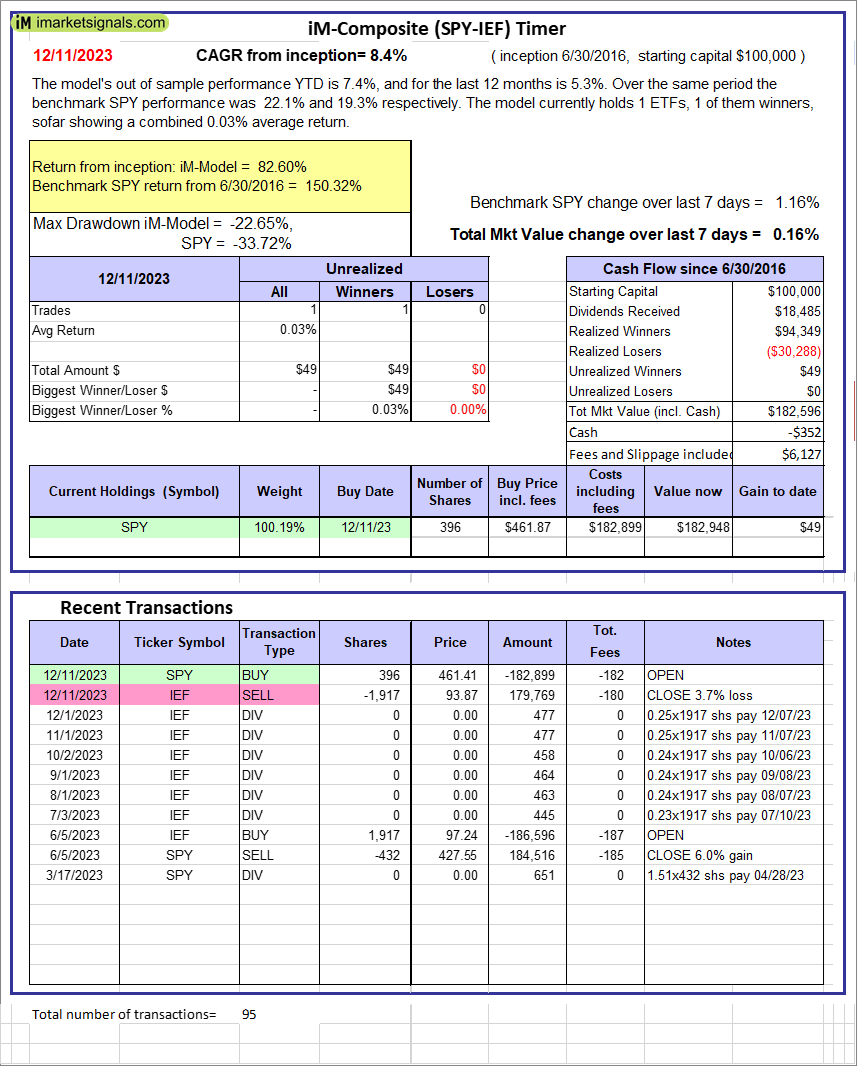 |
iM-Composite (SPY-IEF) Timer: The model’s out of sample performance YTD is 7.4%, and for the last 12 months is 5.3%. Over the same period the benchmark SPY performance was 22.1% and 19.3% respectively. Over the previous week the market value of the iM-Composite (SPY-IEF) Timer gained 0.16% at a time when SPY gained 1.16%. A starting capital of $100,000 at inception on 6/30/2016 would have grown to $182,596 which includes -$352 cash and excludes $6,127 spent on fees and slippage. |
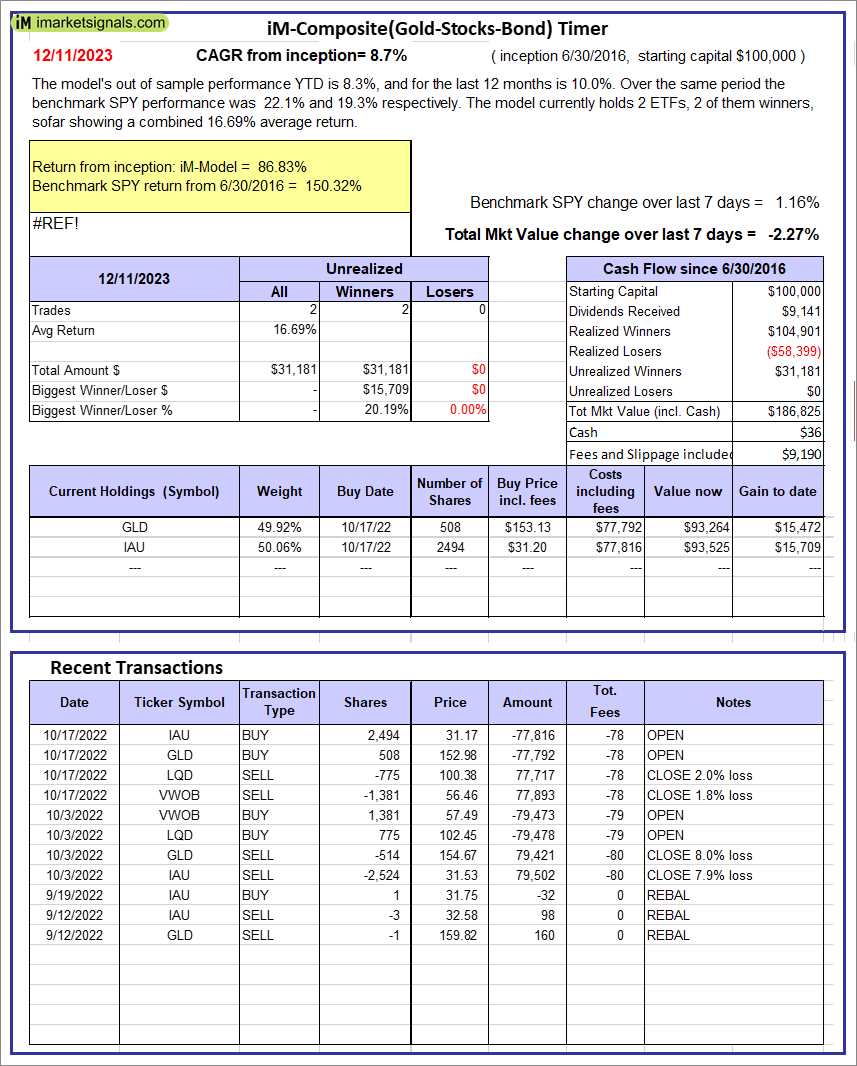 |
iM-Composite(Gold-Stocks-Bond) Timer: The model’s out of sample performance YTD is 8.3%, and for the last 12 months is 10.0%. Over the same period the benchmark SPY performance was 22.1% and 19.3% respectively. Over the previous week the market value of the iM-Composite(Gold-Stocks-Bond) Timer gained -2.27% at a time when SPY gained 1.16%. A starting capital of $100,000 at inception on 6/30/2016 would have grown to $186,825 which includes $36 cash and excludes $9,190 spent on fees and slippage. |
iM-Best Reports – 12/11/2023
Posted in pmp SPY-SH
Leave a Reply
You must be logged in to post a comment.