
  |
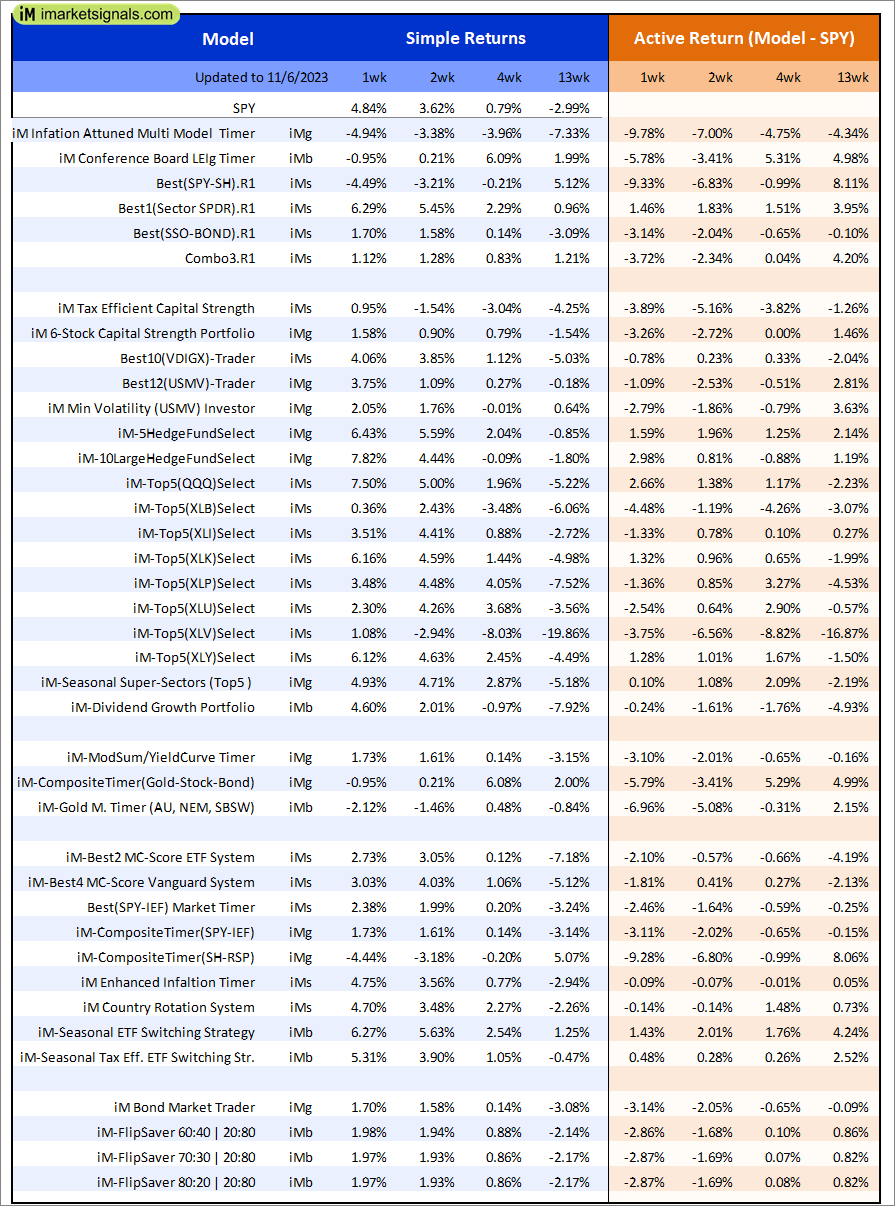
Out of sample performance summary of our models for the past 1, 2, 4 and 13 week periods. The active active return indicates how the models over- or underperformed the benchmark ETF SPY. Also the YTD, and the 1-, 3-, 5- and 10-year annualized returns are shown in the second table |
 |
iM-Inflation Attuned Multi-Model Market Timer: The model’s out of sample performance YTD is -15.3%, and for the last 12 months is -14.6%. Over the same period the benchmark SPY performance was 15.2% and 17.6% respectively. Over the previous week the market value of the iM-Inflation Attuned Multi-Model Market Timer gained -4.94% at a time when SPY gained 4.84%. A starting capital of $100,000 at inception on 3/24/2017 would have grown to $131,015,291 which includes -$1,200,778 cash and excludes $2,565,643 spent on fees and slippage. |
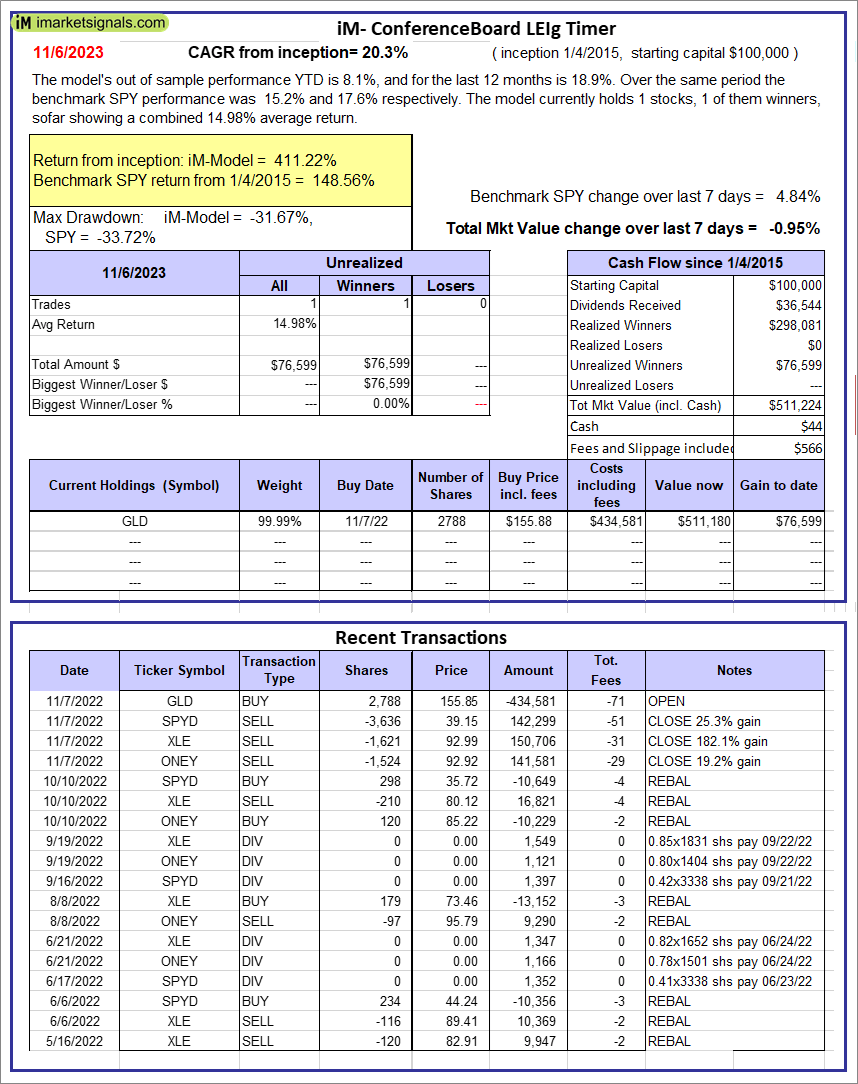 |
iM-Conference Board LEIg Timer: The model’s performance YTD is 14.3%, and for the last 12 months is 7.3%. Over the same period the benchmark SPY performance was 20.1% and 9.4% respectively. Over the previous week the market value of the iM-Conference Board LEIg Timer gained -0.95% at a time when SPY gained 4.84%. A starting capital of $100,000 at inception on 4/5/2017 would have grown to $511,224 which includes $44 cash and excludes $566 spent on fees and slippage. |
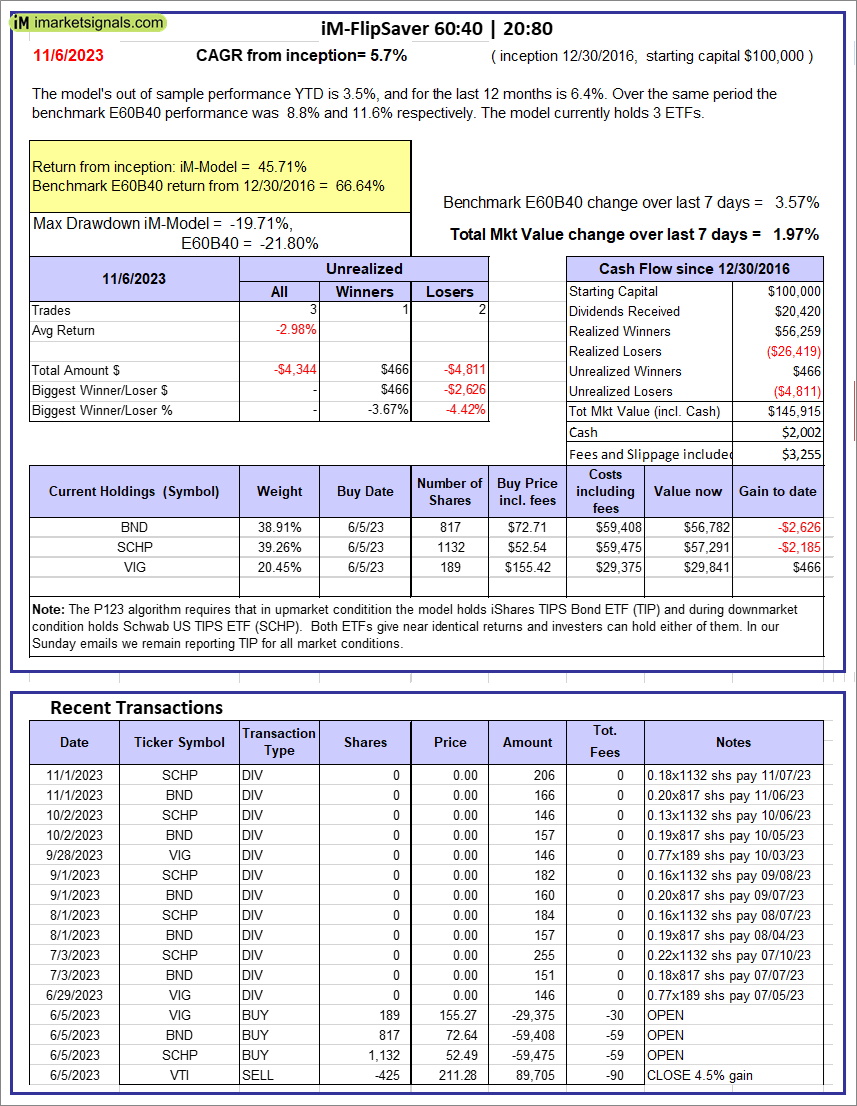 |
iM-FlipSaver 60:40 | 20:80 – 2017: The model’s out of sample performance YTD is 3.5%, and for the last 12 months is 6.4%. Over the same period the benchmark E60B40 performance was 8.8% and 11.6% respectively. Over the previous week the market value of iM-FlipSaver 80:20 | 20:80 gained 1.97% at a time when SPY gained 3.57%. A starting capital of $100,000 at inception on 7/16/2015 would have grown to $145,915 which includes $2,002 cash and excludes $3,255 spent on fees and slippage. |
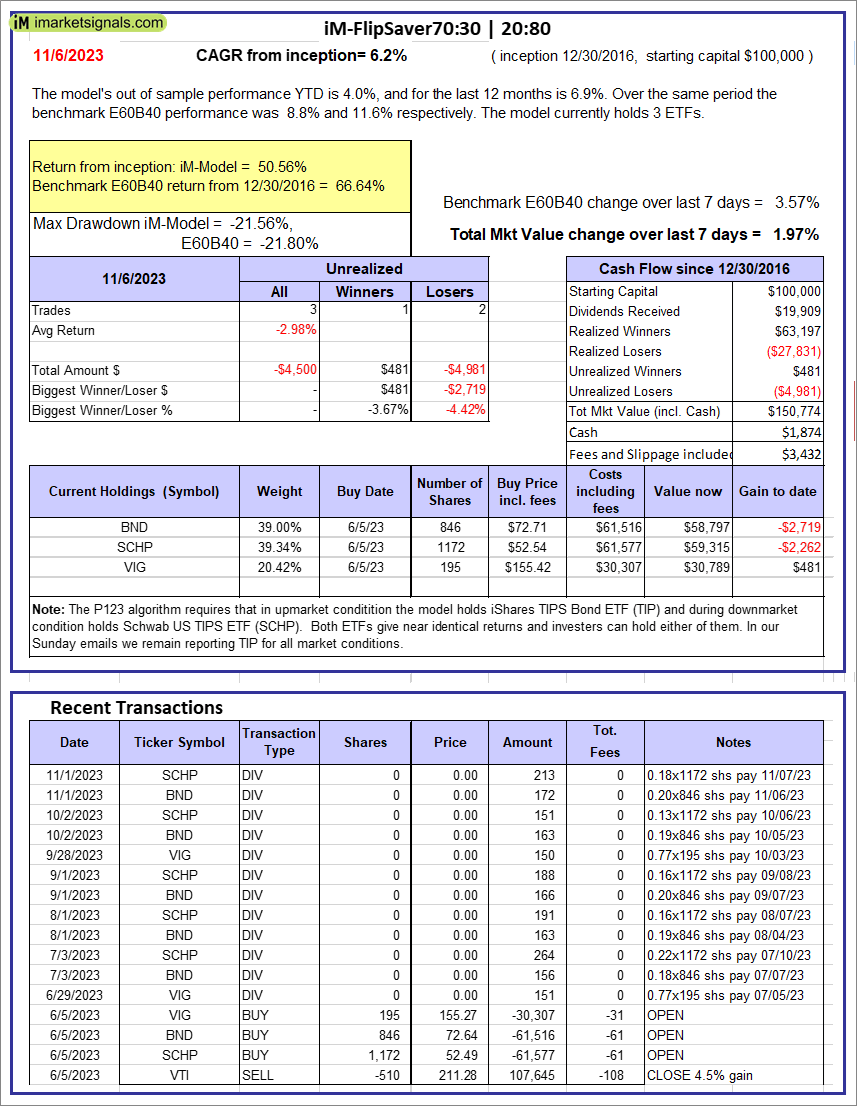 |
iM-FlipSaver 70:30 | 20:80 – 2017: The model’s out of sample performance YTD is 4.0%, and for the last 12 months is 6.9%. Over the same period the benchmark E60B40 performance was 8.8% and 11.6% respectively. Over the previous week the market value of iM-FlipSaver 70:30 | 20:80 gained 1.97% at a time when SPY gained 3.57%. A starting capital of $100,000 at inception on 7/15/2015 would have grown to $150,774 which includes $1,874 cash and excludes $3,432 spent on fees and slippage. |
 |
iM-FlipSaver 80:20 | 20:80 – 2017: The model’s out of sample performance YTD is 4.5%, and for the last 12 months is 7.4%. Over the same period the benchmark E60B40 performance was 8.8% and 11.6% respectively. Over the previous week the market value of iM-FlipSaver 80:20 | 20:80 gained 1.97% at a time when SPY gained 3.57%. A starting capital of $100,000 at inception on 1/2/2017 would have grown to $155,509 which includes $1,912 cash and excludes $3,600 spent on fees and slippage. |
 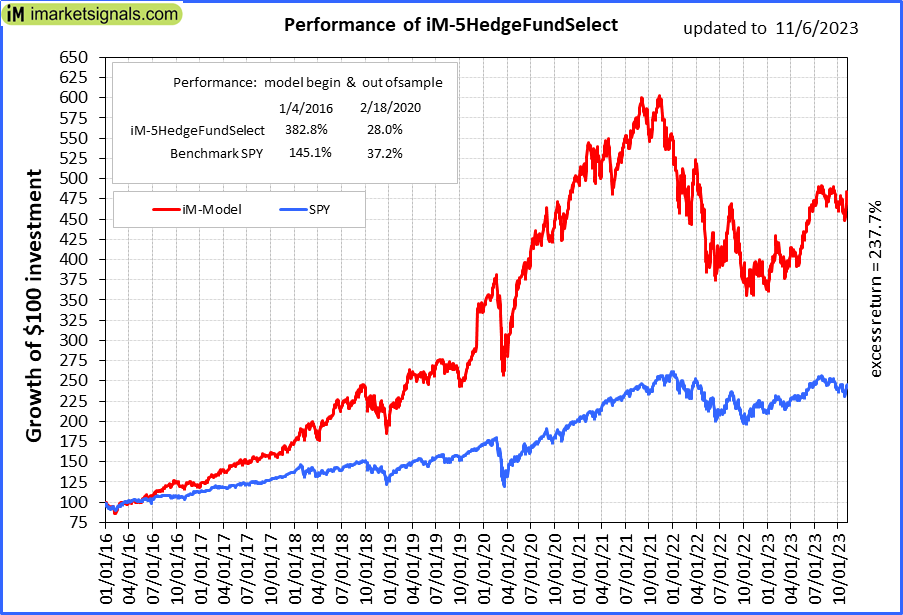 |
iM-5HedgeFundSelect: Since inception, on 1/5/2016, the model gained 382.79% while the benchmark SPY gained 145.08% over the same period. Over the previous week the market value of iM-5HedgeFundSelect gained 6.43% at a time when SPY gained 4.84%. A starting capital of $25,000 at inception on 1/5/2016 would have grown to $120,696 which includes $2,942 cash and excludes $2,110 spent on fees and slippage. |
 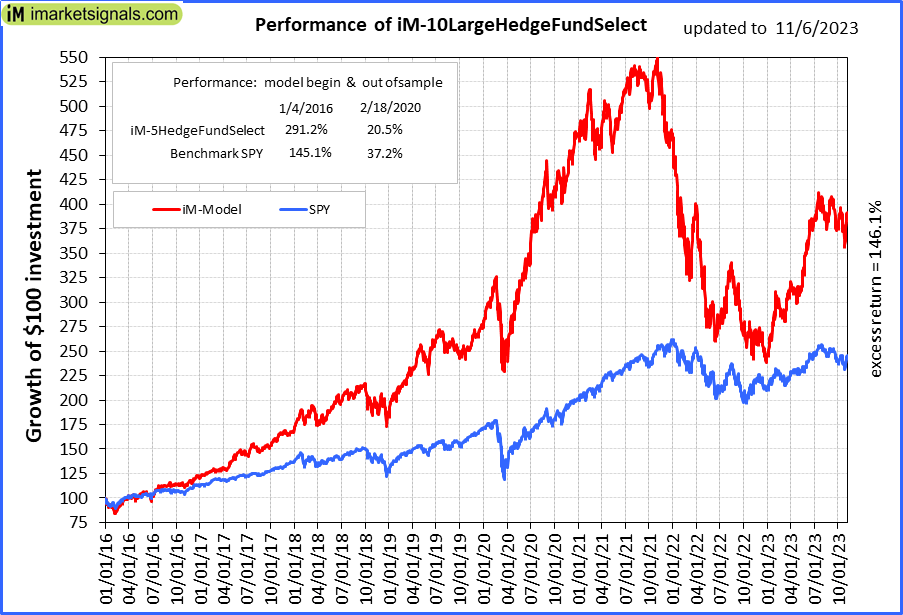 |
iM-10LargeHedgeFundSelect: Since inception, on 1/5/2016, the model gained 291.18% while the benchmark SPY gained 145.08% over the same period. Over the previous week the market value of iM-10LargeHedgeFundSelect gained 7.82% at a time when SPY gained 4.84%. A starting capital of $25,000 at inception on 1/5/2016 would have grown to $97,796 which includes $821 cash and excludes $1,307 spent on fees and slippage. |
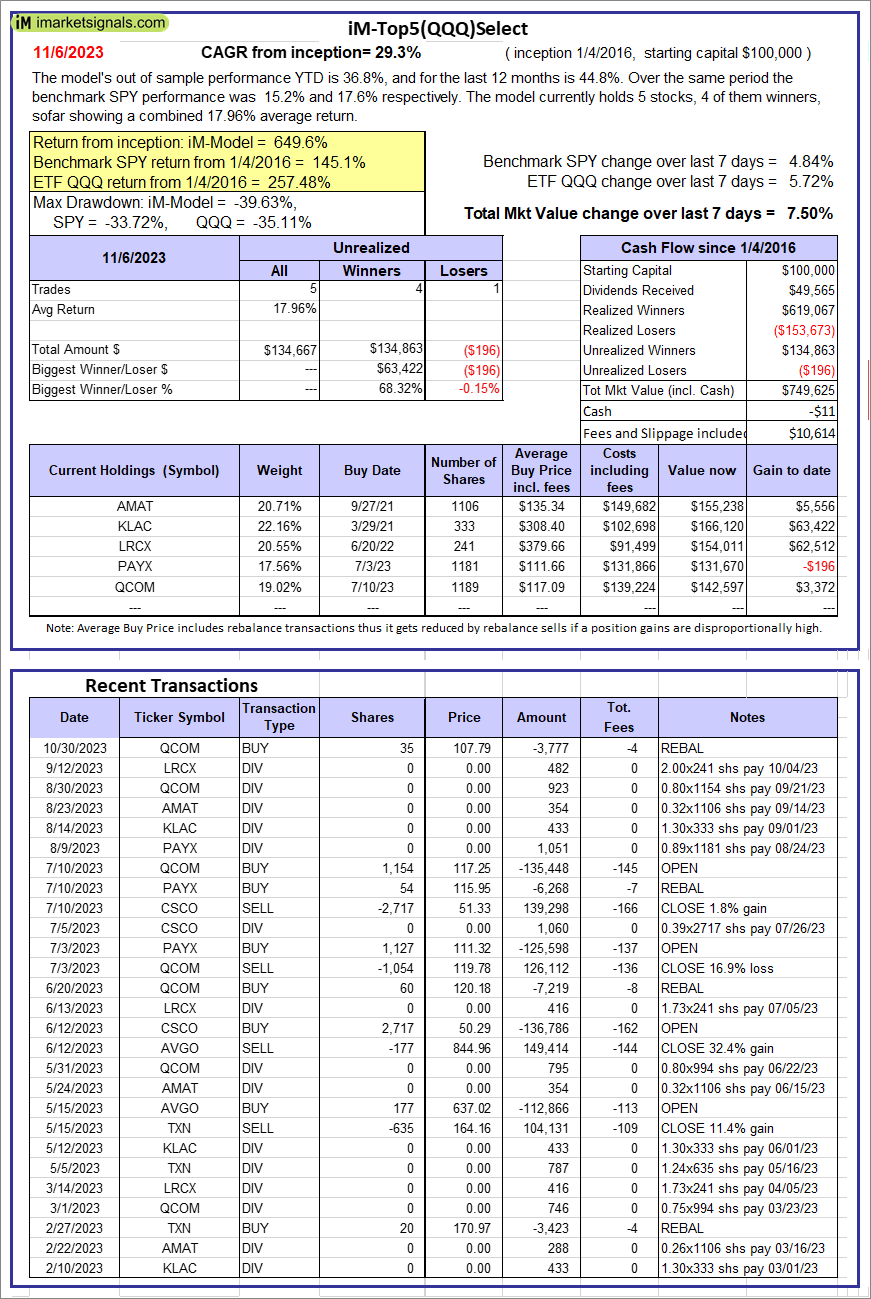  |
iM-Top5(QQQ)Select: Since inception, on 1/5/2016, the model gained 649.62% while the benchmark SPY gained 145.08% over the same period. Over the previous week the market value of iM-Top5(QQQ)Select gained 7.50% at a time when SPY gained 4.84%. A starting capital of $100,000 at inception on 1/5/2016 would have grown to $749,625 which includes -$11 cash and excludes $10,614 spent on fees and slippage. |
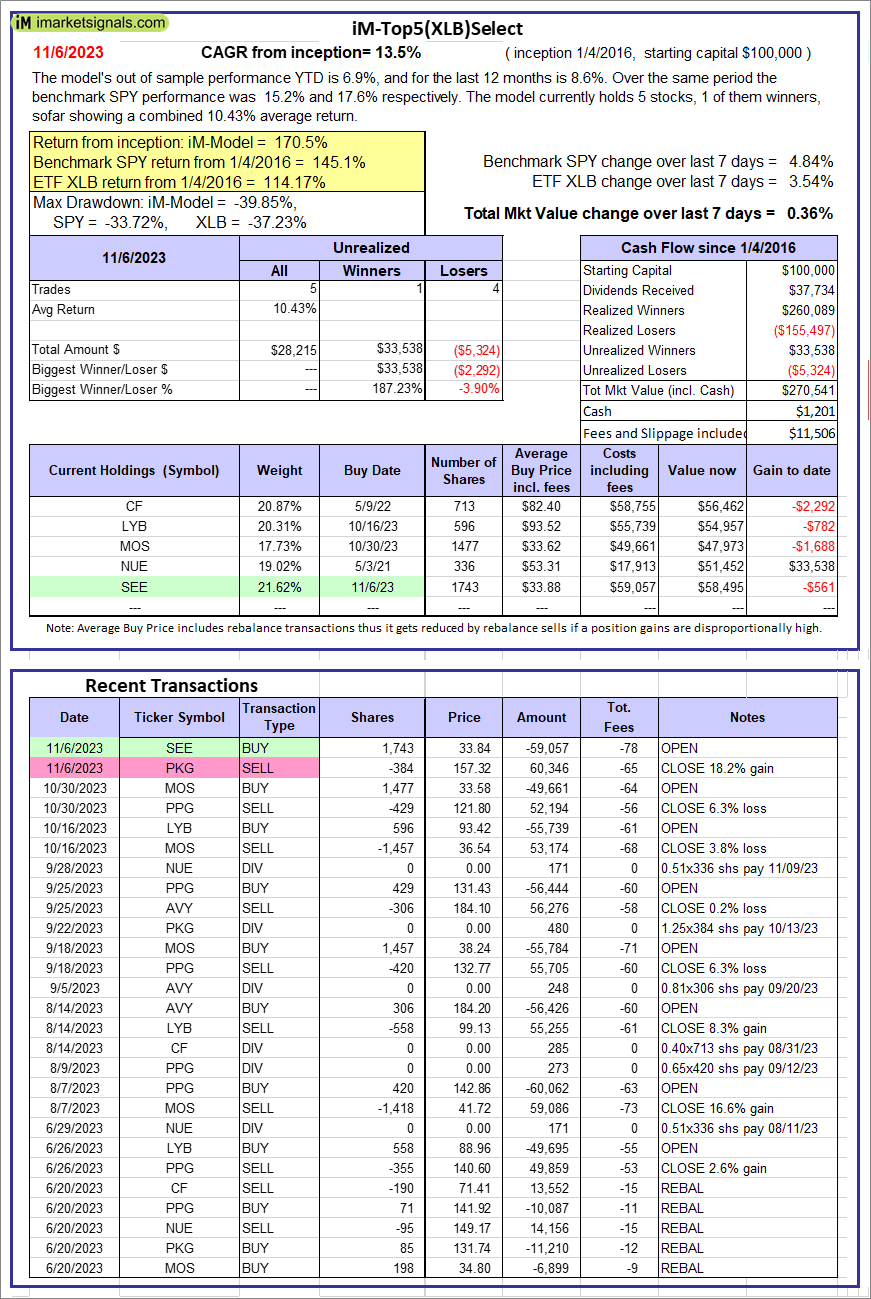 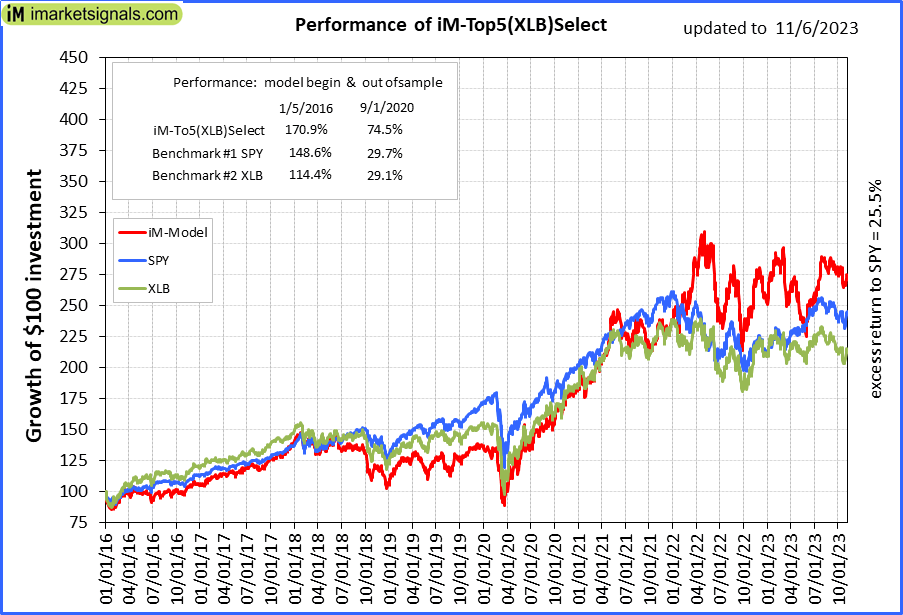 |
iM-Top5(XLB)Select: Since inception, on 1/5/2016, the model gained 170.54% while the benchmark SPY gained 145.08% over the same period. Over the previous week the market value of iM-Top5(XLB)Select gained 0.36% at a time when SPY gained 4.84%. A starting capital of $100,000 at inception on 1/5/2016 would have grown to $270,541 which includes $1,201 cash and excludes $11,506 spent on fees and slippage. |
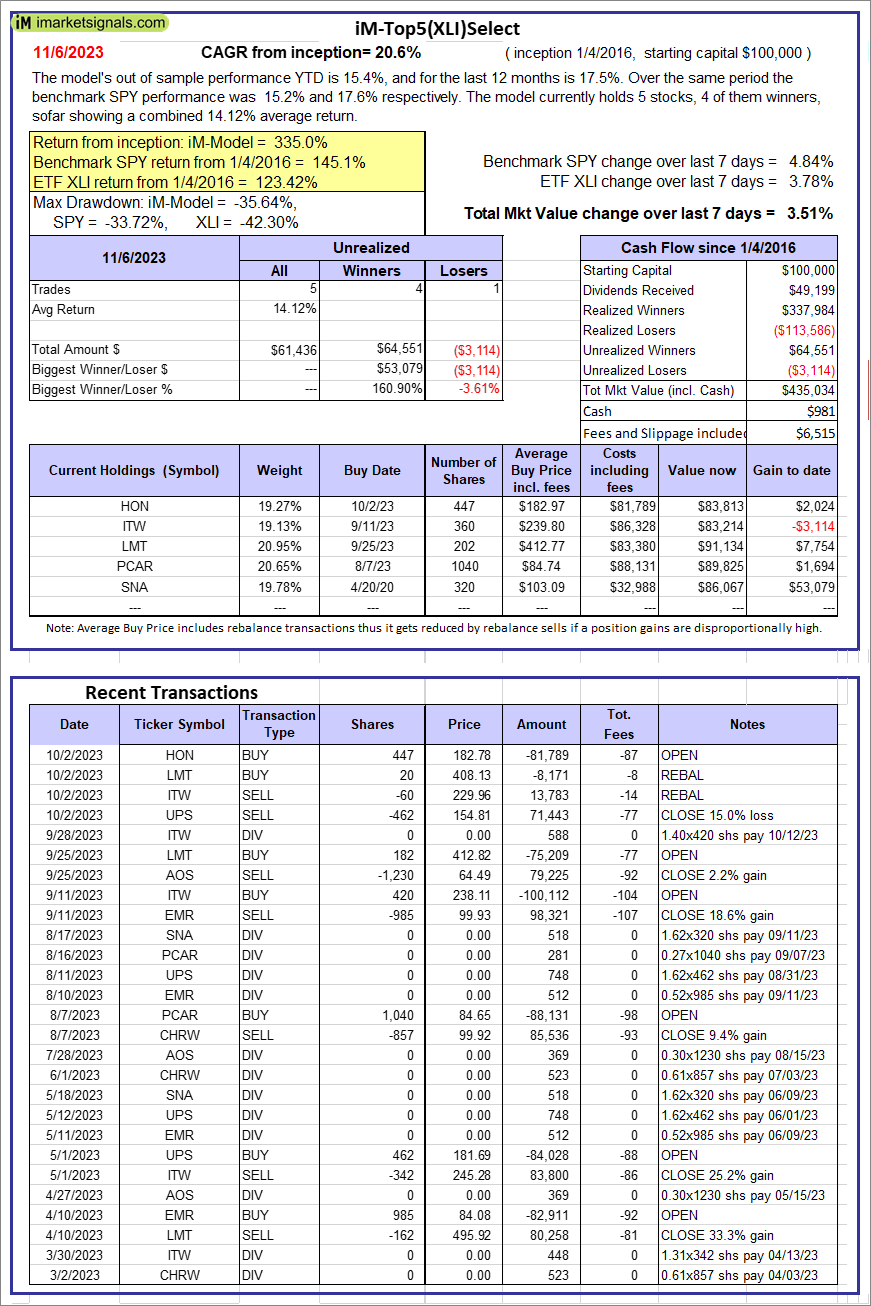 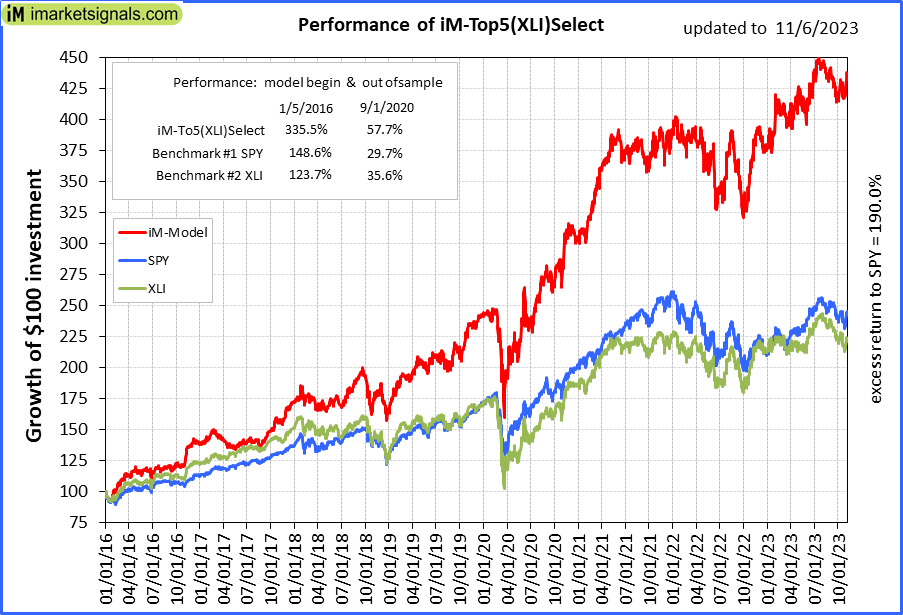 |
iM-Top5(XLI)Select: Since inception, on 1/5/2016, the model gained 335.03% while the benchmark SPY gained 145.08% over the same period. Over the previous week the market value of iM-Top5(XLI)Select gained 3.51% at a time when SPY gained 4.84%. A starting capital of $100,000 at inception on 1/5/2016 would have grown to $435,034 which includes $981 cash and excludes $6,515 spent on fees and slippage. |
 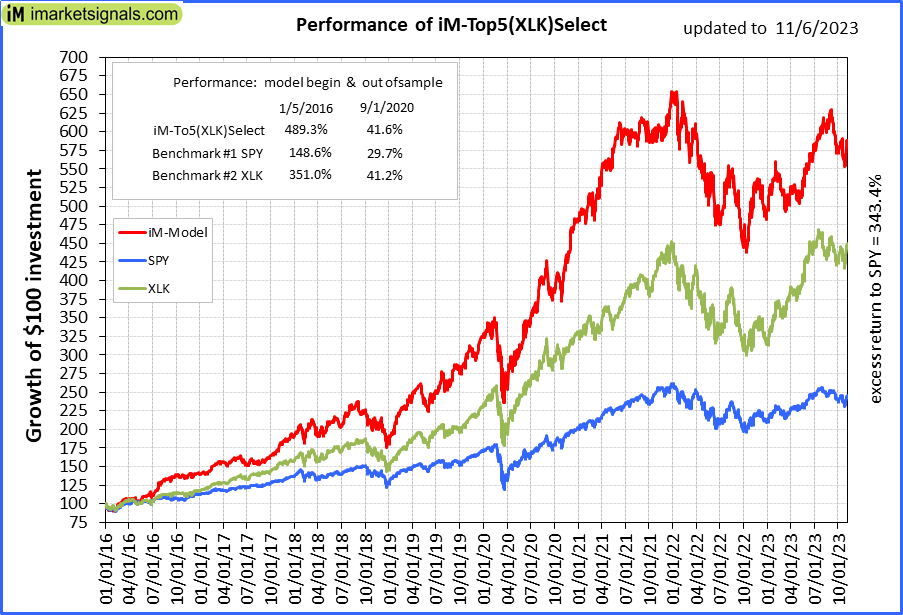 |
iM-Top5(XLK)Select: Since inception, on 1/5/2016, the model gained 488.50% while the benchmark SPY gained 145.08% over the same period. Over the previous week the market value of iM-Top5(XLK)Select gained 6.16% at a time when SPY gained 4.84%. A starting capital of $100,000 at inception on 1/5/2016 would have grown to $588,499 which includes -$1,289 cash and excludes $2,039 spent on fees and slippage. |
  |
iM-Top5(XLP)Select: Since inception, on 1/5/2016, the model gained 158.44% while the benchmark SPY gained 145.08% over the same period. Over the previous week the market value of iM-Top5(XLP)Select gained 3.48% at a time when SPY gained 4.84%. A starting capital of $100,000 at inception on 1/5/2016 would have grown to $258,438 which includes $624 cash and excludes $2,013 spent on fees and slippage. |
  |
iM-Top5(XLV)Select: Since inception, on 1/5/2016, the model gained 271.87% while the benchmark SPY gained 145.08% over the same period. Over the previous week the market value of iM-Top5(XLV)Select gained 1.08% at a time when SPY gained 4.84%. A starting capital of $100,000 at inception on 1/5/2016 would have grown to $371,873 which includes -$4,488 cash and excludes $11,918 spent on fees and slippage. |
 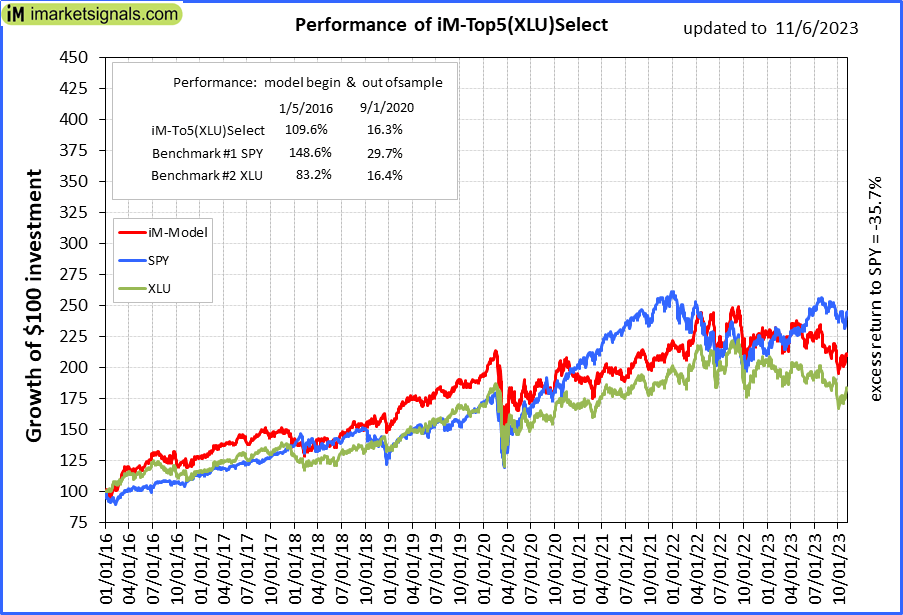 |
iM-Top5(XLU)Select: Since inception, on 1/5/2016, the model gained 109.36% while the benchmark SPY gained 145.08% over the same period. Over the previous week the market value of iM-Top5(XLU)Select gained 2.30% at a time when SPY gained 4.84%. A starting capital of $100,000 at inception on 1/5/2016 would have grown to $209,363 which includes $3,126 cash and excludes $12,731 spent on fees and slippage. |
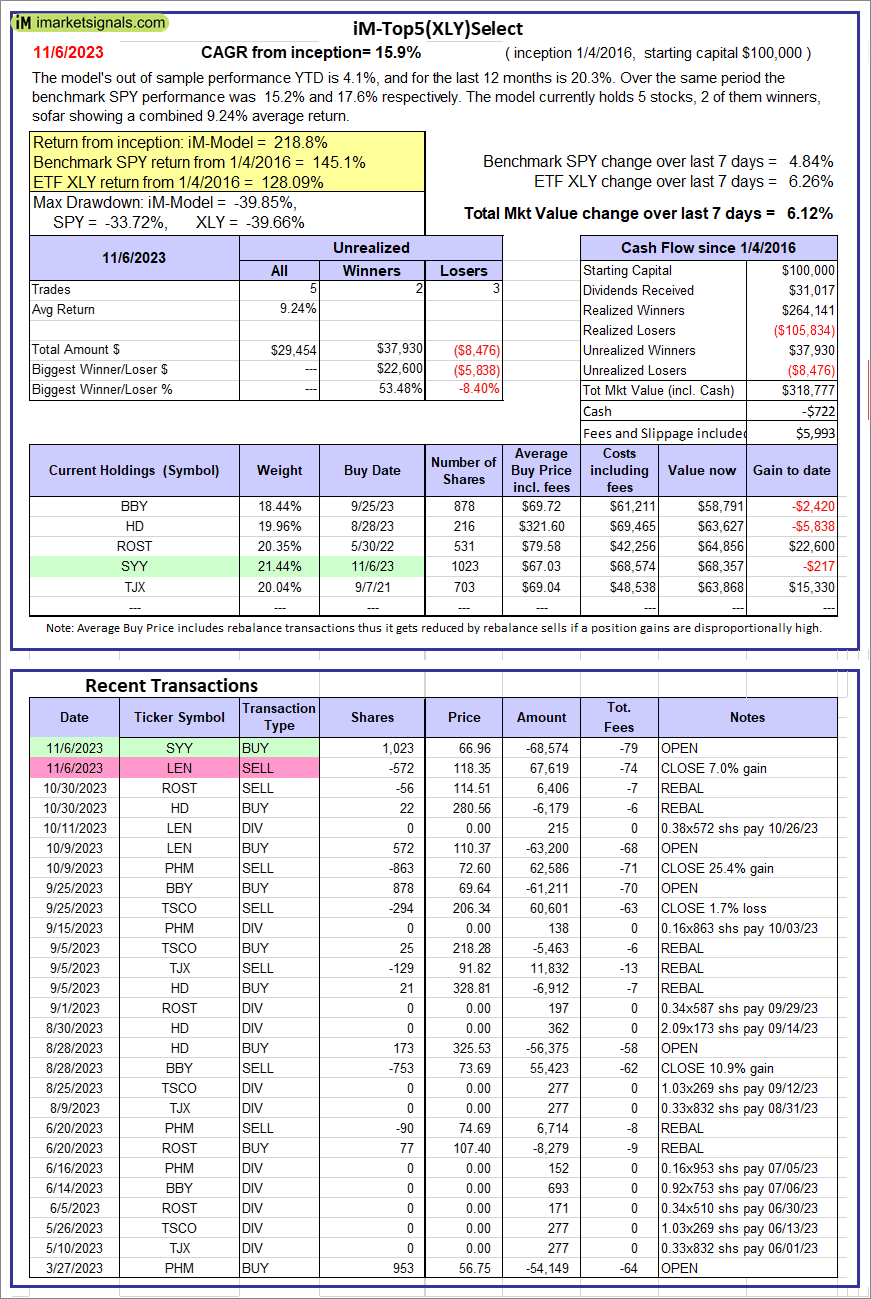 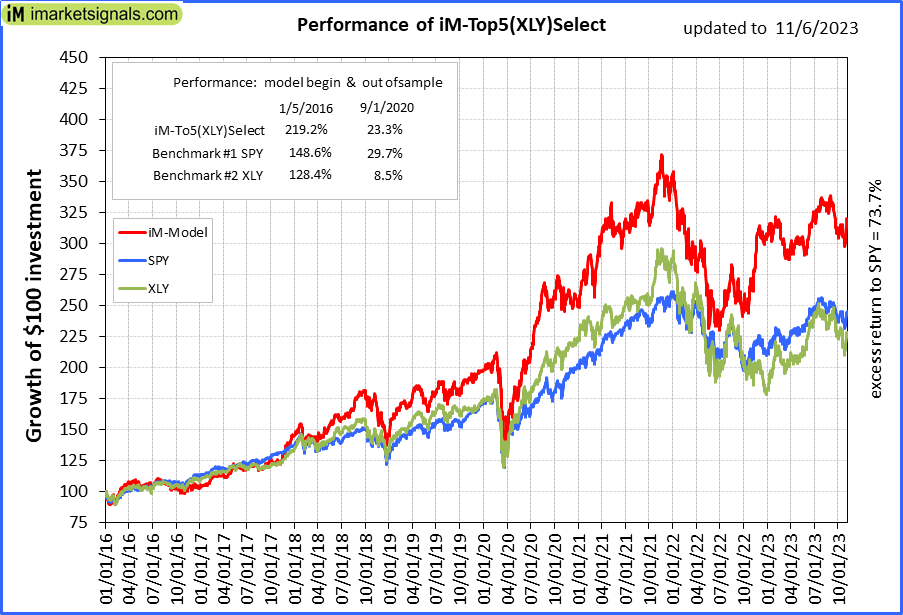 |
iM-Top5(XLY)Select: Since inception, on 1/5/2016, the model gained 218.78% while the benchmark SPY gained 145.08% over the same period. Over the previous week the market value of iM-Top5(XLY)Select gained 6.12% at a time when SPY gained 4.84%. A starting capital of $100,000 at inception on 1/5/2016 would have grown to $318,777 which includes -$722 cash and excludes $5,993 spent on fees and slippage. |
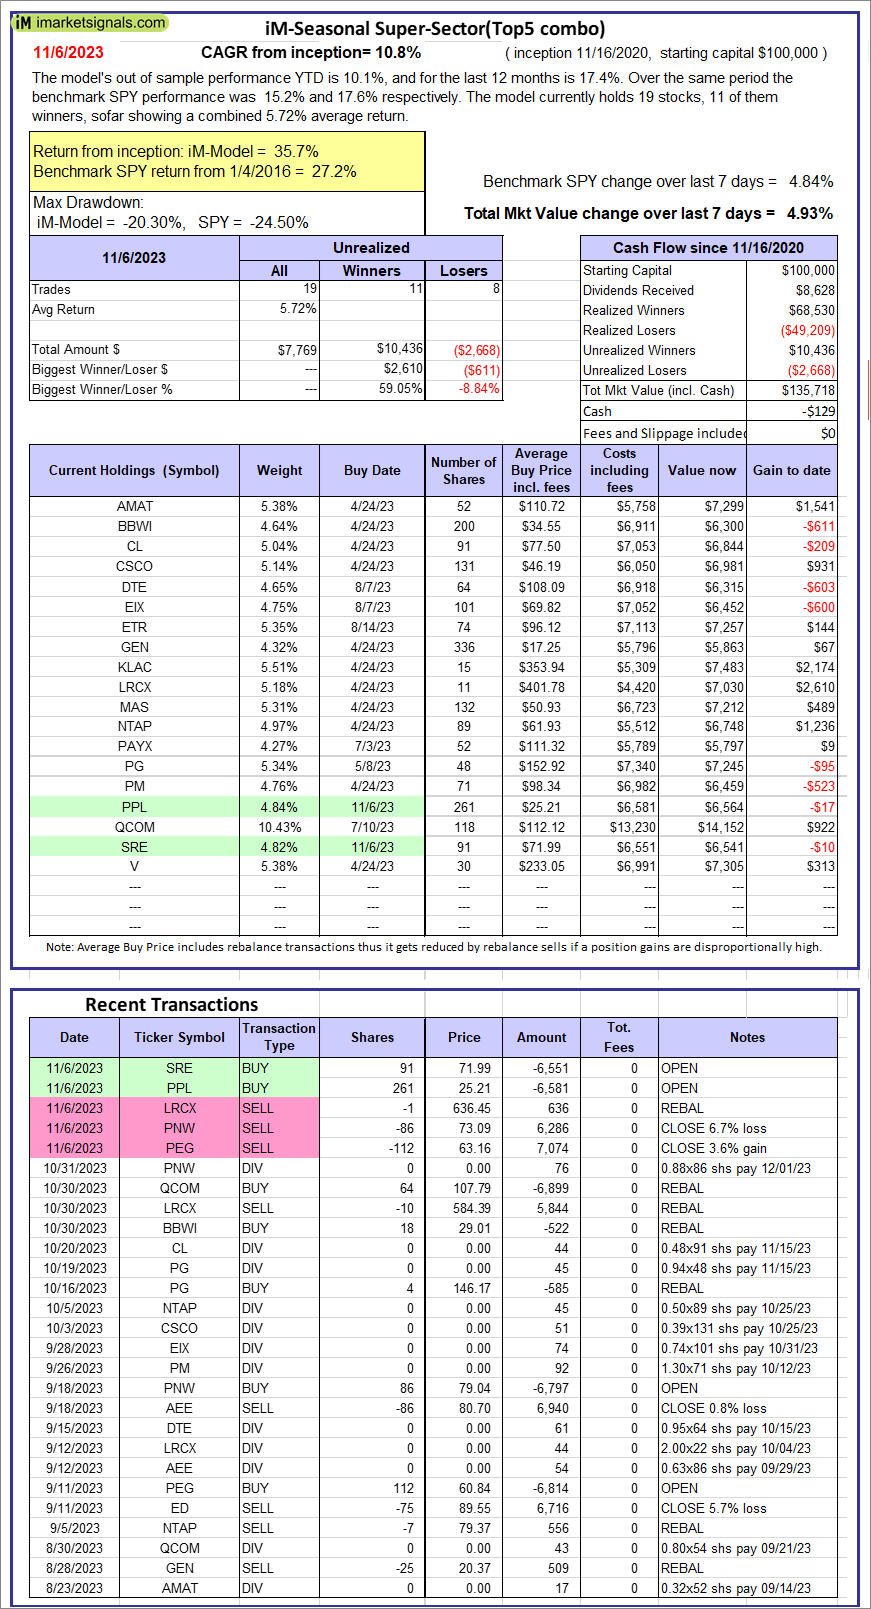 |
iM-Seasonal Super-Sectors (Top5 combo) : Since inception, on 11/17/2020, the model gained 35.72% while the benchmark SPY gained 27.22% over the same period. Over the previous week the market value of iM-Seasonal Super-Sectors (Top5 combo) gained 4.93% at a time when SPY gained 4.84%. A starting capital of $100,000 at inception on 11/17/2020 would have grown to $135,718 which includes -$129 cash and excludes $00 spent on fees and slippage. |
 |
iM-Dividend Growth Portfolio: The model’s out of sample performance YTD is 4.6%, and for the last 12 months is 10.9%. Over the same period the benchmark SPY performance was 15.2% and 17.6% respectively. Over the previous week the market value of the iM-Dividend Growth Portfolio gained 4.53% at a time when SPY gained 4.84%. A starting capital of $100,000 at inception on 6/30/2016 would have grown to $379,903 which includes $1,275 cash and excludes $10,558 spent on fees and slippage. |
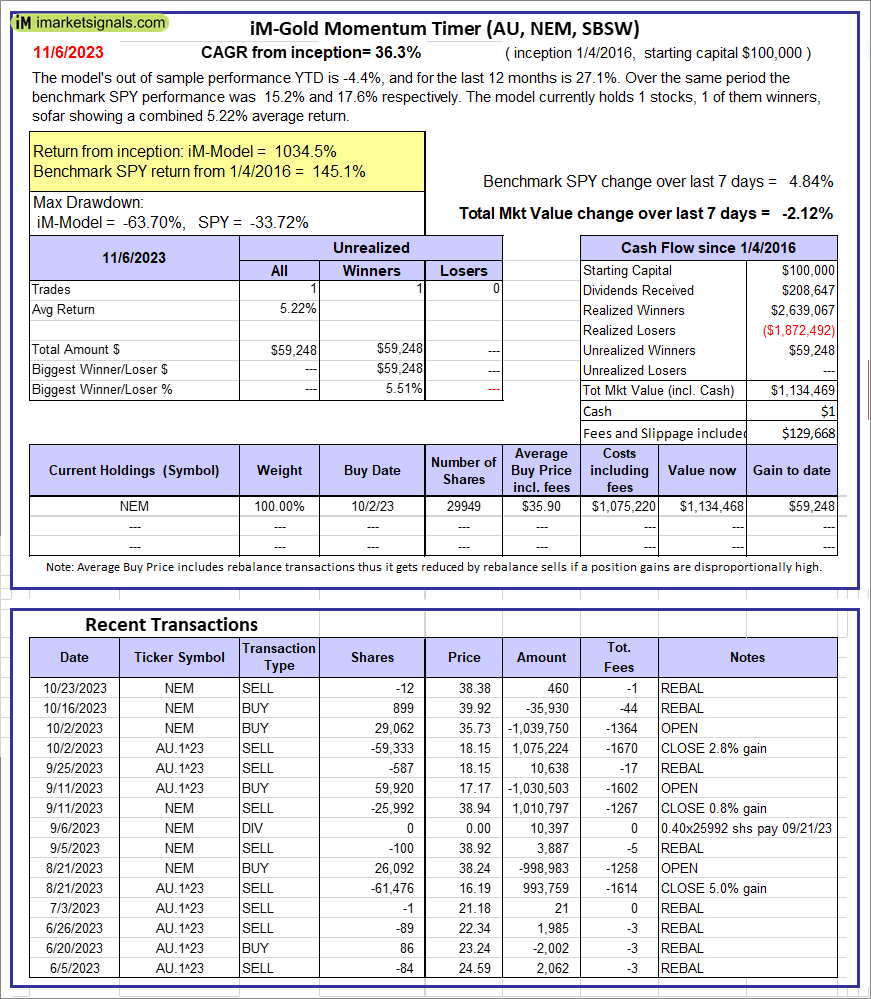 |
iM-Gold Momentum Timer (AU, NEM, SBSW): The model’s out of sample performance YTD is -4.4%, and for the last 12 months is 27.1%. Over the same period the benchmark SPY performance was 15.2% and 17.6% respectively. Over the previous week the market value of iM-Gold Momentum Timer (AU, NEM, SBSW) gained -2.12% at a time when SPY gained 4.84%. A starting capital of $100,000 at inception on 6/30/2016 would have grown to $01 which includes $129,668 cash and excludes Gain to date spent on fees and slippage. |
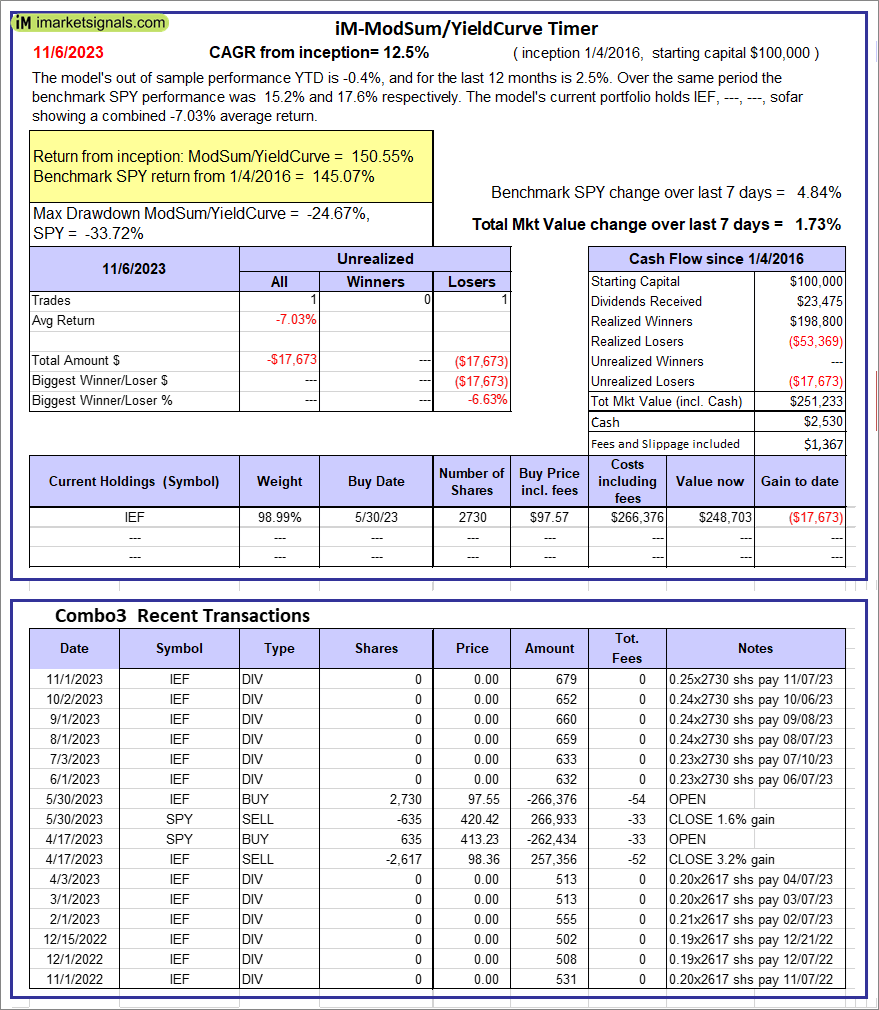 |
iM-ModSum/YieldCurve Timer: The model’s out of sample performance YTD is -0.4%, and for the last 12 months is 2.5%. Over the same period the benchmark SPY performance was 15.2% and 17.6% respectively. Over the previous week the market value of iM-PortSum/YieldCurve Timer gained 1.73% at a time when SPY gained 4.84%. A starting capital of $100,000 at inception on 1/1/2016 would have grown to $251,233 which includes $2,530 cash and excludes $1,367 spent on fees and slippage. |
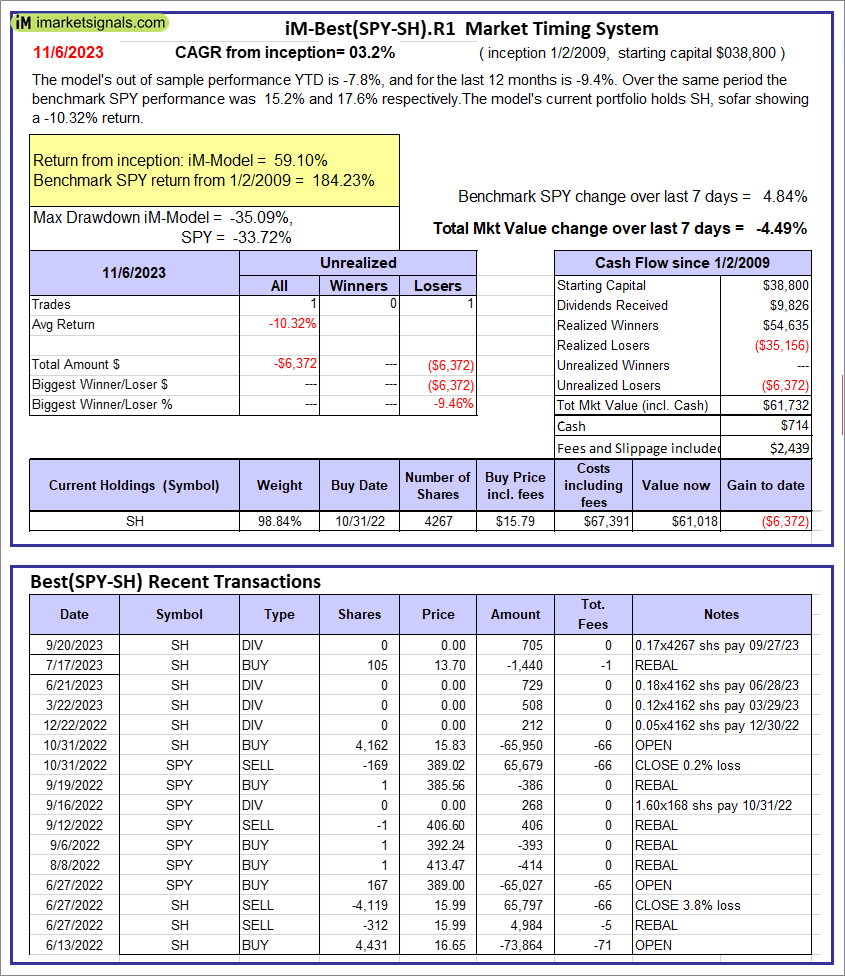 |
iM-Best(SPY-SH).R1: The model’s out of sample performance YTD is -7.8%, and for the last 12 months is -9.4%. Over the same period the benchmark SPY performance was 15.2% and 17.6% respectively. Over the previous week the market value of Best(SPY-SH) gained -4.49% at a time when SPY gained 4.84%. A starting capital of $100,000 at inception on 1/2/2009 would have grown to $61,732 which includes $714 cash and excludes $2,439 spent on fees and slippage. |
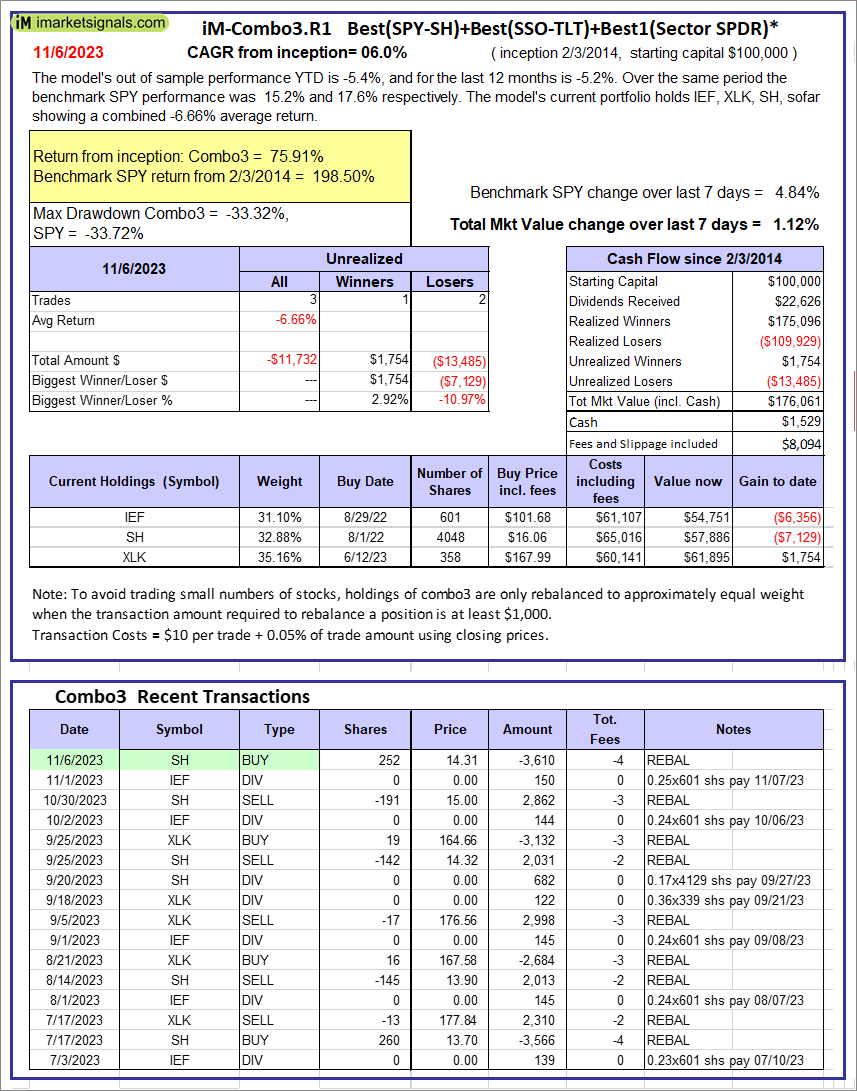 |
iM-Combo3.R1: The model’s out of sample performance YTD is -5.4%, and for the last 12 months is -5.2%. Over the same period the benchmark SPY performance was 15.2% and 17.6% respectively. Over the previous week the market value of iM-Combo3.R1 gained 1.12% at a time when SPY gained 4.84%. A starting capital of $100,000 at inception on 2/3/2014 would have grown to $176,061 which includes $1,529 cash and excludes $8,094 spent on fees and slippage. |
 |
iM-Combo5: The model’s out of sample performance YTD is -1.9%, and for the last 12 months is -0.6%. Over the same period the benchmark SPY performance was 15.2% and 17.6% respectively. Over the previous week the market value of iM-Combo5 gained 1.34% at a time when SPY gained 4.84%. A starting capital of $100,000 at inception on 2/22/2016 would have grown to $150,494 which includes $3,325 cash and excludes $0 spent on fees and slippage. |
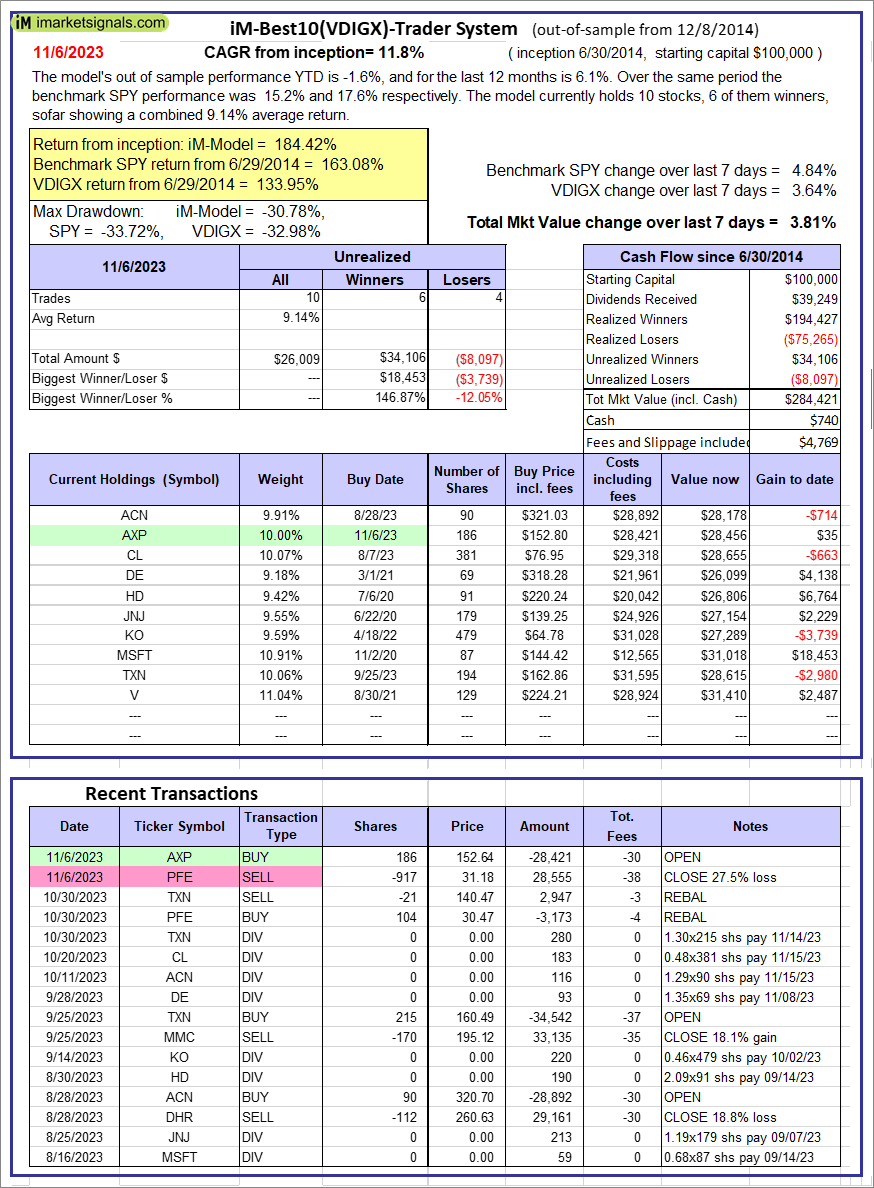 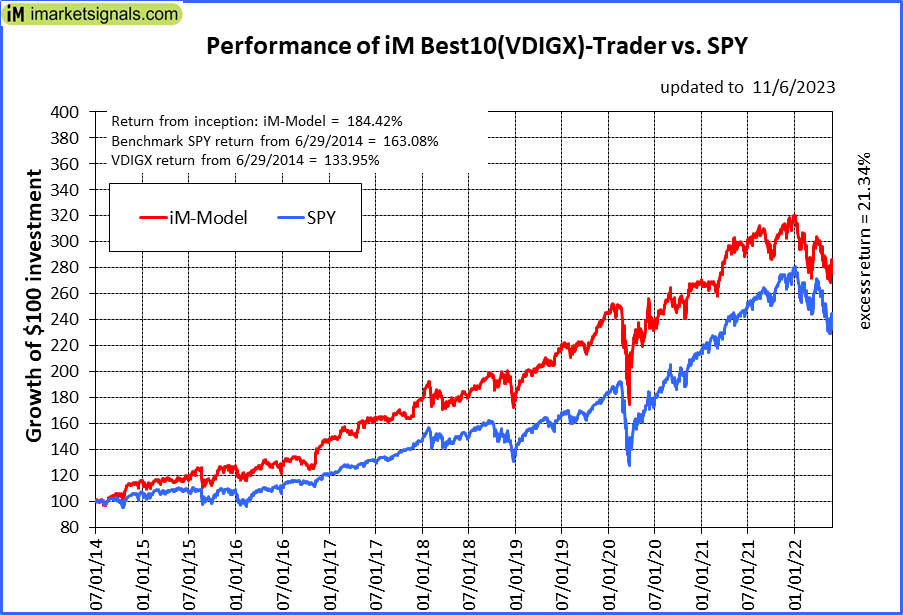 |
iM-Best10(VDIGX)-Trader: The model’s out of sample performance YTD is -1.6%, and for the last 12 months is 6.1%. Over the same period the benchmark SPY performance was 15.2% and 17.6% respectively. Since inception, on 7/1/2014, the model gained 184.42% while the benchmark SPY gained 163.08% and VDIGX gained 133.95% over the same period. Over the previous week the market value of iM-Best10(VDIGX) gained 3.81% at a time when SPY gained 4.84%. A starting capital of $100,000 at inception on 7/1/2014 would have grown to $284,421 which includes $740 cash and excludes $4,769 spent on fees and slippage. |
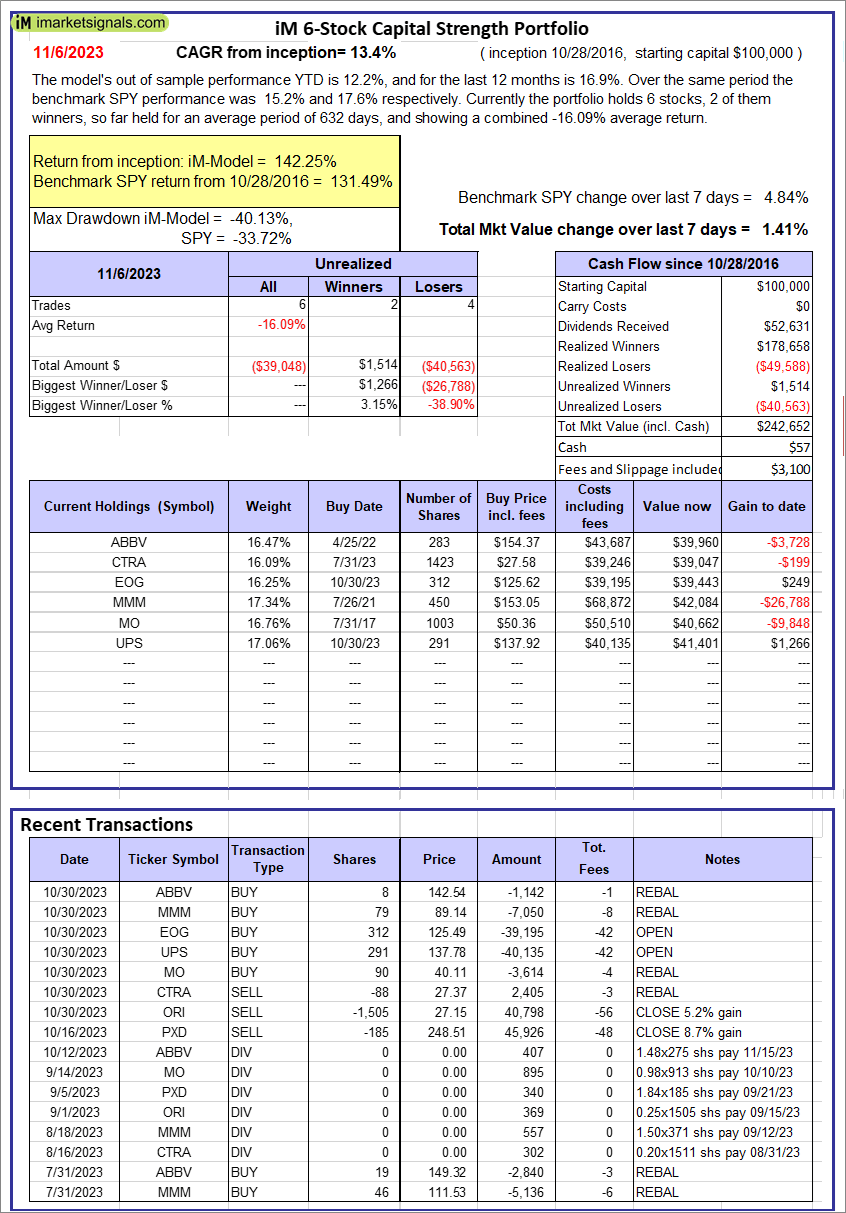 |
iM 6-Stock Capital Strength Portfolio: The model’s out of sample performance YTD is 12.2%, and for the last 12 months is 16.9%. Over the same period the benchmark SPY performance was 15.2% and 17.6% respectively. Over the previous week the market value of the iM 6-Stock Capital Strength Portfolio gained 1.41% at a time when SPY gained 4.84%. A starting capital of $100,000 at inception on 10/28/2016 would have grown to $242,652 which includes $57 cash and excludes $3,100 spent on fees and slippage. |
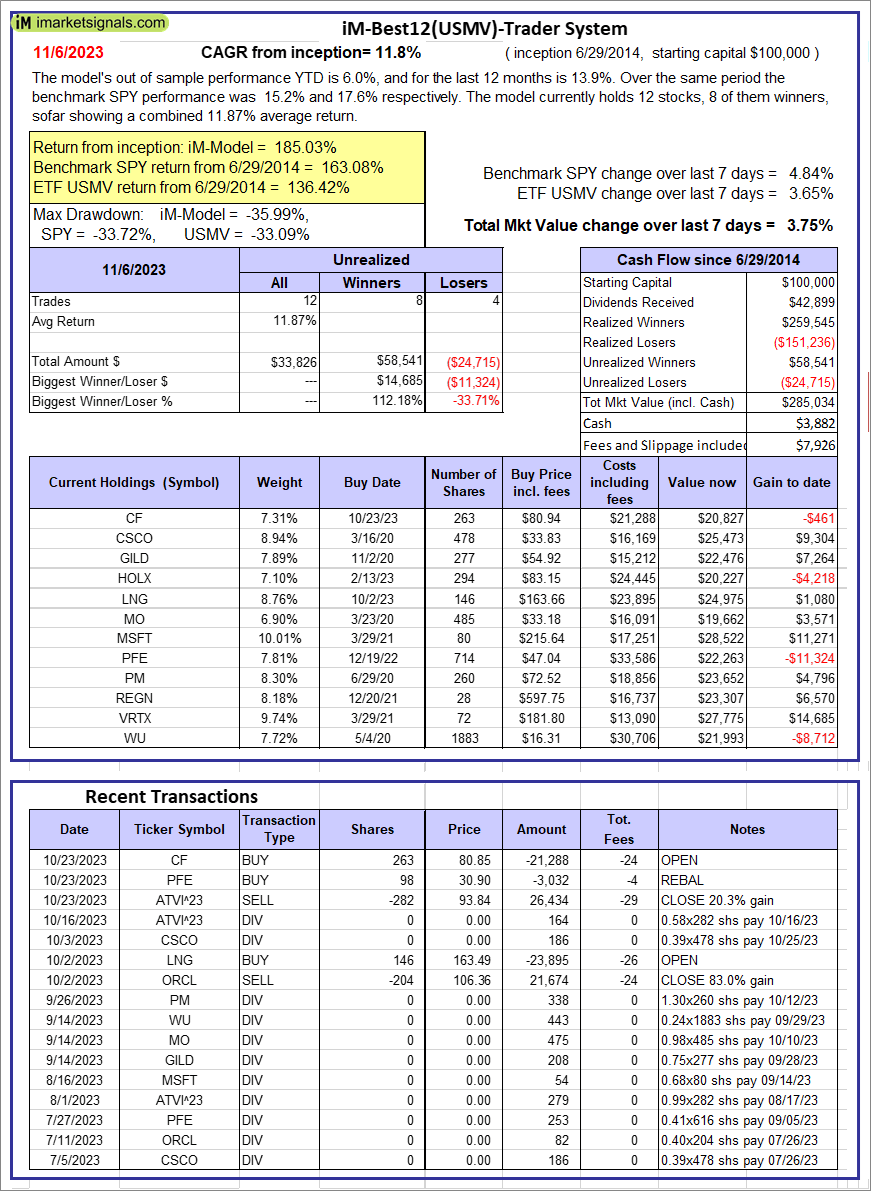  |
iM-Best12(USMV)-Trader: The model’s out of sample performance YTD is 6.0%, and for the last 12 months is 13.9%. Over the same period the benchmark SPY performance was 15.2% and 17.6% respectively. Since inception, on 6/30/2014, the model gained 185.03% while the benchmark SPY gained 163.08% and the ETF USMV gained 136.42% over the same period. Over the previous week the market value of iM-Best12(USMV)-Trader gained 3.75% at a time when SPY gained 4.84%. A starting capital of $100,000 at inception on 6/30/2014 would have grown to $285,034 which includes $3,882 cash and excludes $7,926 spent on fees and slippage. |
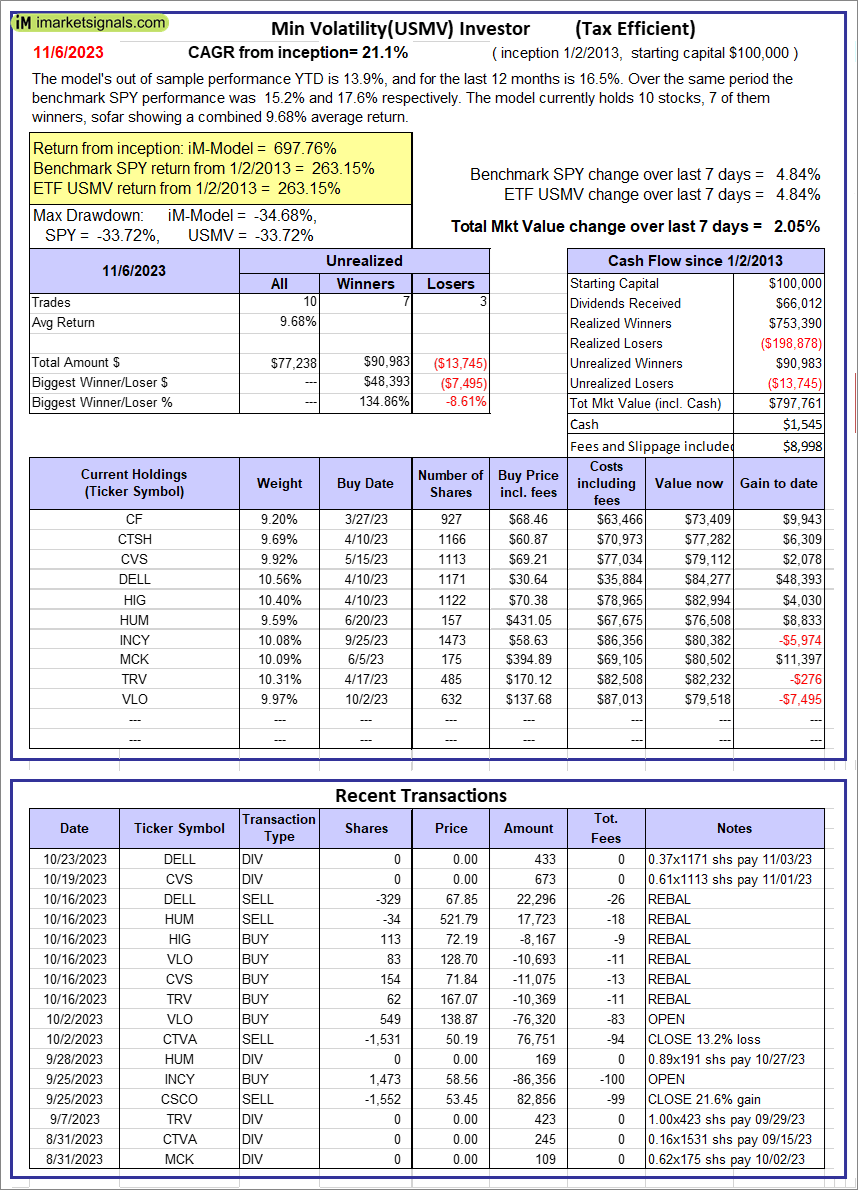 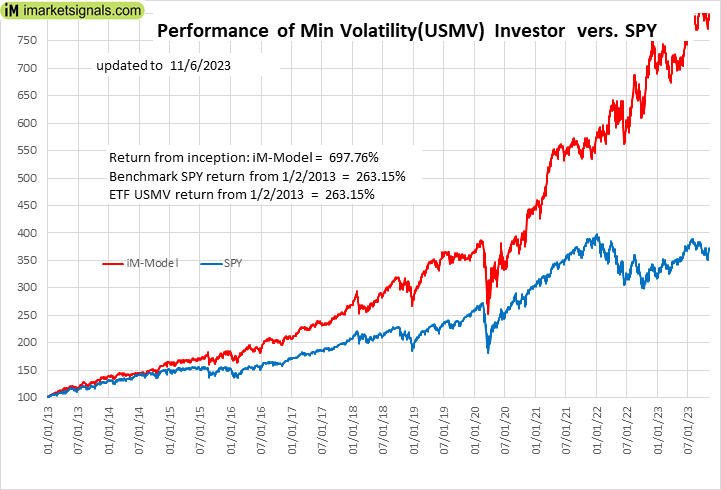 |
iM-Min Volatility(USMV) Investor (Tax Efficient): The model’s out of sample performance YTD is 13.9%, and for the last 12 months is 16.5%. Over the same period the benchmark SPY performance was 15.2% and 17.6% respectively. Since inception, on 1/3/2013, the model gained 697.76% while the benchmark SPY gained 263.15% and the ETF USMV gained 263.15% over the same period. Over the previous week the market value of iM-Best12(USMV)Q1 gained 2.05% at a time when SPY gained 4.84%. A starting capital of $100,000 at inception on 1/3/2013 would have grown to $797,761 which includes $1,545 cash and excludes $8,998 spent on fees and slippage. |
 |
iM-Bond Market Trader (High-Yield Bond or 10-yr Treasury Bond): The model’s out of sample performance YTD is -2.5%, and for the last 12 months is 0.4%. Over the same period the benchmark BND performance was -0.7% and 2.5% respectively. Over the previous week the market value of the iM-Bond Market Trader (High-Yield Bond or 10-yr Treasury Bond) gained 1.70% at a time when BND gained 1.69%. A starting capital of $10,000 at inception on 1/3/2000 would have grown to $129,613 which includes $3,986 cash and excludes $2,495 spent on fees and slippage. |
|
|
iM-ModSum/YieldCurve Timer: The model’s out of sample performance YTD is -0.4%, and for the last 12 months is 2.5%. Over the same period the benchmark SPY performance was 15.2% and 17.6% respectively. Over the previous week the market value of iM-PortSum/YieldCurve Timer gained 1.73% at a time when SPY gained 4.84%. A starting capital of $100,000 at inception on 1/1/2016 would have grown to $251,233 which includes $2,530 cash and excludes $1,367 spent on fees and slippage. |
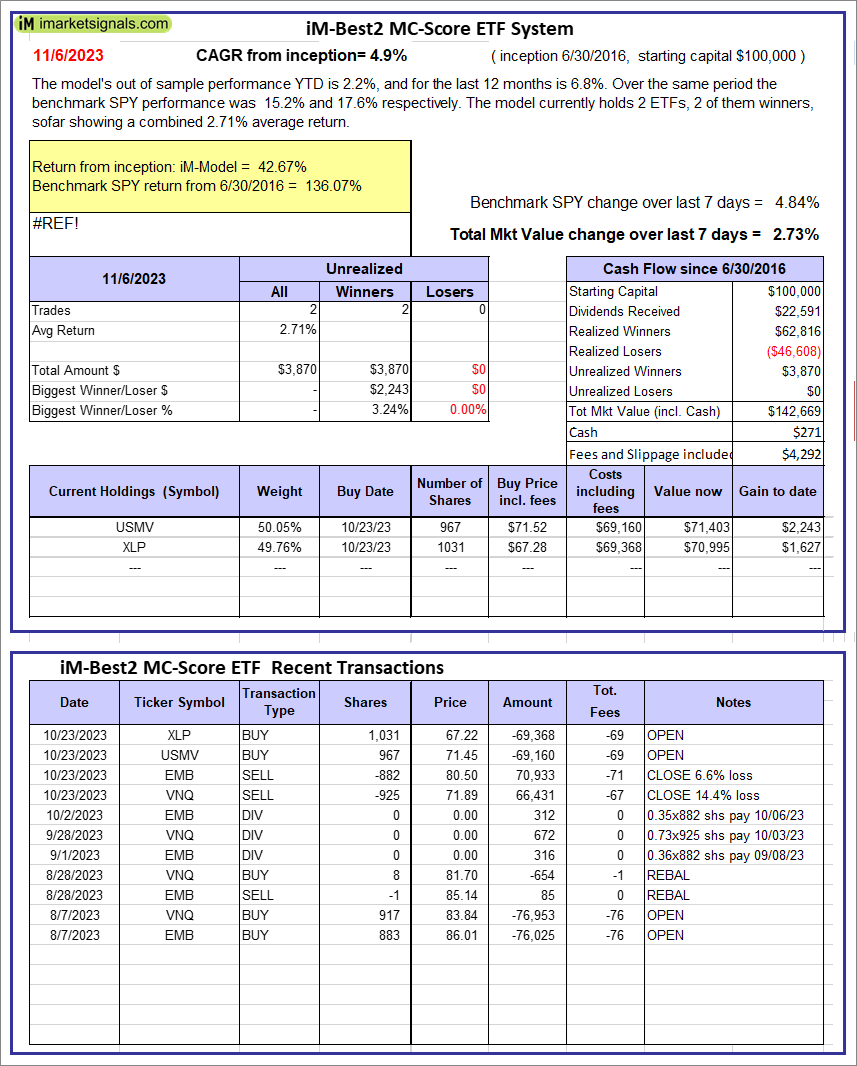 |
iM-Best2 MC-Score ETF System: The model’s out of sample performance YTD is 2.2%, and for the last 12 months is 6.8%. Over the same period the benchmark SPY performance was 15.2% and 17.6% respectively. Over the previous week the market value of the iM-Best2 MC-Score ETF System gained 2.73% at a time when SPY gained 4.84%. A starting capital of $100,000 at inception on 6/30/2016 would have grown to $142,669 which includes $271 cash and excludes $4,292 spent on fees and slippage. |
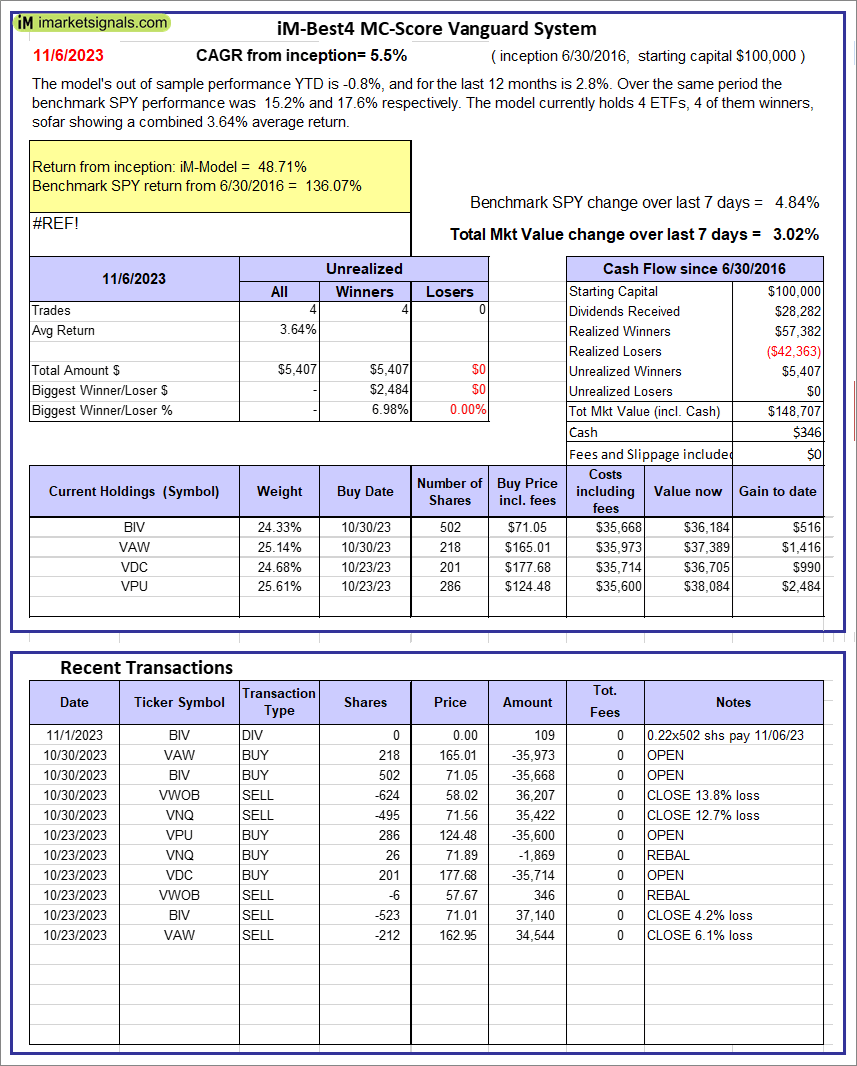 |
iM-Best4 MC-Score Vanguard System: The model’s out of sample performance YTD is -0.8%, and for the last 12 months is 2.8%. Over the same period the benchmark SPY performance was 15.2% and 17.6% respectively. Over the previous week the market value of the iM-Best4 MC-Score Vanguard System gained 3.02% at a time when SPY gained 4.84%. A starting capital of $100,000 at inception on 6/30/2016 would have grown to $148,707 which includes $346 cash and excludes $00 spent on fees and slippage. |
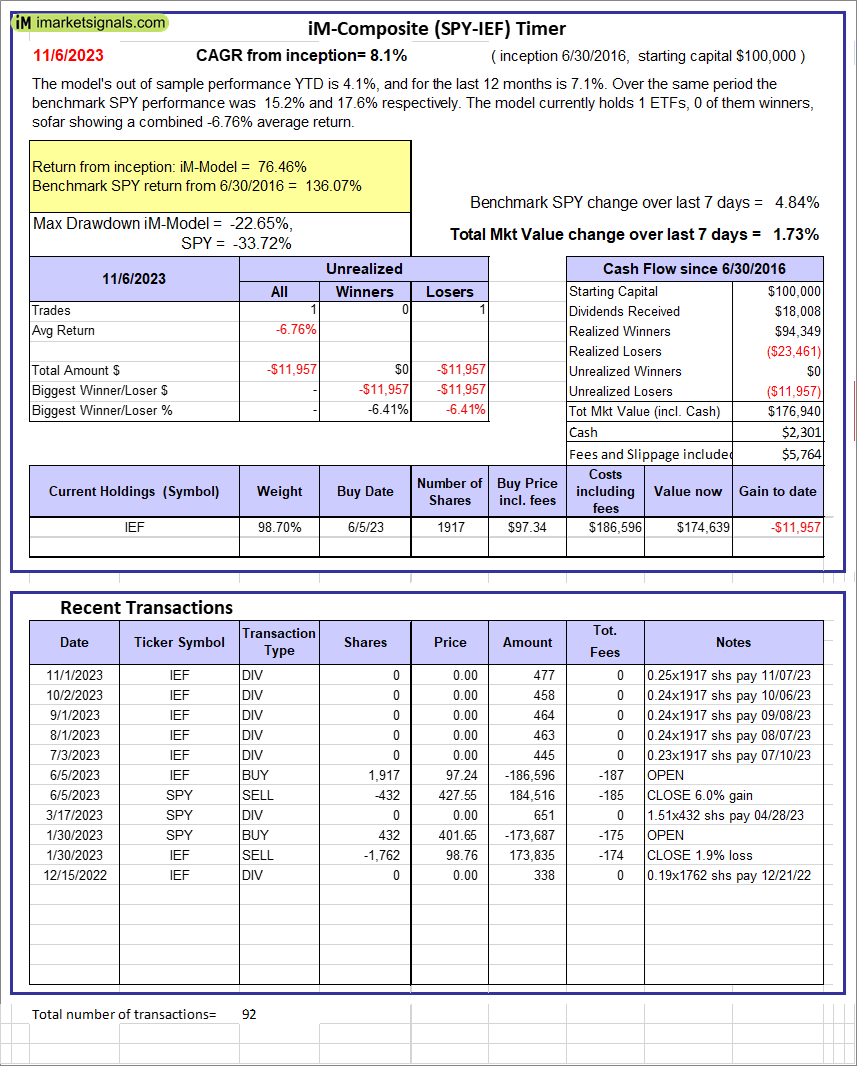 |
iM-Composite (SPY-IEF) Timer: The model’s out of sample performance YTD is 4.1%, and for the last 12 months is 7.1%. Over the same period the benchmark SPY performance was 15.2% and 17.6% respectively. Over the previous week the market value of the iM-Composite (SPY-IEF) Timer gained 1.73% at a time when SPY gained 4.84%. A starting capital of $100,000 at inception on 6/30/2016 would have grown to $176,940 which includes $2,301 cash and excludes $5,764 spent on fees and slippage. |
 |
iM-Composite(Gold-Stocks-Bond) Timer: The model’s out of sample performance YTD is 8.1%, and for the last 12 months is 17.2%. Over the same period the benchmark SPY performance was 15.2% and 17.6% respectively. Over the previous week the market value of the iM-Composite(Gold-Stocks-Bond) Timer gained -0.95% at a time when SPY gained 4.84%. A starting capital of $100,000 at inception on 6/30/2016 would have grown to $186,529 which includes $36 cash and excludes $9,190 spent on fees and slippage. |
iM-Best Reports – 11/6/2023
Posted in pmp SPY-SH
Leave a Reply
You must be logged in to post a comment.