
  |
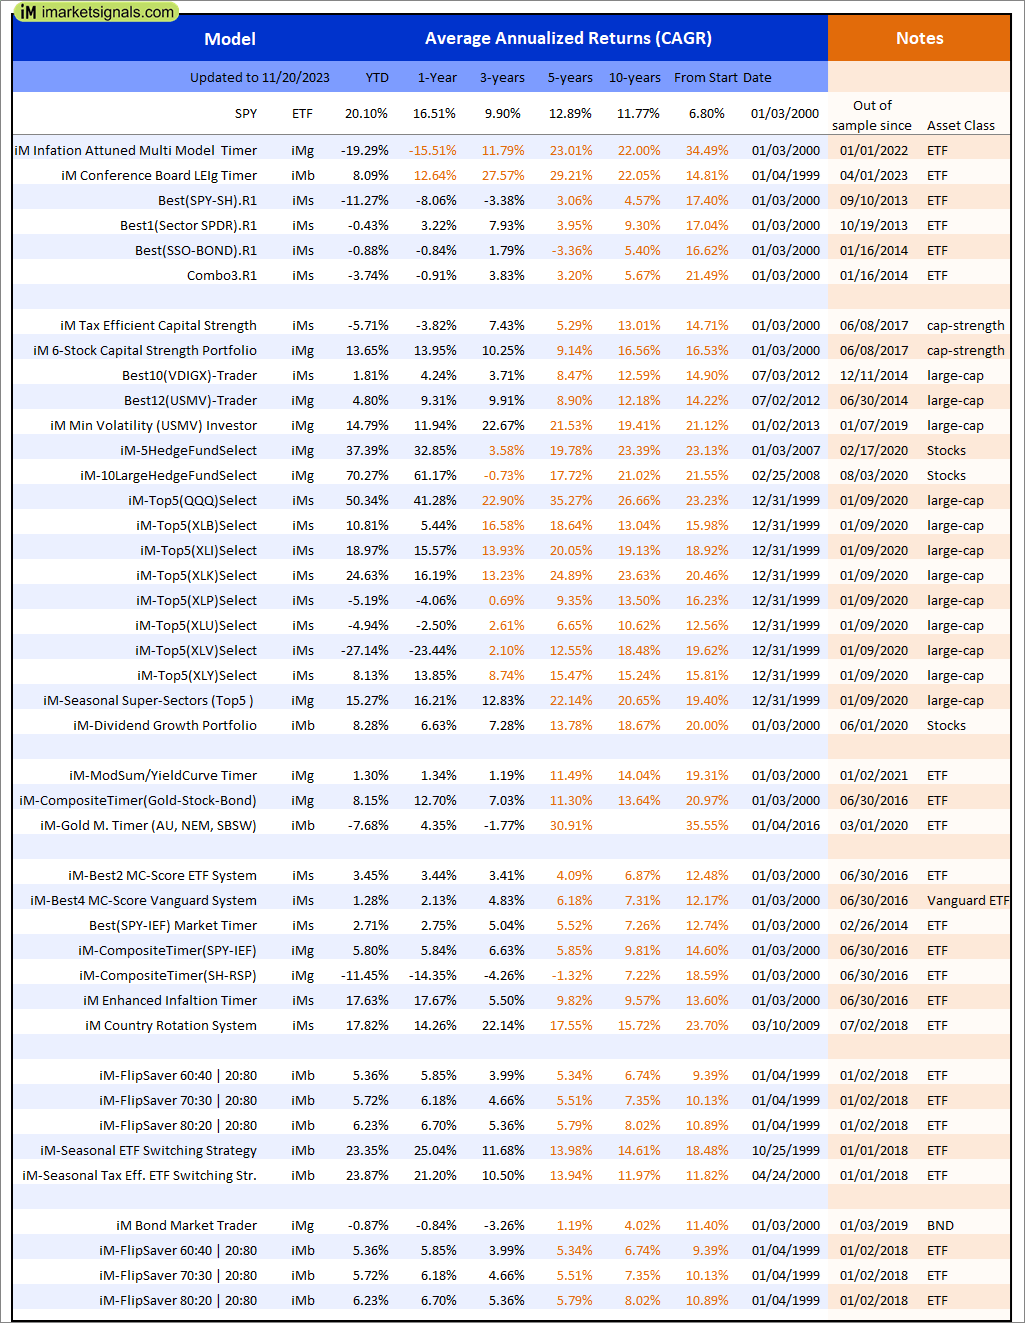
Out of sample performance summary of our models for the past 1, 2, 4 and 13 week periods. The active active return indicates how the models over- or underperformed the benchmark ETF SPY. Also the YTD, and the 1-, 3-, 5- and 10-year annualized returns are shown in the second table |
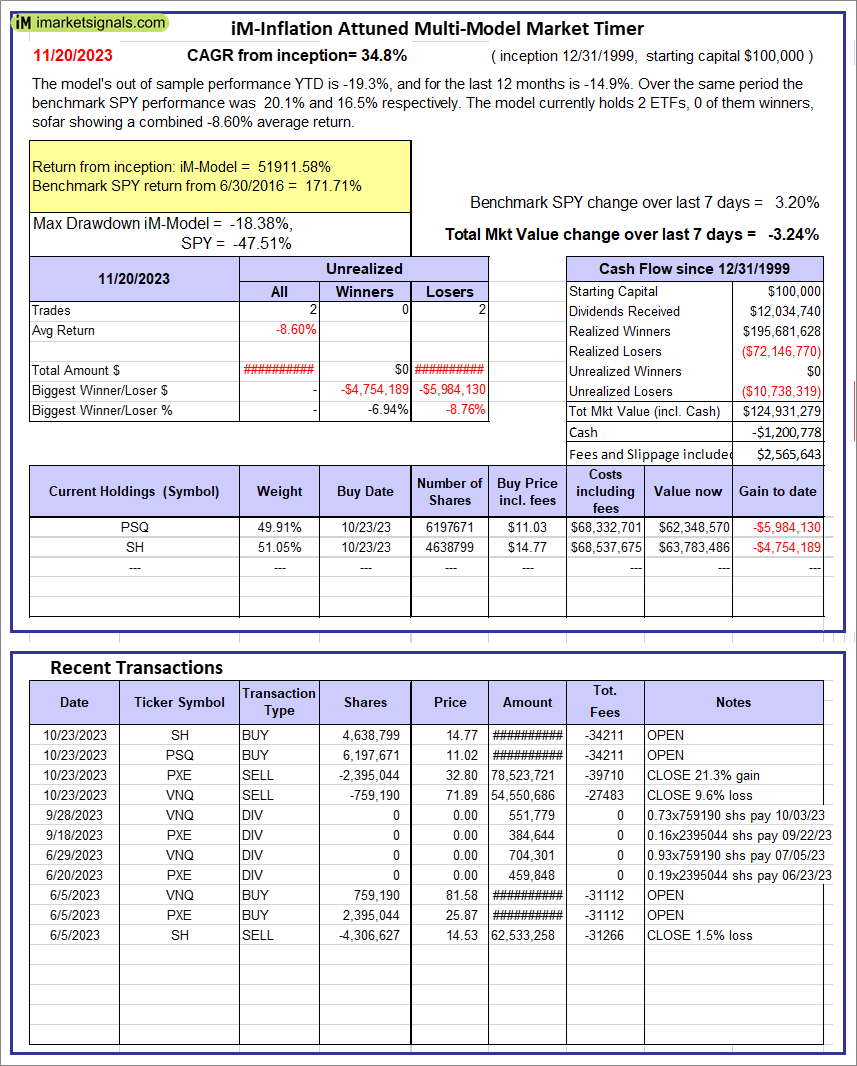 |
iM-Inflation Attuned Multi-Model Market Timer: The model’s out of sample performance YTD is -19.3%, and for the last 12 months is -14.9%. Over the same period the benchmark SPY performance was 20.1% and 16.5% respectively. Over the previous week the market value of the iM-Inflation Attuned Multi-Model Market Timer gained -3.24% at a time when SPY gained 3.20%. A starting capital of $100,000 at inception on 3/24/2017 would have grown to $124,931,279 which includes -$1,200,778 cash and excludes $2,565,643 spent on fees and slippage. |
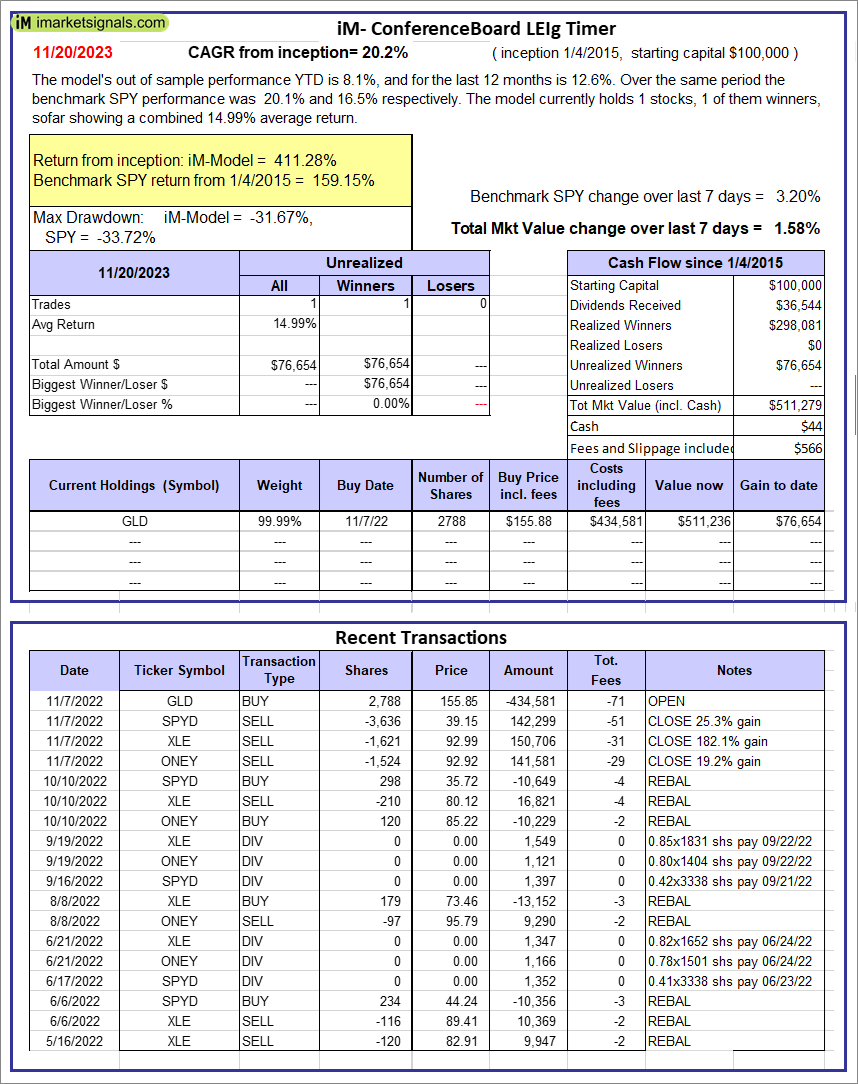 |
iM-Conference Board LEIg Timer: The model’s performance YTD is 14.3%, and for the last 12 months is 7.3%. Over the same period the benchmark SPY performance was 20.1% and 9.4% respectively. Over the previous week the market value of the iM-Conference Board LEIg Timer gained 1.58% at a time when SPY gained 3.20%. A starting capital of $100,000 at inception on 4/5/2017 would have grown to $511,279 which includes $44 cash and excludes $566 spent on fees and slippage. |
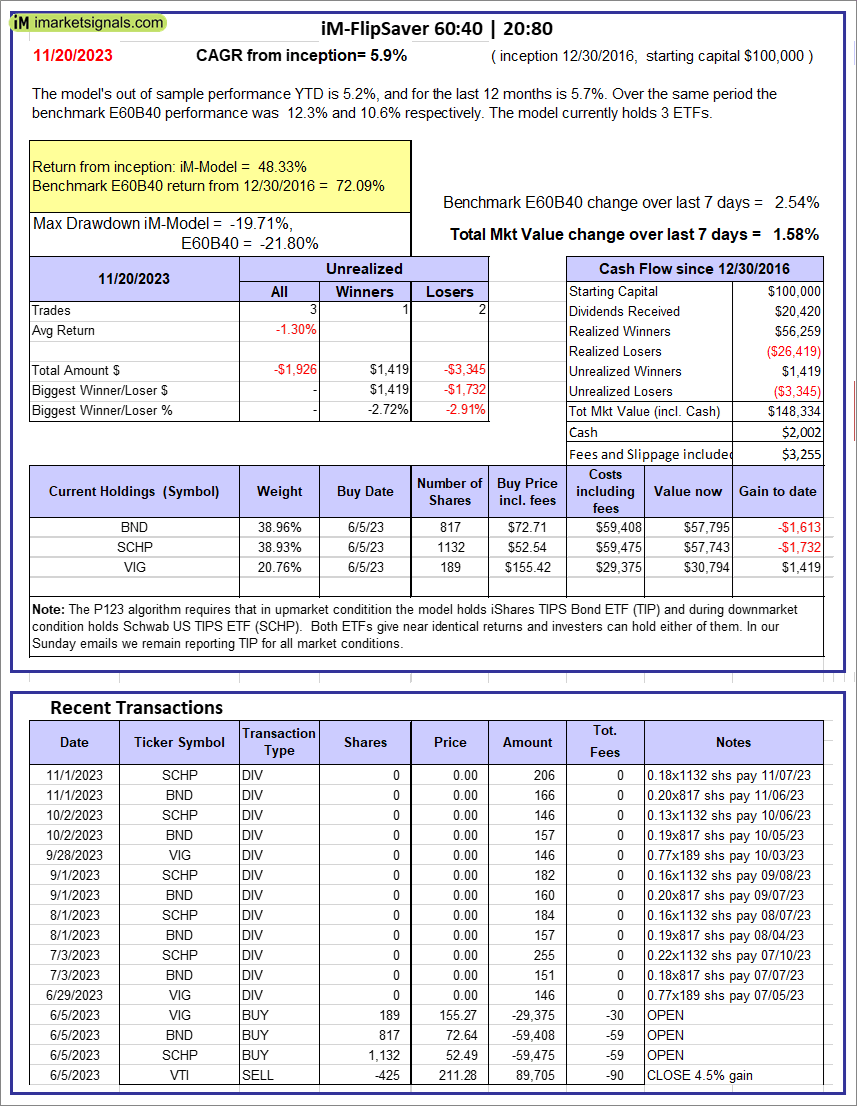 |
iM-FlipSaver 60:40 | 20:80 – 2017: The model’s out of sample performance YTD is 5.2%, and for the last 12 months is 5.7%. Over the same period the benchmark E60B40 performance was 12.3% and 10.6% respectively. Over the previous week the market value of iM-FlipSaver 80:20 | 20:80 gained 1.58% at a time when SPY gained 2.54%. A starting capital of $100,000 at inception on 7/16/2015 would have grown to $148,334 which includes $2,002 cash and excludes $3,255 spent on fees and slippage. |
 |
iM-FlipSaver 70:30 | 20:80 – 2017: The model’s out of sample performance YTD is 5.7%, and for the last 12 months is 6.2%. Over the same period the benchmark E60B40 performance was 12.3% and 10.6% respectively. Over the previous week the market value of iM-FlipSaver 70:30 | 20:80 gained 1.58% at a time when SPY gained 2.54%. A starting capital of $100,000 at inception on 7/15/2015 would have grown to $153,275 which includes $1,874 cash and excludes $3,432 spent on fees and slippage. |
 |
iM-FlipSaver 80:20 | 20:80 – 2017: The model’s out of sample performance YTD is 6.2%, and for the last 12 months is 6.7%. Over the same period the benchmark E60B40 performance was 12.3% and 10.6% respectively. Over the previous week the market value of iM-FlipSaver 80:20 | 20:80 gained 1.58% at a time when SPY gained 2.54%. A starting capital of $100,000 at inception on 1/2/2017 would have grown to $158,088 which includes $1,912 cash and excludes $3,600 spent on fees and slippage. |
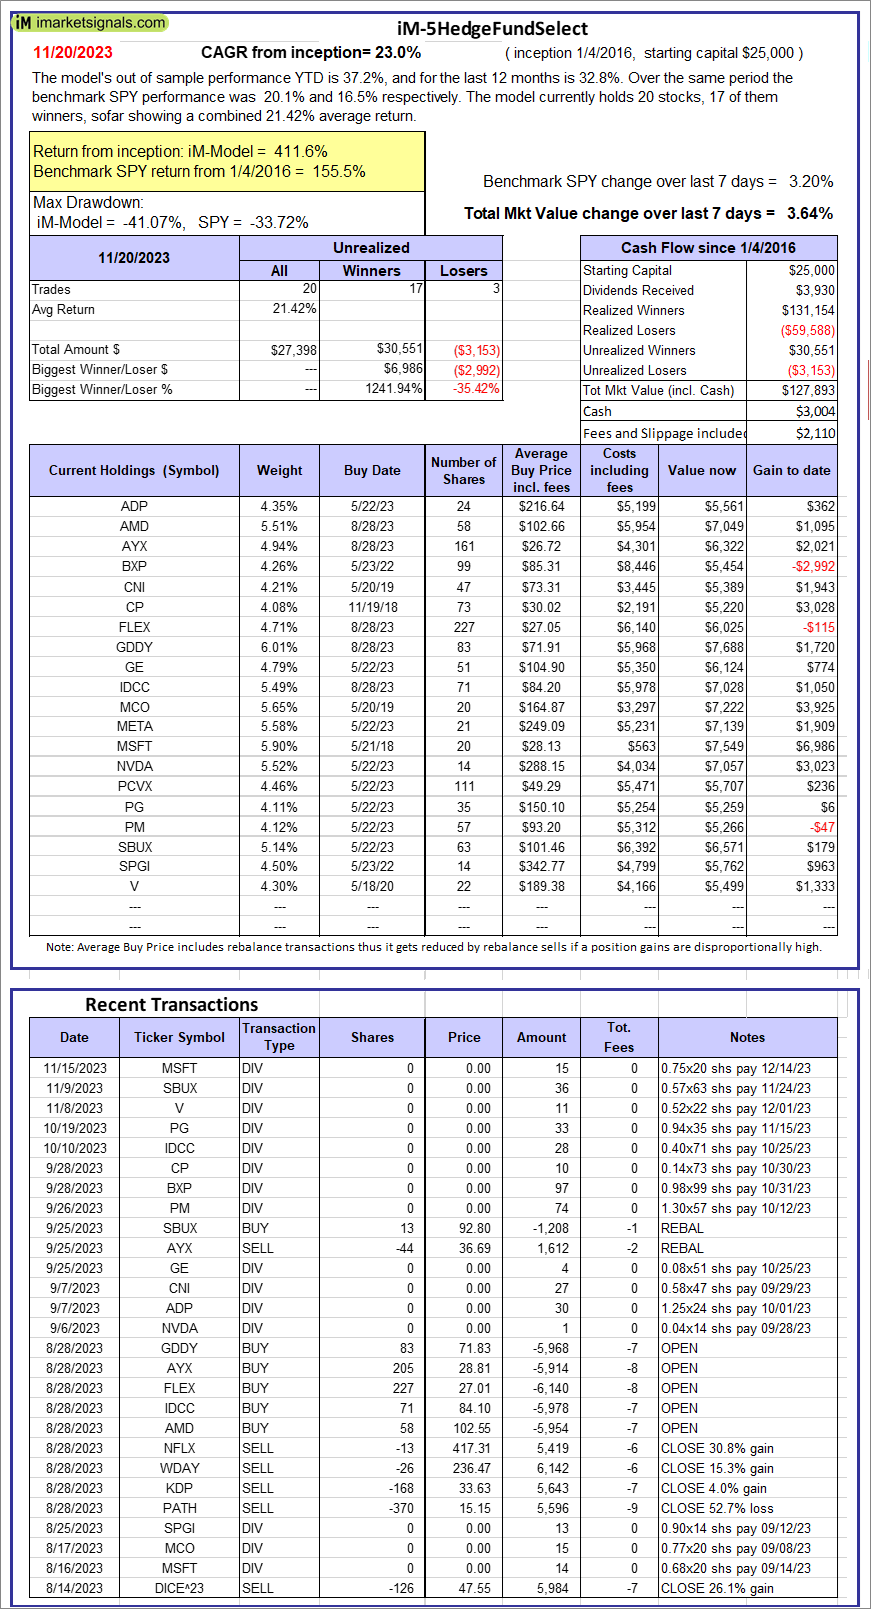 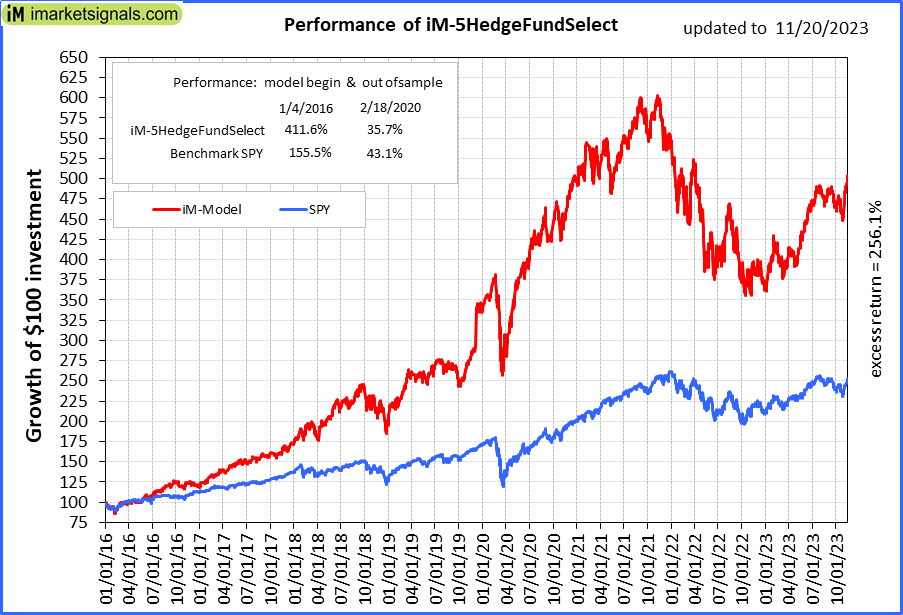 |
iM-5HedgeFundSelect: Since inception, on 1/5/2016, the model gained 411.57% while the benchmark SPY gained 155.52% over the same period. Over the previous week the market value of iM-5HedgeFundSelect gained 3.64% at a time when SPY gained 3.20%. A starting capital of $25,000 at inception on 1/5/2016 would have grown to $127,893 which includes $3,004 cash and excludes $2,110 spent on fees and slippage. |
  |
iM-10LargeHedgeFundSelect: Since inception, on 1/5/2016, the model gained 320.05% while the benchmark SPY gained 155.52% over the same period. Over the previous week the market value of iM-10LargeHedgeFundSelect gained 4.42% at a time when SPY gained 3.20%. A starting capital of $25,000 at inception on 1/5/2016 would have grown to $105,013 which includes $123 cash and excludes $1,311 spent on fees and slippage. |
  |
iM-Top5(QQQ)Select: Since inception, on 1/5/2016, the model gained 723.45% while the benchmark SPY gained 155.52% over the same period. Over the previous week the market value of iM-Top5(QQQ)Select gained 4.59% at a time when SPY gained 3.20%. A starting capital of $100,000 at inception on 1/5/2016 would have grown to $823,451 which includes $1,781 cash and excludes $10,658 spent on fees and slippage. |
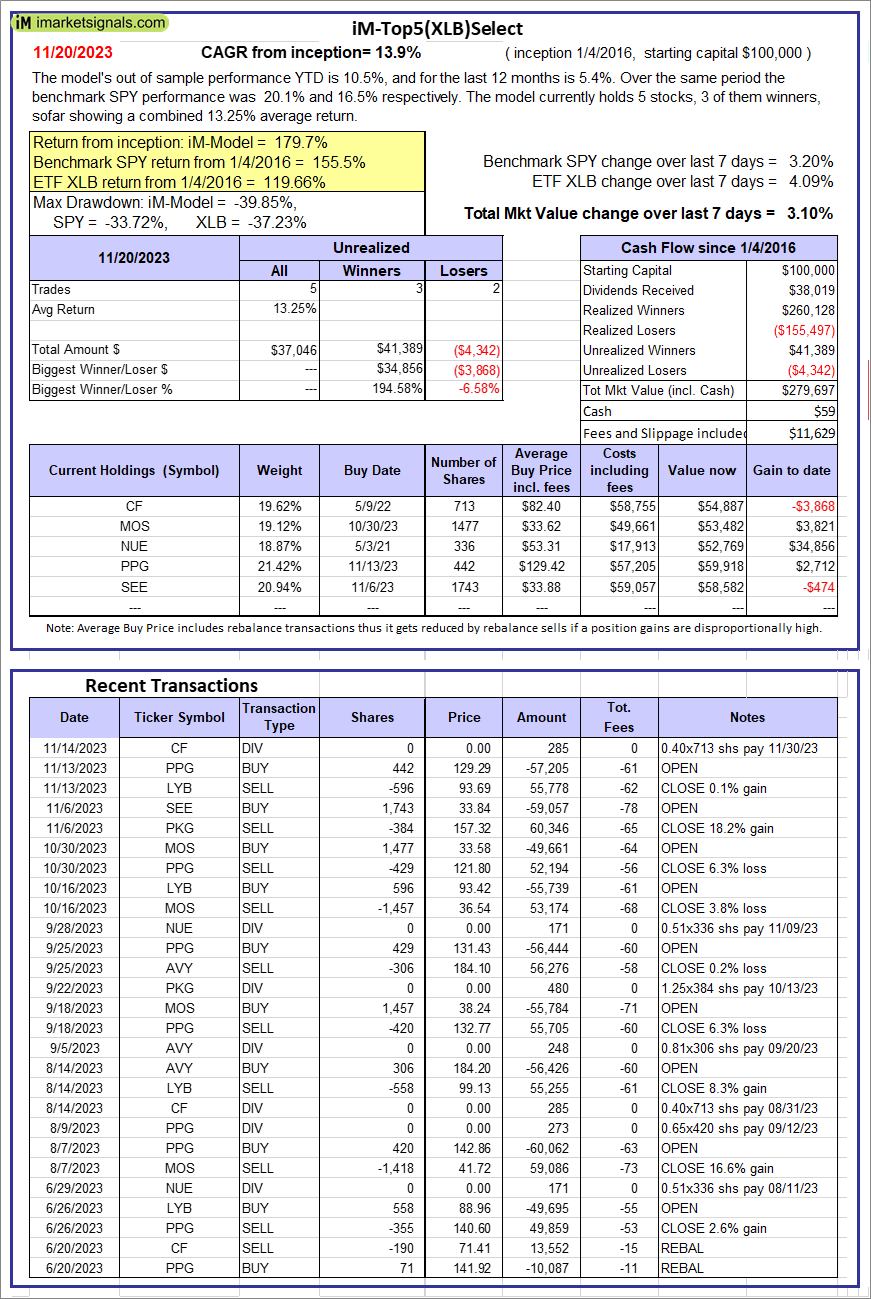 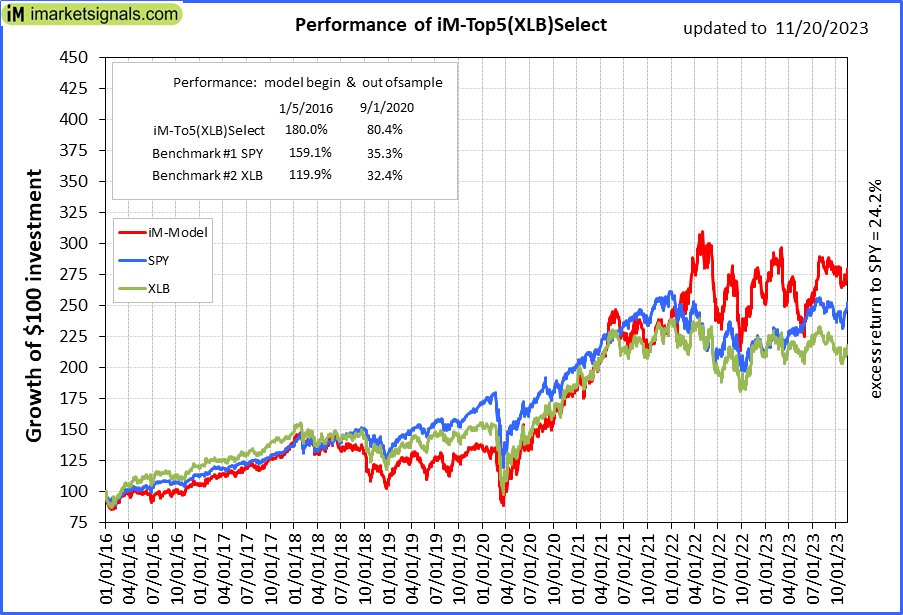 |
iM-Top5(XLB)Select: Since inception, on 1/5/2016, the model gained 179.70% while the benchmark SPY gained 155.52% over the same period. Over the previous week the market value of iM-Top5(XLB)Select gained 3.10% at a time when SPY gained 3.20%. A starting capital of $100,000 at inception on 1/5/2016 would have grown to $279,697 which includes $59 cash and excludes $11,629 spent on fees and slippage. |
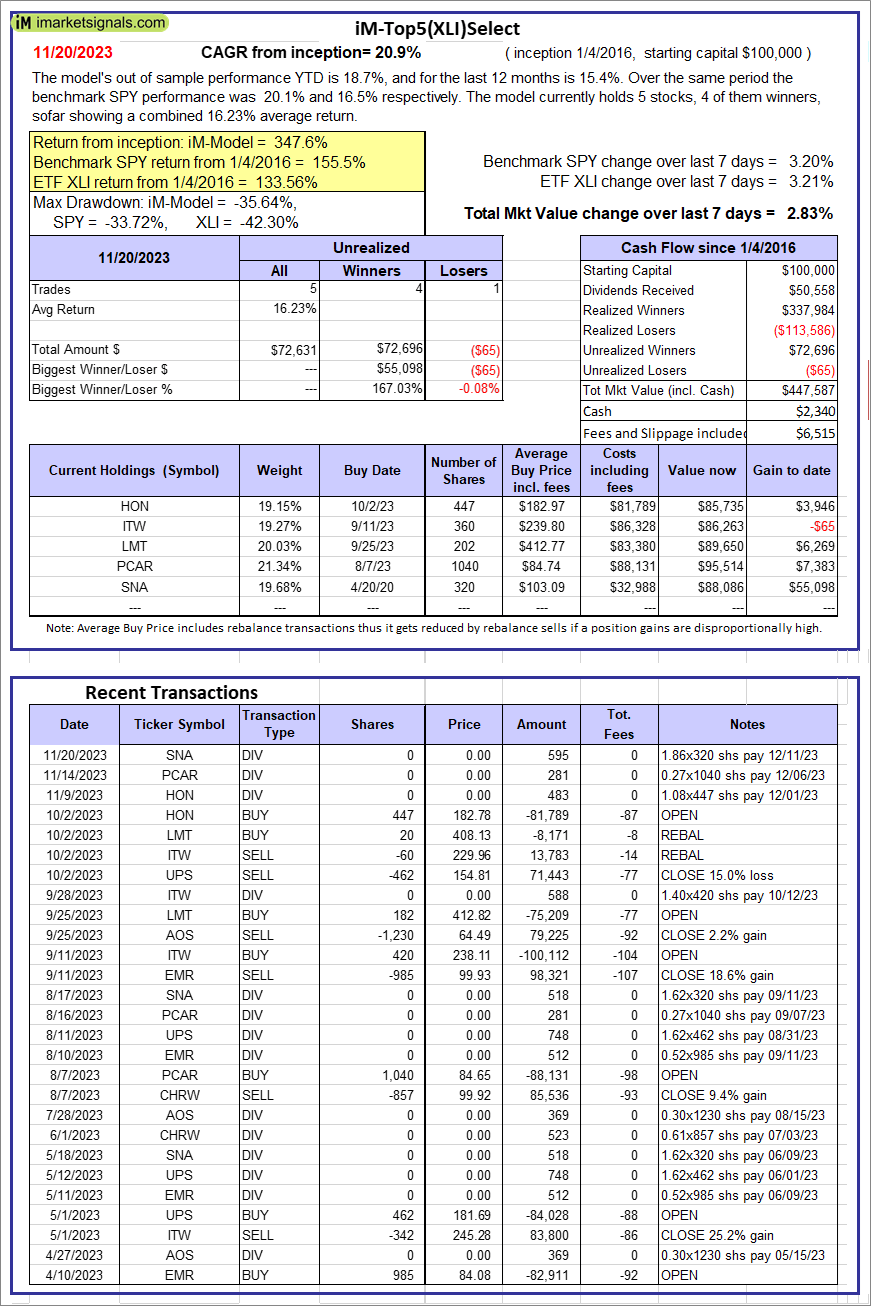 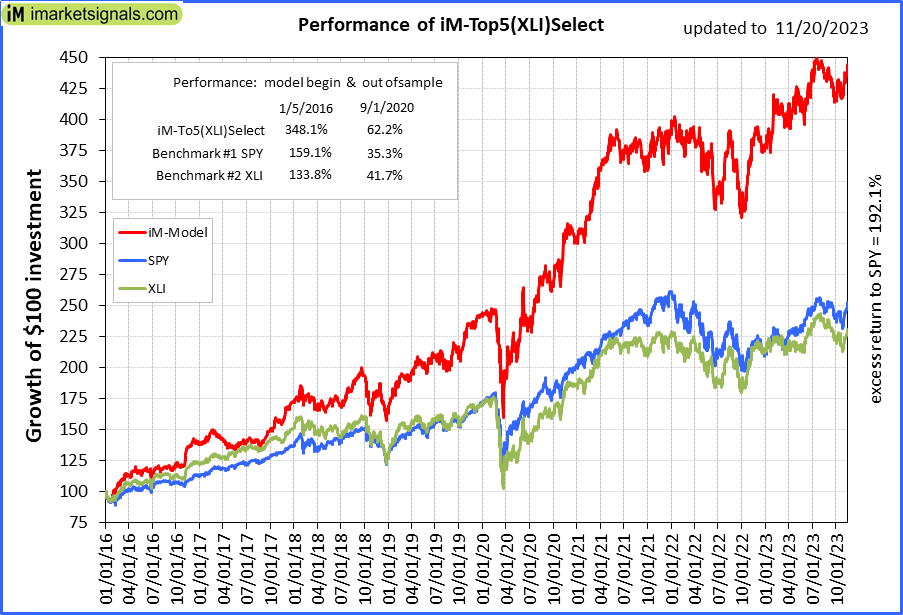 |
iM-Top5(XLI)Select: Since inception, on 1/5/2016, the model gained 347.59% while the benchmark SPY gained 155.52% over the same period. Over the previous week the market value of iM-Top5(XLI)Select gained 2.83% at a time when SPY gained 3.20%. A starting capital of $100,000 at inception on 1/5/2016 would have grown to $447,587 which includes $2,340 cash and excludes $6,515 spent on fees and slippage. |
  |
iM-Top5(XLK)Select: Since inception, on 1/5/2016, the model gained 515.18% while the benchmark SPY gained 155.52% over the same period. Over the previous week the market value of iM-Top5(XLK)Select gained 2.31% at a time when SPY gained 3.20%. A starting capital of $100,000 at inception on 1/5/2016 would have grown to $615,179 which includes -$297 cash and excludes $2,039 spent on fees and slippage. |
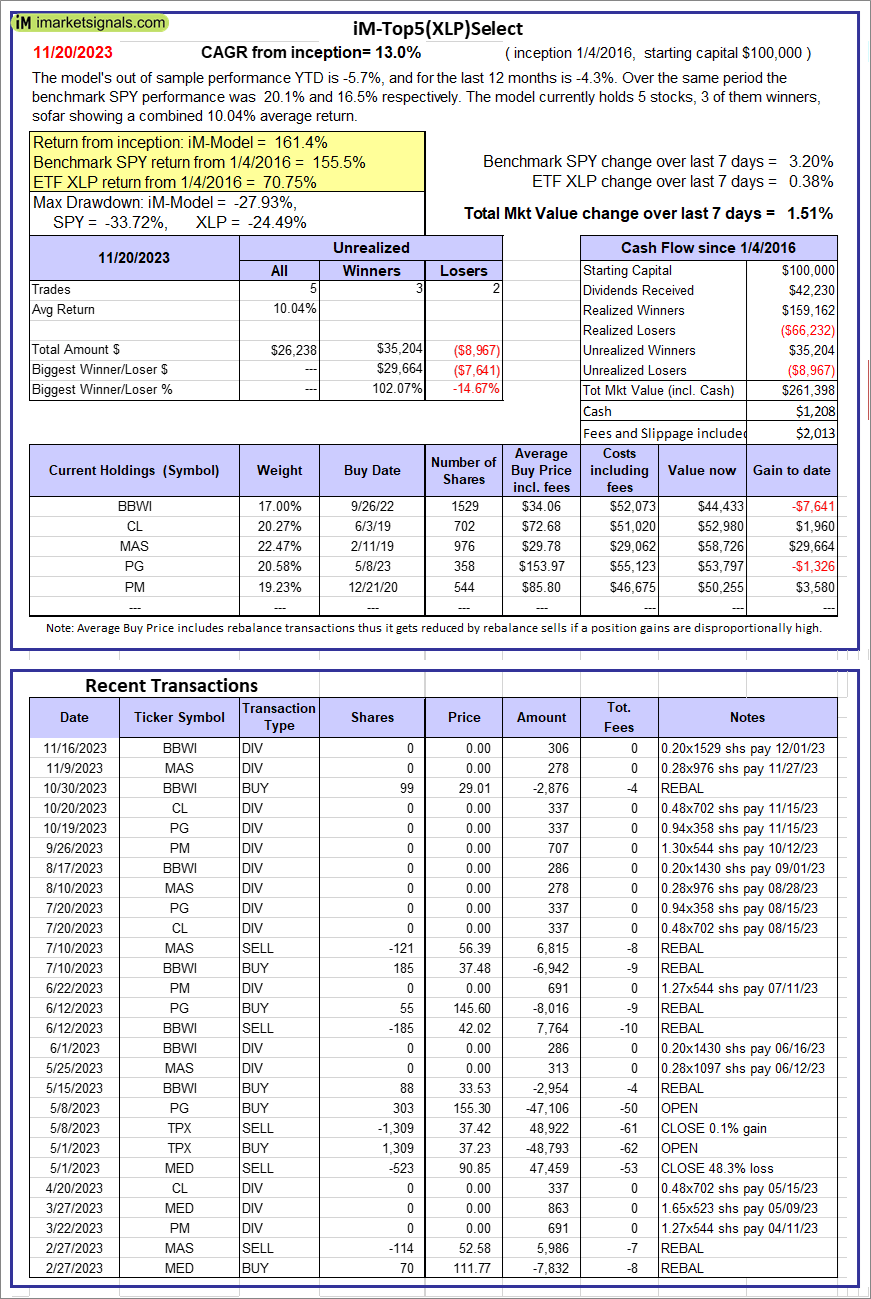  |
iM-Top5(XLP)Select: Since inception, on 1/5/2016, the model gained 161.40% while the benchmark SPY gained 155.52% over the same period. Over the previous week the market value of iM-Top5(XLP)Select gained 1.51% at a time when SPY gained 3.20%. A starting capital of $100,000 at inception on 1/5/2016 would have grown to $261,398 which includes $1,208 cash and excludes $2,013 spent on fees and slippage. |
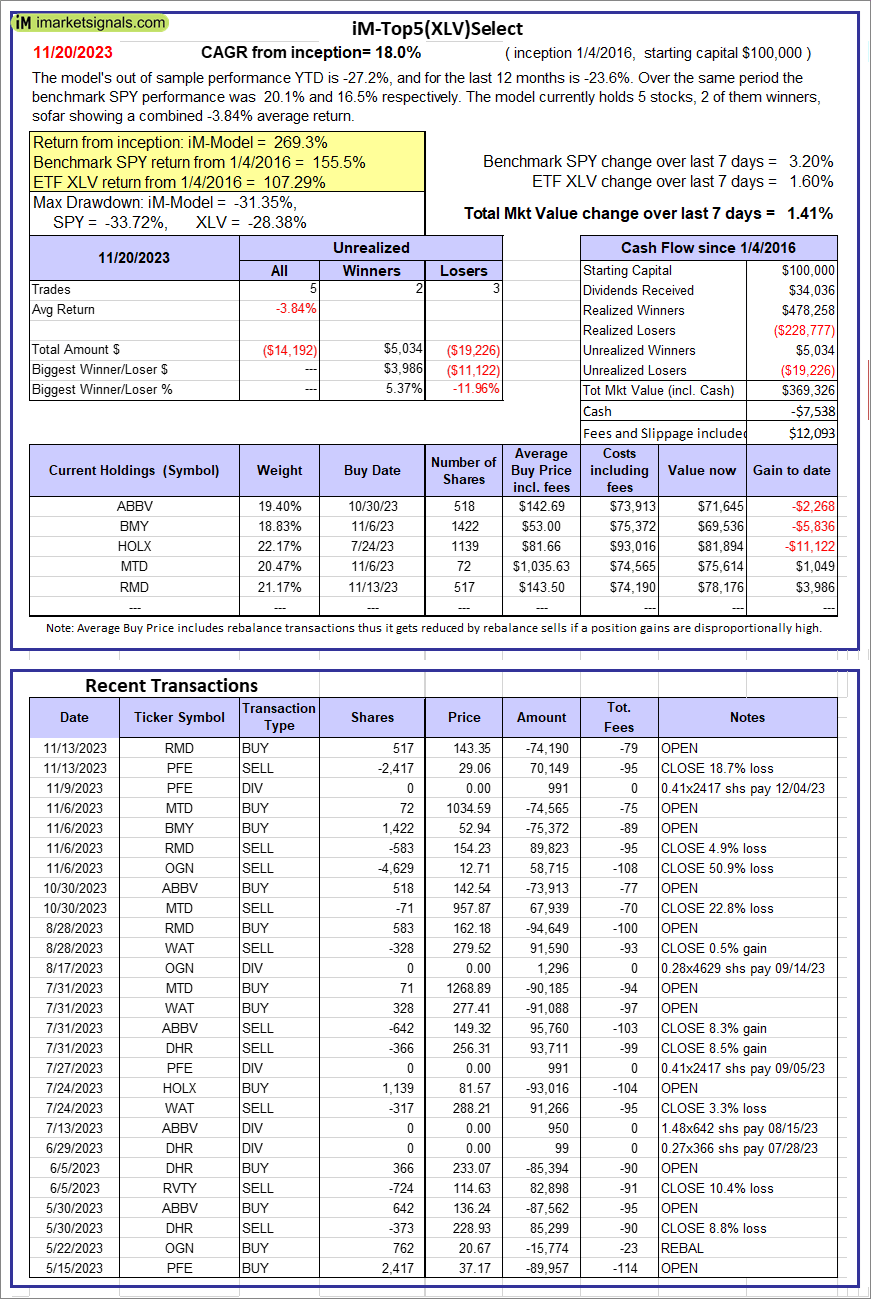  |
iM-Top5(XLV)Select: Since inception, on 1/5/2016, the model gained 269.33% while the benchmark SPY gained 155.52% over the same period. Over the previous week the market value of iM-Top5(XLV)Select gained 1.41% at a time when SPY gained 3.20%. A starting capital of $100,000 at inception on 1/5/2016 would have grown to $369,326 which includes -$7,538 cash and excludes $12,093 spent on fees and slippage. |
 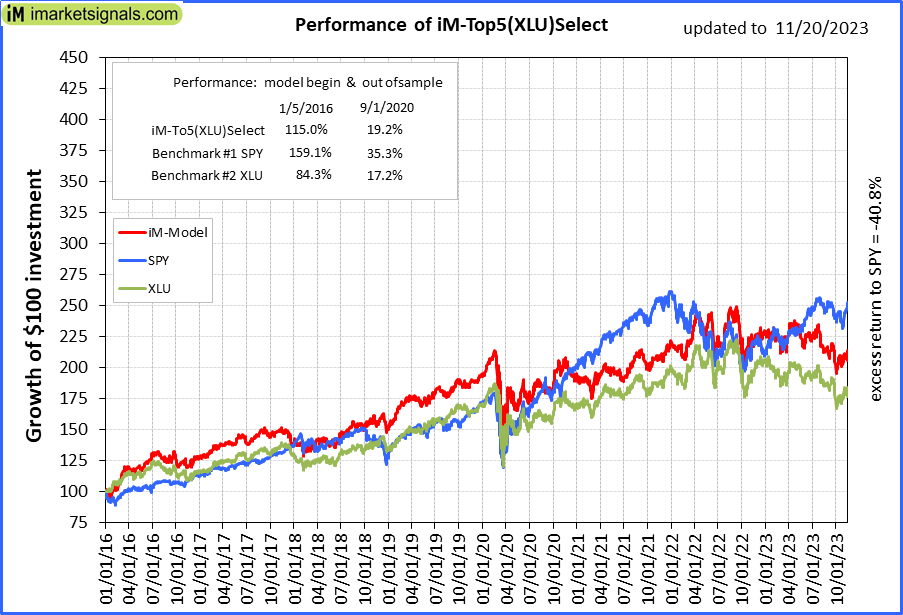 |
iM-Top5(XLU)Select: Since inception, on 1/5/2016, the model gained 114.69% while the benchmark SPY gained 155.52% over the same period. Over the previous week the market value of iM-Top5(XLU)Select gained 4.40% at a time when SPY gained 3.20%. A starting capital of $100,000 at inception on 1/5/2016 would have grown to $214,693 which includes $829 cash and excludes $12,825 spent on fees and slippage. |
  |
iM-Top5(XLY)Select: Since inception, on 1/5/2016, the model gained 230.46% while the benchmark SPY gained 155.52% over the same period. Over the previous week the market value of iM-Top5(XLY)Select gained 4.71% at a time when SPY gained 3.20%. A starting capital of $100,000 at inception on 1/5/2016 would have grown to $330,465 which includes -$488 cash and excludes $5,993 spent on fees and slippage. |
 |
iM-Seasonal Super-Sectors (Top5 combo) : Since inception, on 11/17/2020, the model gained 41.89% while the benchmark SPY gained 32.64% over the same period. Over the previous week the market value of iM-Seasonal Super-Sectors (Top5 combo) gained 3.21% at a time when SPY gained 3.20%. A starting capital of $100,000 at inception on 11/17/2020 would have grown to $141,888 which includes -$209 cash and excludes $00 spent on fees and slippage. |
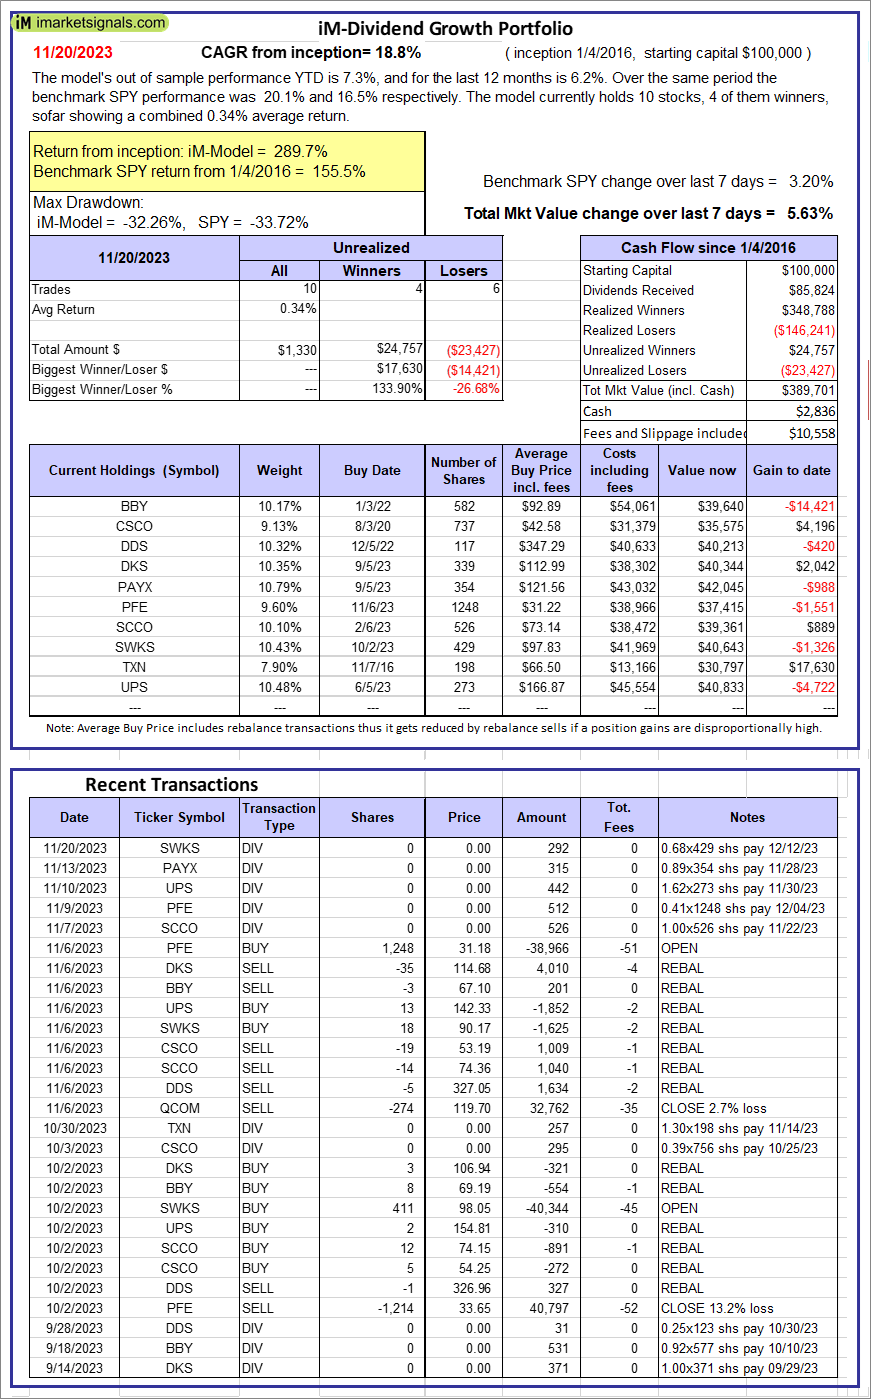 |
iM-Dividend Growth Portfolio: The model’s out of sample performance YTD is 7.3%, and for the last 12 months is 6.2%. Over the same period the benchmark SPY performance was 20.1% and 16.5% respectively. Over the previous week the market value of the iM-Dividend Growth Portfolio gained 5.63% at a time when SPY gained 3.20%. A starting capital of $100,000 at inception on 6/30/2016 would have grown to $389,701 which includes $2,836 cash and excludes $10,558 spent on fees and slippage. |
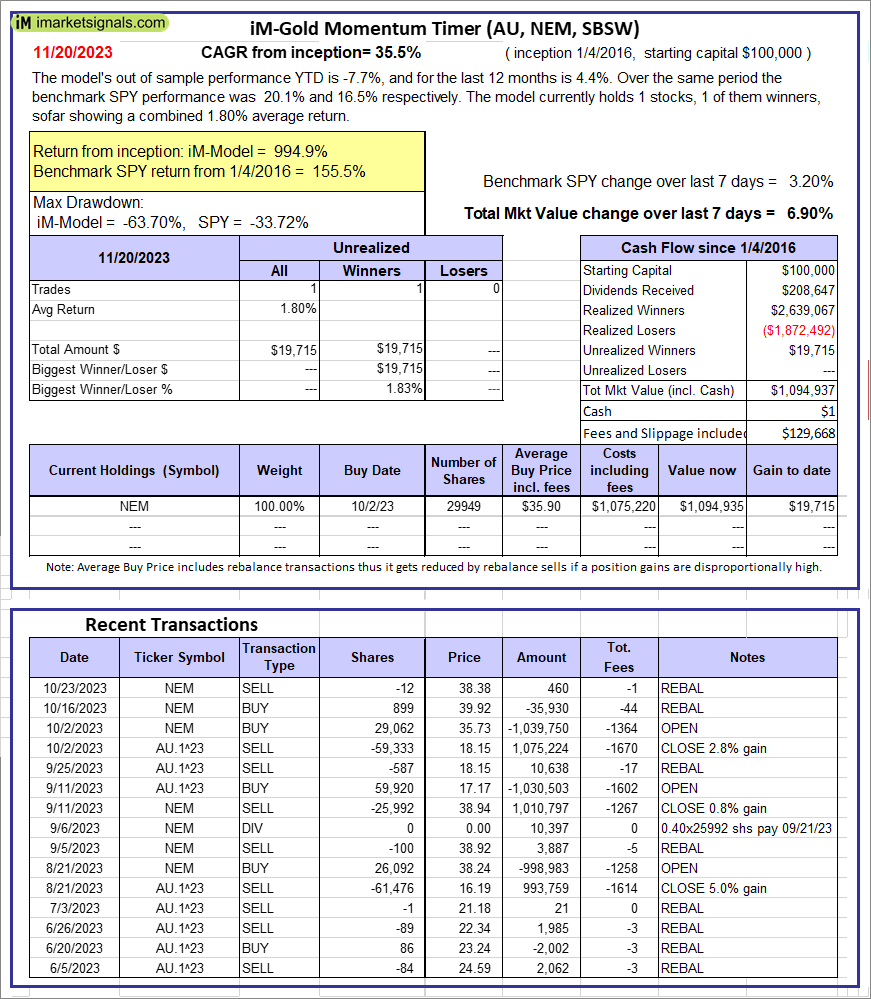 |
iM-Gold Momentum Timer (AU, NEM, SBSW): The model’s out of sample performance YTD is -7.7%, and for the last 12 months is 4.4%. Over the same period the benchmark SPY performance was 20.1% and 16.5% respectively. Over the previous week the market value of iM-Gold Momentum Timer (AU, NEM, SBSW) gained 6.90% at a time when SPY gained 3.20%. A starting capital of $100,000 at inception on 6/30/2016 would have grown to $01 which includes $129,668 cash and excludes Gain to date spent on fees and slippage. |
 |
iM-ModSum/YieldCurve Timer: The model’s out of sample performance YTD is 1.3%, and for the last 12 months is 1.3%. Over the same period the benchmark SPY performance was 20.1% and 16.5% respectively. Over the previous week the market value of iM-PortSum/YieldCurve Timer gained 1.66% at a time when SPY gained 3.20%. A starting capital of $100,000 at inception on 1/1/2016 would have grown to $255,492 which includes $2,530 cash and excludes $1,367 spent on fees and slippage. |
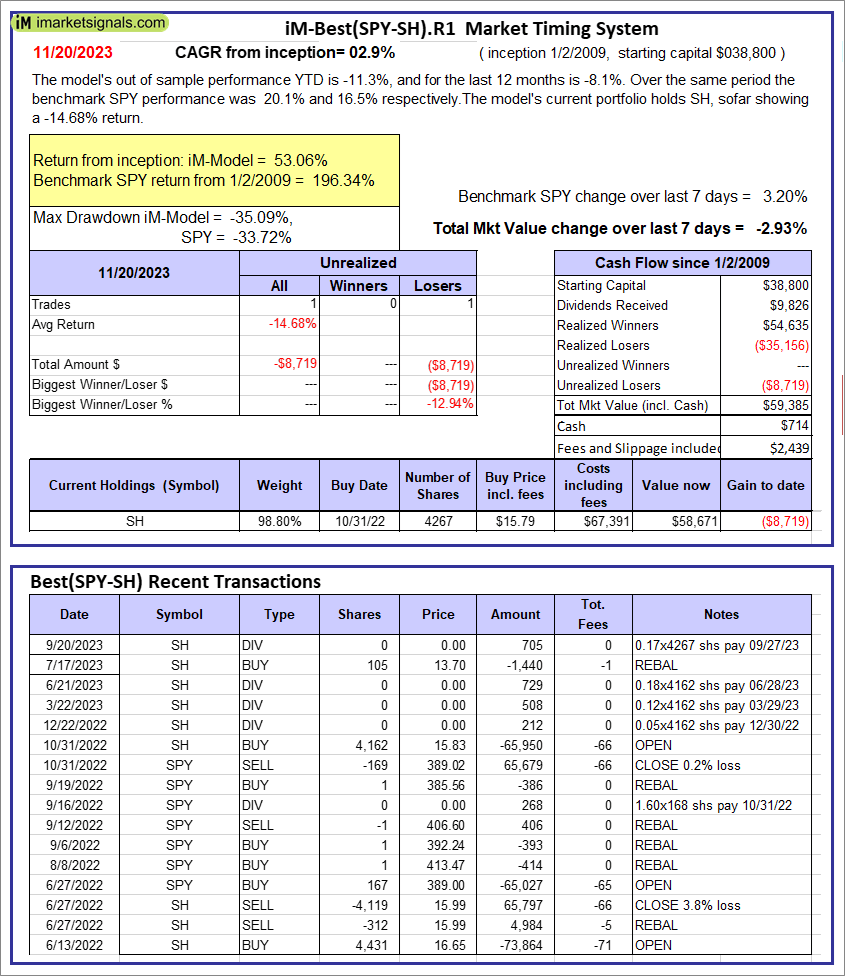 |
iM-Best(SPY-SH).R1: The model’s out of sample performance YTD is -11.3%, and for the last 12 months is -8.1%. Over the same period the benchmark SPY performance was 20.1% and 16.5% respectively. Over the previous week the market value of Best(SPY-SH) gained -2.93% at a time when SPY gained 3.20%. A starting capital of $100,000 at inception on 1/2/2009 would have grown to $59,385 which includes $714 cash and excludes $2,439 spent on fees and slippage. |
 |
iM-Combo3.R1: The model’s out of sample performance YTD is -3.7%, and for the last 12 months is -0.9%. Over the same period the benchmark SPY performance was 20.1% and 16.5% respectively. Over the previous week the market value of iM-Combo3.R1 gained 0.90% at a time when SPY gained 3.20%. A starting capital of $100,000 at inception on 2/3/2014 would have grown to $179,141 which includes $442 cash and excludes $8,103 spent on fees and slippage. |
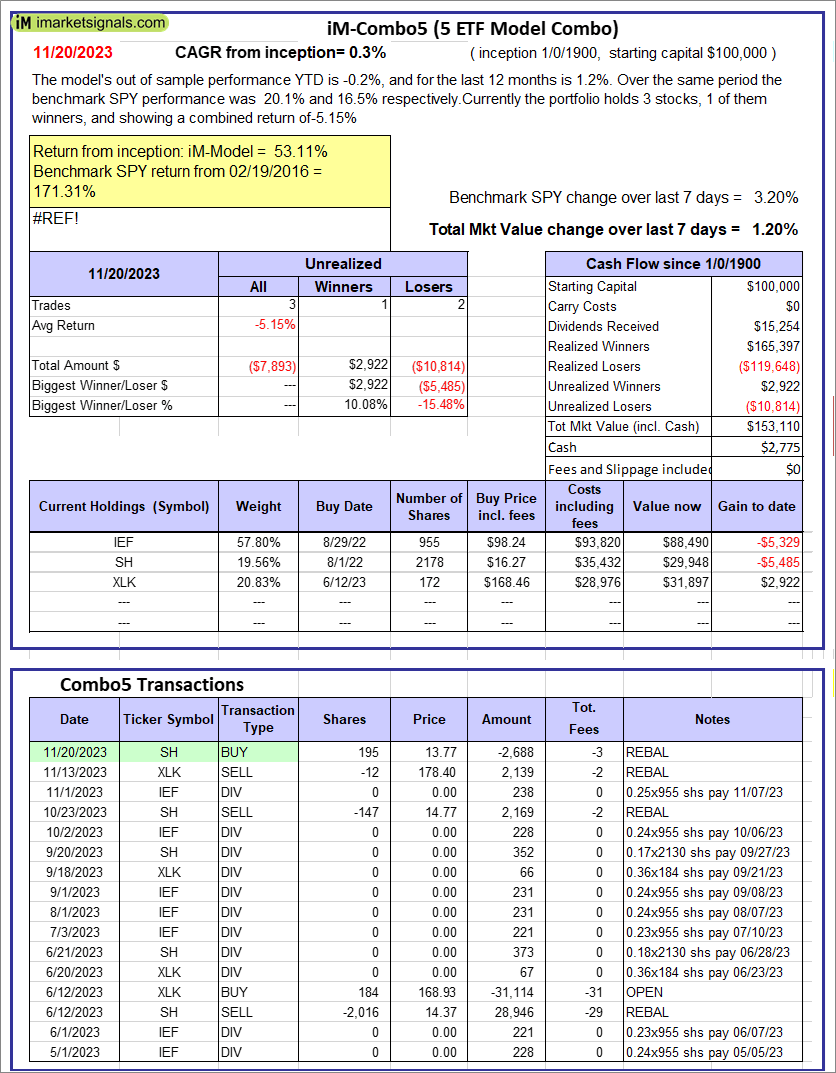 |
iM-Combo5: The model’s out of sample performance YTD is -0.2%, and for the last 12 months is 1.2%. Over the same period the benchmark SPY performance was 20.1% and 16.5% respectively. Over the previous week the market value of iM-Combo5 gained 1.20% at a time when SPY gained 3.20%. A starting capital of $100,000 at inception on 2/22/2016 would have grown to $153,110 which includes $2,775 cash and excludes $0 spent on fees and slippage. |
  |
iM-Best10(VDIGX)-Trader: The model’s out of sample performance YTD is 1.7%, and for the last 12 months is 4.1%. Over the same period the benchmark SPY performance was 20.1% and 16.5% respectively. Since inception, on 7/1/2014, the model gained 193.97% while the benchmark SPY gained 174.29% and VDIGX gained 139.36% over the same period. Over the previous week the market value of iM-Best10(VDIGX) gained 3.50% at a time when SPY gained 3.20%. A starting capital of $100,000 at inception on 7/1/2014 would have grown to $293,972 which includes $1,086 cash and excludes $4,769 spent on fees and slippage. |
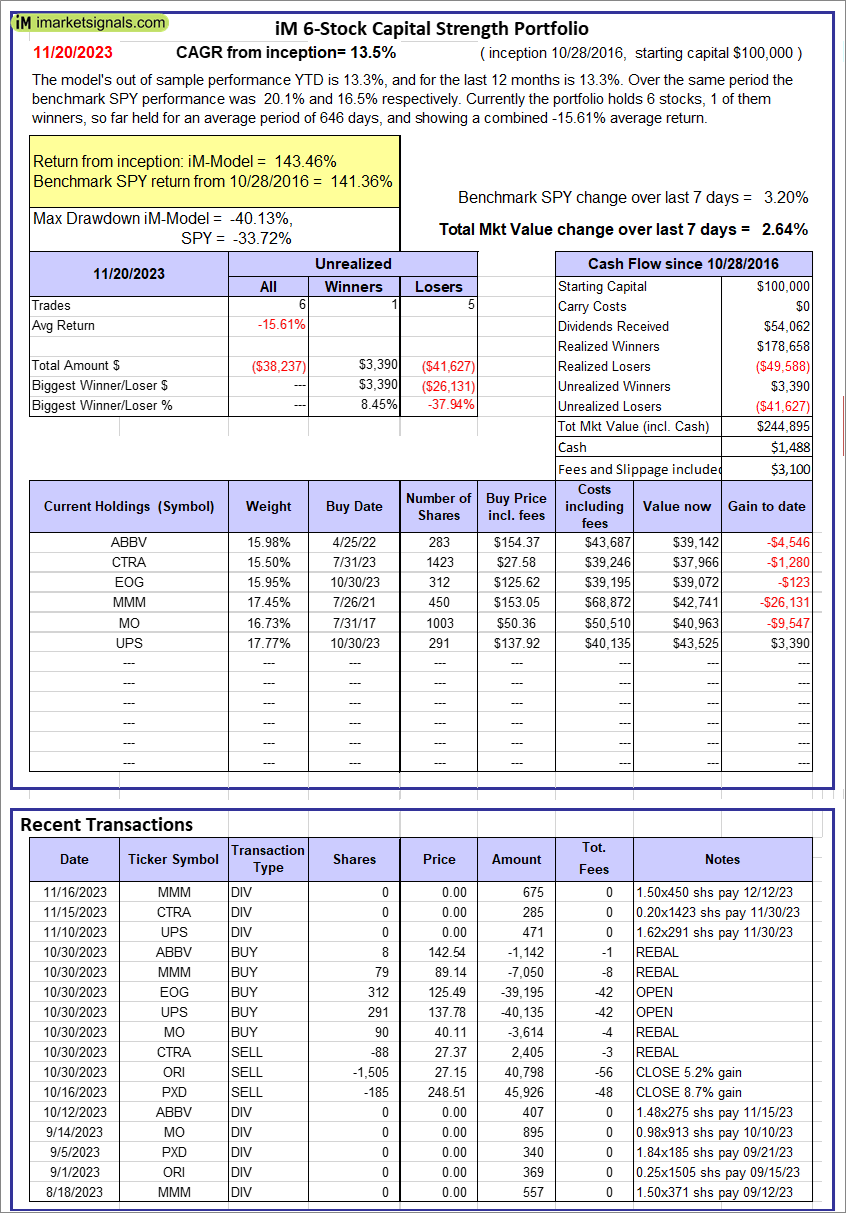 |
iM 6-Stock Capital Strength Portfolio: The model’s out of sample performance YTD is 13.3%, and for the last 12 months is 13.3%. Over the same period the benchmark SPY performance was 20.1% and 16.5% respectively. Over the previous week the market value of the iM 6-Stock Capital Strength Portfolio gained 2.64% at a time when SPY gained 3.20%. A starting capital of $100,000 at inception on 10/28/2016 would have grown to $244,895 which includes $1,488 cash and excludes $3,100 spent on fees and slippage. |
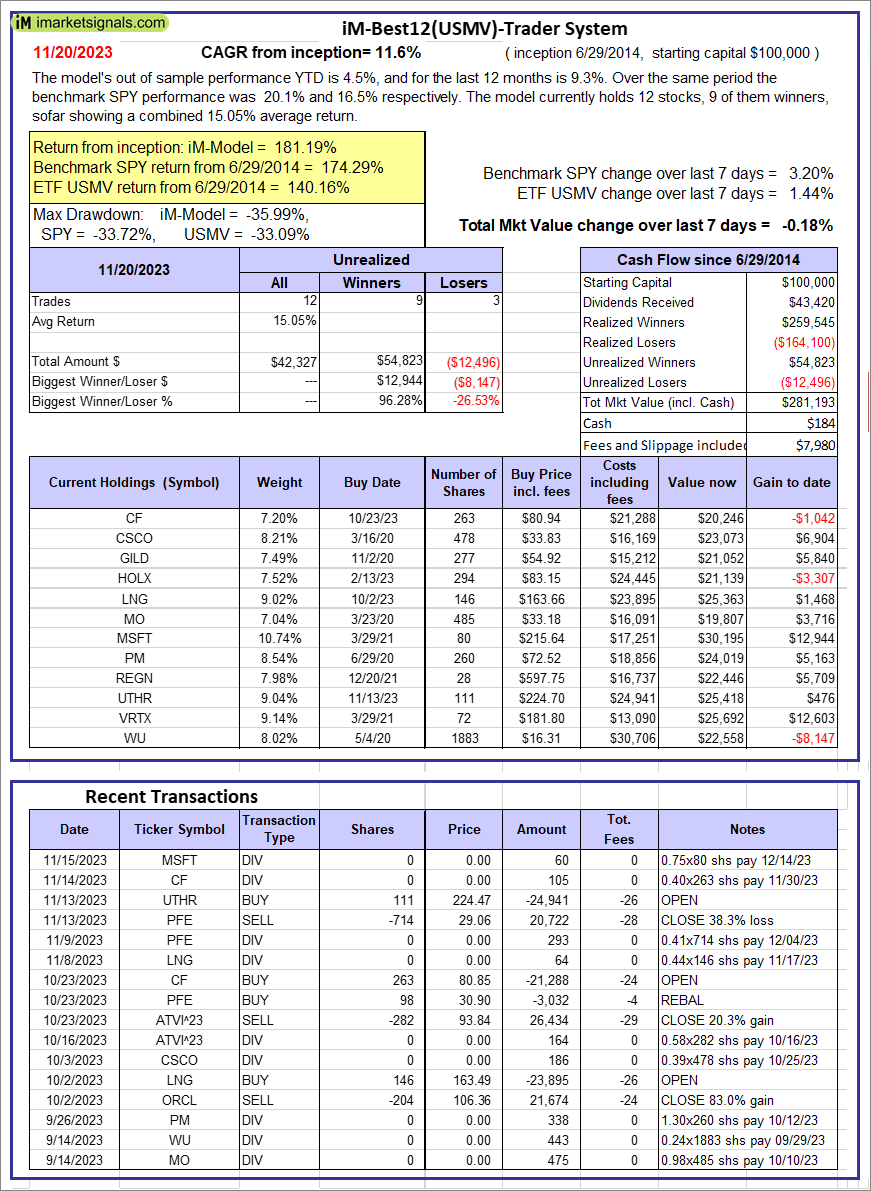 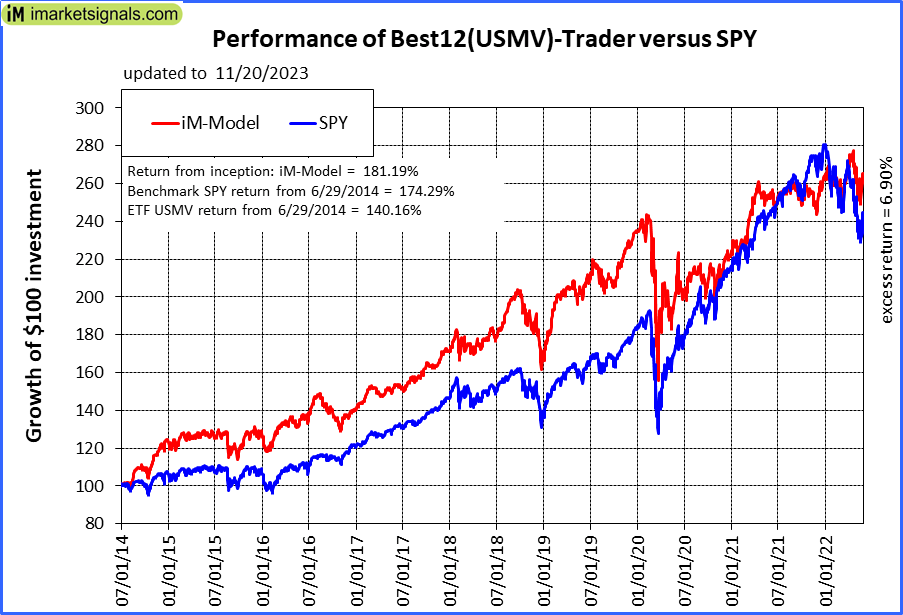 |
iM-Best12(USMV)-Trader: The model’s out of sample performance YTD is 4.5%, and for the last 12 months is 9.3%. Over the same period the benchmark SPY performance was 20.1% and 16.5% respectively. Since inception, on 6/30/2014, the model gained 181.19% while the benchmark SPY gained 174.29% and the ETF USMV gained 140.16% over the same period. Over the previous week the market value of iM-Best12(USMV)-Trader gained -0.18% at a time when SPY gained 3.20%. A starting capital of $100,000 at inception on 6/30/2014 would have grown to $281,193 which includes $184 cash and excludes $7,980 spent on fees and slippage. |
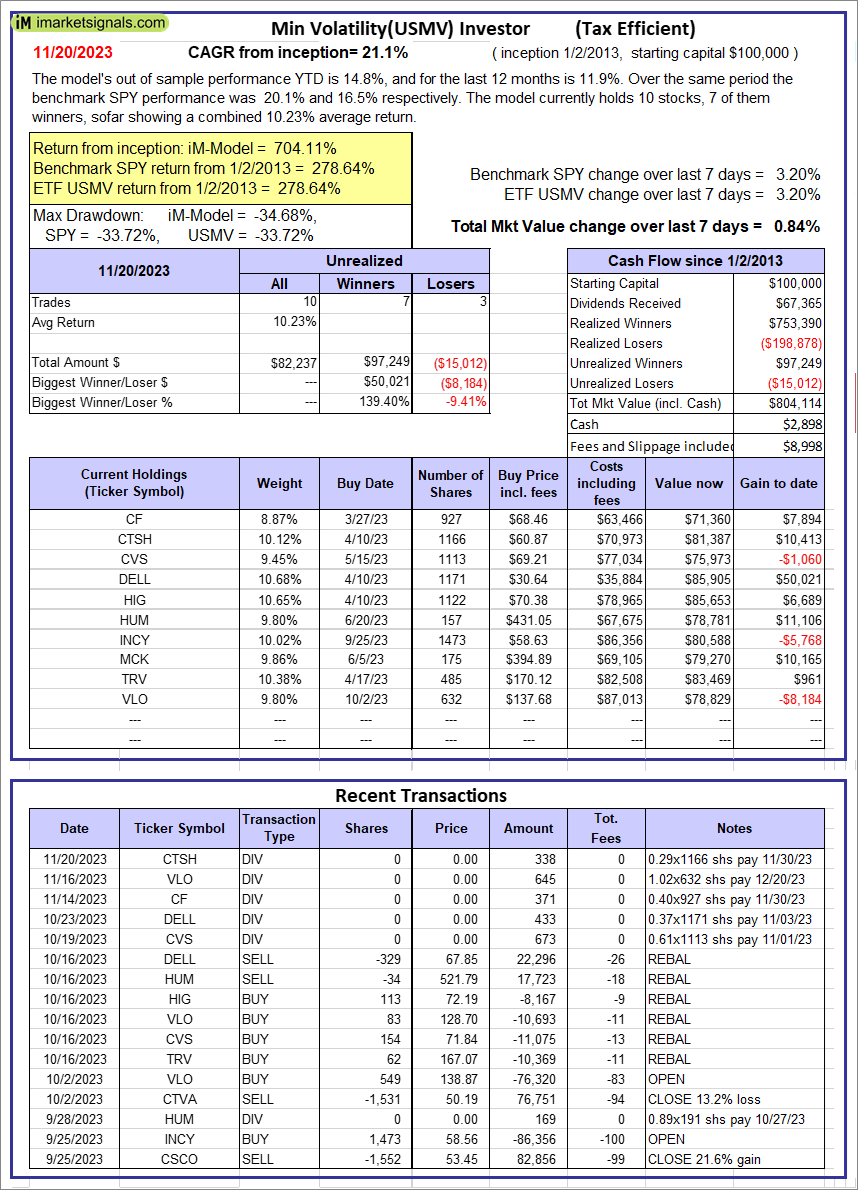  |
iM-Min Volatility(USMV) Investor (Tax Efficient): The model’s out of sample performance YTD is 14.8%, and for the last 12 months is 11.9%. Over the same period the benchmark SPY performance was 20.1% and 16.5% respectively. Since inception, on 1/3/2013, the model gained 704.11% while the benchmark SPY gained 278.64% and the ETF USMV gained 278.64% over the same period. Over the previous week the market value of iM-Best12(USMV)Q1 gained 0.84% at a time when SPY gained 3.20%. A starting capital of $100,000 at inception on 1/3/2013 would have grown to $804,114 which includes $2,898 cash and excludes $8,998 spent on fees and slippage. |
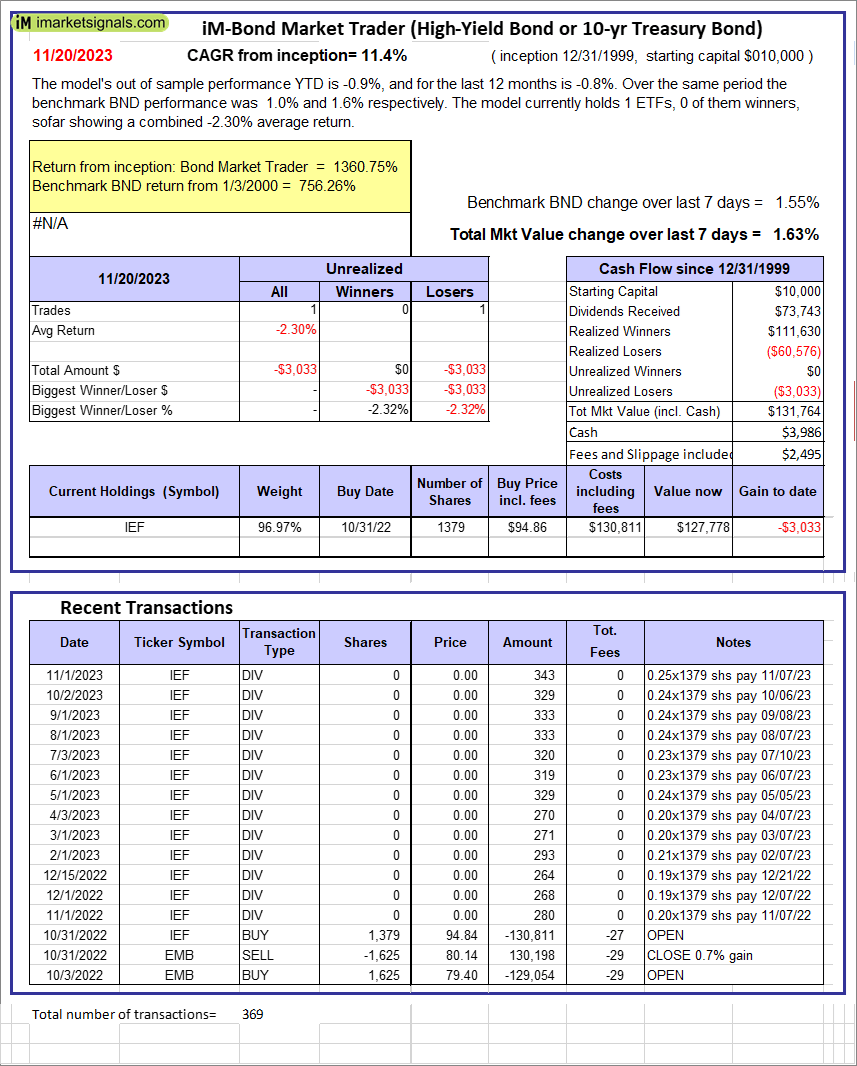 |
iM-Bond Market Trader (High-Yield Bond or 10-yr Treasury Bond): The model’s out of sample performance YTD is -0.9%, and for the last 12 months is -0.8%. Over the same period the benchmark BND performance was 1.0% and 1.6% respectively. Over the previous week the market value of the iM-Bond Market Trader (High-Yield Bond or 10-yr Treasury Bond) gained 1.63% at a time when BND gained 1.55%. A starting capital of $10,000 at inception on 1/3/2000 would have grown to $131,764 which includes $3,986 cash and excludes $2,495 spent on fees and slippage. |
|
|
iM-ModSum/YieldCurve Timer: The model’s out of sample performance YTD is 1.3%, and for the last 12 months is 1.3%. Over the same period the benchmark SPY performance was 20.1% and 16.5% respectively. Over the previous week the market value of iM-PortSum/YieldCurve Timer gained 1.66% at a time when SPY gained 3.20%. A starting capital of $100,000 at inception on 1/1/2016 would have grown to $255,492 which includes $2,530 cash and excludes $1,367 spent on fees and slippage. |
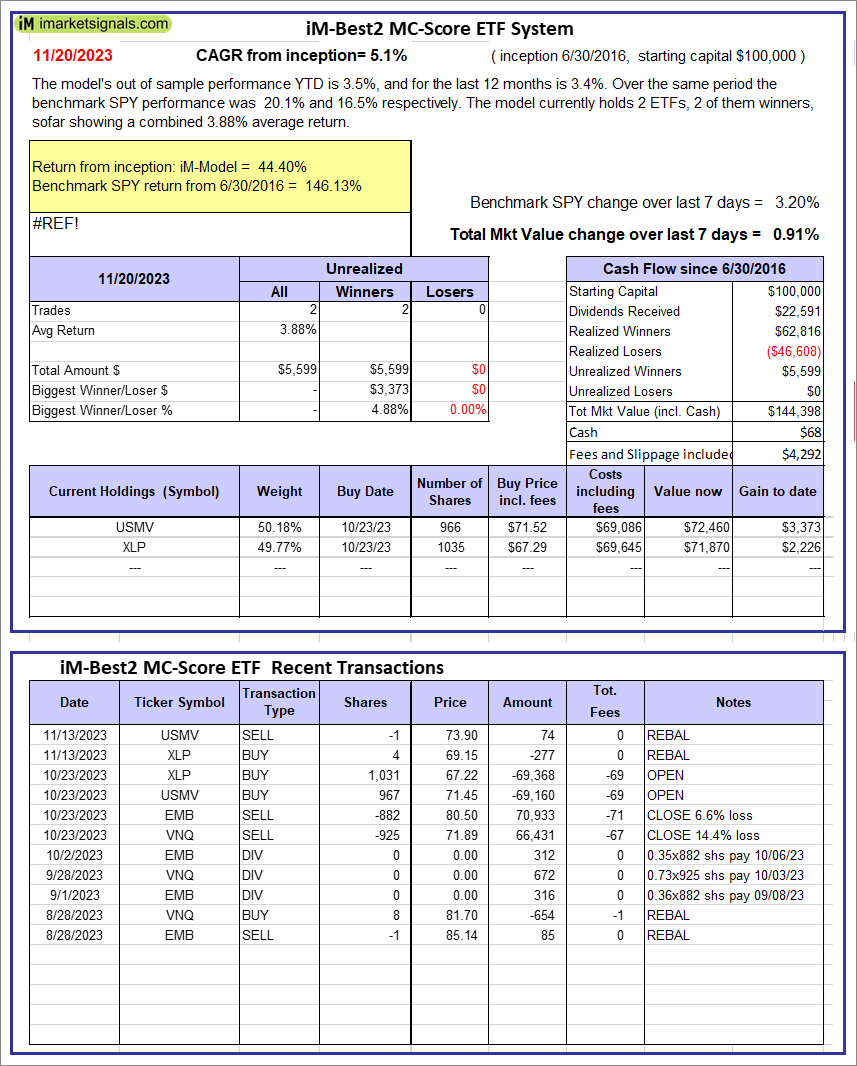 |
iM-Best2 MC-Score ETF System: The model’s out of sample performance YTD is 3.5%, and for the last 12 months is 3.4%. Over the same period the benchmark SPY performance was 20.1% and 16.5% respectively. Over the previous week the market value of the iM-Best2 MC-Score ETF System gained 0.91% at a time when SPY gained 3.20%. A starting capital of $100,000 at inception on 6/30/2016 would have grown to $144,398 which includes $68 cash and excludes $4,292 spent on fees and slippage. |
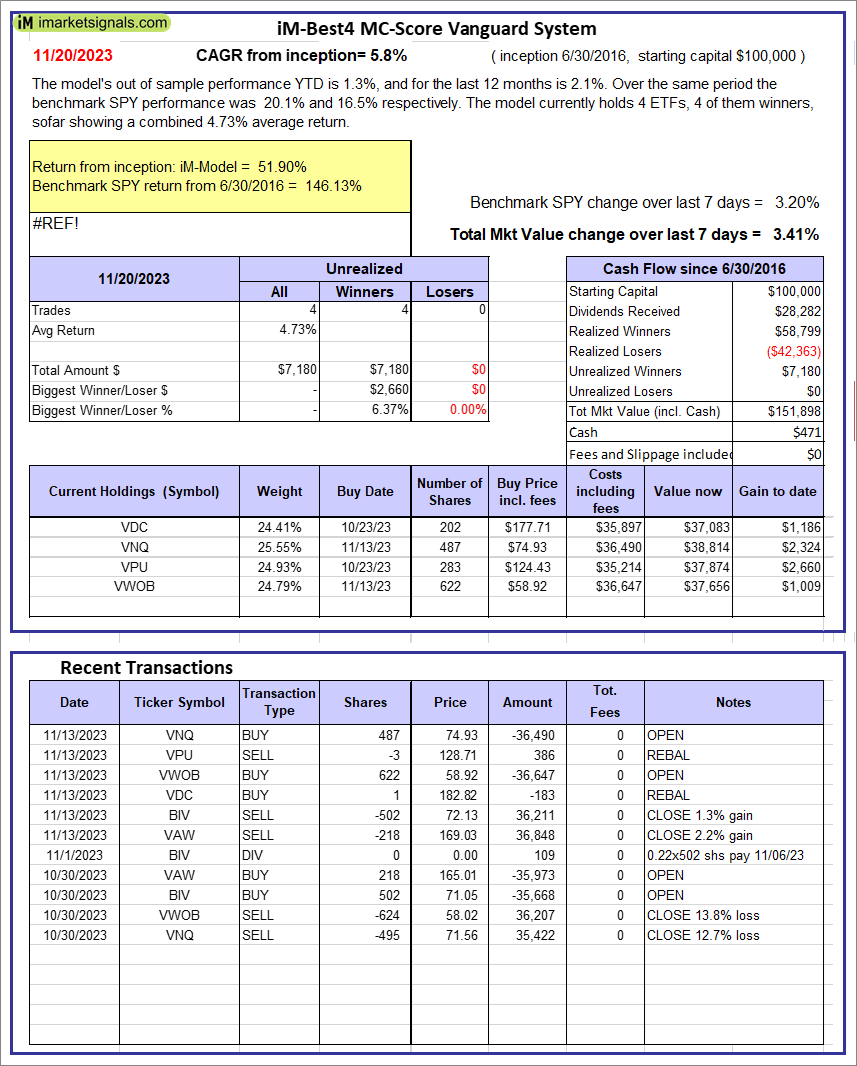 |
iM-Best4 MC-Score Vanguard System: The model’s out of sample performance YTD is 1.3%, and for the last 12 months is 2.1%. Over the same period the benchmark SPY performance was 20.1% and 16.5% respectively. Over the previous week the market value of the iM-Best4 MC-Score Vanguard System gained 3.41% at a time when SPY gained 3.20%. A starting capital of $100,000 at inception on 6/30/2016 would have grown to $151,898 which includes $471 cash and excludes $00 spent on fees and slippage. |
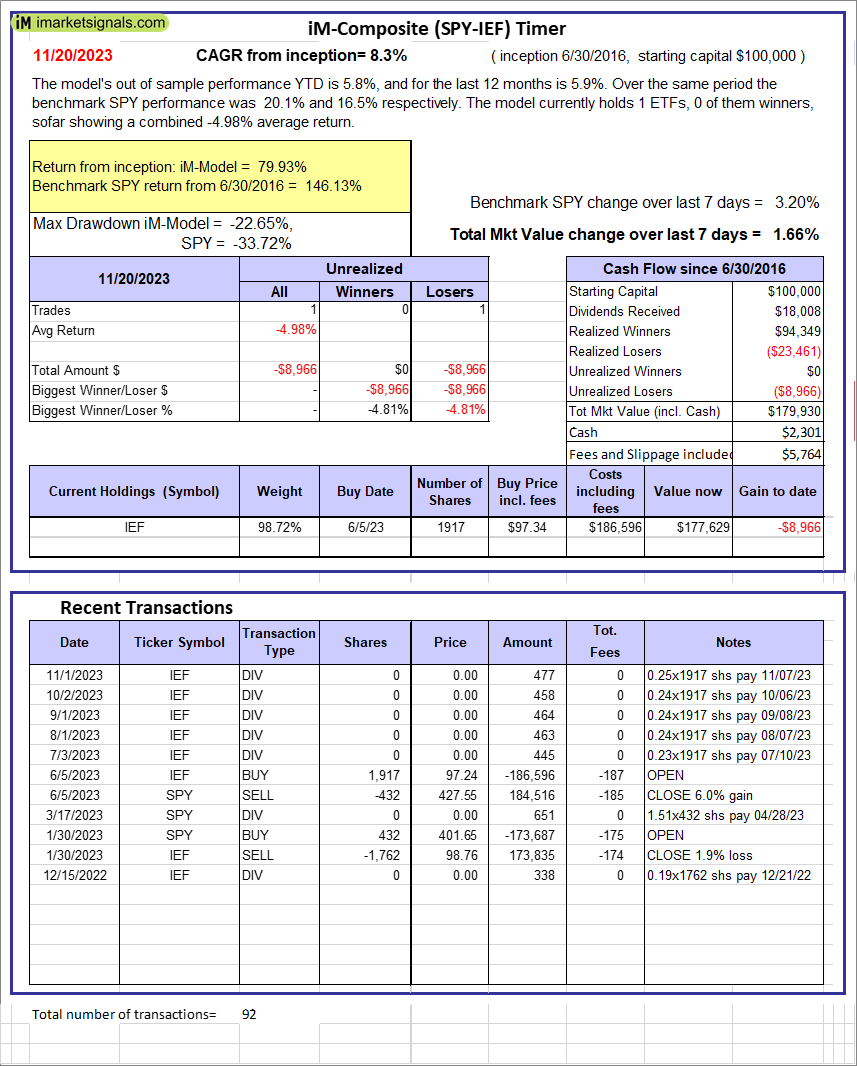 |
iM-Composite (SPY-IEF) Timer: The model’s out of sample performance YTD is 5.8%, and for the last 12 months is 5.9%. Over the same period the benchmark SPY performance was 20.1% and 16.5% respectively. Over the previous week the market value of the iM-Composite (SPY-IEF) Timer gained 1.66% at a time when SPY gained 3.20%. A starting capital of $100,000 at inception on 6/30/2016 would have grown to $179,930 which includes $2,301 cash and excludes $5,764 spent on fees and slippage. |
 |
iM-Composite(Gold-Stocks-Bond) Timer: The model’s out of sample performance YTD is 8.2%, and for the last 12 months is 12.7%. Over the same period the benchmark SPY performance was 20.1% and 16.5% respectively. Over the previous week the market value of the iM-Composite(Gold-Stocks-Bond) Timer gained 1.57% at a time when SPY gained 3.20%. A starting capital of $100,000 at inception on 6/30/2016 would have grown to $186,539 which includes $36 cash and excludes $9,190 spent on fees and slippage. |
iM-Best Reports – 11/20/2023
Posted in pmp SPY-SH
Leave a Reply
You must be logged in to post a comment.