
  |
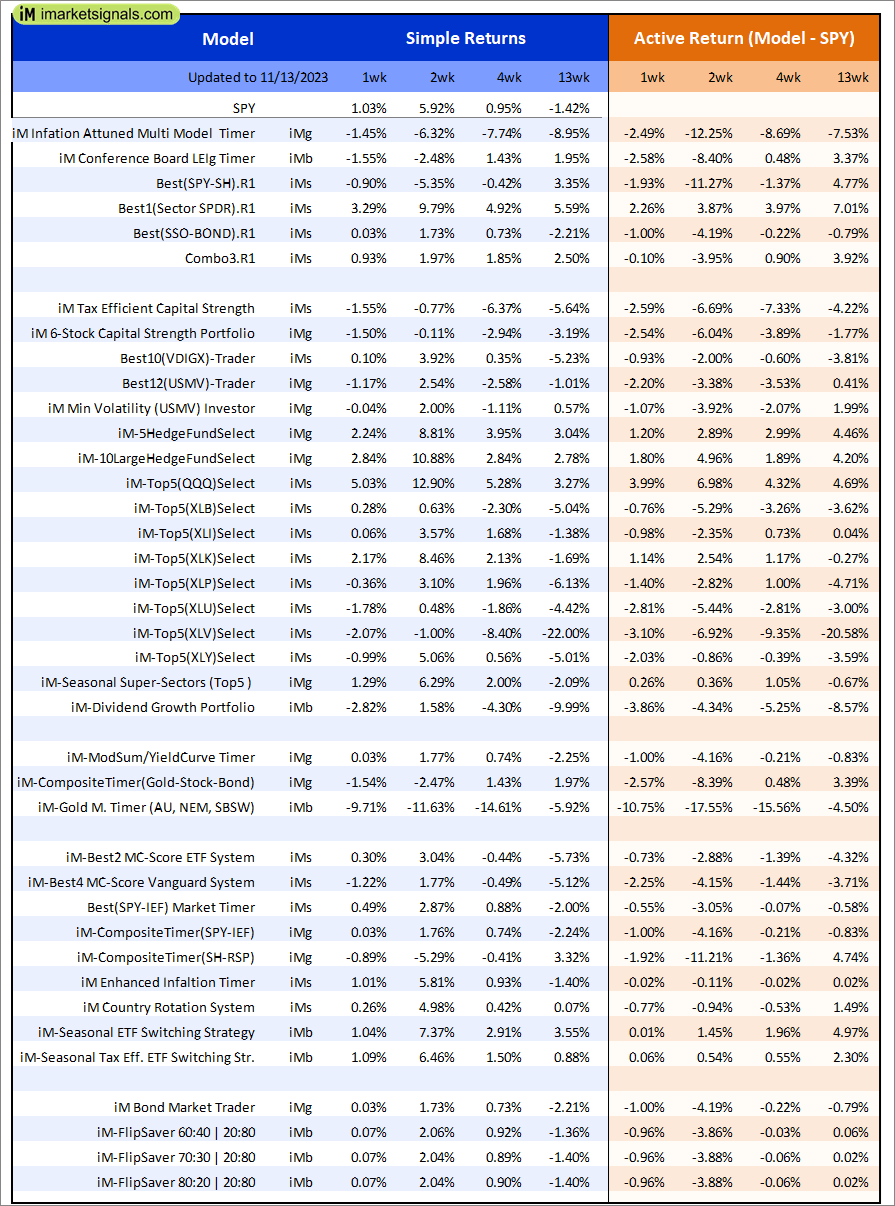
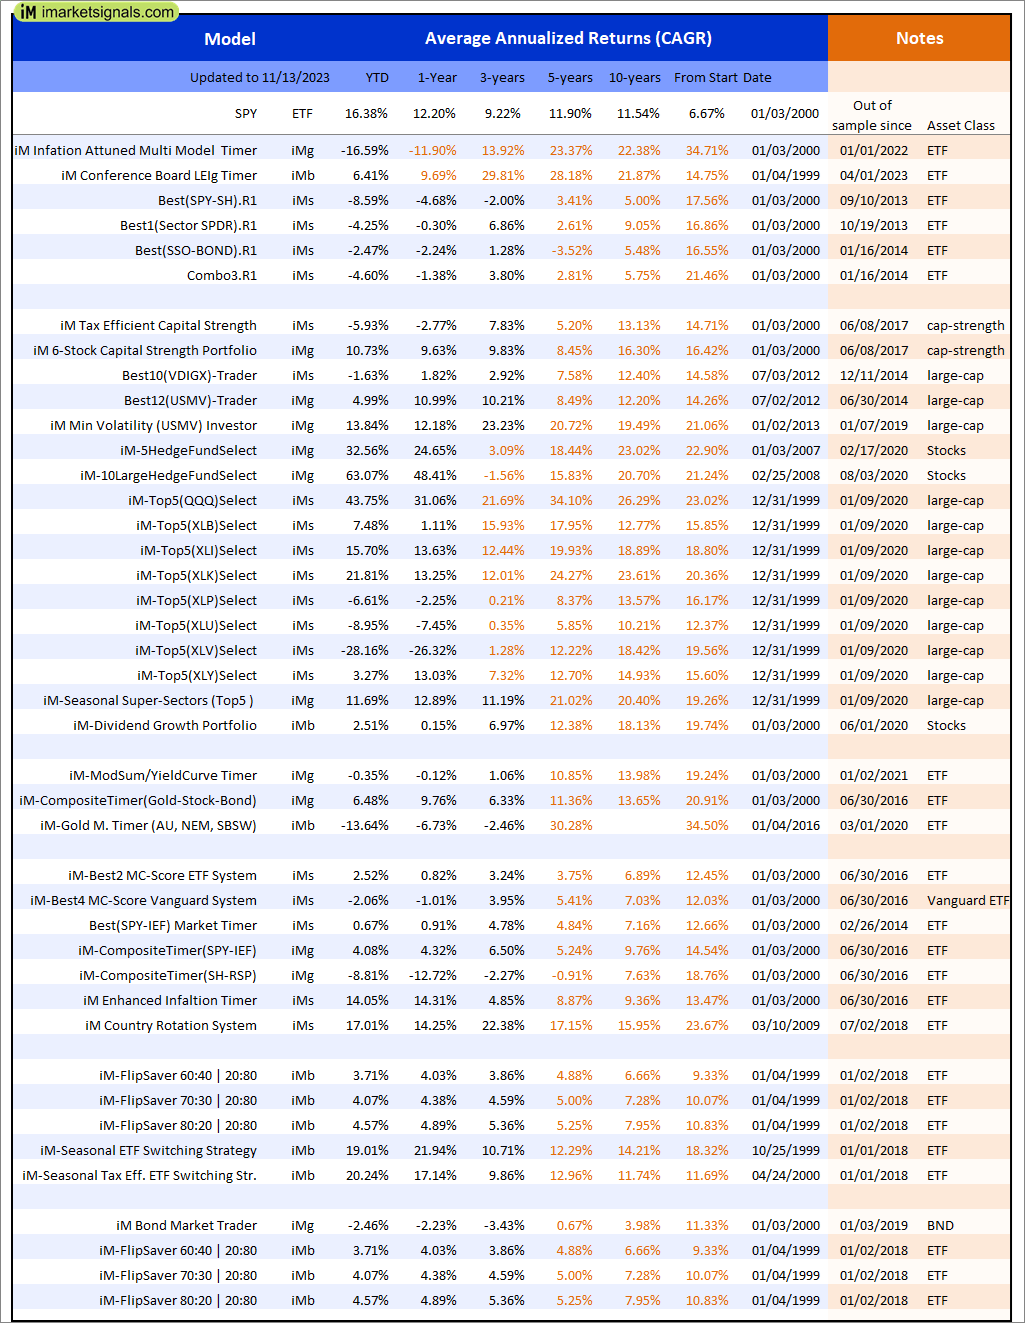
Out of sample performance summary of our models for the past 1, 2, 4 and 13 week periods. The active active return indicates how the models over- or underperformed the benchmark ETF SPY. Also the YTD, and the 1-, 3-, 5- and 10-year annualized returns are shown in the second table |
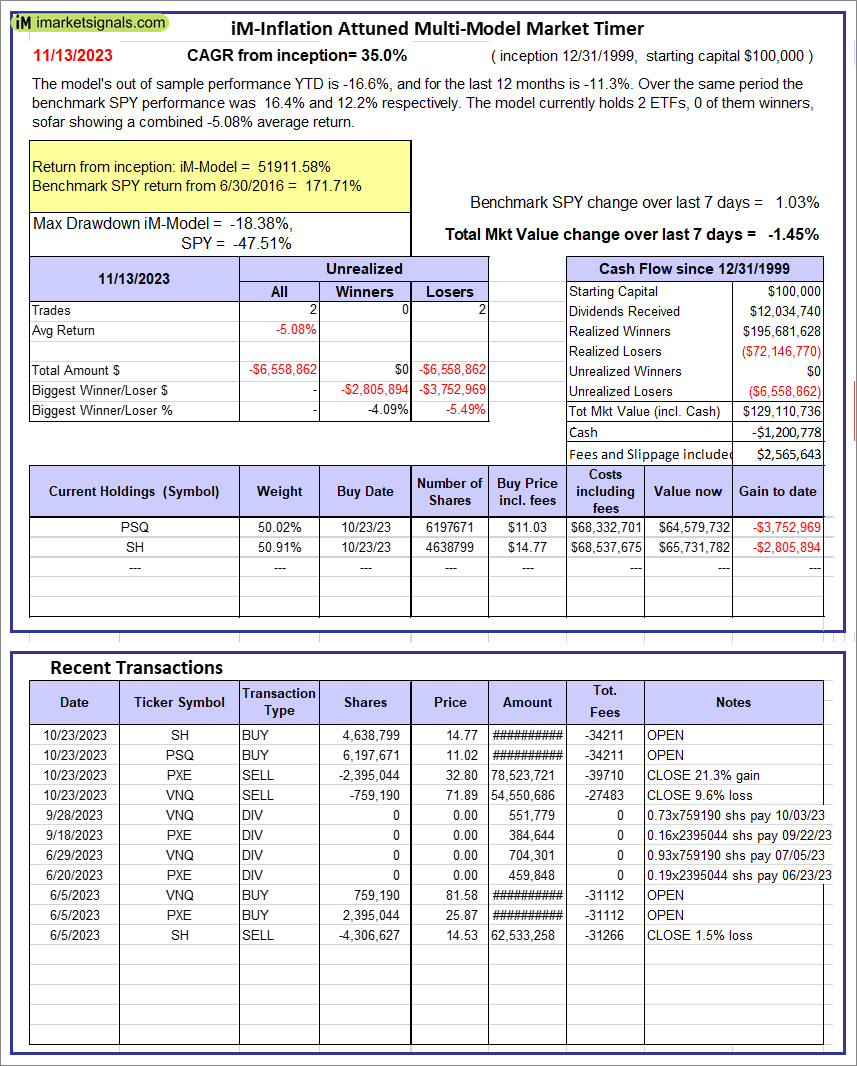 |
iM-Inflation Attuned Multi-Model Market Timer: The model’s out of sample performance YTD is -16.6%, and for the last 12 months is -11.3%. Over the same period the benchmark SPY performance was 16.4% and 12.2% respectively. Over the previous week the market value of the iM-Inflation Attuned Multi-Model Market Timer gained -1.45% at a time when SPY gained 1.03%. A starting capital of $100,000 at inception on 3/24/2017 would have grown to $129,110,736 which includes -$1,200,778 cash and excludes $2,565,643 spent on fees and slippage. |
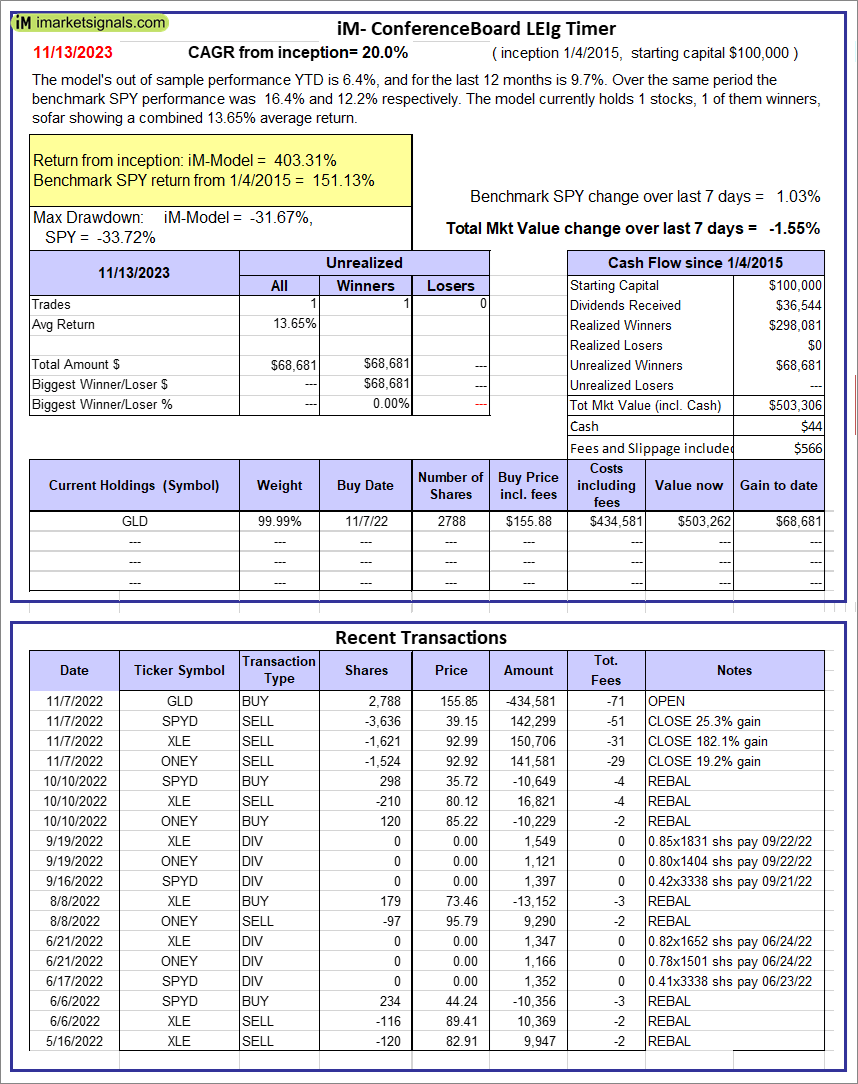 |
iM-Conference Board LEIg Timer: The model’s performance YTD is 14.3%, and for the last 12 months is 7.3%. Over the same period the benchmark SPY performance was 20.1% and 9.4% respectively. Over the previous week the market value of the iM-Conference Board LEIg Timer gained -1.55% at a time when SPY gained 1.03%. A starting capital of $100,000 at inception on 4/5/2017 would have grown to $503,306 which includes $44 cash and excludes $566 spent on fees and slippage. |
 |
iM-FlipSaver 60:40 | 20:80 – 2017: The model’s out of sample performance YTD is 3.6%, and for the last 12 months is 3.9%. Over the same period the benchmark E60B40 performance was 9.6% and 7.6% respectively. Over the previous week the market value of iM-FlipSaver 80:20 | 20:80 gained 0.07% at a time when SPY gained 0.71%. A starting capital of $100,000 at inception on 7/16/2015 would have grown to $146,024 which includes $2,002 cash and excludes $3,255 spent on fees and slippage. |
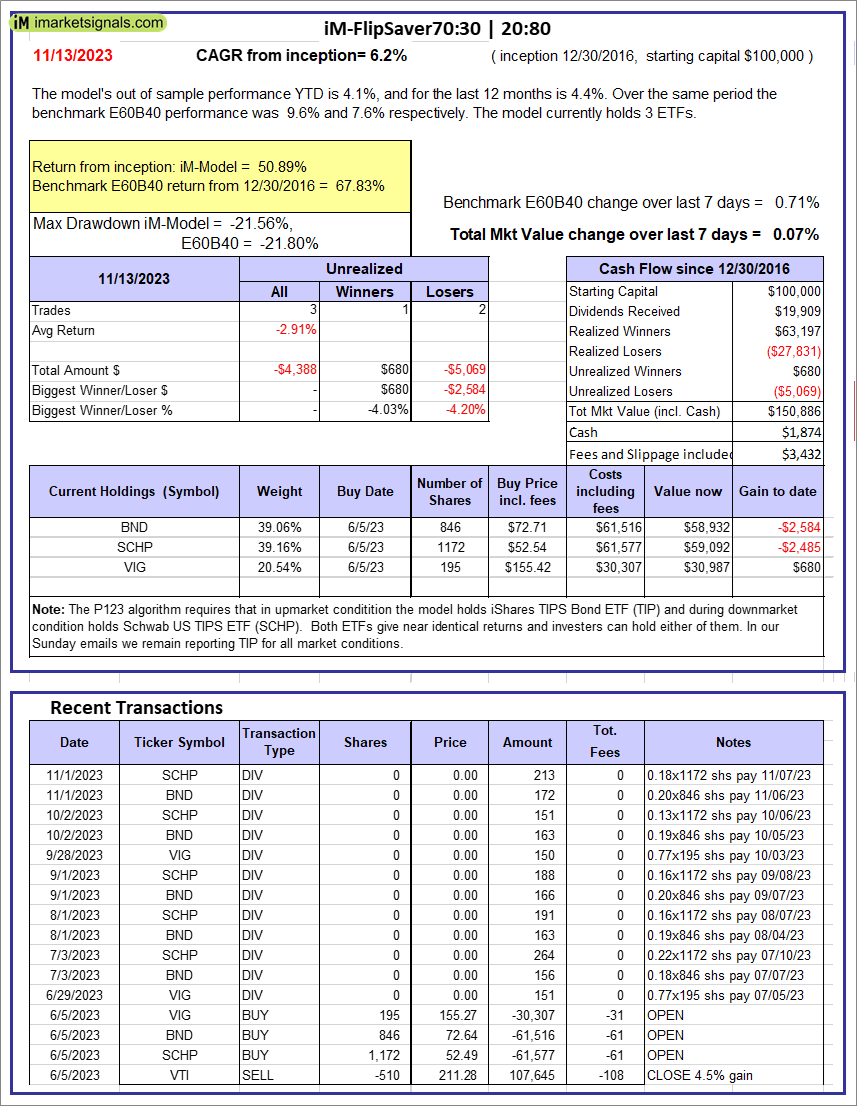 |
iM-FlipSaver 70:30 | 20:80 – 2017: The model’s out of sample performance YTD is 4.1%, and for the last 12 months is 4.4%. Over the same period the benchmark E60B40 performance was 9.6% and 7.6% respectively. Over the previous week the market value of iM-FlipSaver 70:30 | 20:80 gained 0.07% at a time when SPY gained 0.71%. A starting capital of $100,000 at inception on 7/15/2015 would have grown to $150,886 which includes $1,874 cash and excludes $3,432 spent on fees and slippage. |
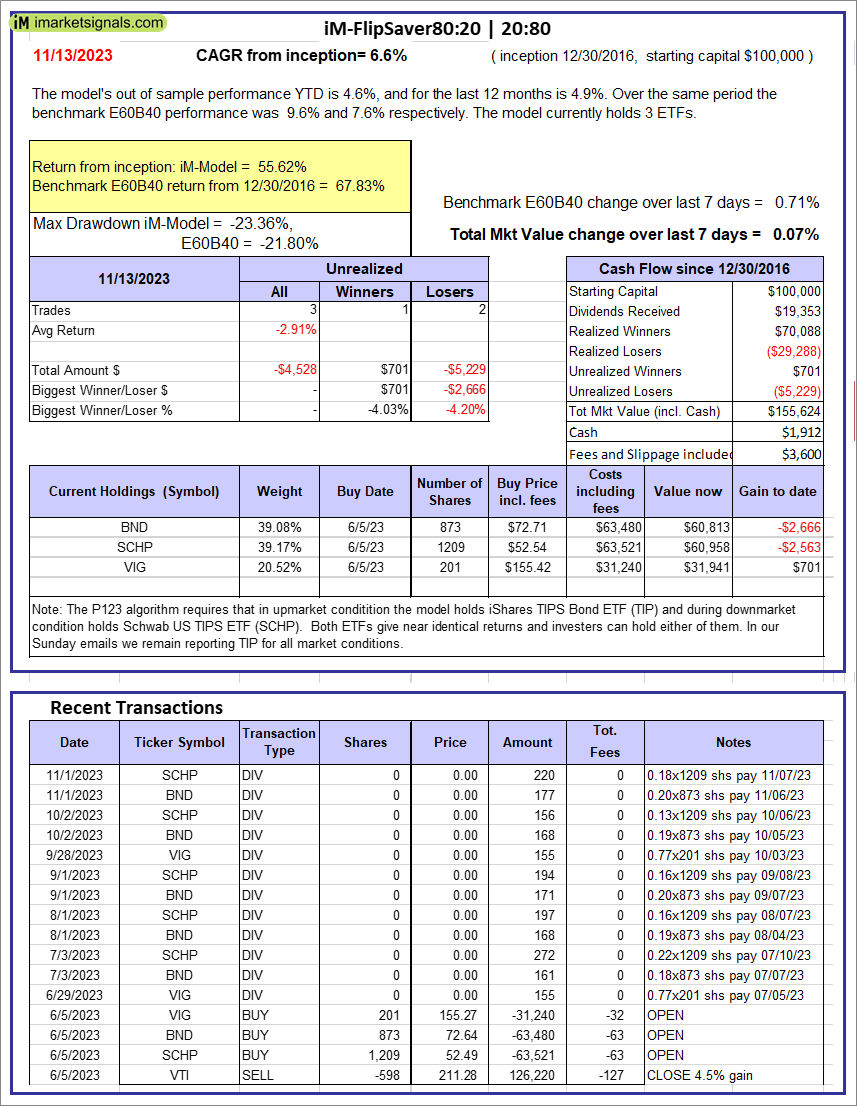 |
iM-FlipSaver 80:20 | 20:80 – 2017: The model’s out of sample performance YTD is 4.6%, and for the last 12 months is 4.9%. Over the same period the benchmark E60B40 performance was 9.6% and 7.6% respectively. Over the previous week the market value of iM-FlipSaver 80:20 | 20:80 gained 0.07% at a time when SPY gained 0.71%. A starting capital of $100,000 at inception on 1/2/2017 would have grown to $155,624 which includes $1,912 cash and excludes $3,600 spent on fees and slippage. |
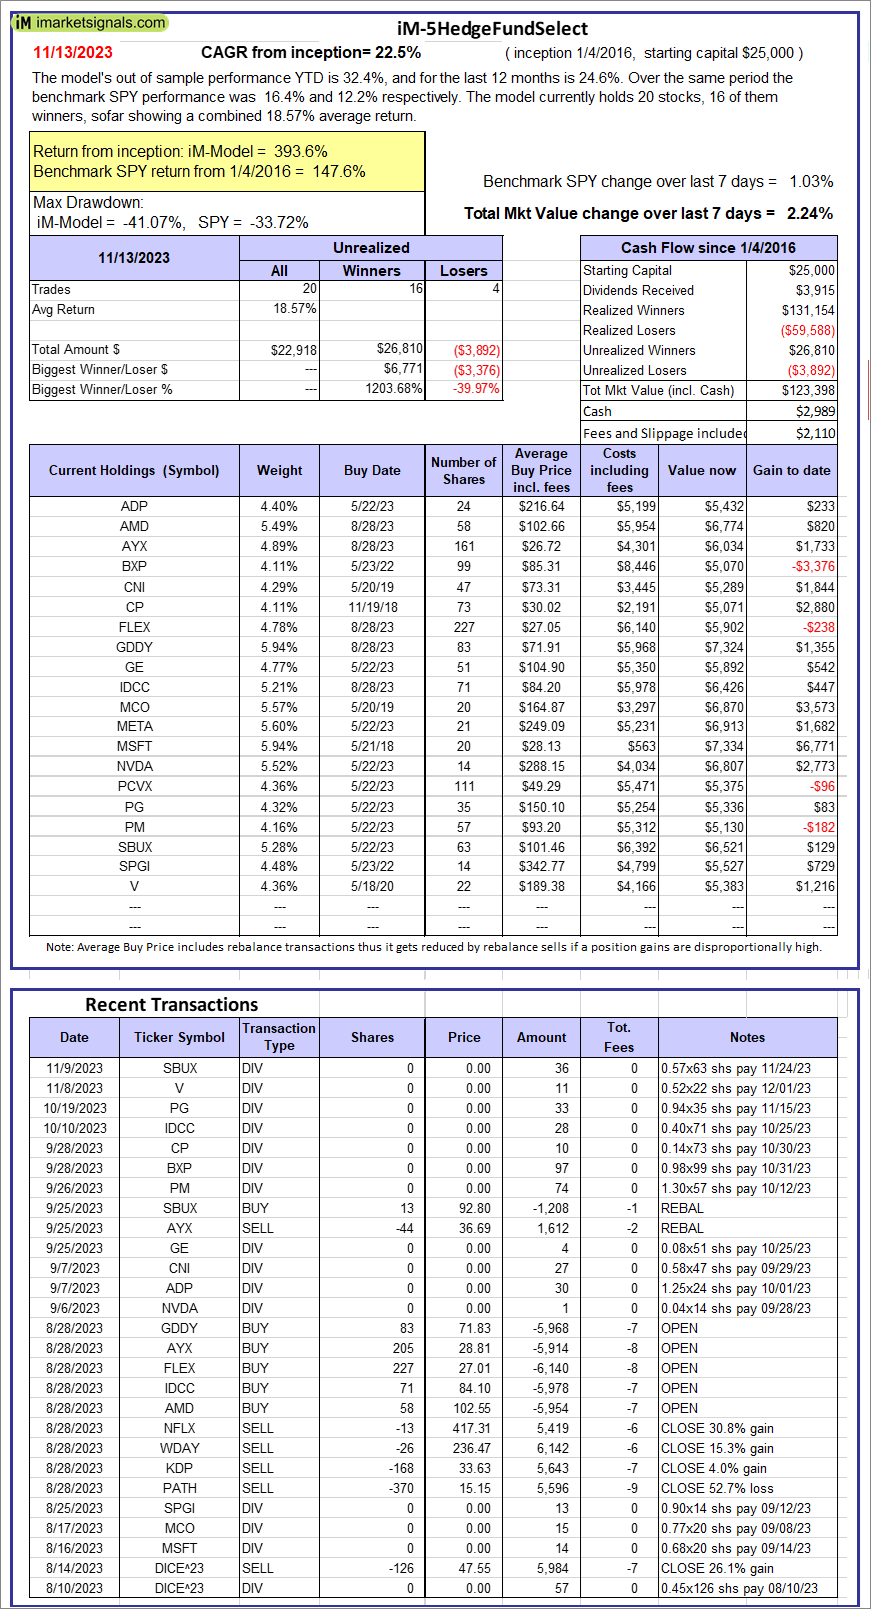 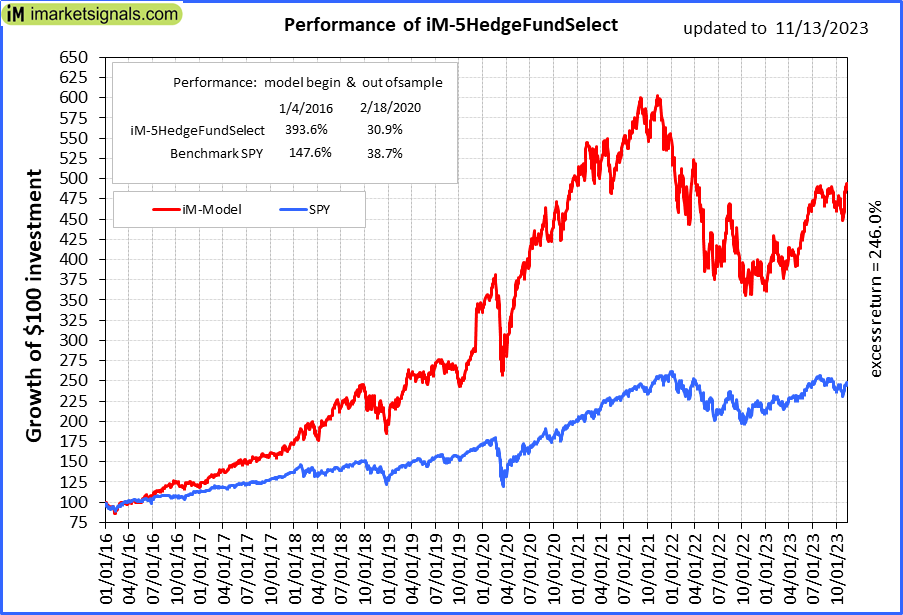 |
iM-5HedgeFundSelect: Since inception, on 1/5/2016, the model gained 393.59% while the benchmark SPY gained 147.61% over the same period. Over the previous week the market value of iM-5HedgeFundSelect gained 2.24% at a time when SPY gained 1.03%. A starting capital of $25,000 at inception on 1/5/2016 would have grown to $123,398 which includes $2,989 cash and excludes $2,110 spent on fees and slippage. |
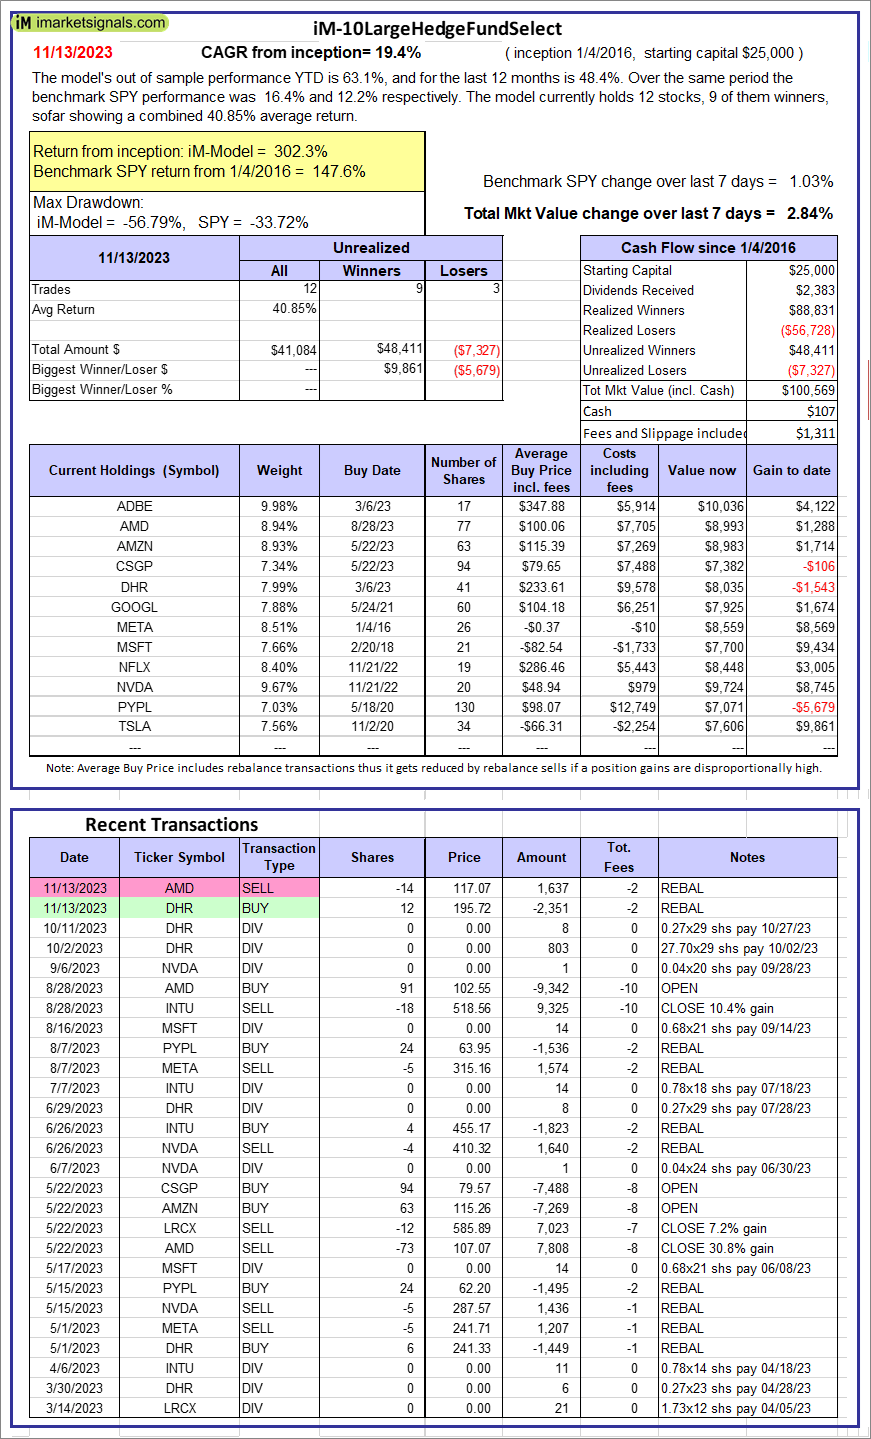 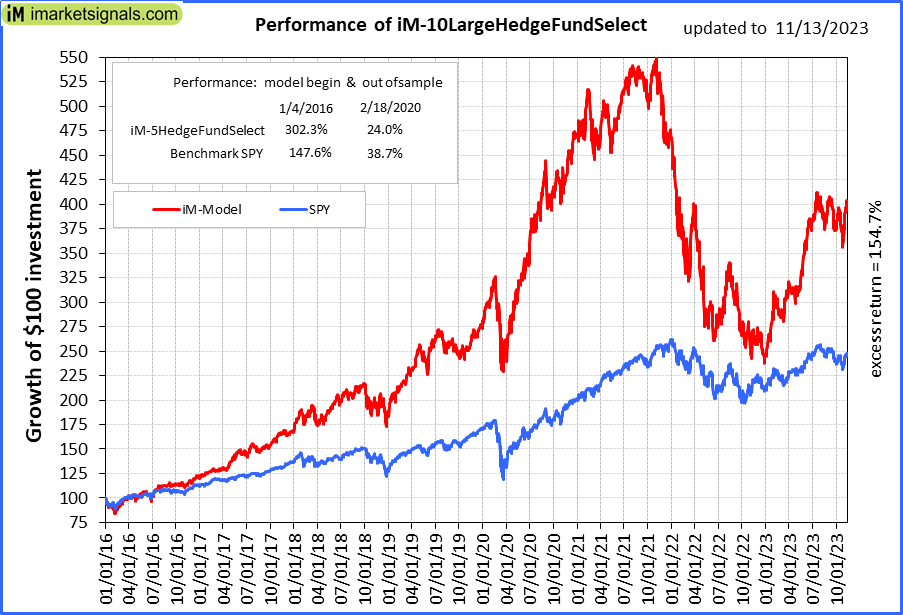 |
iM-10LargeHedgeFundSelect: Since inception, on 1/5/2016, the model gained 302.28% while the benchmark SPY gained 147.61% over the same period. Over the previous week the market value of iM-10LargeHedgeFundSelect gained 2.84% at a time when SPY gained 1.03%. A starting capital of $25,000 at inception on 1/5/2016 would have grown to $100,569 which includes $107 cash and excludes $1,311 spent on fees and slippage. |
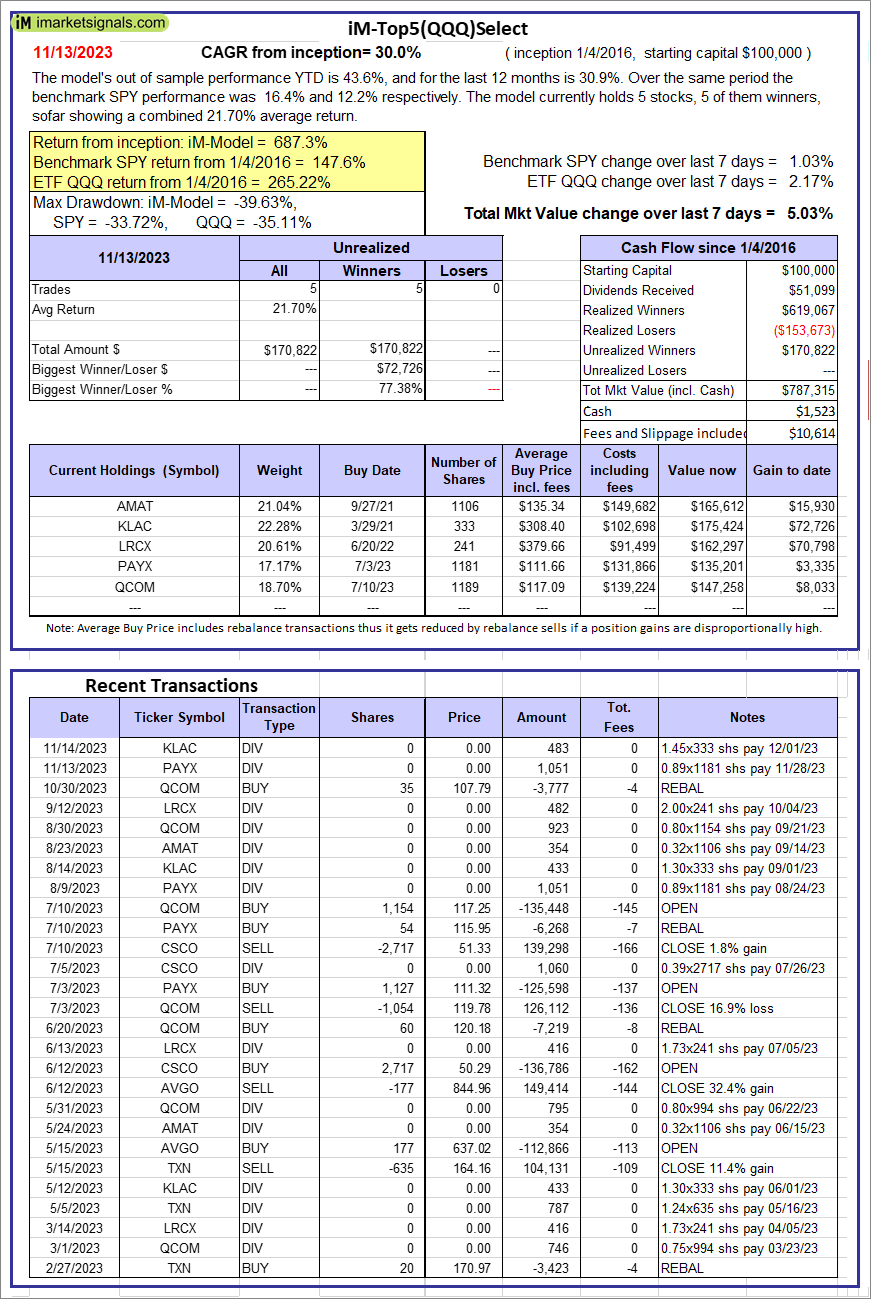 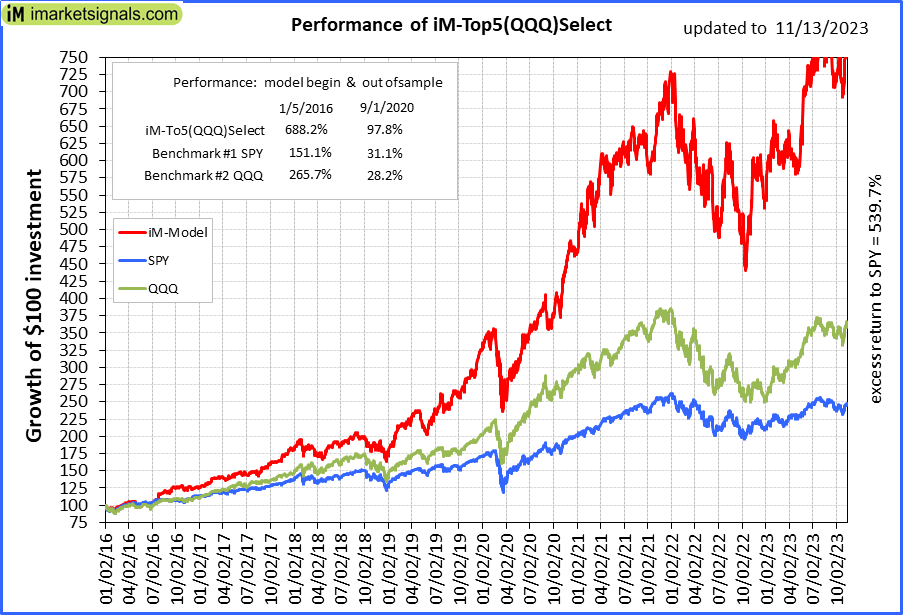 |
iM-Top5(QQQ)Select: Since inception, on 1/5/2016, the model gained 687.31% while the benchmark SPY gained 147.61% over the same period. Over the previous week the market value of iM-Top5(QQQ)Select gained 5.03% at a time when SPY gained 1.03%. A starting capital of $100,000 at inception on 1/5/2016 would have grown to $787,315 which includes $1,523 cash and excludes $10,614 spent on fees and slippage. |
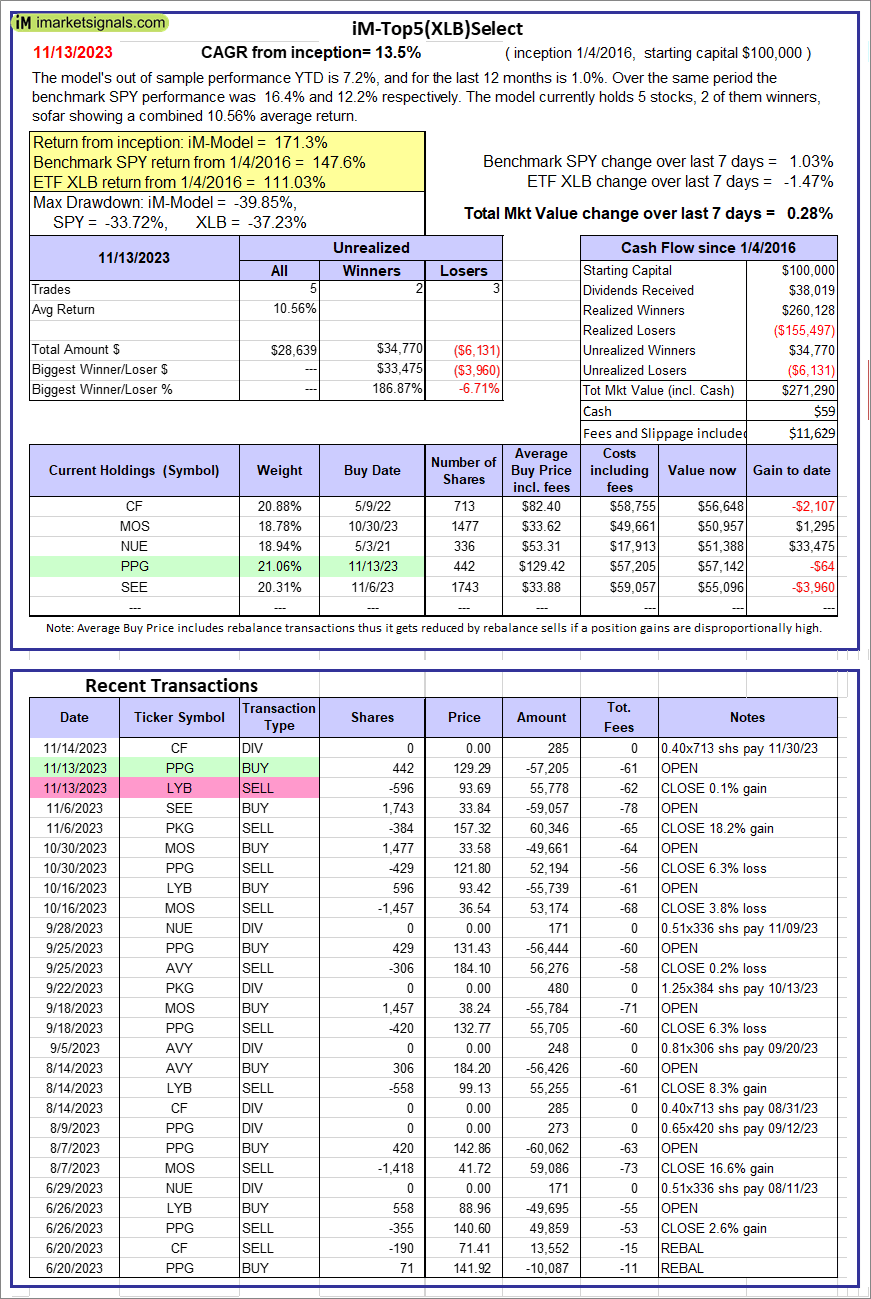 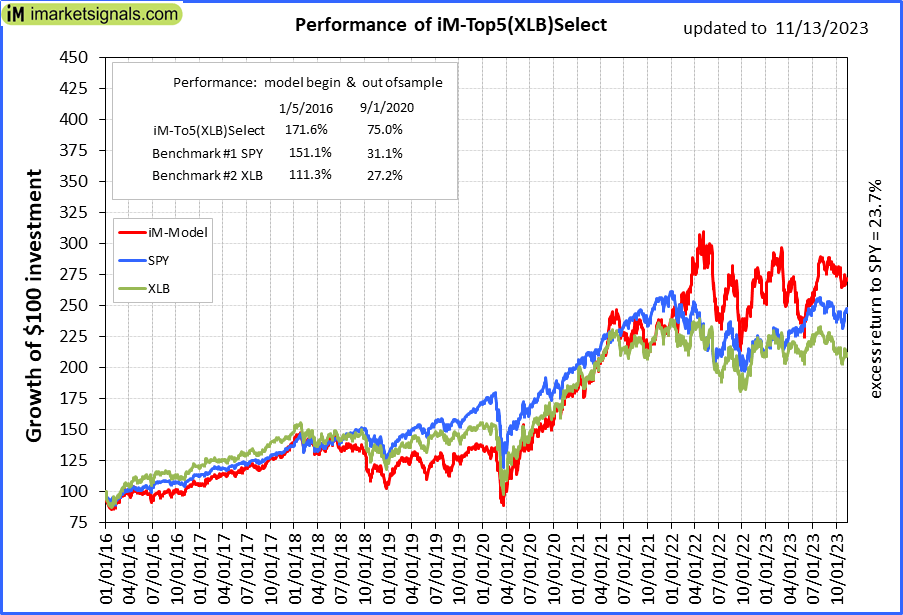 |
iM-Top5(XLB)Select: Since inception, on 1/5/2016, the model gained 171.29% while the benchmark SPY gained 147.61% over the same period. Over the previous week the market value of iM-Top5(XLB)Select gained 0.28% at a time when SPY gained 1.03%. A starting capital of $100,000 at inception on 1/5/2016 would have grown to $271,290 which includes $59 cash and excludes $11,629 spent on fees and slippage. |
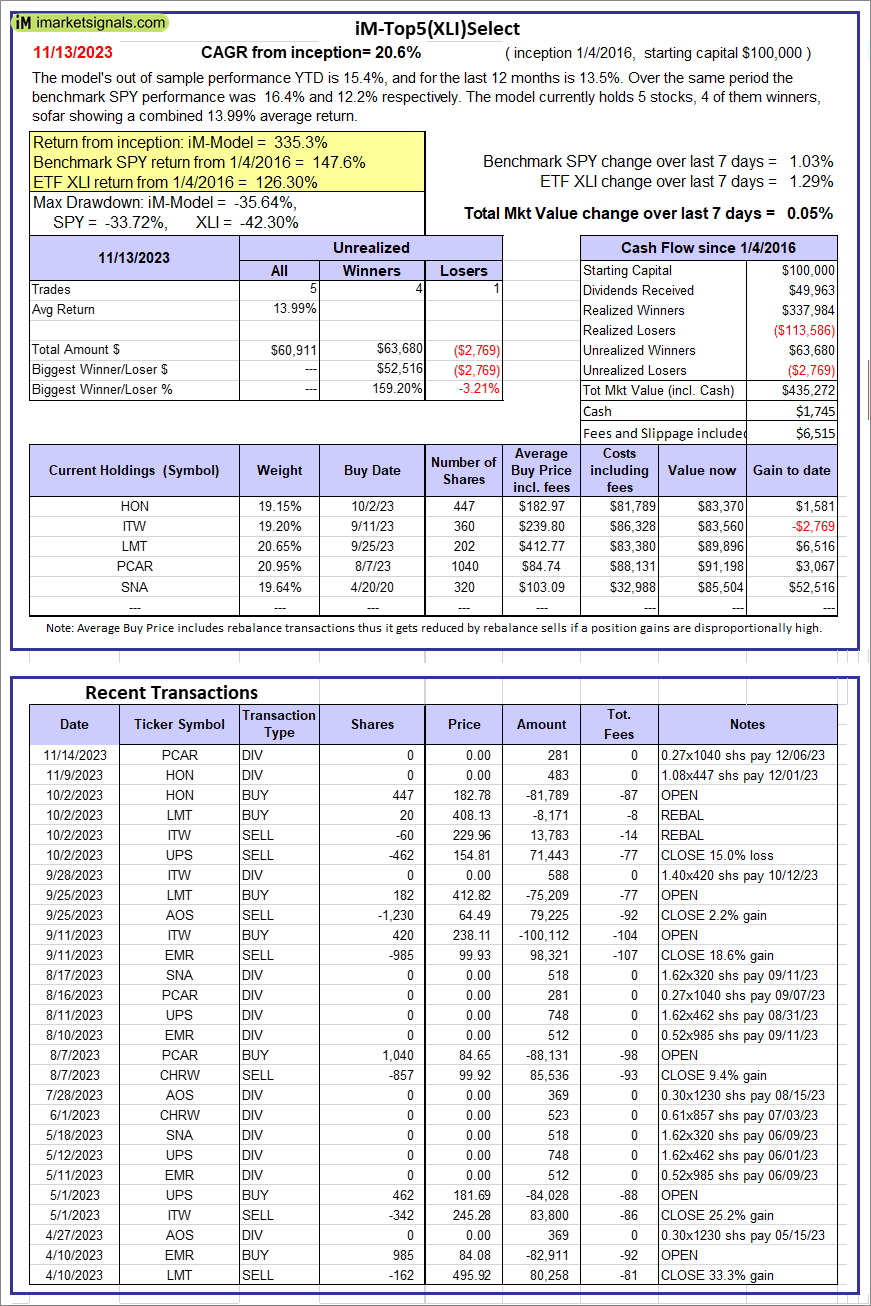 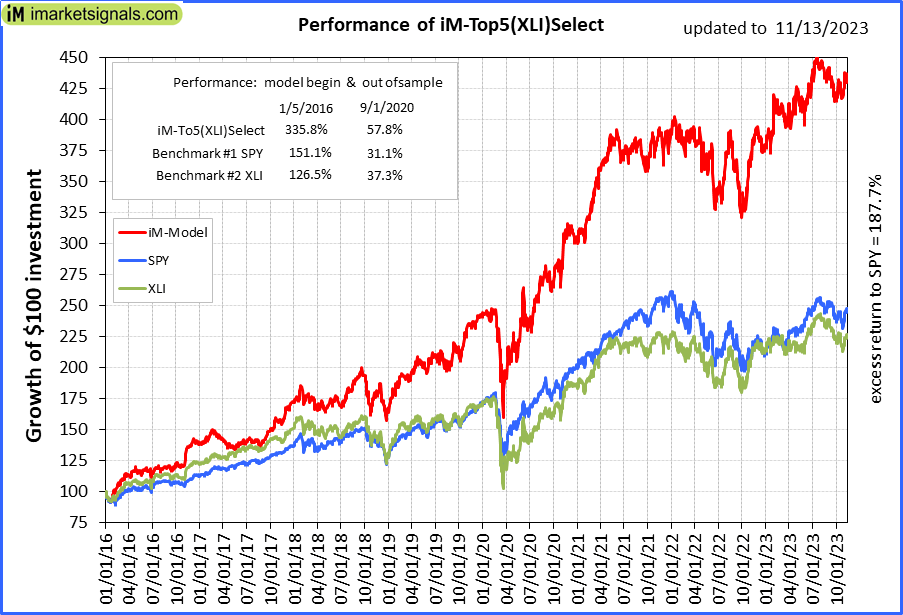 |
iM-Top5(XLI)Select: Since inception, on 1/5/2016, the model gained 335.27% while the benchmark SPY gained 147.61% over the same period. Over the previous week the market value of iM-Top5(XLI)Select gained 0.05% at a time when SPY gained 1.03%. A starting capital of $100,000 at inception on 1/5/2016 would have grown to $435,272 which includes $1,745 cash and excludes $6,515 spent on fees and slippage. |
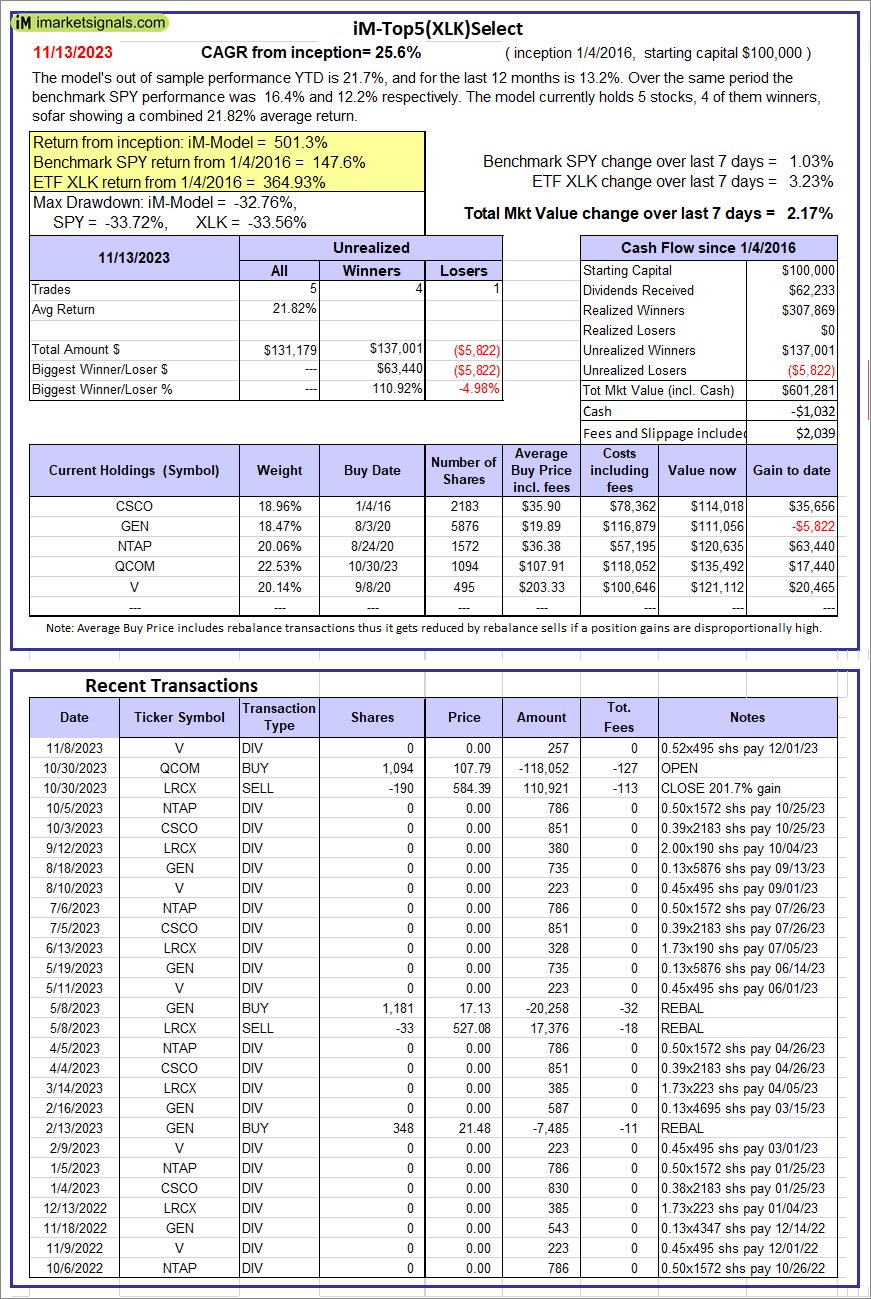 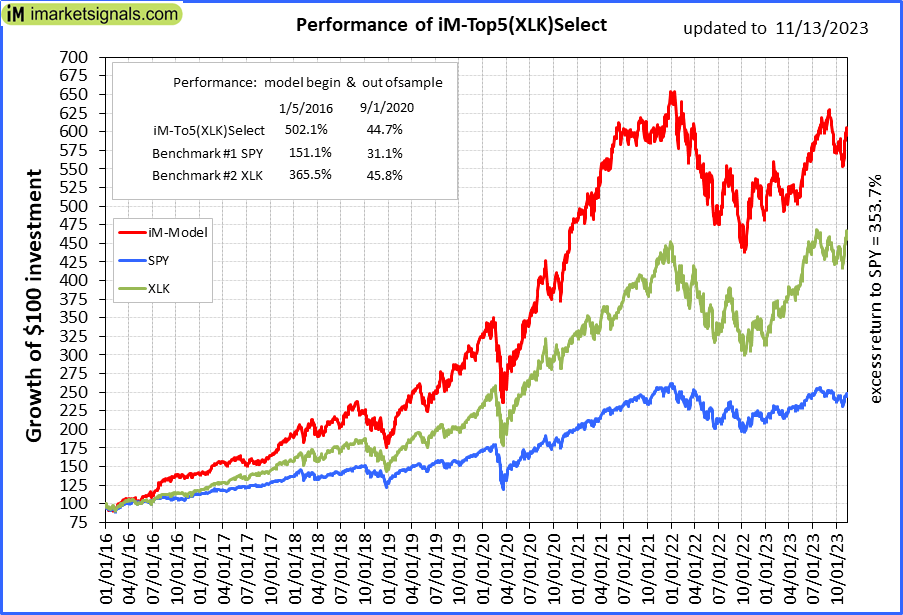 |
iM-Top5(XLK)Select: Since inception, on 1/5/2016, the model gained 501.28% while the benchmark SPY gained 147.61% over the same period. Over the previous week the market value of iM-Top5(XLK)Select gained 2.17% at a time when SPY gained 1.03%. A starting capital of $100,000 at inception on 1/5/2016 would have grown to $601,281 which includes -$1,032 cash and excludes $2,039 spent on fees and slippage. |
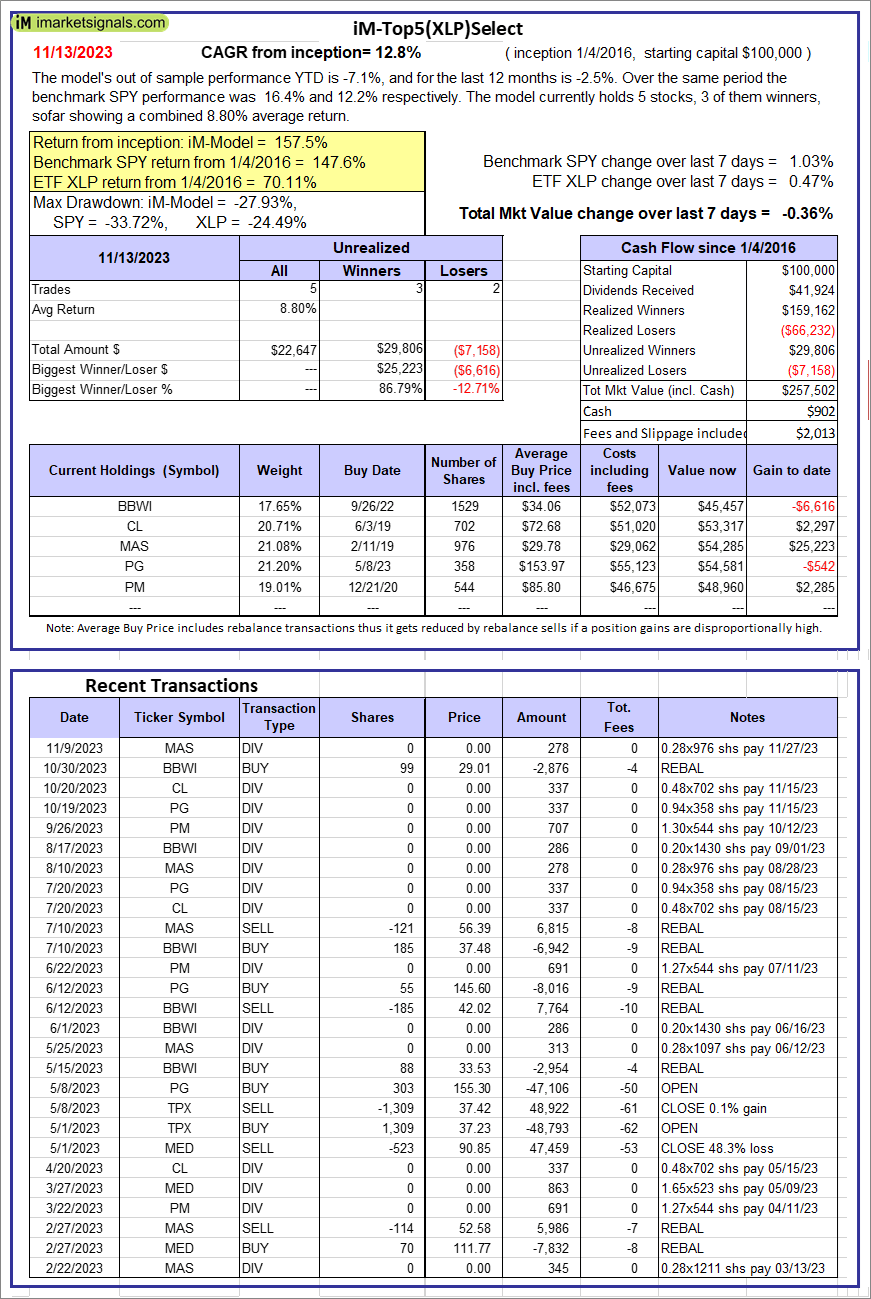 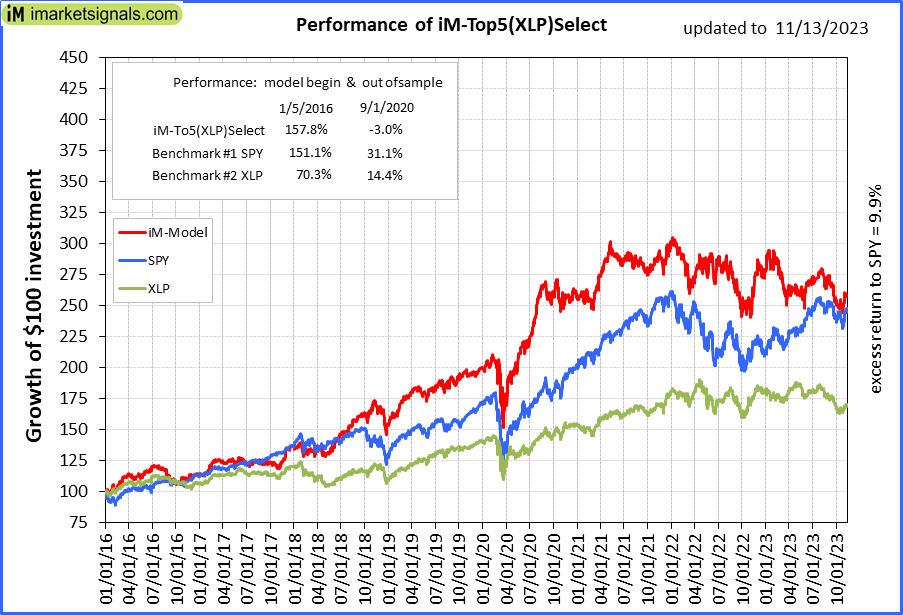 |
iM-Top5(XLP)Select: Since inception, on 1/5/2016, the model gained 157.50% while the benchmark SPY gained 147.61% over the same period. Over the previous week the market value of iM-Top5(XLP)Select gained -0.36% at a time when SPY gained 1.03%. A starting capital of $100,000 at inception on 1/5/2016 would have grown to $257,502 which includes $902 cash and excludes $2,013 spent on fees and slippage. |
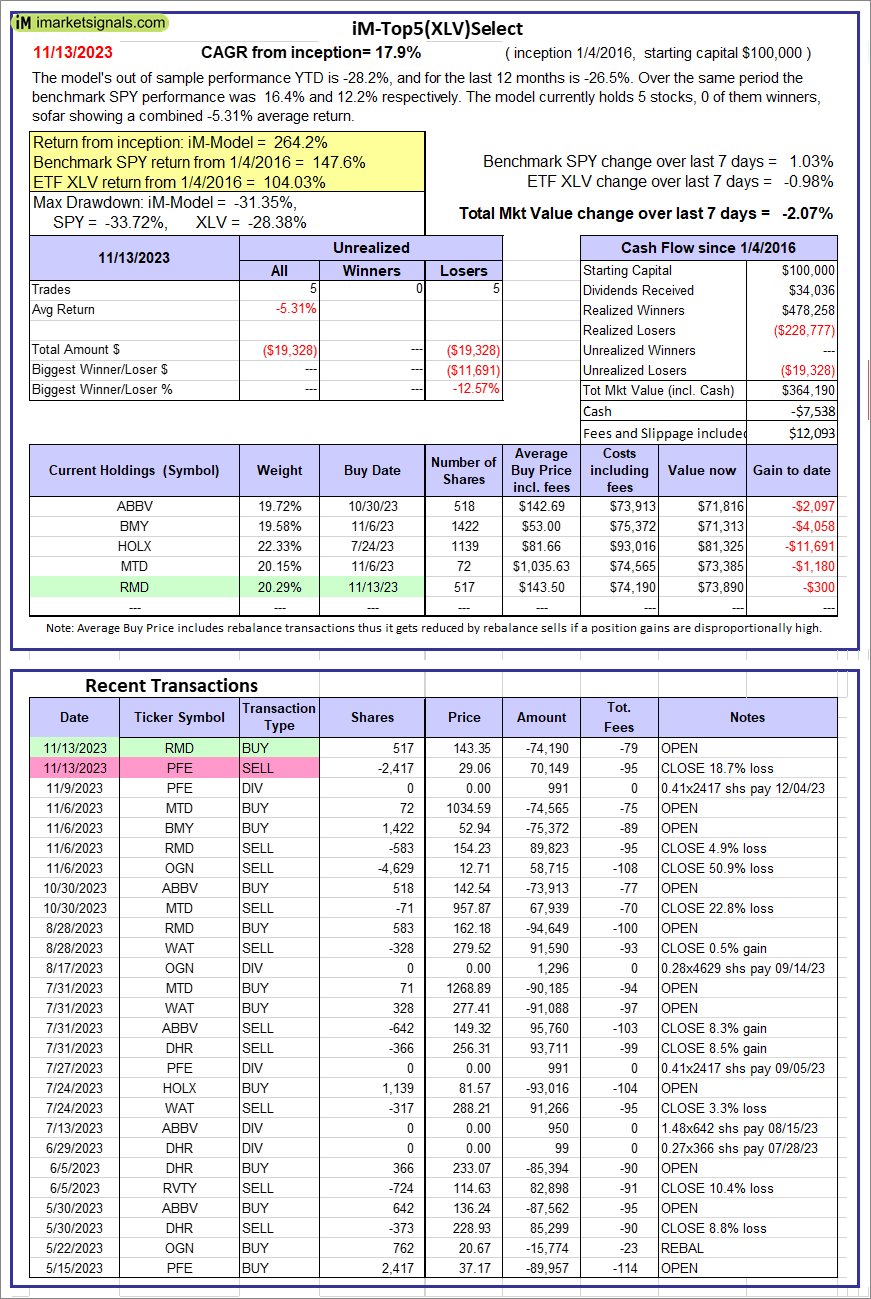 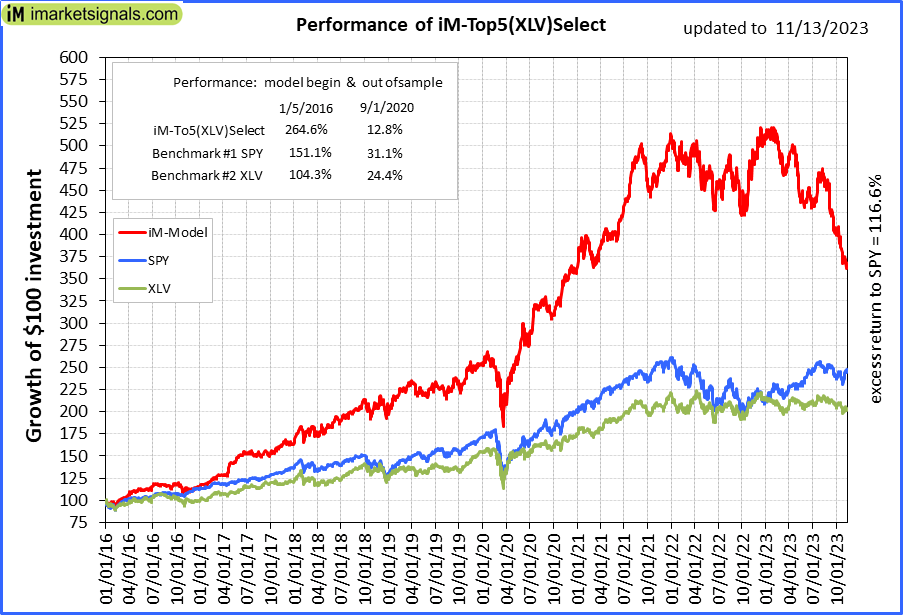 |
iM-Top5(XLV)Select: Since inception, on 1/5/2016, the model gained 264.19% while the benchmark SPY gained 147.61% over the same period. Over the previous week the market value of iM-Top5(XLV)Select gained -2.07% at a time when SPY gained 1.03%. A starting capital of $100,000 at inception on 1/5/2016 would have grown to $364,190 which includes -$7,538 cash and excludes $12,093 spent on fees and slippage. |
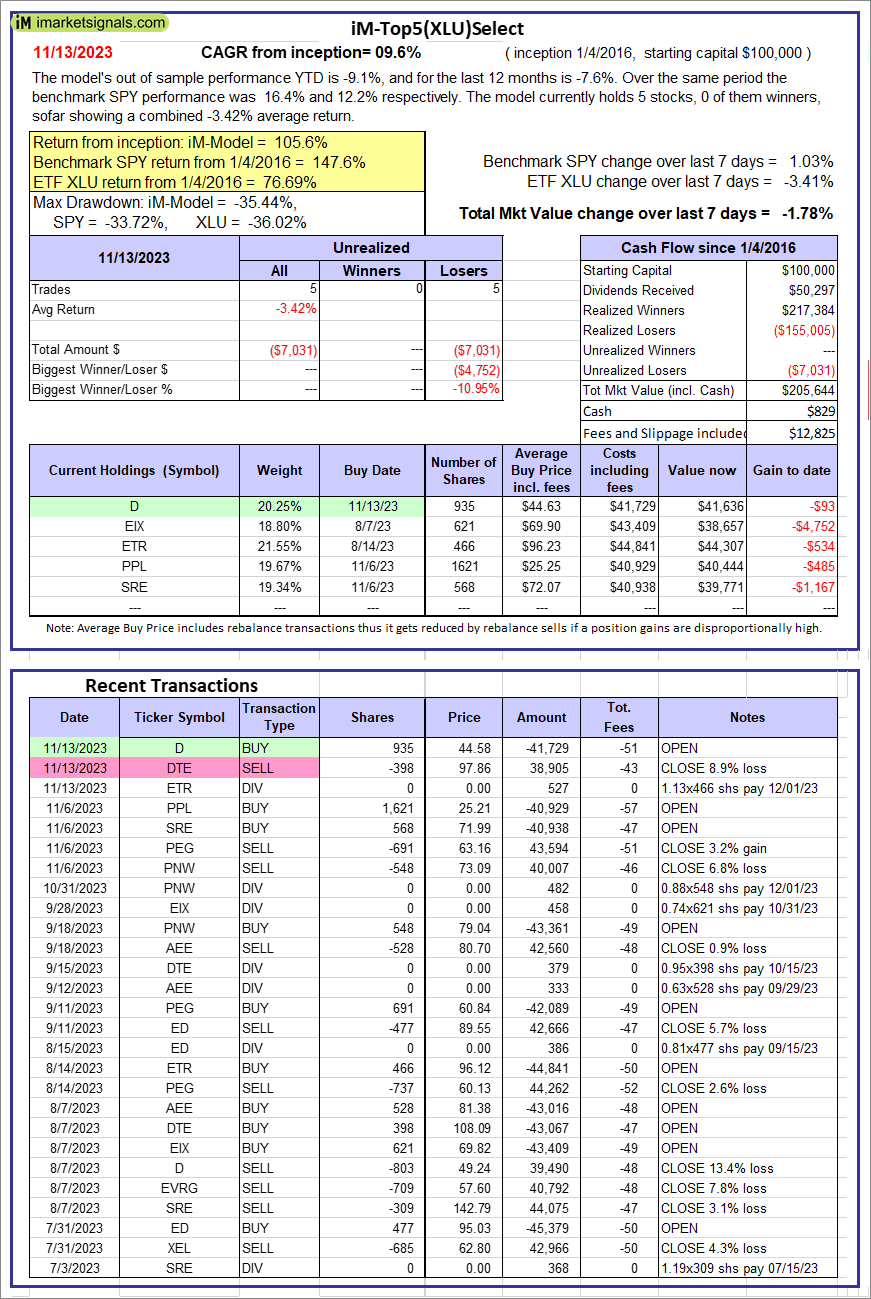 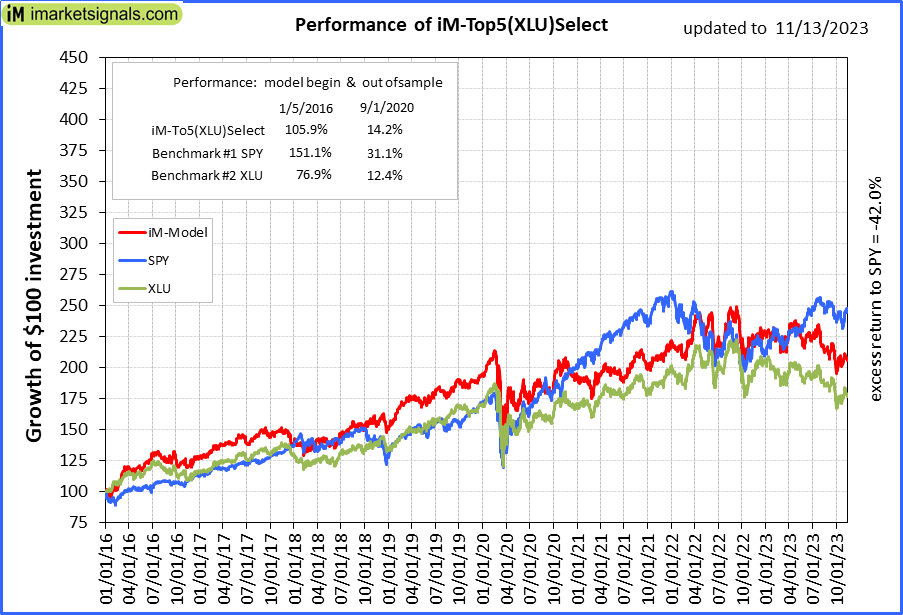 |
iM-Top5(XLU)Select: Since inception, on 1/5/2016, the model gained 105.64% while the benchmark SPY gained 147.61% over the same period. Over the previous week the market value of iM-Top5(XLU)Select gained -1.78% at a time when SPY gained 1.03%. A starting capital of $100,000 at inception on 1/5/2016 would have grown to $205,644 which includes $829 cash and excludes $12,825 spent on fees and slippage. |
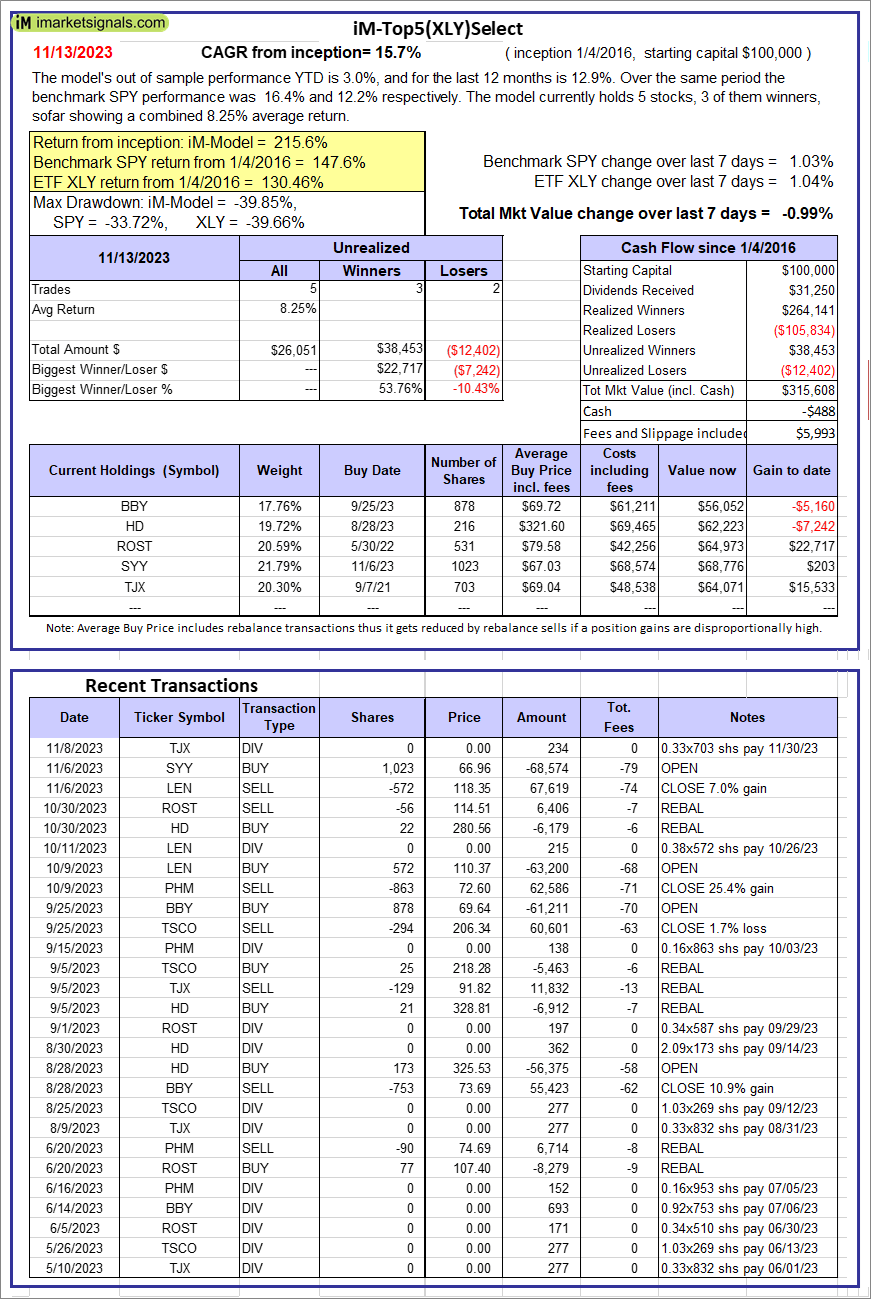 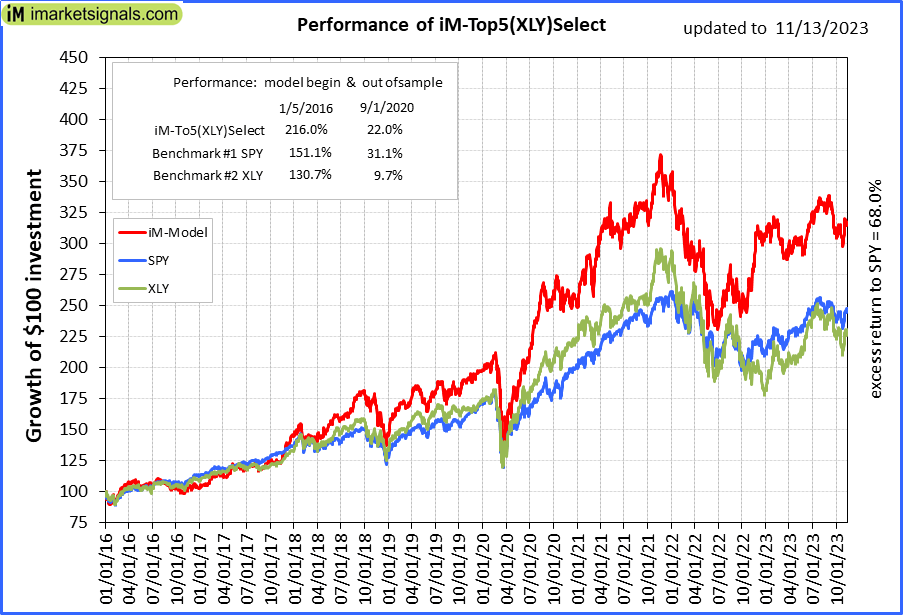 |
iM-Top5(XLY)Select: Since inception, on 1/5/2016, the model gained 215.61% while the benchmark SPY gained 147.61% over the same period. Over the previous week the market value of iM-Top5(XLY)Select gained -0.99% at a time when SPY gained 1.03%. A starting capital of $100,000 at inception on 1/5/2016 would have grown to $315,608 which includes -$488 cash and excludes $5,993 spent on fees and slippage. |
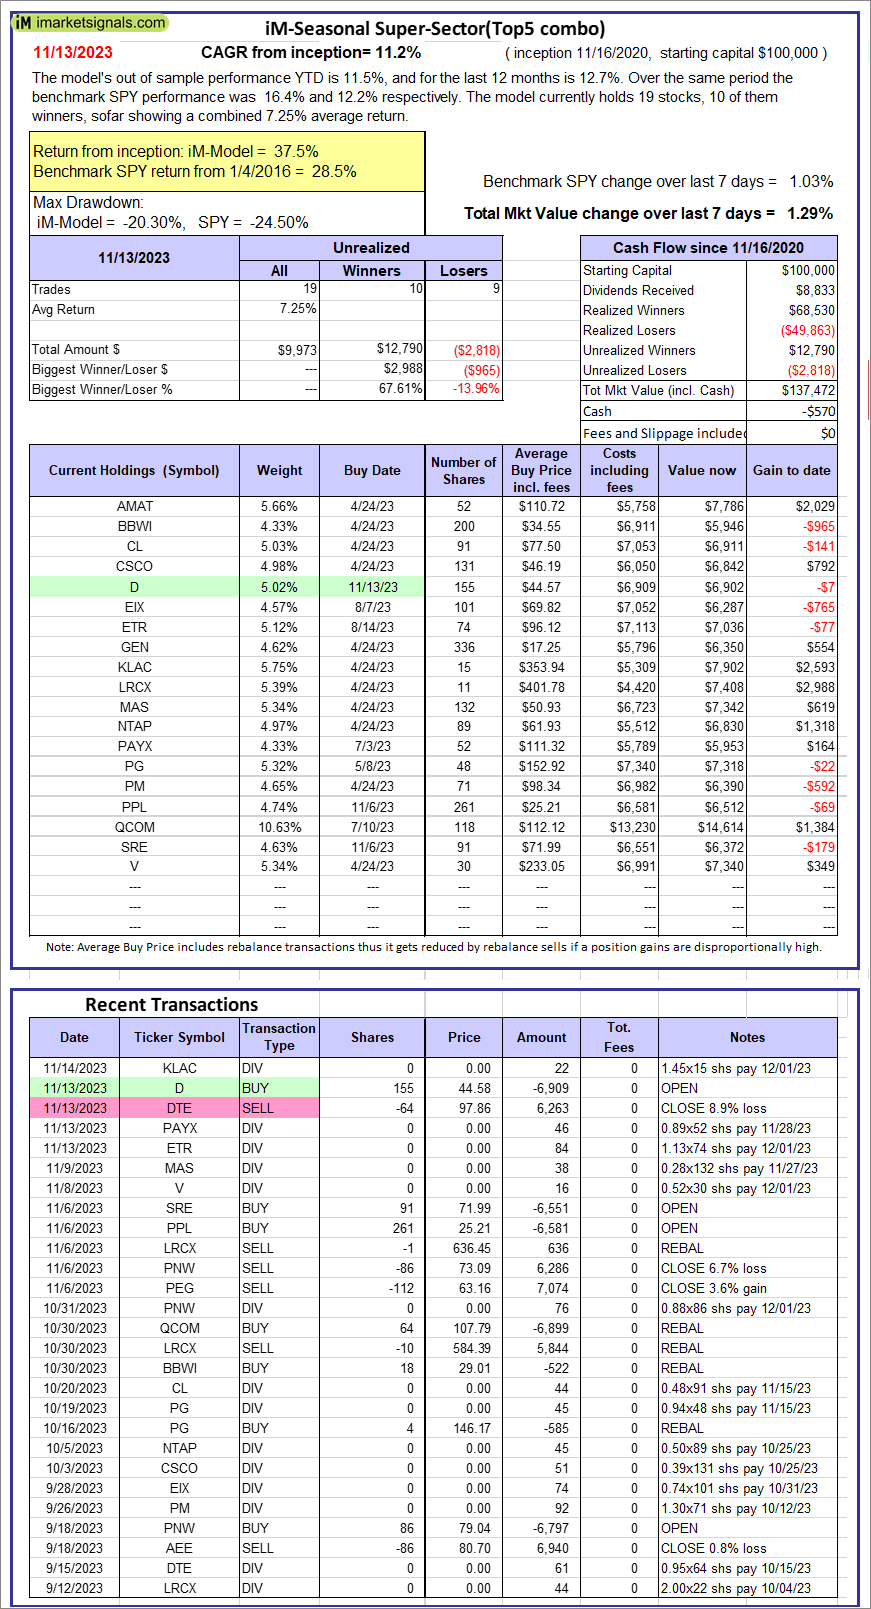 |
iM-Seasonal Super-Sectors (Top5 combo) : Since inception, on 11/17/2020, the model gained 37.47% while the benchmark SPY gained 28.54% over the same period. Over the previous week the market value of iM-Seasonal Super-Sectors (Top5 combo) gained 1.29% at a time when SPY gained 1.03%. A starting capital of $100,000 at inception on 11/17/2020 would have grown to $137,472 which includes -$570 cash and excludes $00 spent on fees and slippage. |
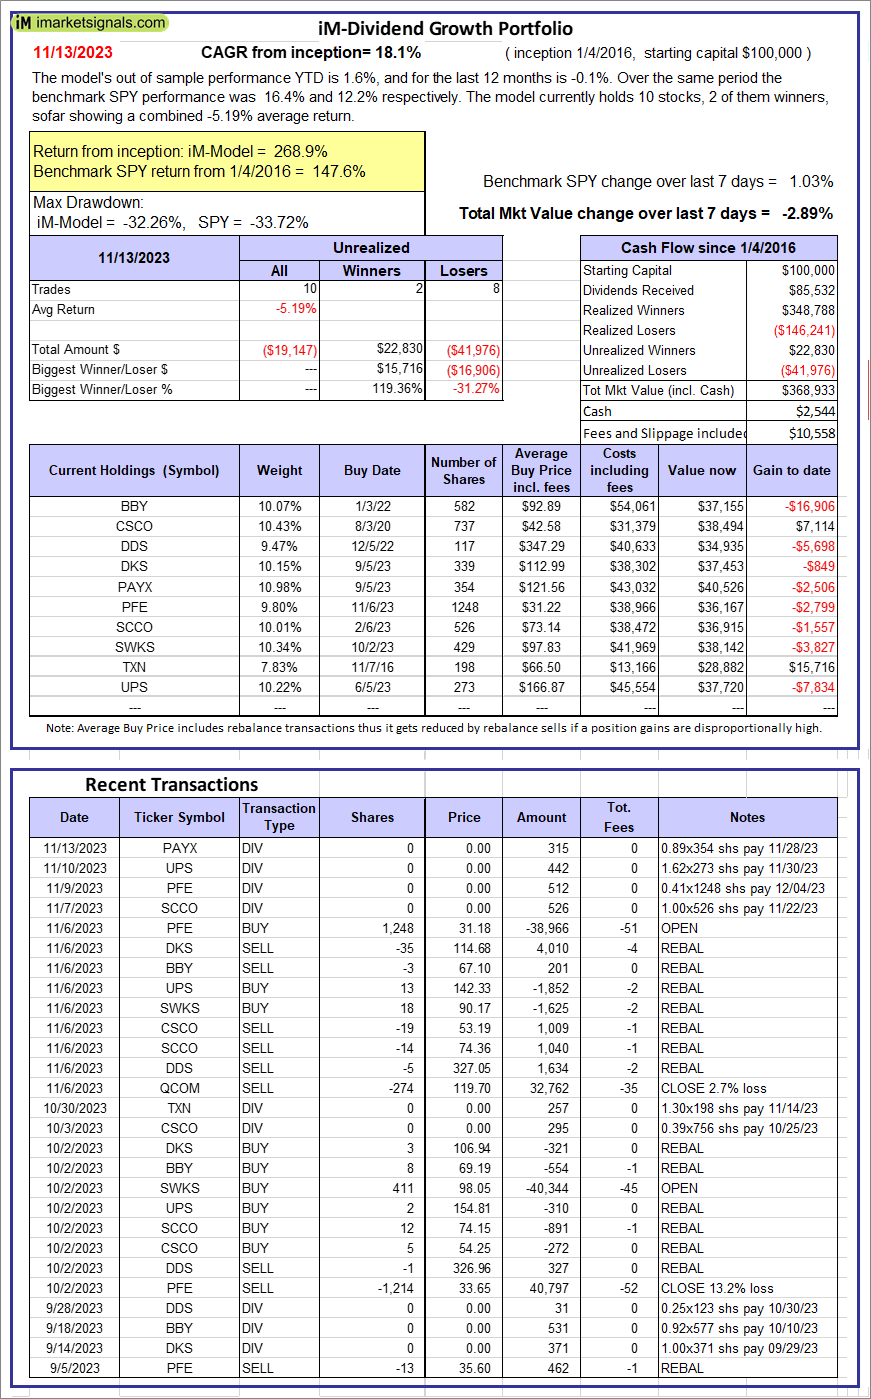 |
iM-Dividend Growth Portfolio: The model’s out of sample performance YTD is 1.6%, and for the last 12 months is -0.1%. Over the same period the benchmark SPY performance was 16.4% and 12.2% respectively. Over the previous week the market value of the iM-Dividend Growth Portfolio gained -2.89% at a time when SPY gained 1.03%. A starting capital of $100,000 at inception on 6/30/2016 would have grown to $368,933 which includes $2,544 cash and excludes $10,558 spent on fees and slippage. |
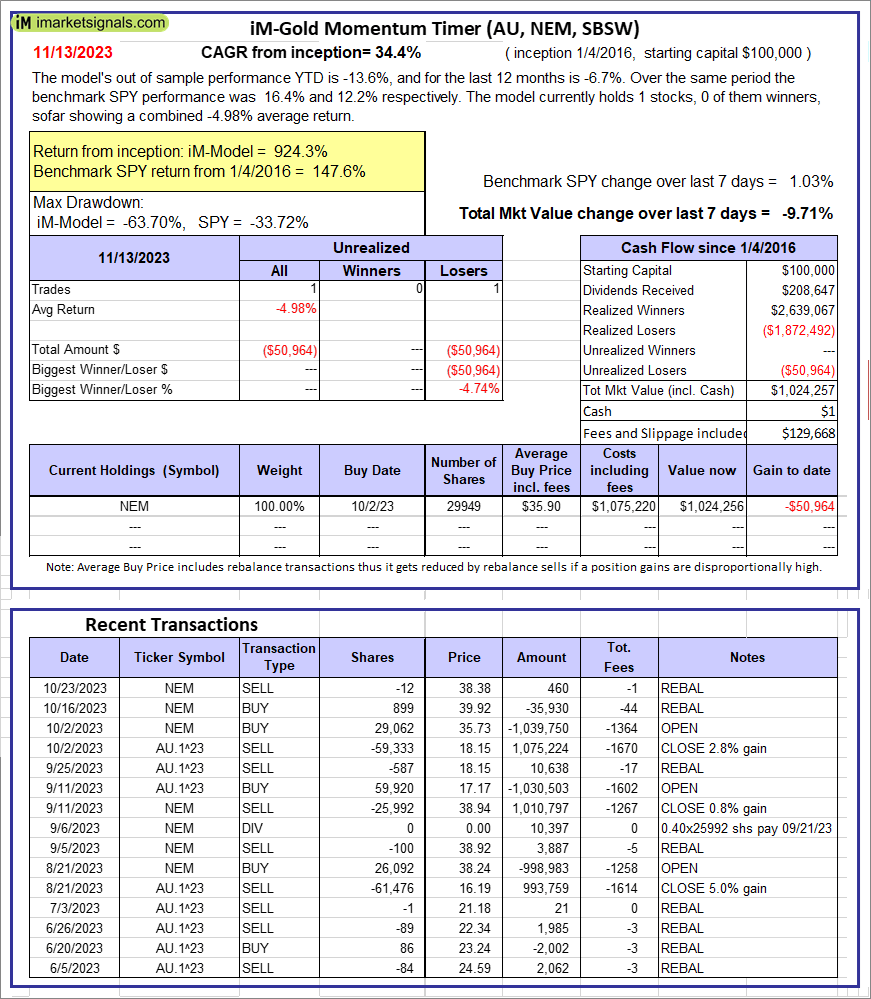 |
iM-Gold Momentum Timer (AU, NEM, SBSW): The model’s out of sample performance YTD is -13.6%, and for the last 12 months is -6.7%. Over the same period the benchmark SPY performance was 16.4% and 12.2% respectively. Over the previous week the market value of iM-Gold Momentum Timer (AU, NEM, SBSW) gained -9.71% at a time when SPY gained 1.03%. A starting capital of $100,000 at inception on 6/30/2016 would have grown to $01 which includes $129,668 cash and excludes Gain to date spent on fees and slippage. |
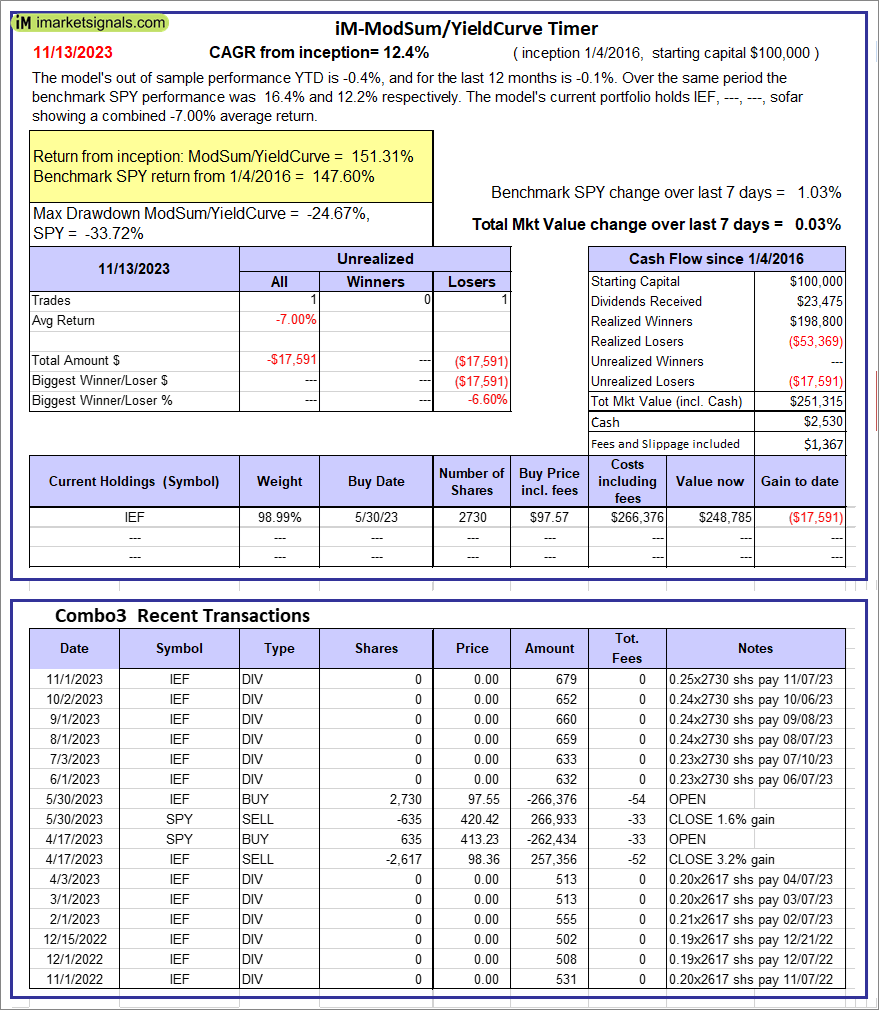 |
iM-ModSum/YieldCurve Timer: The model’s out of sample performance YTD is -0.4%, and for the last 12 months is -0.1%. Over the same period the benchmark SPY performance was 16.4% and 12.2% respectively. Over the previous week the market value of iM-PortSum/YieldCurve Timer gained 0.03% at a time when SPY gained 1.03%. A starting capital of $100,000 at inception on 1/1/2016 would have grown to $251,315 which includes $2,530 cash and excludes $1,367 spent on fees and slippage. |
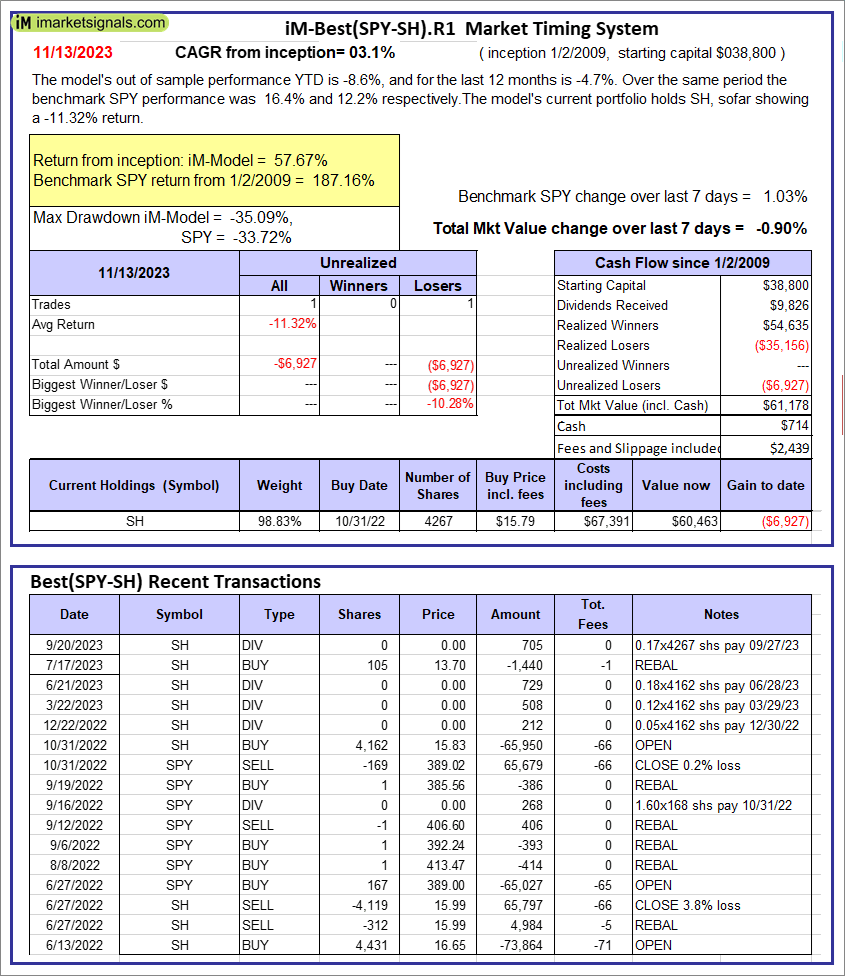 |
iM-Best(SPY-SH).R1: The model’s out of sample performance YTD is -8.6%, and for the last 12 months is -4.7%. Over the same period the benchmark SPY performance was 16.4% and 12.2% respectively. Over the previous week the market value of Best(SPY-SH) gained -0.90% at a time when SPY gained 1.03%. A starting capital of $100,000 at inception on 1/2/2009 would have grown to $61,178 which includes $714 cash and excludes $2,439 spent on fees and slippage. |
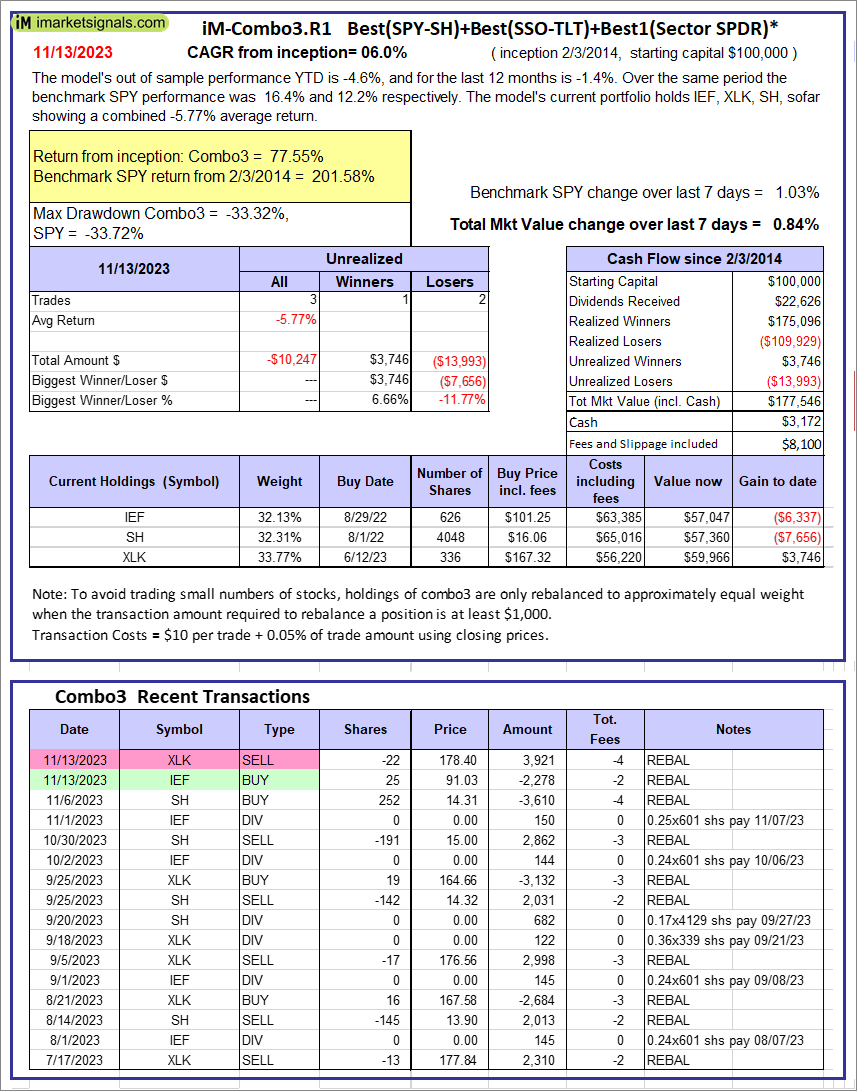 |
iM-Combo3.R1: The model’s out of sample performance YTD is -4.6%, and for the last 12 months is -1.4%. Over the same period the benchmark SPY performance was 16.4% and 12.2% respectively. Over the previous week the market value of iM-Combo3.R1 gained 0.84% at a time when SPY gained 1.03%. A starting capital of $100,000 at inception on 2/3/2014 would have grown to $177,546 which includes $3,172 cash and excludes $8,100 spent on fees and slippage. |
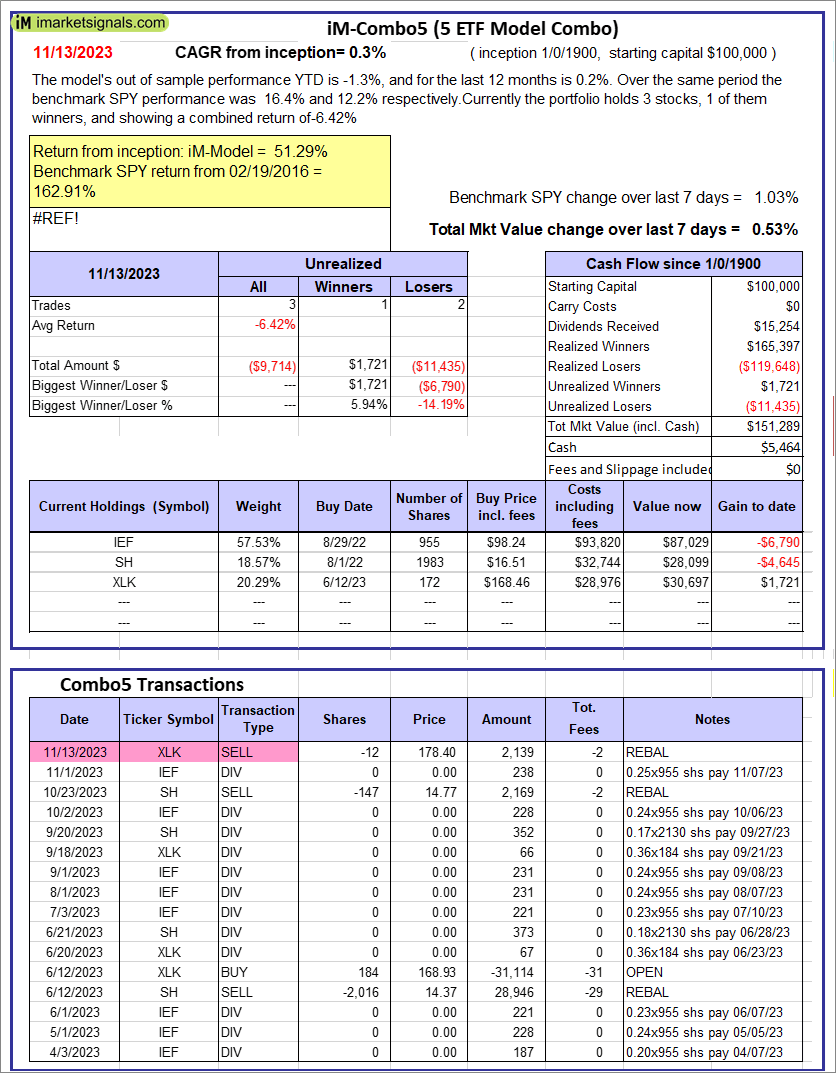 |
iM-Combo5: The model’s out of sample performance YTD is -1.3%, and for the last 12 months is 0.2%. Over the same period the benchmark SPY performance was 16.4% and 12.2% respectively. Over the previous week the market value of iM-Combo5 gained 0.53% at a time when SPY gained 1.03%. A starting capital of $100,000 at inception on 2/22/2016 would have grown to $151,289 which includes $5,464 cash and excludes $0 spent on fees and slippage. |
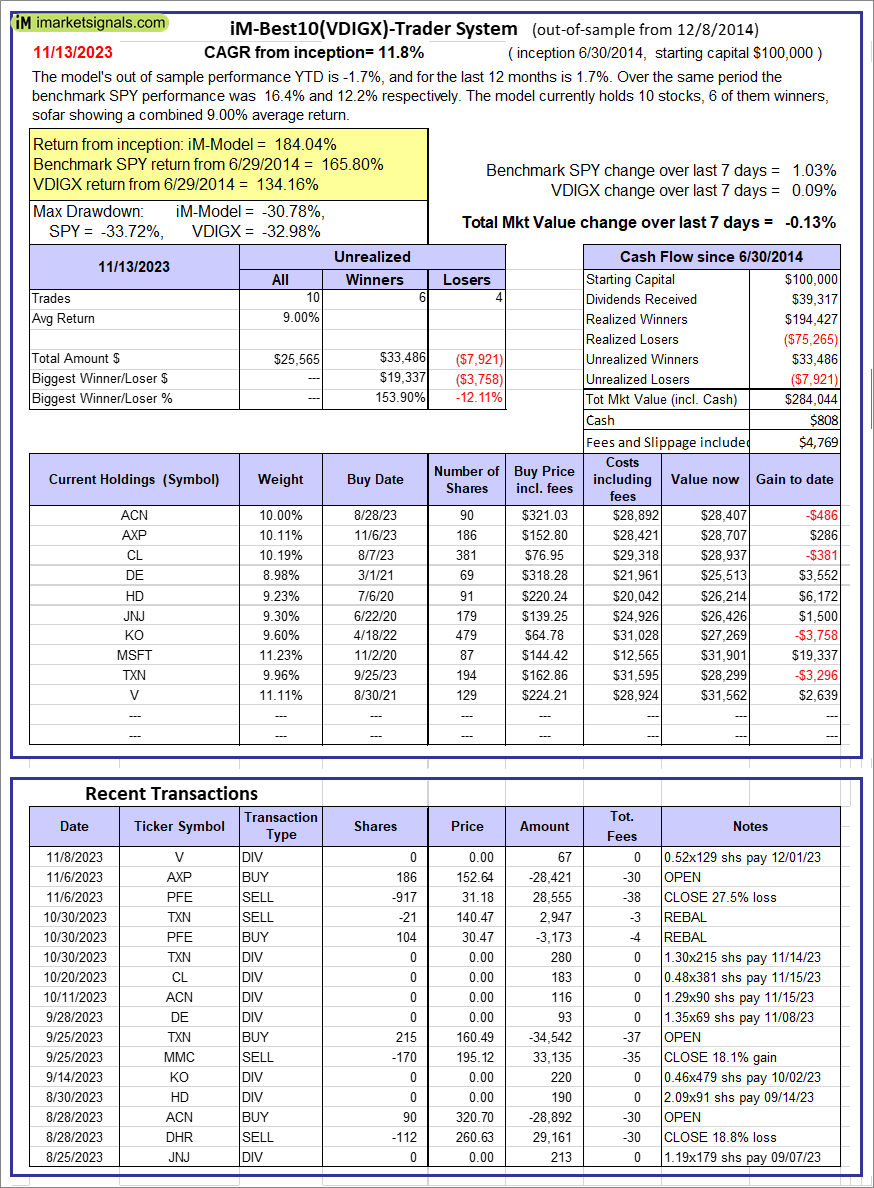 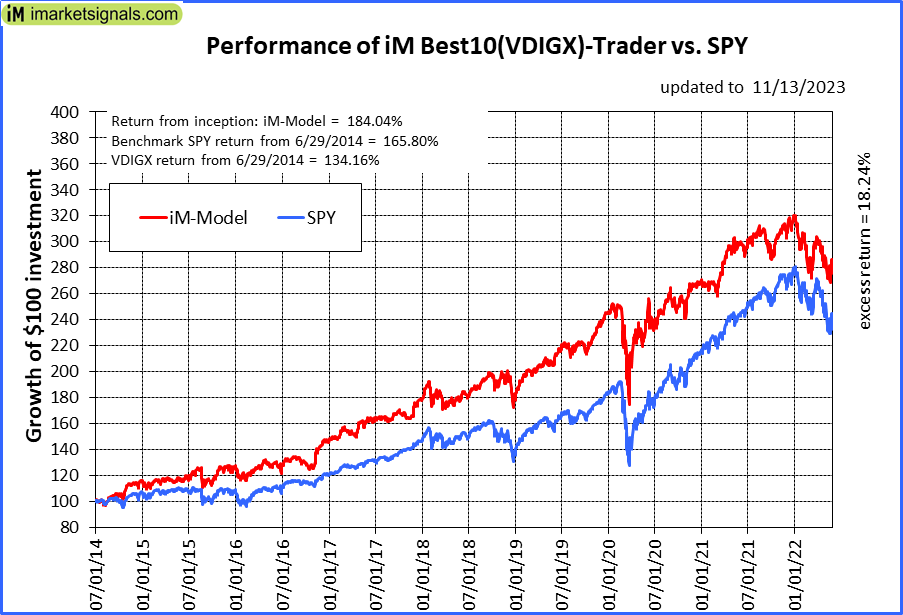 |
iM-Best10(VDIGX)-Trader: The model’s out of sample performance YTD is -1.7%, and for the last 12 months is 1.7%. Over the same period the benchmark SPY performance was 16.4% and 12.2% respectively. Since inception, on 7/1/2014, the model gained 184.04% while the benchmark SPY gained 165.80% and VDIGX gained 134.16% over the same period. Over the previous week the market value of iM-Best10(VDIGX) gained -0.13% at a time when SPY gained 1.03%. A starting capital of $100,000 at inception on 7/1/2014 would have grown to $284,044 which includes $808 cash and excludes $4,769 spent on fees and slippage. |
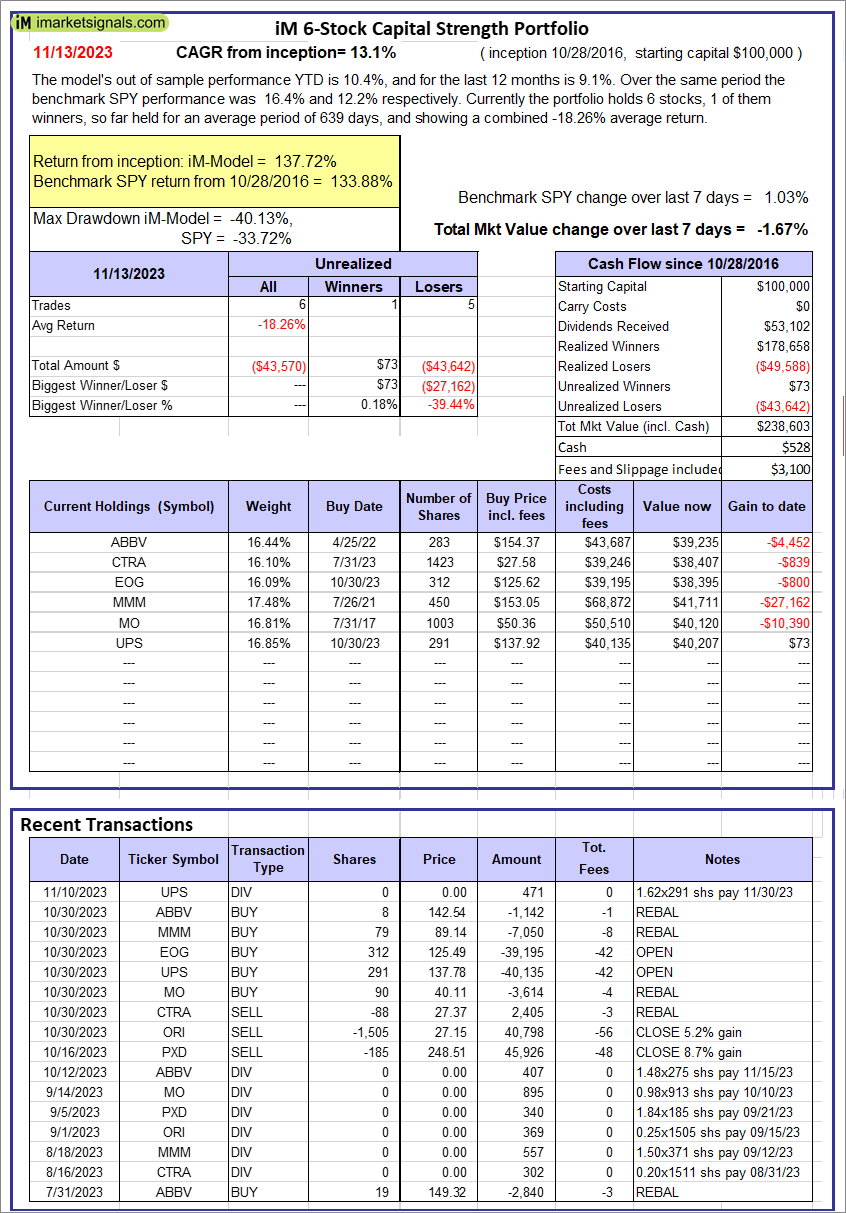 |
iM 6-Stock Capital Strength Portfolio: The model’s out of sample performance YTD is 10.4%, and for the last 12 months is 9.1%. Over the same period the benchmark SPY performance was 16.4% and 12.2% respectively. Over the previous week the market value of the iM 6-Stock Capital Strength Portfolio gained -1.67% at a time when SPY gained 1.03%. A starting capital of $100,000 at inception on 10/28/2016 would have grown to $238,603 which includes $528 cash and excludes $3,100 spent on fees and slippage. |
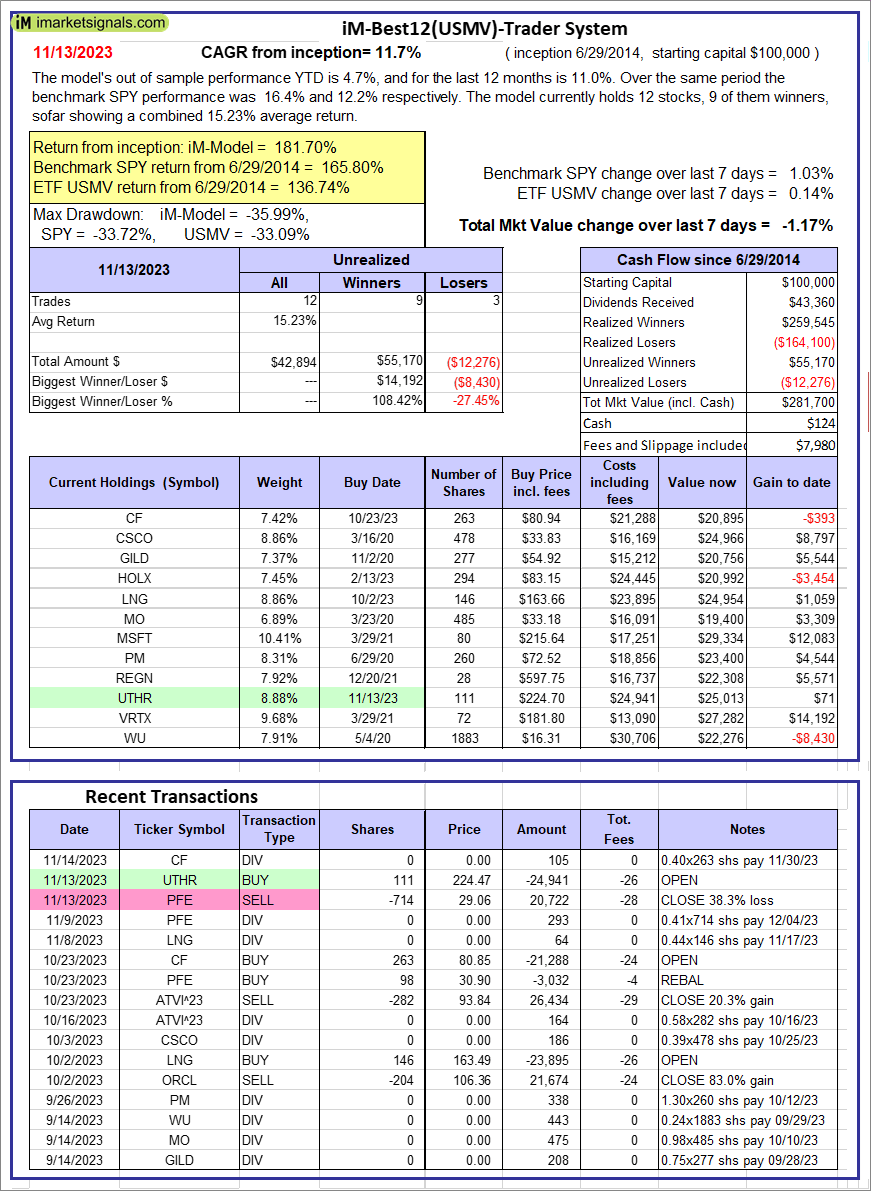 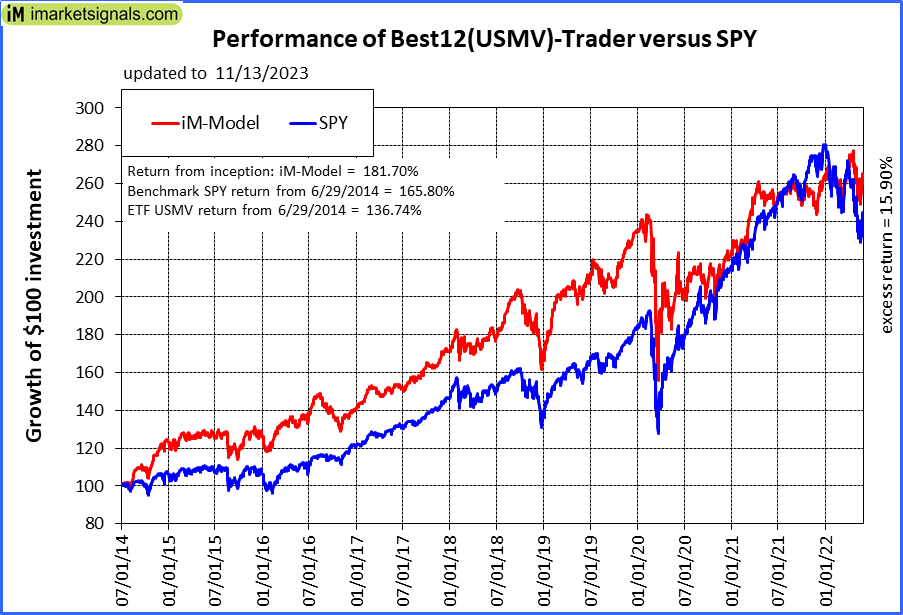 |
iM-Best12(USMV)-Trader: The model’s out of sample performance YTD is 4.7%, and for the last 12 months is 11.0%. Over the same period the benchmark SPY performance was 16.4% and 12.2% respectively. Since inception, on 6/30/2014, the model gained 181.70% while the benchmark SPY gained 165.80% and the ETF USMV gained 136.74% over the same period. Over the previous week the market value of iM-Best12(USMV)-Trader gained -1.17% at a time when SPY gained 1.03%. A starting capital of $100,000 at inception on 6/30/2014 would have grown to $281,700 which includes $124 cash and excludes $7,980 spent on fees and slippage. |
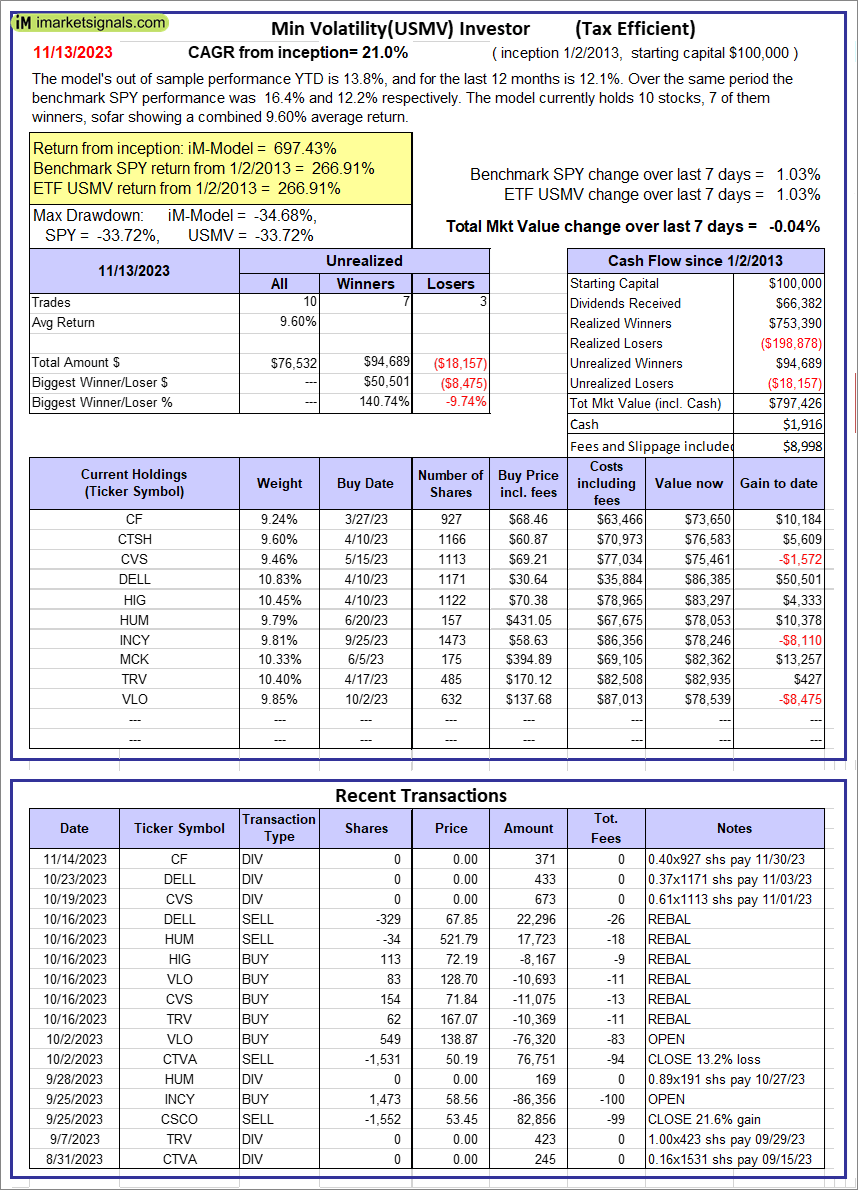 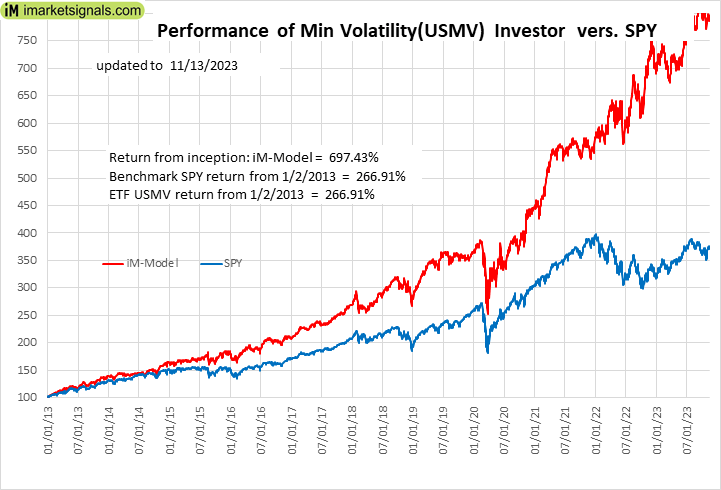 |
iM-Min Volatility(USMV) Investor (Tax Efficient): The model’s out of sample performance YTD is 13.8%, and for the last 12 months is 12.1%. Over the same period the benchmark SPY performance was 16.4% and 12.2% respectively. Since inception, on 1/3/2013, the model gained 697.43% while the benchmark SPY gained 266.91% and the ETF USMV gained 266.91% over the same period. Over the previous week the market value of iM-Best12(USMV)Q1 gained -0.04% at a time when SPY gained 1.03%. A starting capital of $100,000 at inception on 1/3/2013 would have grown to $797,426 which includes $1,916 cash and excludes $8,998 spent on fees and slippage. |
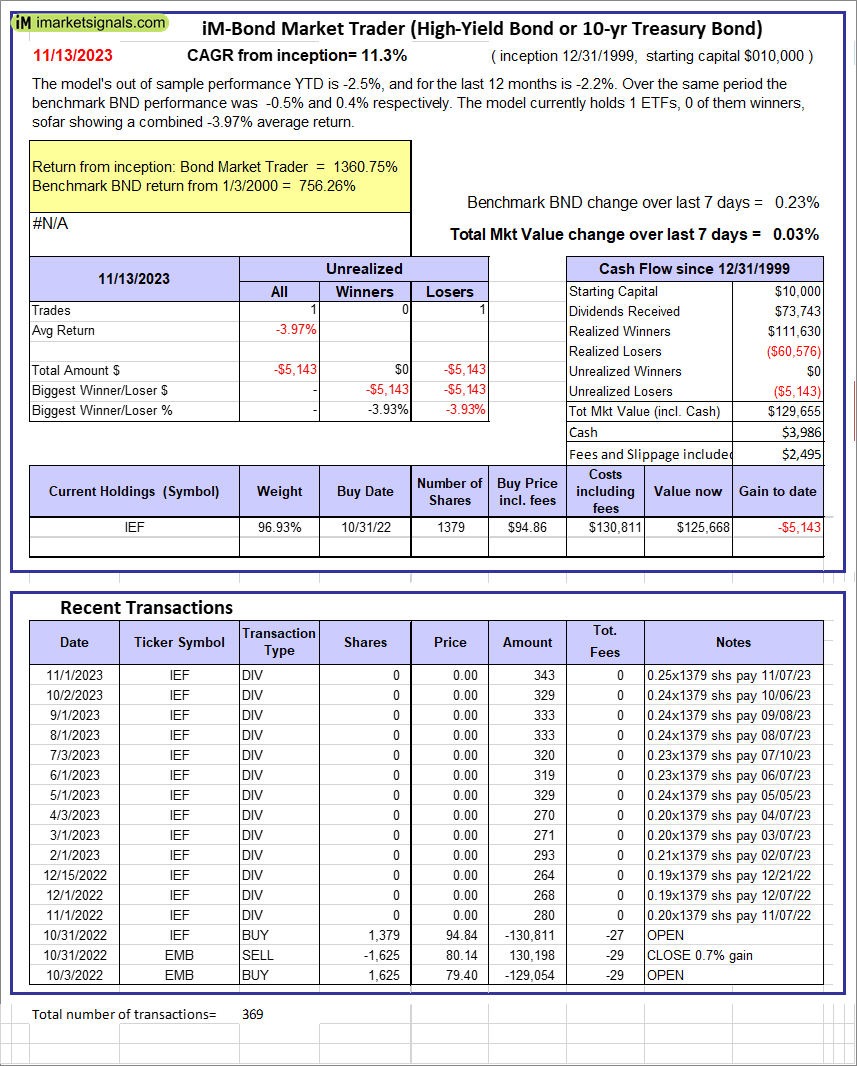 |
iM-Bond Market Trader (High-Yield Bond or 10-yr Treasury Bond): The model’s out of sample performance YTD is -2.5%, and for the last 12 months is -2.2%. Over the same period the benchmark BND performance was -0.5% and 0.4% respectively. Over the previous week the market value of the iM-Bond Market Trader (High-Yield Bond or 10-yr Treasury Bond) gained 0.03% at a time when BND gained 0.23%. A starting capital of $10,000 at inception on 1/3/2000 would have grown to $129,655 which includes $3,986 cash and excludes $2,495 spent on fees and slippage. |
|
|
iM-ModSum/YieldCurve Timer: The model’s out of sample performance YTD is -0.4%, and for the last 12 months is -0.1%. Over the same period the benchmark SPY performance was 16.4% and 12.2% respectively. Over the previous week the market value of iM-PortSum/YieldCurve Timer gained 0.03% at a time when SPY gained 1.03%. A starting capital of $100,000 at inception on 1/1/2016 would have grown to $251,315 which includes $2,530 cash and excludes $1,367 spent on fees and slippage. |
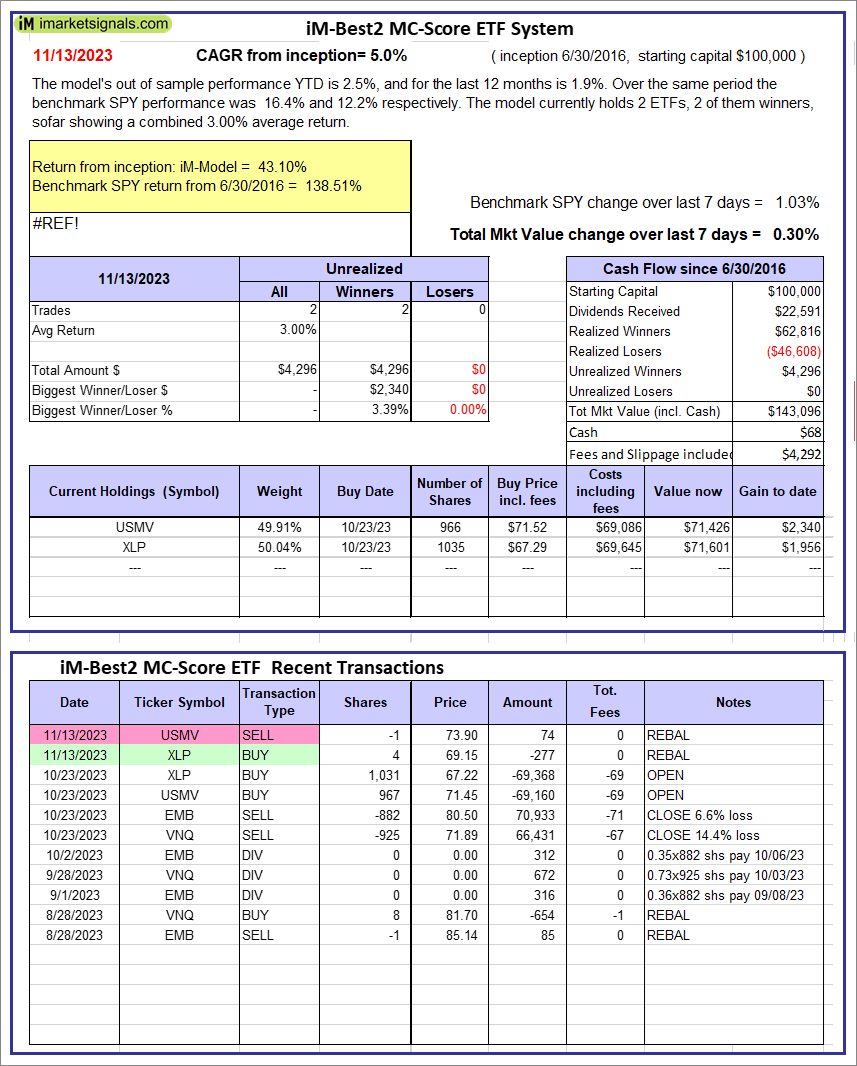 |
iM-Best2 MC-Score ETF System: The model’s out of sample performance YTD is 2.5%, and for the last 12 months is 1.9%. Over the same period the benchmark SPY performance was 16.4% and 12.2% respectively. Over the previous week the market value of the iM-Best2 MC-Score ETF System gained 0.30% at a time when SPY gained 1.03%. A starting capital of $100,000 at inception on 6/30/2016 would have grown to $143,096 which includes $68 cash and excludes $4,292 spent on fees and slippage. |
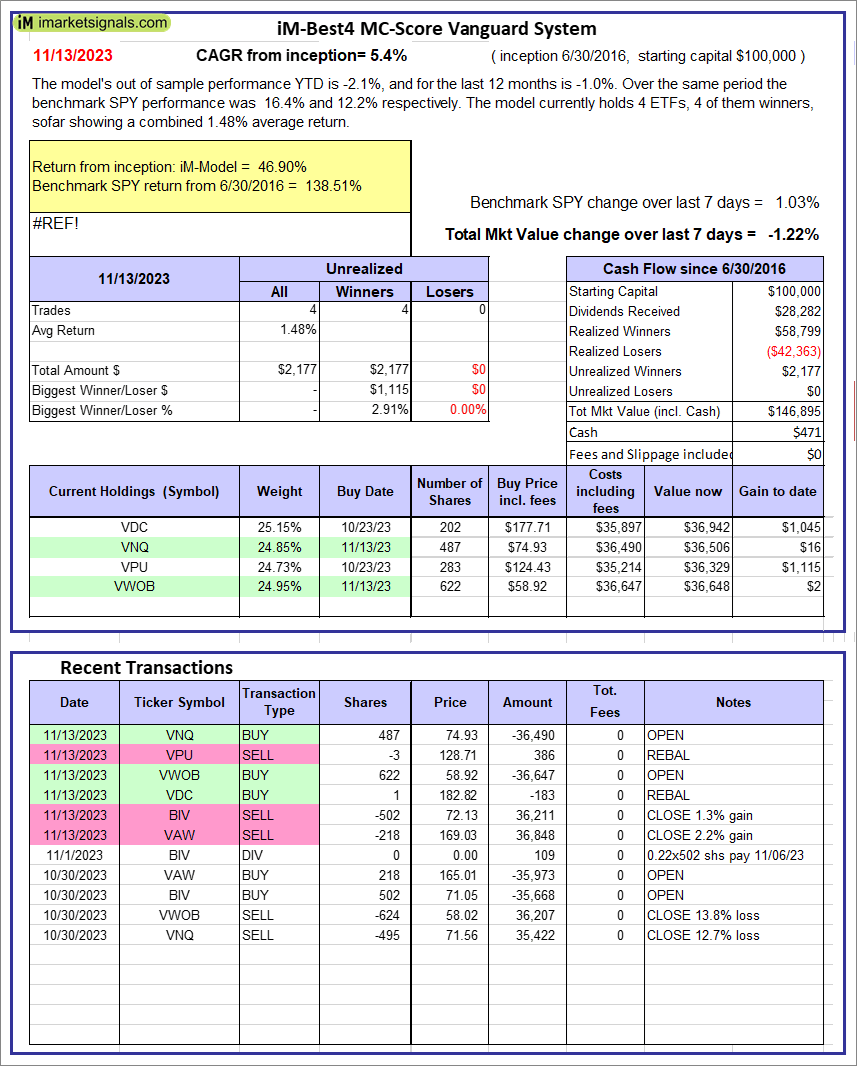 |
iM-Best4 MC-Score Vanguard System: The model’s out of sample performance YTD is -2.1%, and for the last 12 months is -1.0%. Over the same period the benchmark SPY performance was 16.4% and 12.2% respectively. Over the previous week the market value of the iM-Best4 MC-Score Vanguard System gained -1.22% at a time when SPY gained 1.03%. A starting capital of $100,000 at inception on 6/30/2016 would have grown to $146,895 which includes $471 cash and excludes $00 spent on fees and slippage. |
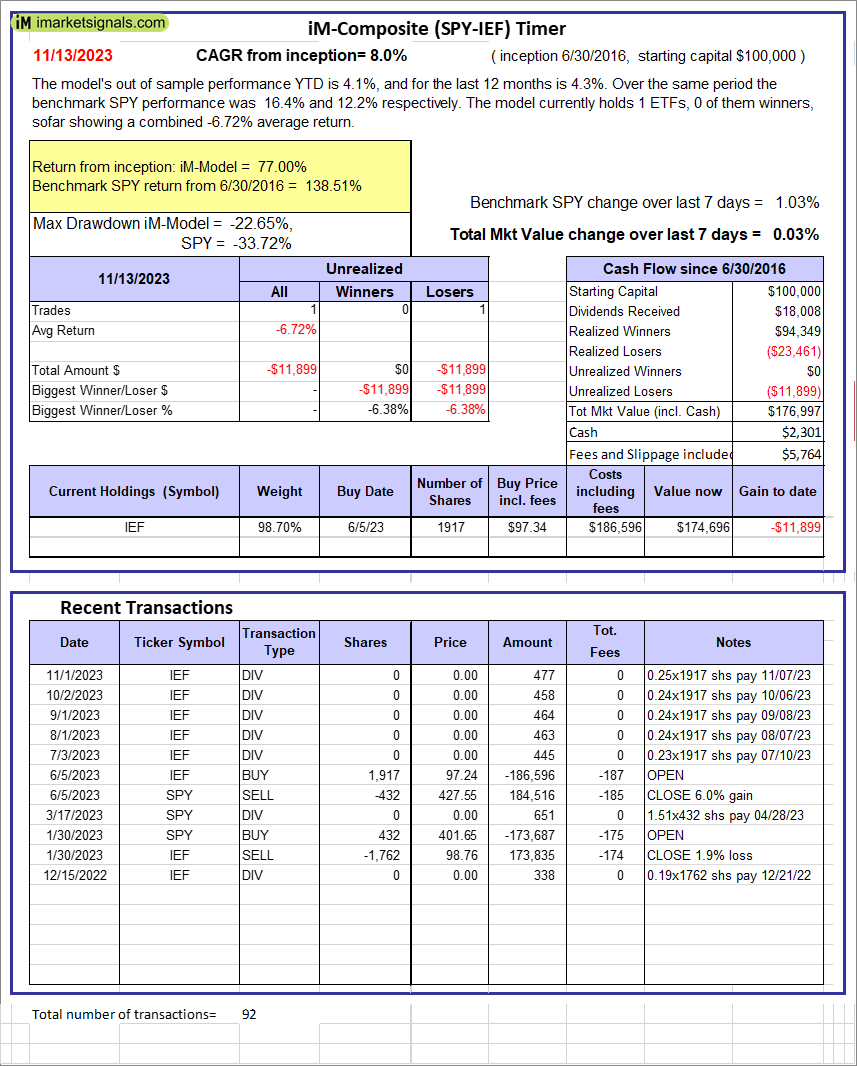 |
iM-Composite (SPY-IEF) Timer: The model’s out of sample performance YTD is 4.1%, and for the last 12 months is 4.3%. Over the same period the benchmark SPY performance was 16.4% and 12.2% respectively. Over the previous week the market value of the iM-Composite (SPY-IEF) Timer gained 0.03% at a time when SPY gained 1.03%. A starting capital of $100,000 at inception on 6/30/2016 would have grown to $176,997 which includes $2,301 cash and excludes $5,764 spent on fees and slippage. |
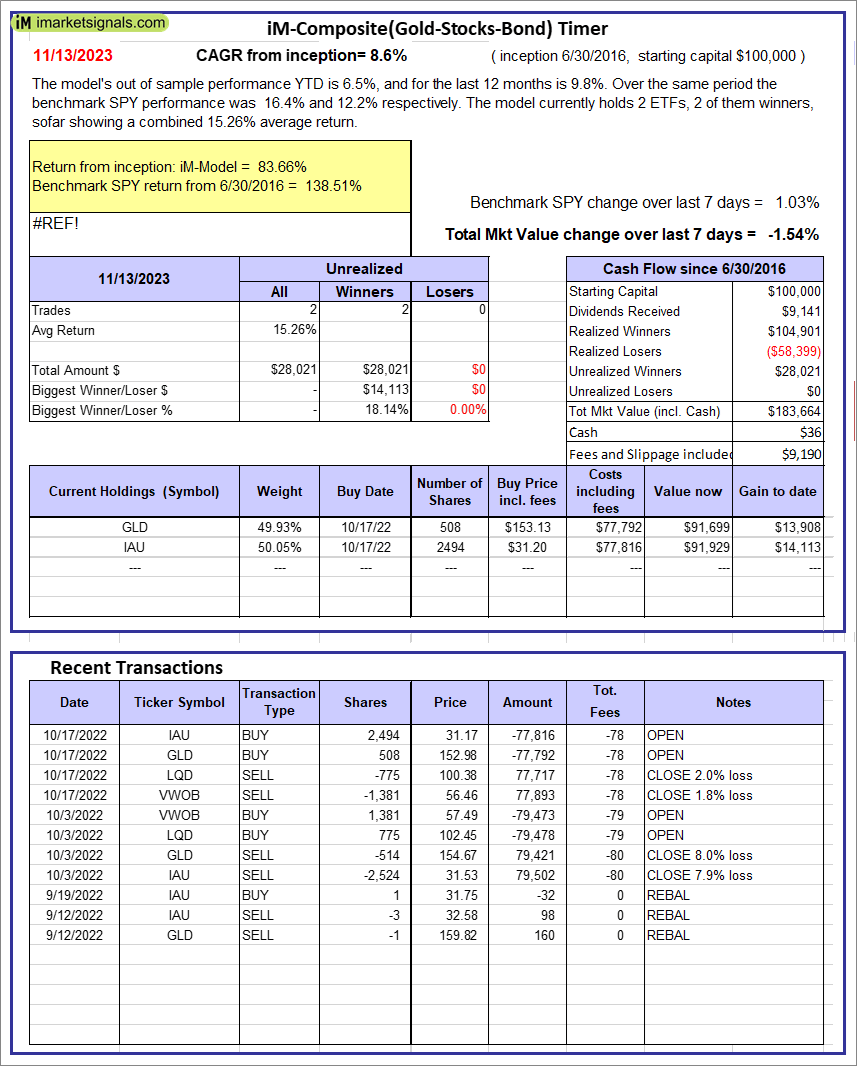 |
iM-Composite(Gold-Stocks-Bond) Timer: The model’s out of sample performance YTD is 6.5%, and for the last 12 months is 9.8%. Over the same period the benchmark SPY performance was 16.4% and 12.2% respectively. Over the previous week the market value of the iM-Composite(Gold-Stocks-Bond) Timer gained -1.54% at a time when SPY gained 1.03%. A starting capital of $100,000 at inception on 6/30/2016 would have grown to $183,664 which includes $36 cash and excludes $9,190 spent on fees and slippage. |
iM-Best Reports – 11/13/2023
Posted in pmp SPY-SH
Leave a Reply
You must be logged in to post a comment.