
  |
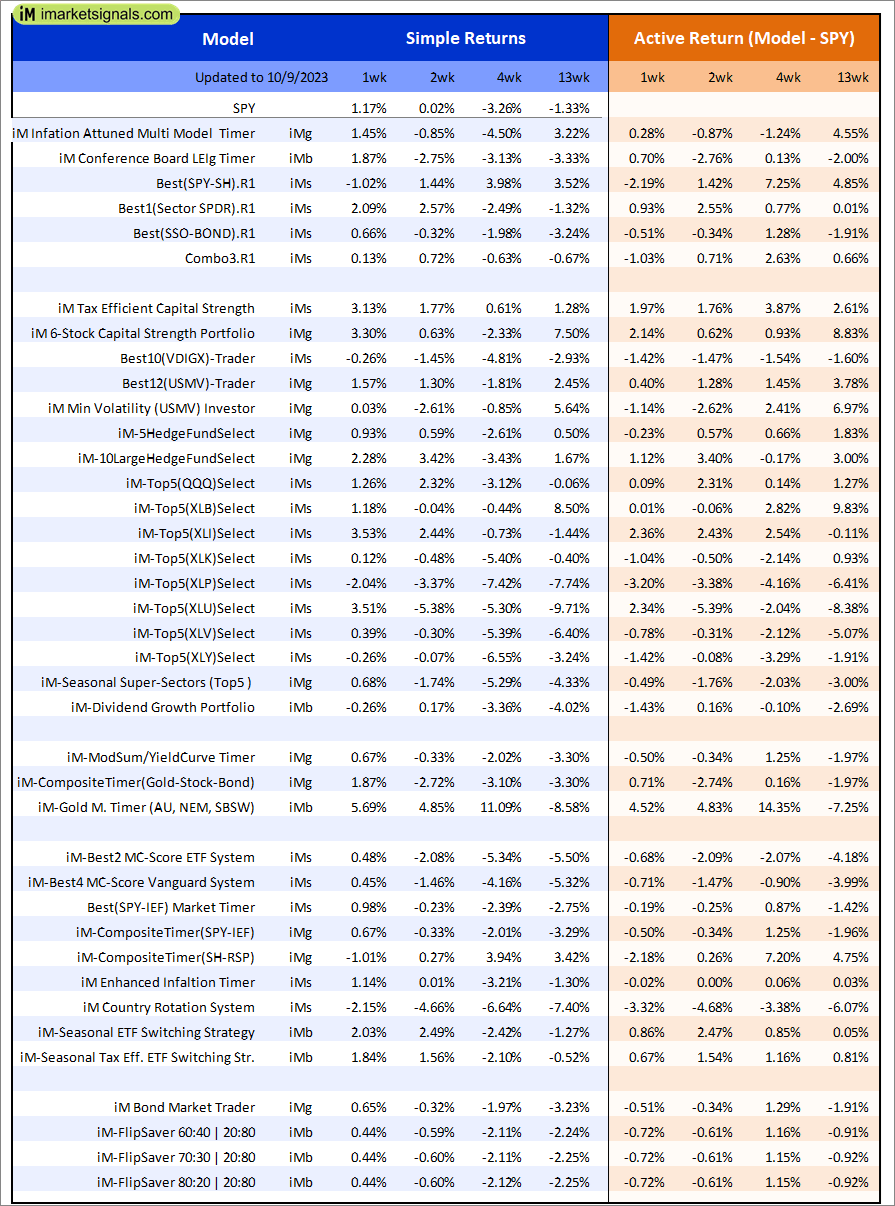
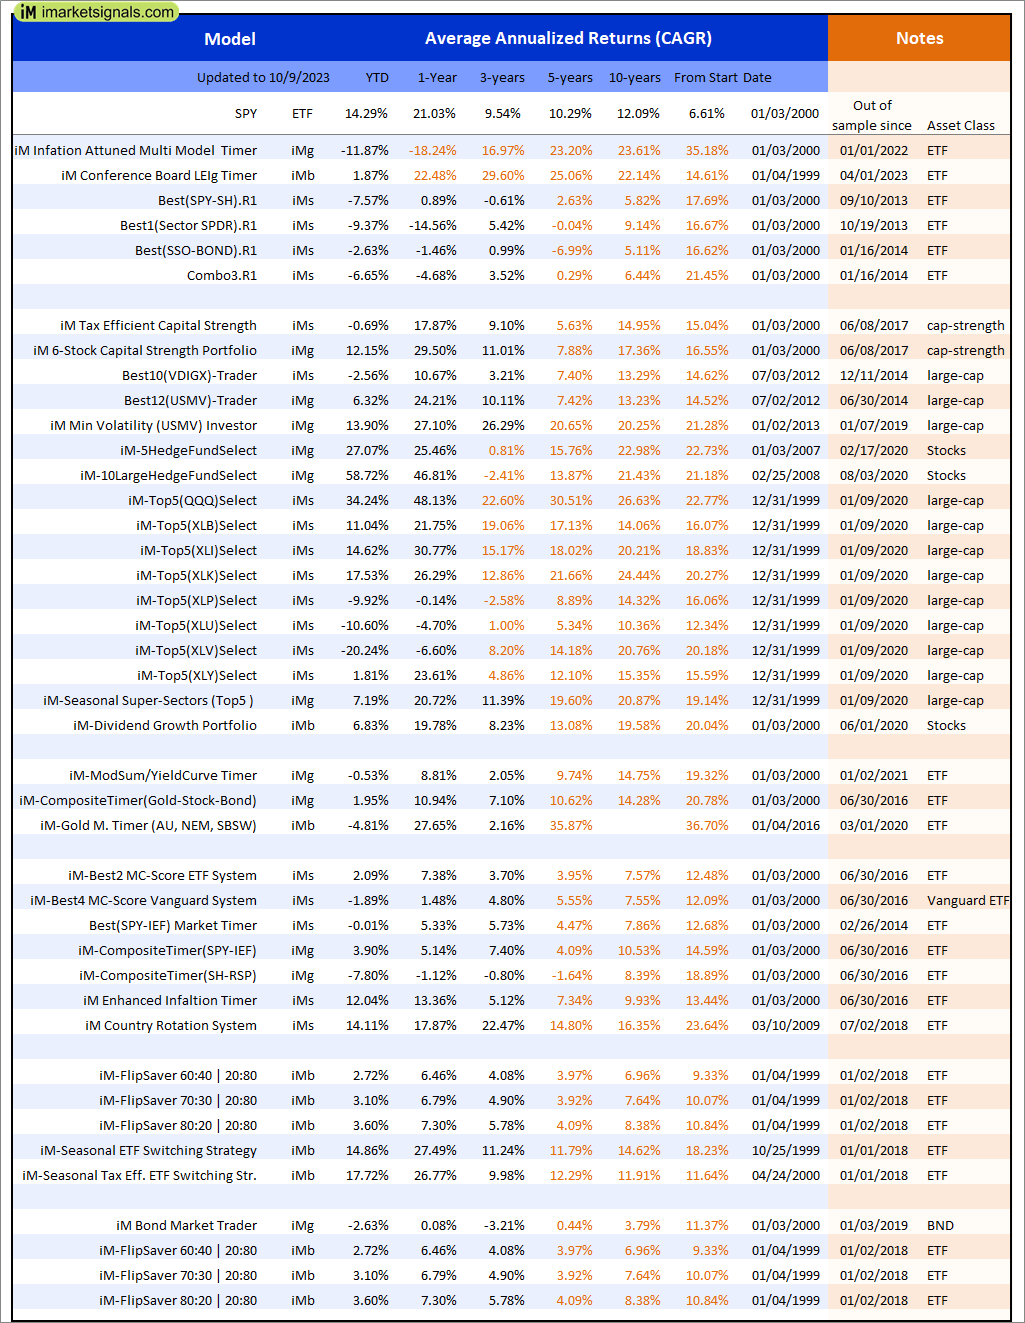
Out of sample performance summary of our models for the past 1, 2, 4 and 13 week periods. The active active return indicates how the models over- or underperformed the benchmark ETF SPY. Also the YTD, and the 1-, 3-, 5- and 10-year annualized returns are shown in the second table |
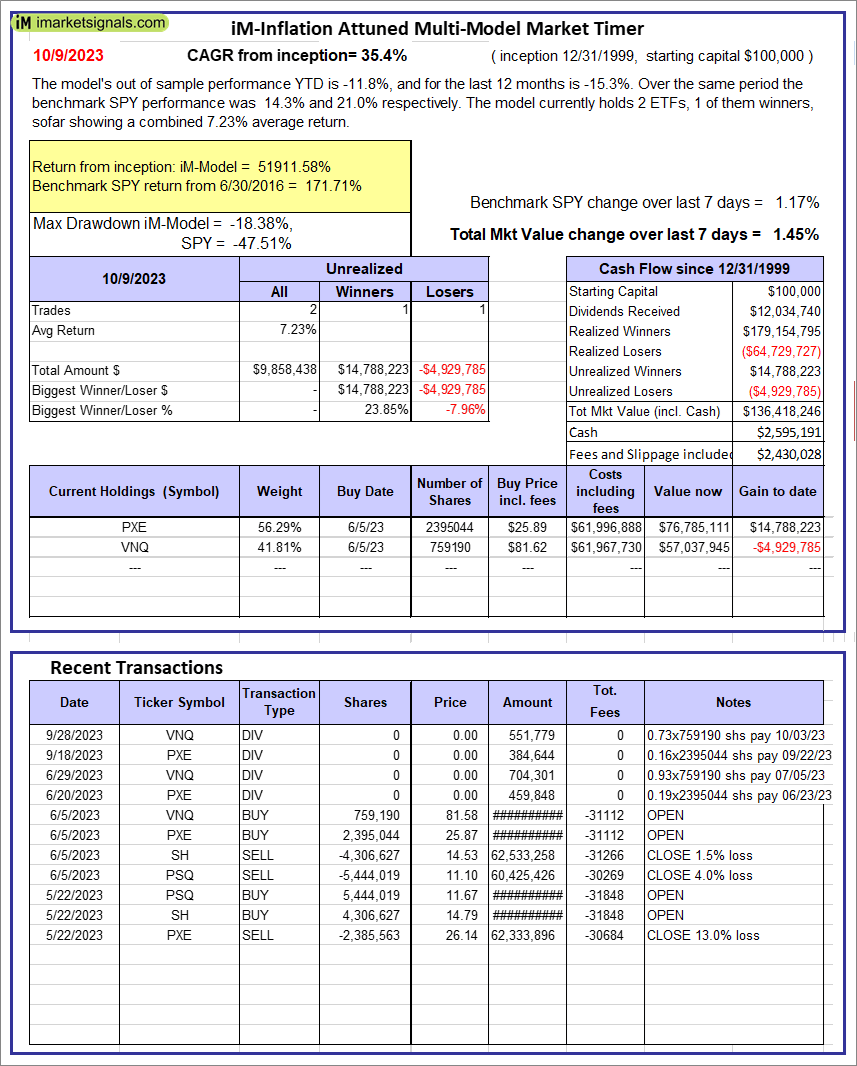 |
iM-Inflation Attuned Multi-Model Market Timer: The model’s out of sample performance YTD is -11.8%, and for the last 12 months is -15.3%. Over the same period the benchmark SPY performance was 14.3% and 21.0% respectively. Over the previous week the market value of the iM-Inflation Attuned Multi-Model Market Timer gained 1.45% at a time when SPY gained 1.17%. A starting capital of $100,000 at inception on 3/24/2017 would have grown to $136,418,246 which includes $2,595,191 cash and excludes $2,430,028 spent on fees and slippage. |
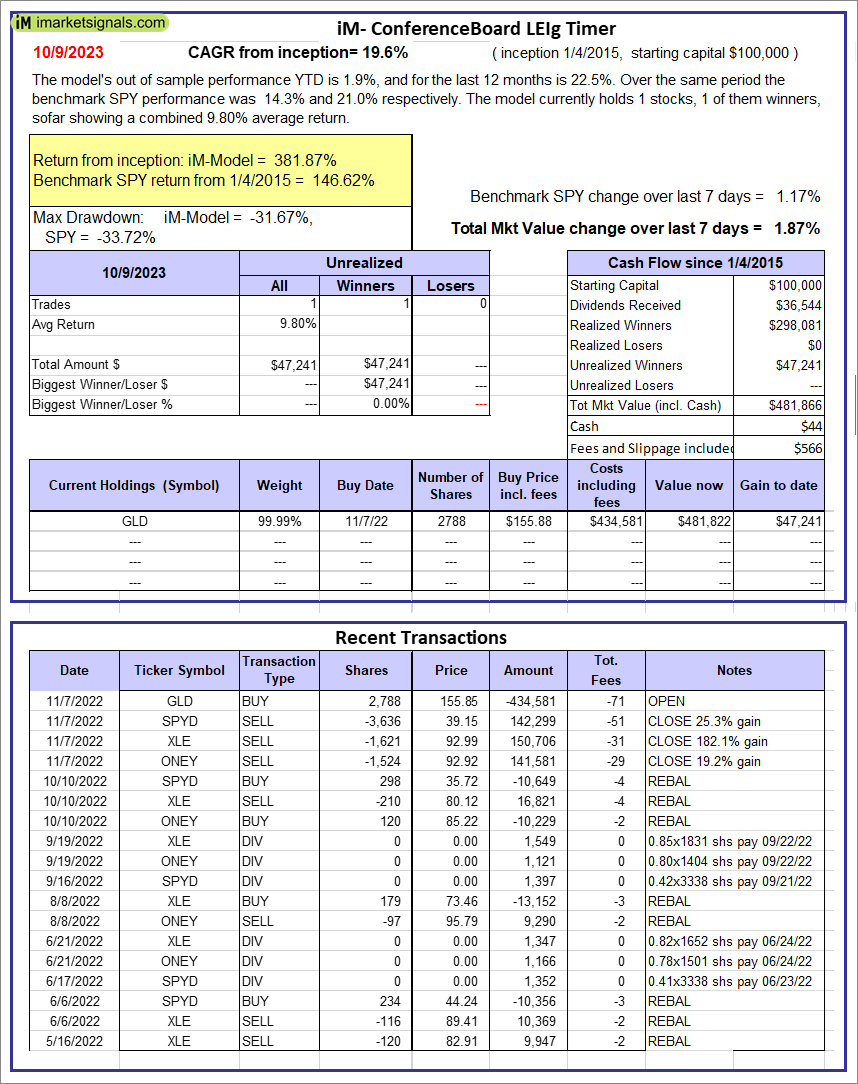 |
iM-Conference Board LEIg Timer: The model’s performance YTD is 14.3%, and for the last 12 months is 7.3%. Over the same period the benchmark SPY performance was 20.1% and 9.4% respectively. Over the previous week the market value of the iM-Conference Board LEIg Timer gained 1.87% at a time when SPY gained 1.17%. A starting capital of $100,000 at inception on 4/5/2017 would have grown to $481,866 which includes $44 cash and excludes $566 spent on fees and slippage. |
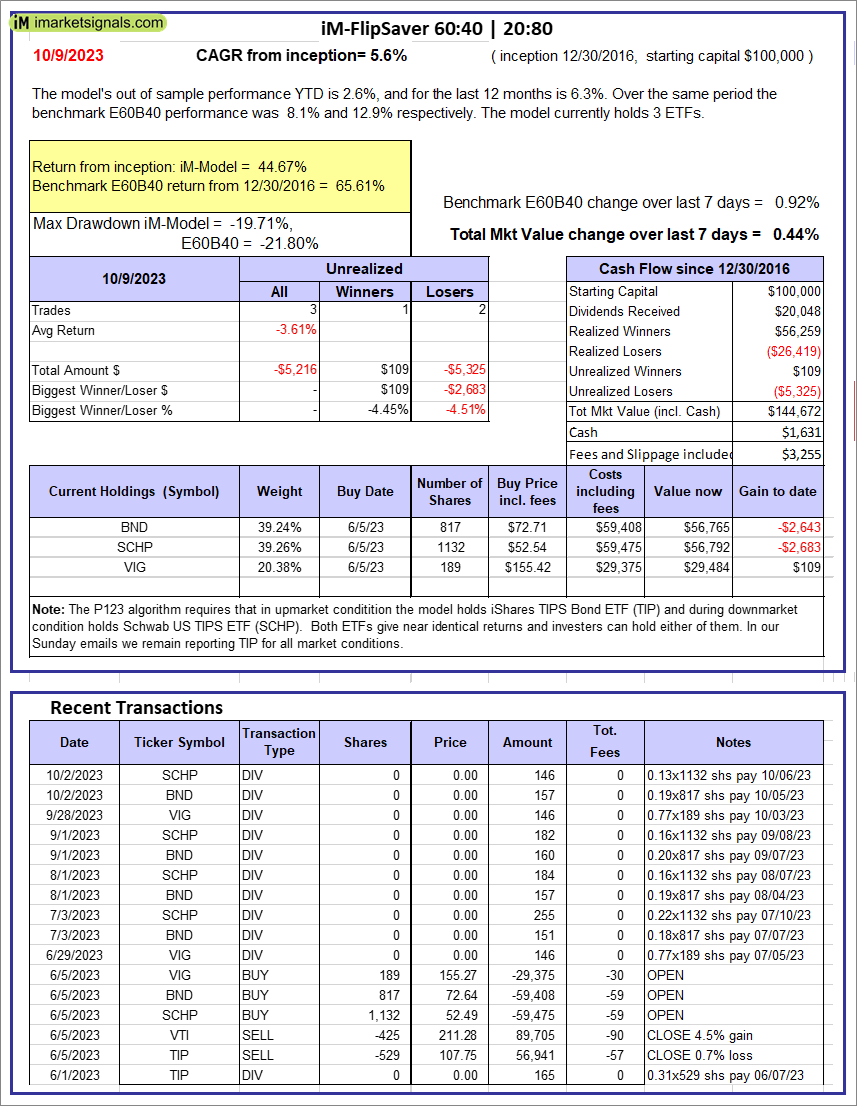 |
iM-FlipSaver 60:40 | 20:80 – 2017: The model’s out of sample performance YTD is 2.6%, and for the last 12 months is 6.3%. Over the same period the benchmark E60B40 performance was 8.1% and 12.9% respectively. Over the previous week the market value of iM-FlipSaver 80:20 | 20:80 gained 0.44% at a time when SPY gained 0.92%. A starting capital of $100,000 at inception on 7/16/2015 would have grown to $144,672 which includes $1,631 cash and excludes $3,255 spent on fees and slippage. |
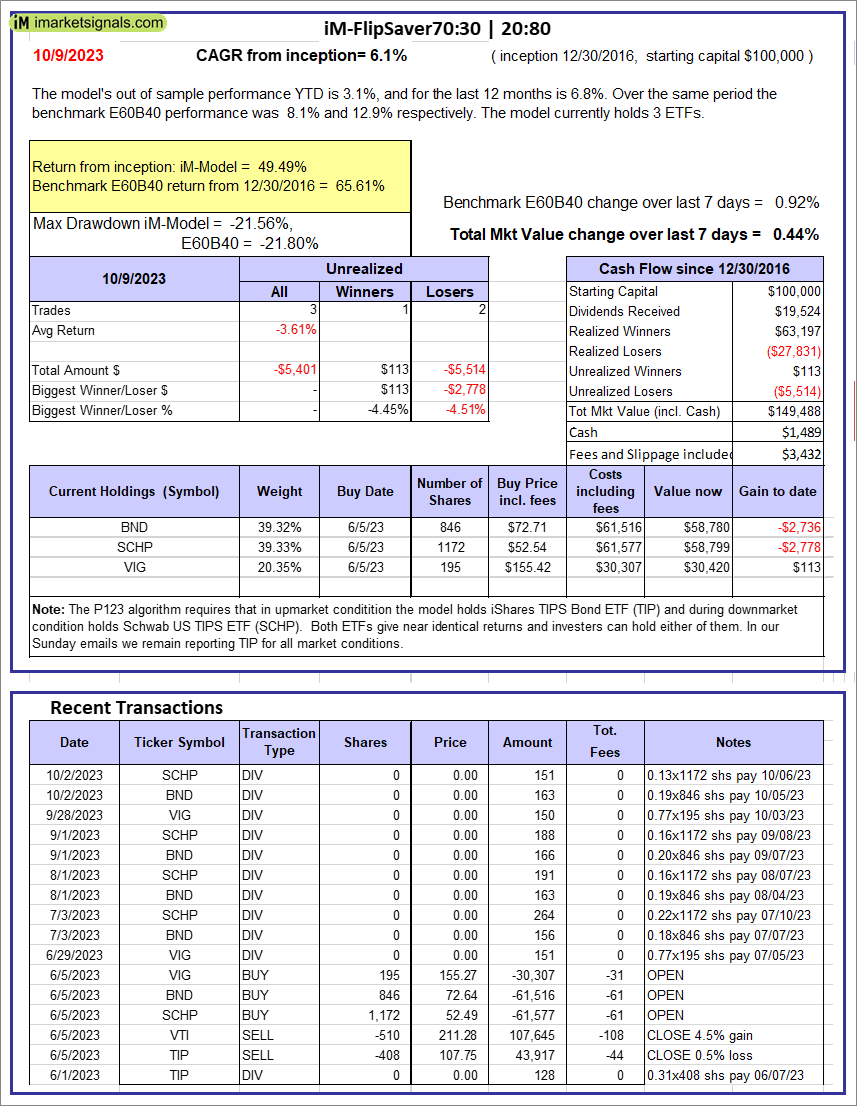 |
iM-FlipSaver 70:30 | 20:80 – 2017: The model’s out of sample performance YTD is 3.1%, and for the last 12 months is 6.8%. Over the same period the benchmark E60B40 performance was 8.1% and 12.9% respectively. Over the previous week the market value of iM-FlipSaver 70:30 | 20:80 gained 0.44% at a time when SPY gained 0.92%. A starting capital of $100,000 at inception on 7/15/2015 would have grown to $149,488 which includes $1,489 cash and excludes $3,432 spent on fees and slippage. |
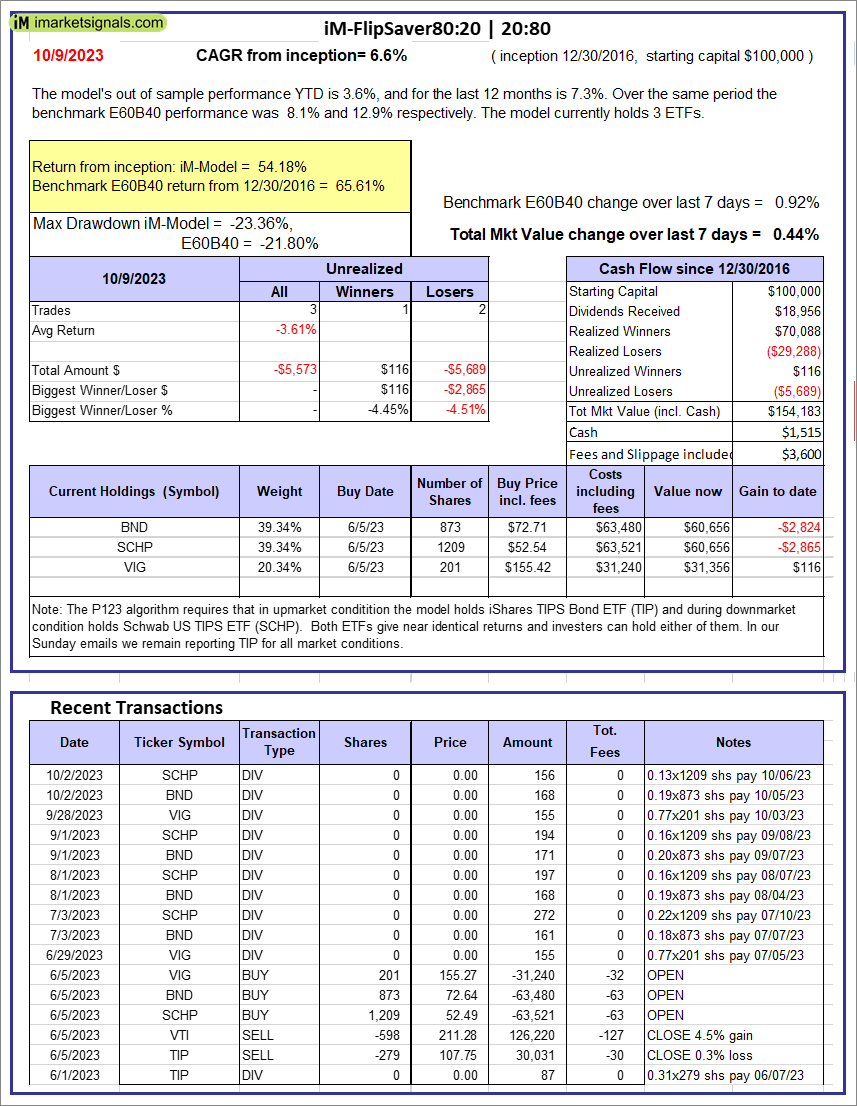 |
iM-FlipSaver 80:20 | 20:80 – 2017: The model’s out of sample performance YTD is 3.6%, and for the last 12 months is 7.3%. Over the same period the benchmark E60B40 performance was 8.1% and 12.9% respectively. Over the previous week the market value of iM-FlipSaver 80:20 | 20:80 gained 0.44% at a time when SPY gained 0.92%. A starting capital of $100,000 at inception on 1/2/2017 would have grown to $154,183 which includes $1,515 cash and excludes $3,600 spent on fees and slippage. |
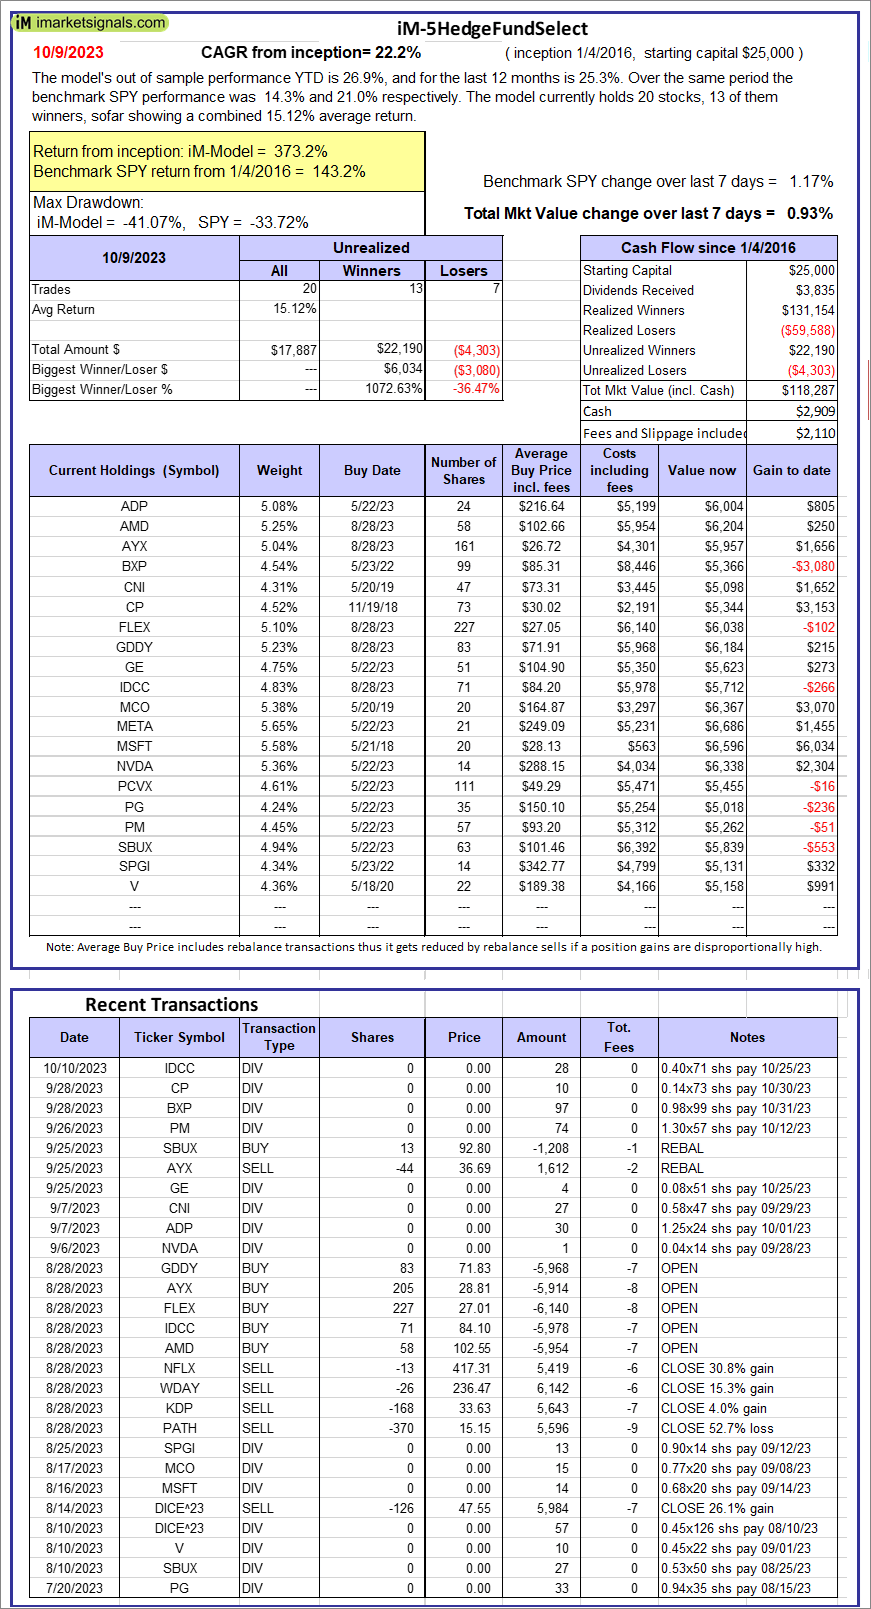 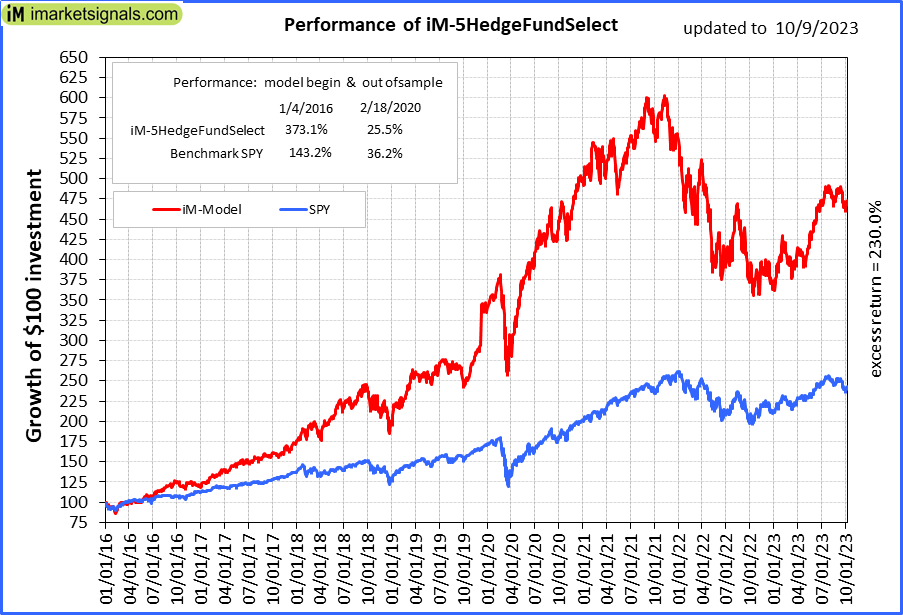 |
iM-5HedgeFundSelect: Since inception, on 1/5/2016, the model gained 373.15% while the benchmark SPY gained 143.17% over the same period. Over the previous week the market value of iM-5HedgeFundSelect gained 0.93% at a time when SPY gained 1.17%. A starting capital of $25,000 at inception on 1/5/2016 would have grown to $118,287 which includes $2,909 cash and excludes $2,110 spent on fees and slippage. |
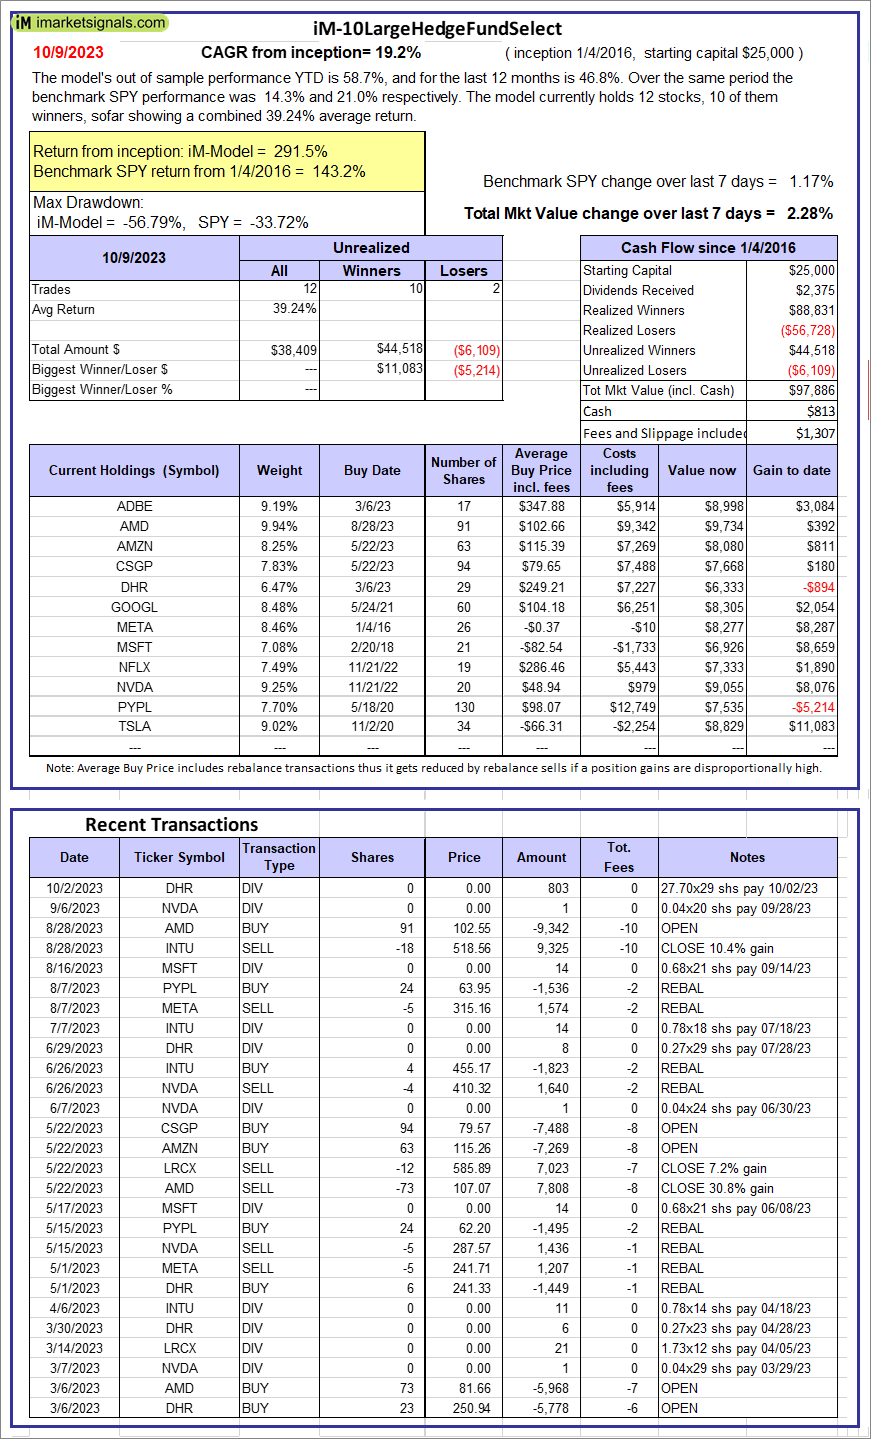 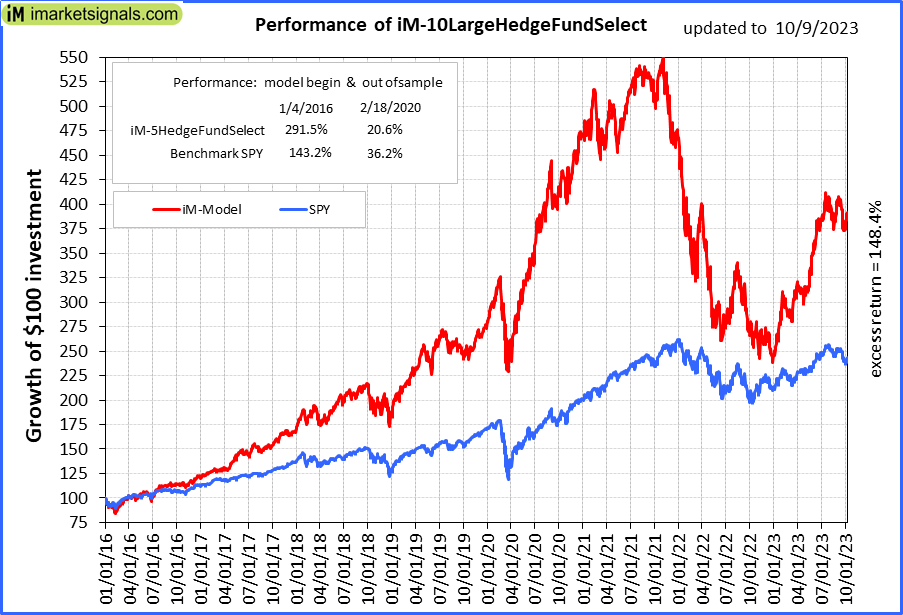 |
iM-10LargeHedgeFundSelect: Since inception, on 1/5/2016, the model gained 291.54% while the benchmark SPY gained 143.17% over the same period. Over the previous week the market value of iM-10LargeHedgeFundSelect gained 2.28% at a time when SPY gained 1.17%. A starting capital of $25,000 at inception on 1/5/2016 would have grown to $97,886 which includes $813 cash and excludes $1,307 spent on fees and slippage. |
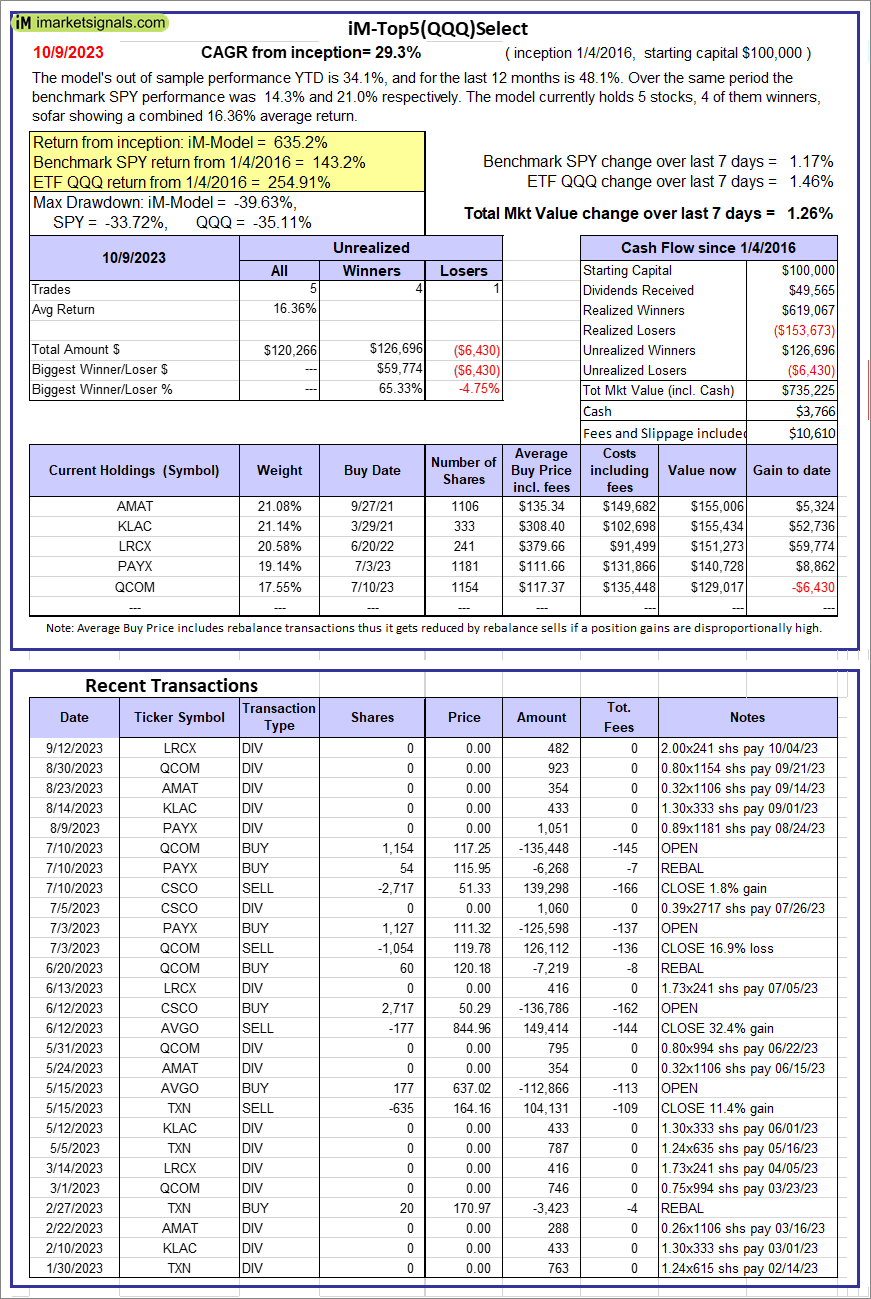 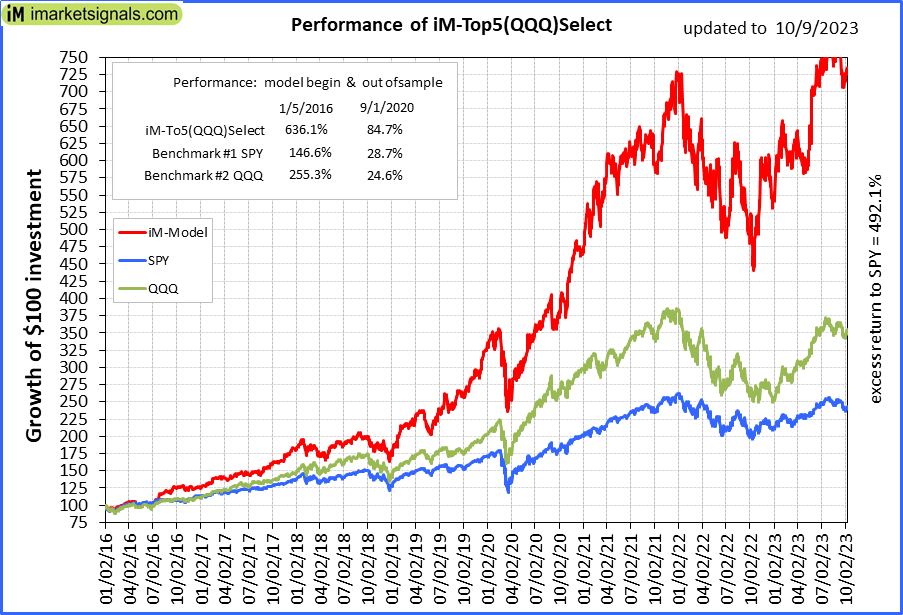 |
iM-Top5(QQQ)Select: Since inception, on 1/5/2016, the model gained 635.22% while the benchmark SPY gained 143.17% over the same period. Over the previous week the market value of iM-Top5(QQQ)Select gained 1.26% at a time when SPY gained 1.17%. A starting capital of $100,000 at inception on 1/5/2016 would have grown to $735,225 which includes $3,766 cash and excludes $10,610 spent on fees and slippage. |
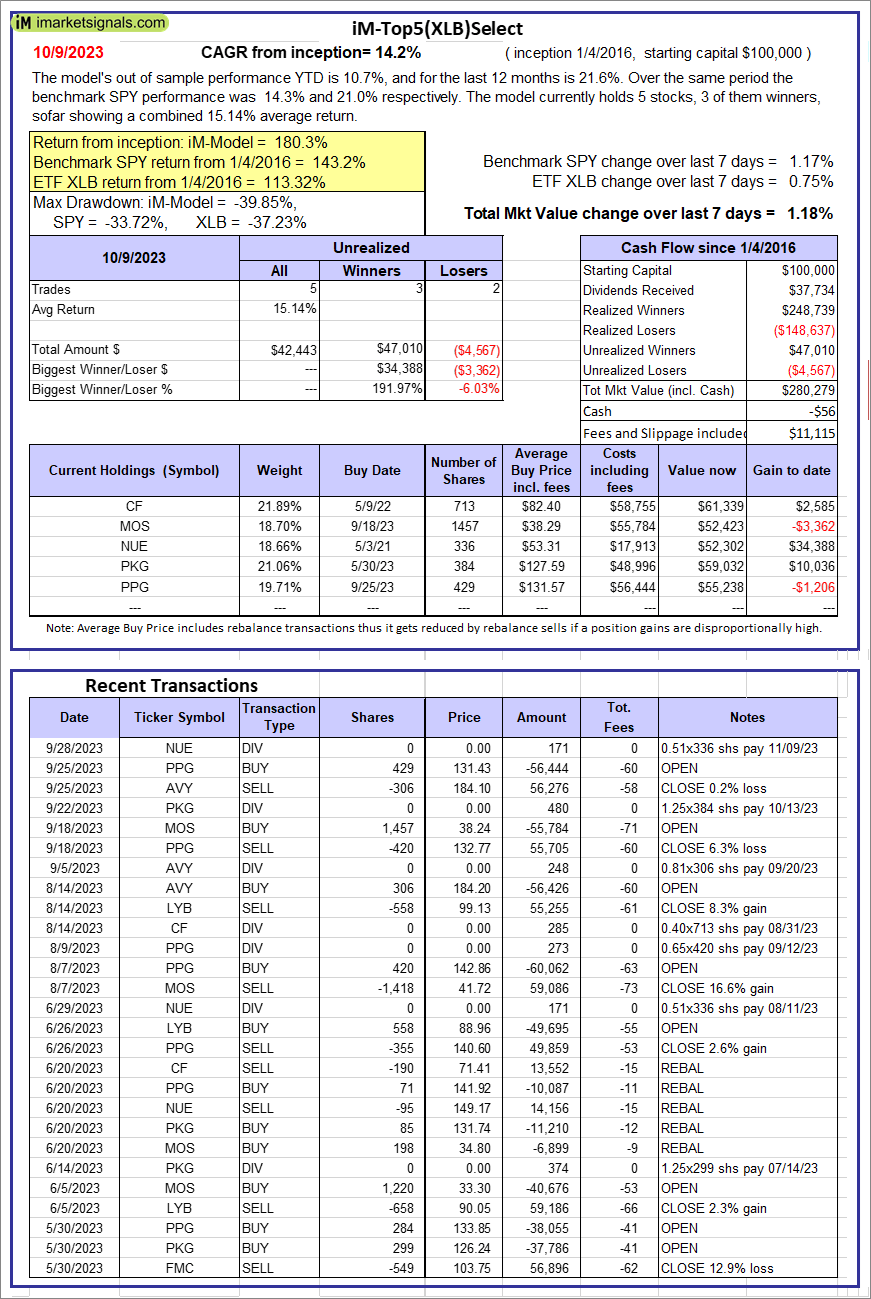 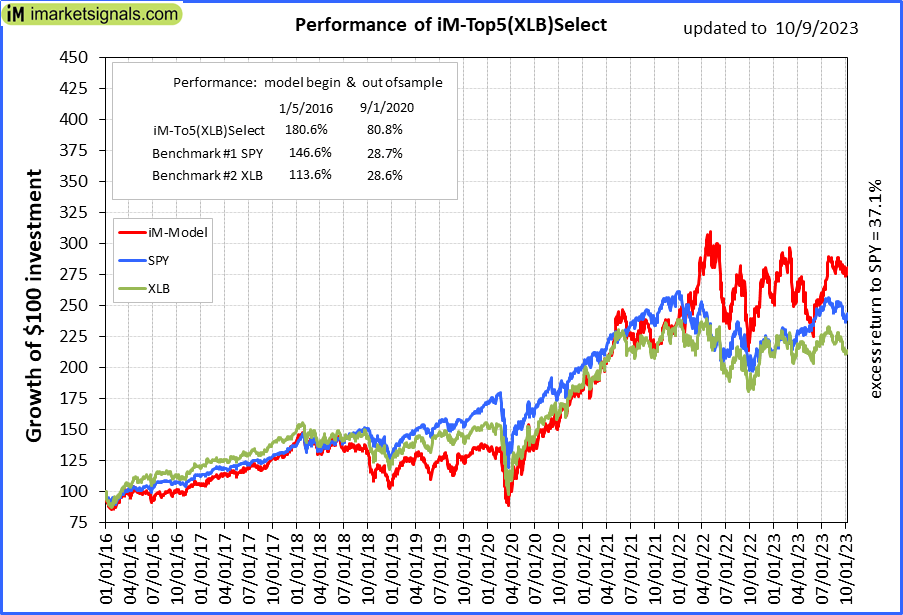 |
iM-Top5(XLB)Select: Since inception, on 1/5/2016, the model gained 180.28% while the benchmark SPY gained 143.17% over the same period. Over the previous week the market value of iM-Top5(XLB)Select gained 1.18% at a time when SPY gained 1.17%. A starting capital of $100,000 at inception on 1/5/2016 would have grown to $280,279 which includes -$56 cash and excludes $11,115 spent on fees and slippage. |
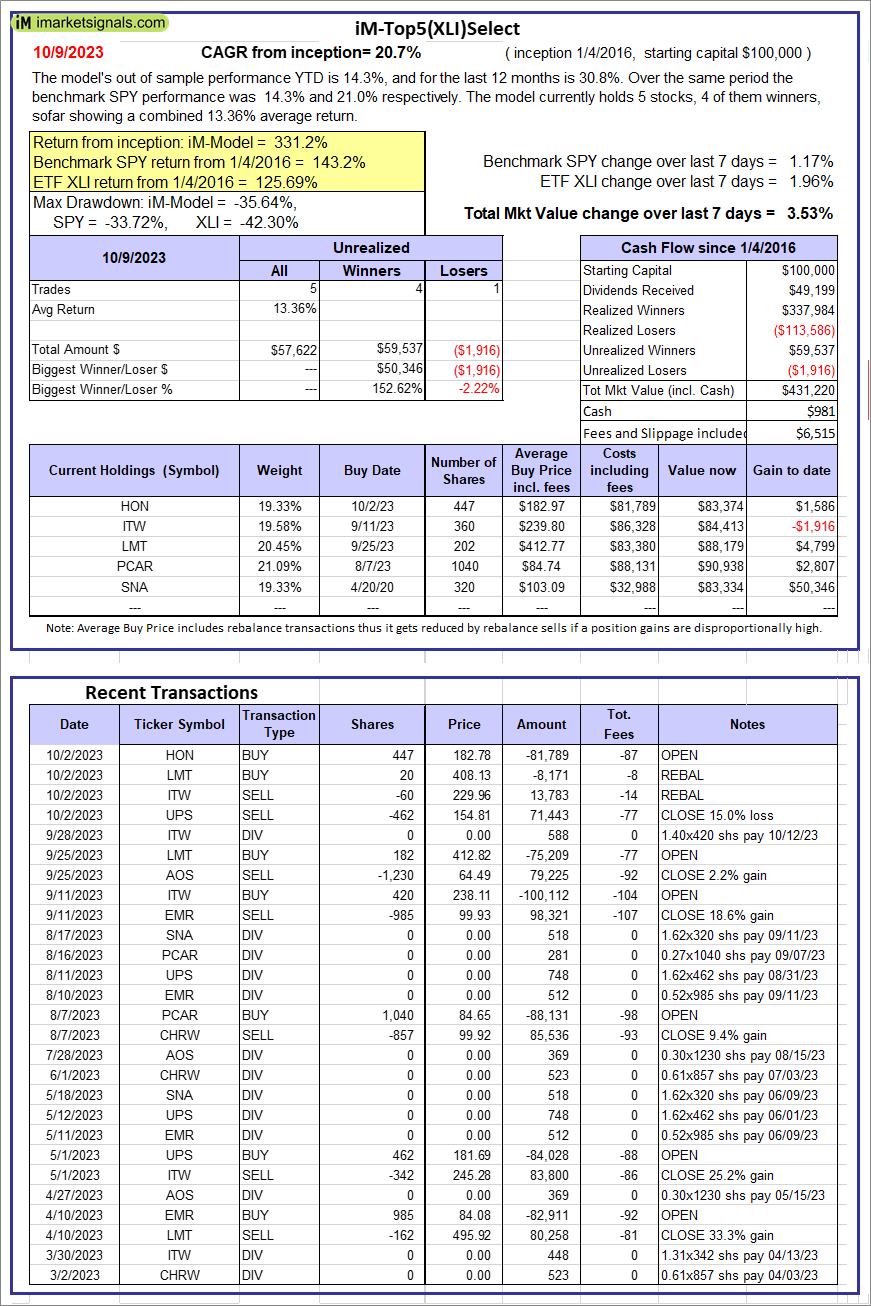 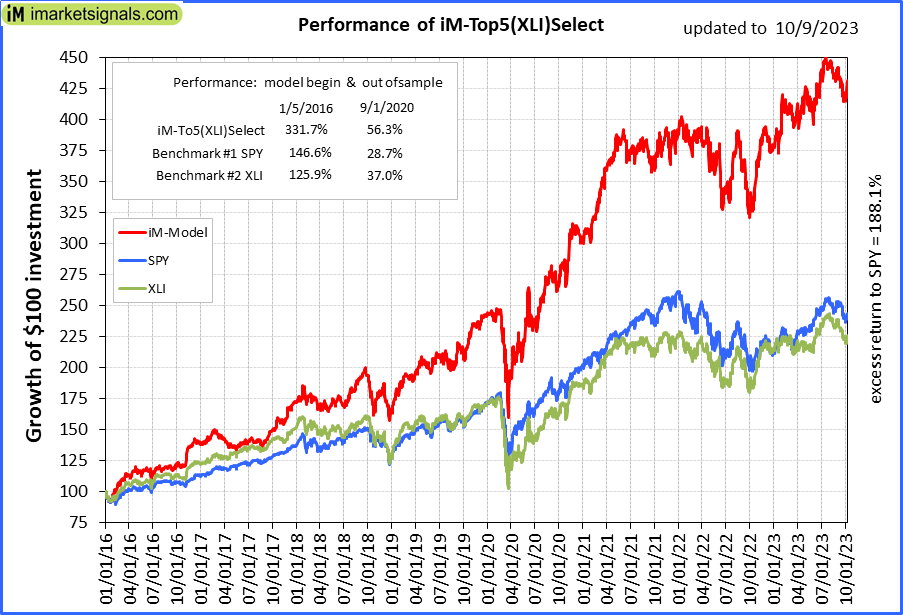 |
iM-Top5(XLI)Select: Since inception, on 1/5/2016, the model gained 331.22% while the benchmark SPY gained 143.17% over the same period. Over the previous week the market value of iM-Top5(XLI)Select gained 3.53% at a time when SPY gained 1.17%. A starting capital of $100,000 at inception on 1/5/2016 would have grown to $431,220 which includes $981 cash and excludes $6,515 spent on fees and slippage. |
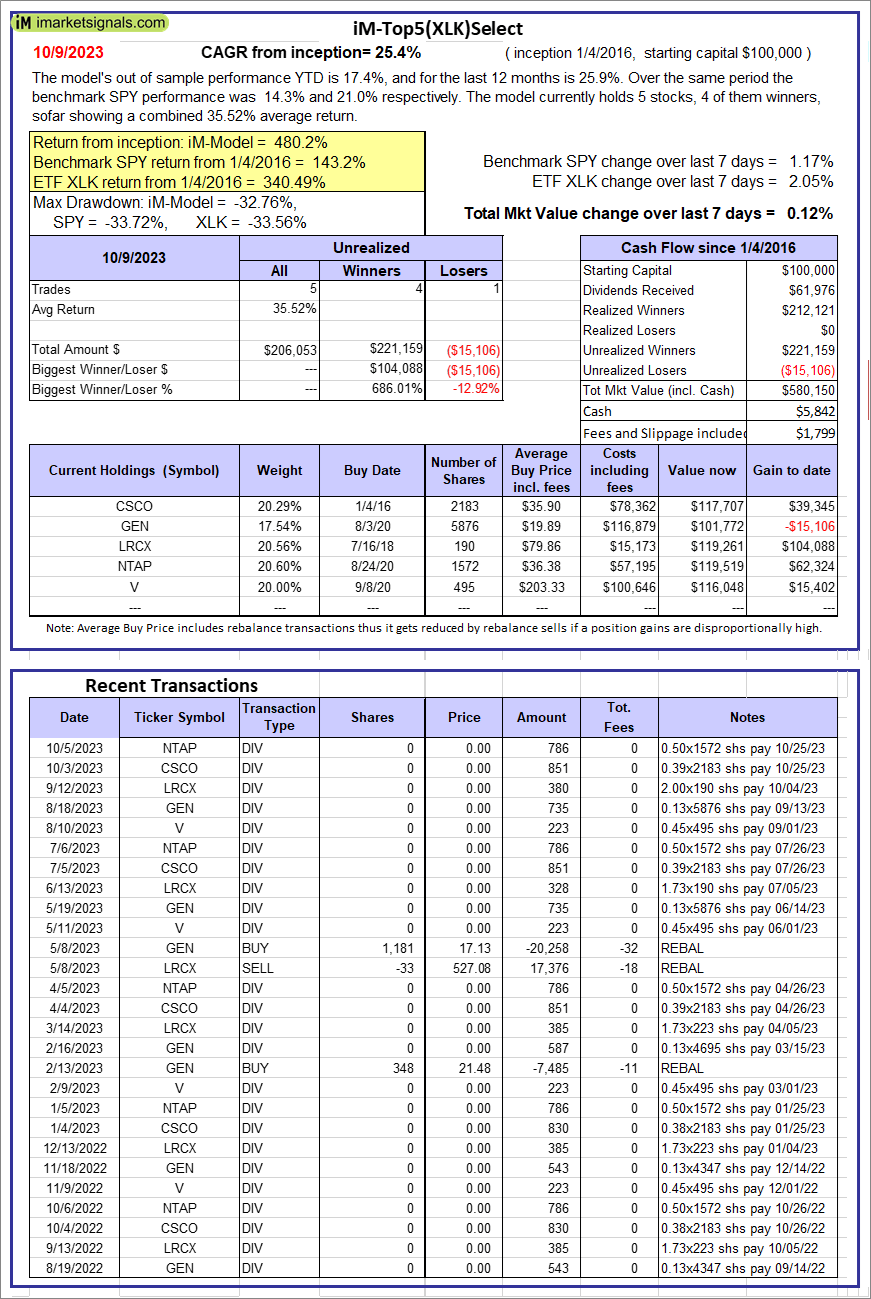 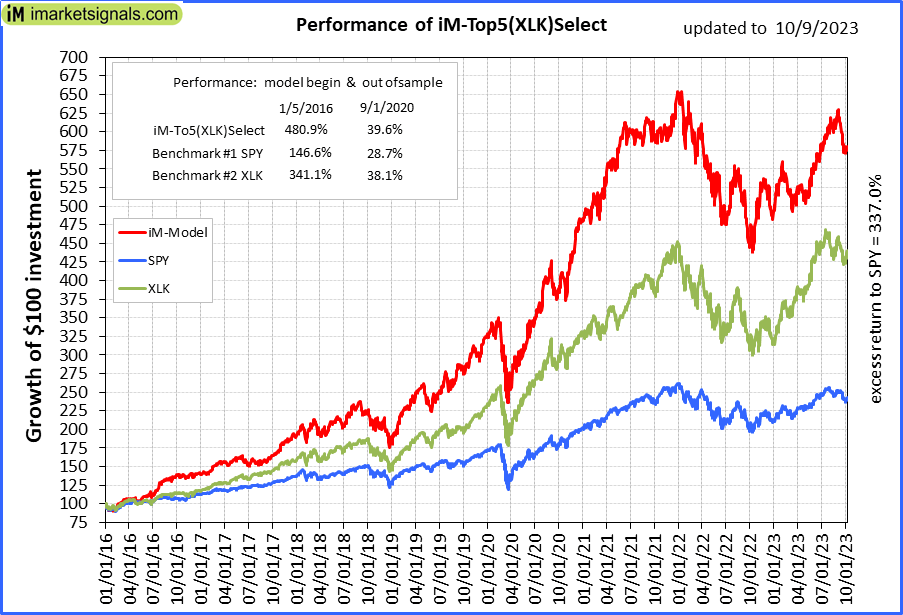 |
iM-Top5(XLK)Select: Since inception, on 1/5/2016, the model gained 480.15% while the benchmark SPY gained 143.17% over the same period. Over the previous week the market value of iM-Top5(XLK)Select gained 0.12% at a time when SPY gained 1.17%. A starting capital of $100,000 at inception on 1/5/2016 would have grown to $580,150 which includes $5,842 cash and excludes $1,799 spent on fees and slippage. |
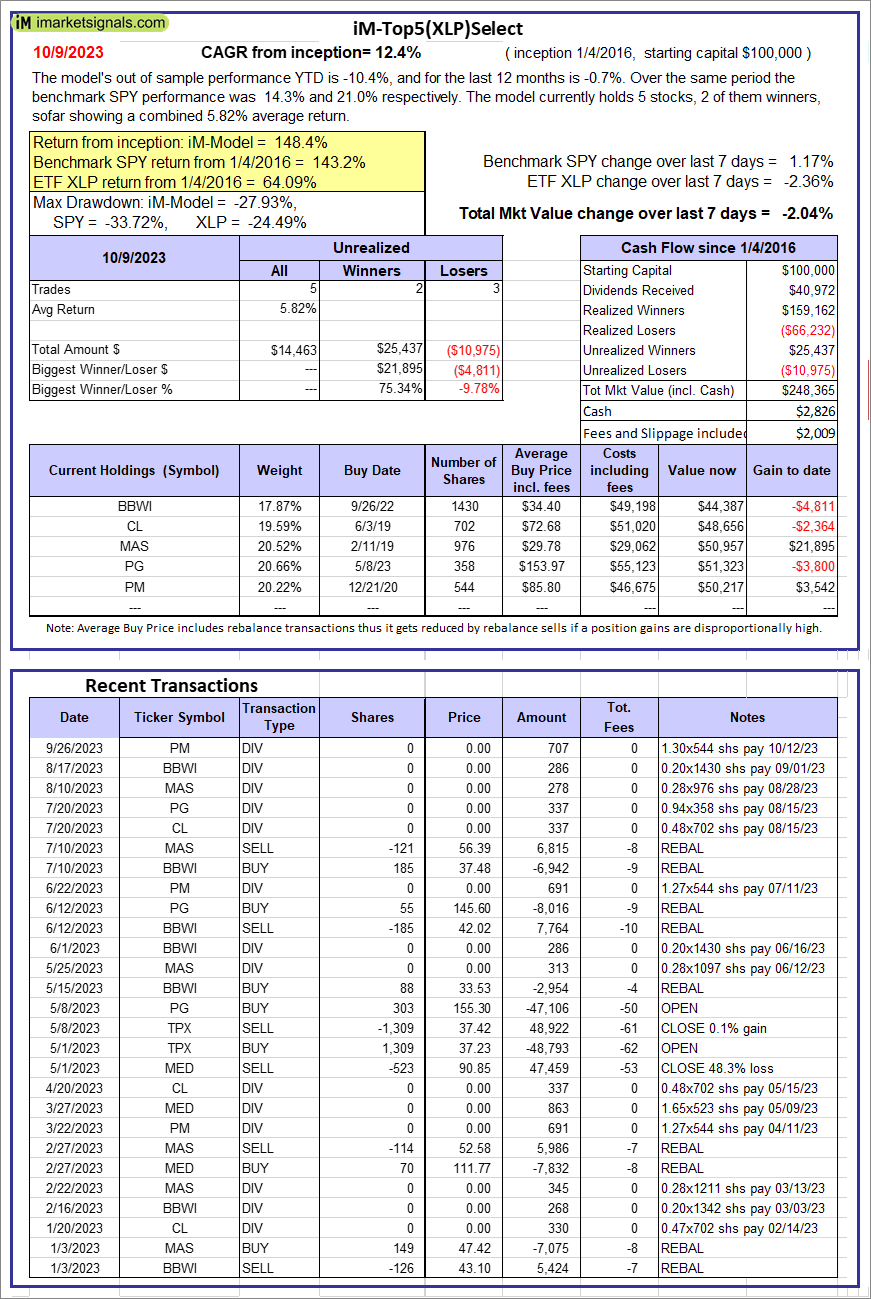 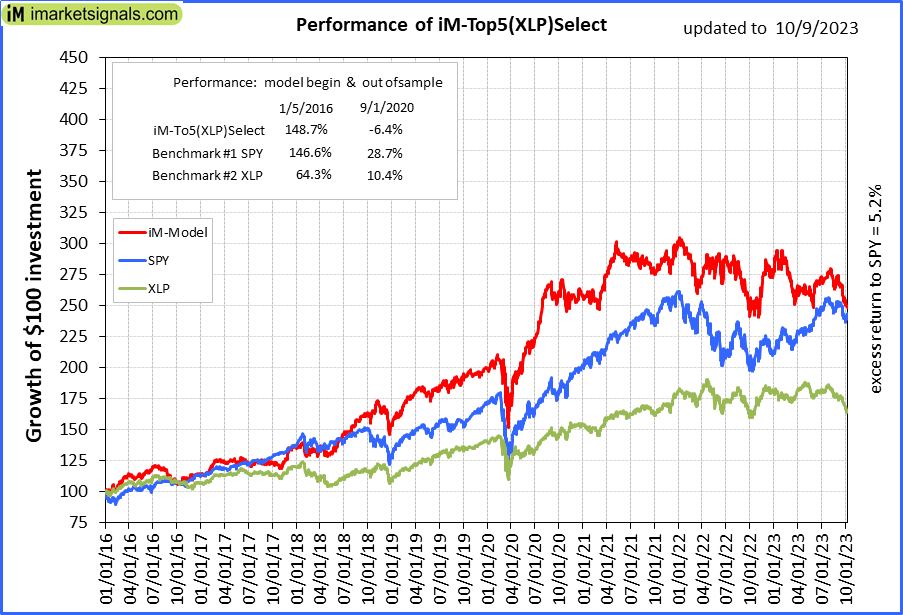 |
iM-Top5(XLP)Select: Since inception, on 1/5/2016, the model gained 148.37% while the benchmark SPY gained 143.17% over the same period. Over the previous week the market value of iM-Top5(XLP)Select gained -2.04% at a time when SPY gained 1.17%. A starting capital of $100,000 at inception on 1/5/2016 would have grown to $248,365 which includes $2,826 cash and excludes $2,009 spent on fees and slippage. |
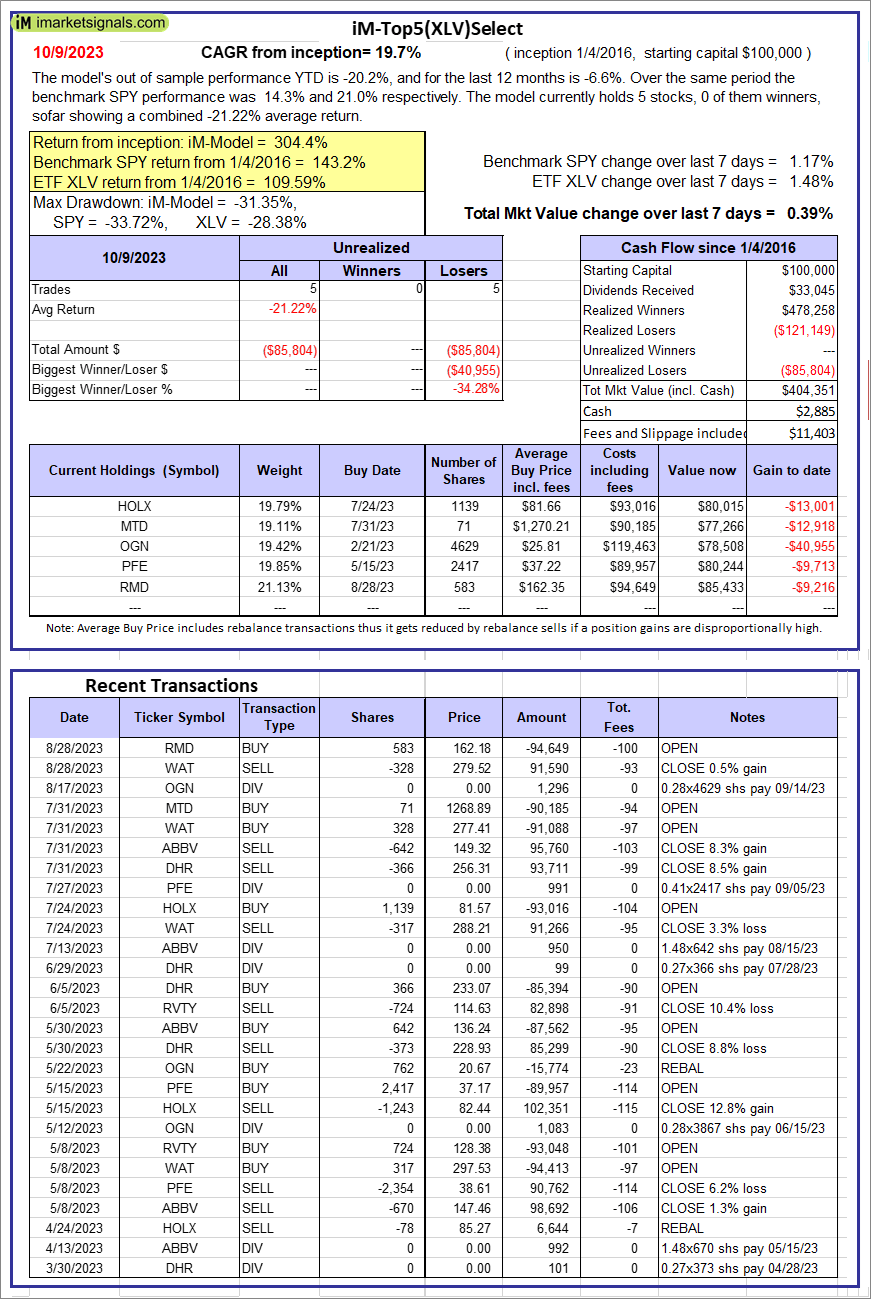 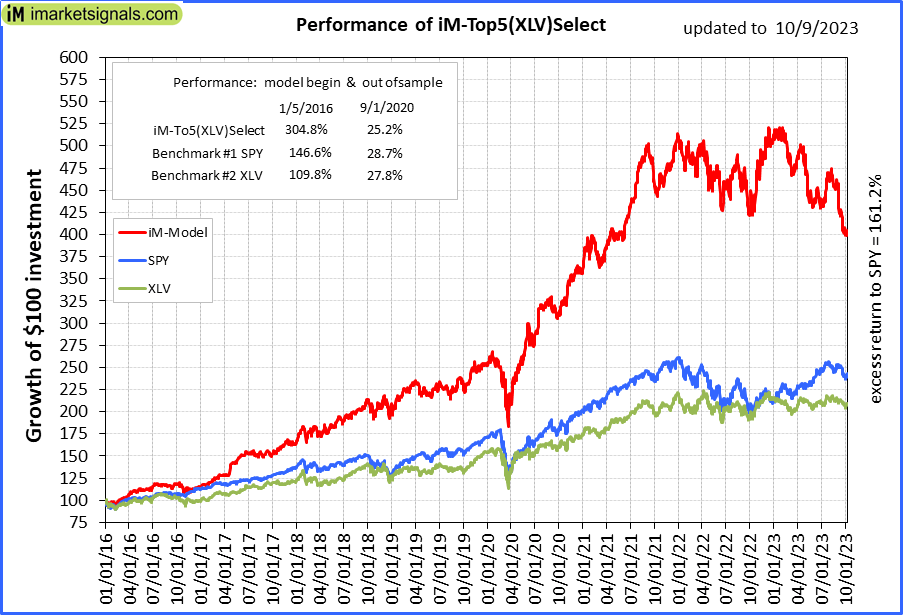 |
iM-Top5(XLV)Select: Since inception, on 1/5/2016, the model gained 304.35% while the benchmark SPY gained 143.17% over the same period. Over the previous week the market value of iM-Top5(XLV)Select gained 0.39% at a time when SPY gained 1.17%. A starting capital of $100,000 at inception on 1/5/2016 would have grown to $404,351 which includes $2,885 cash and excludes $11,403 spent on fees and slippage. |
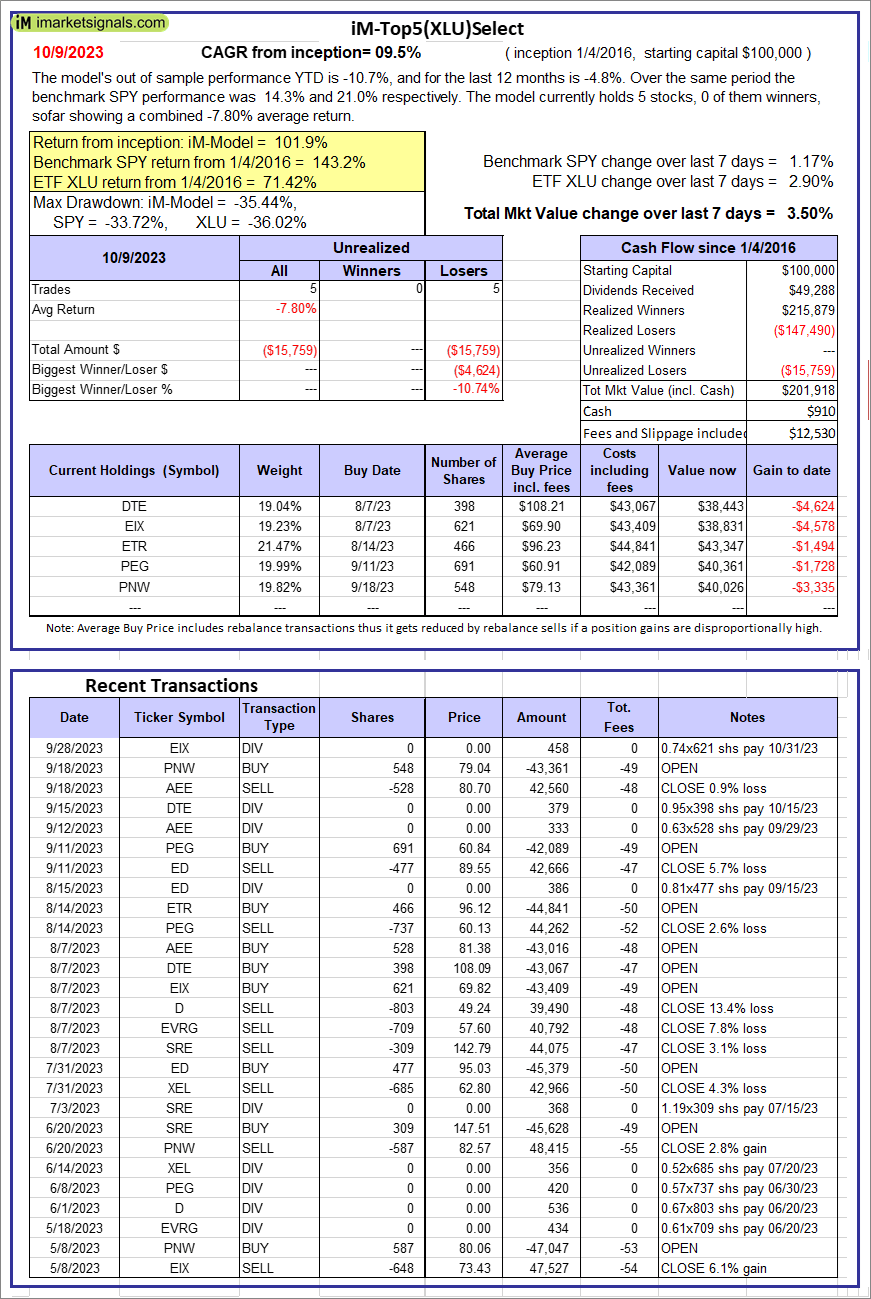 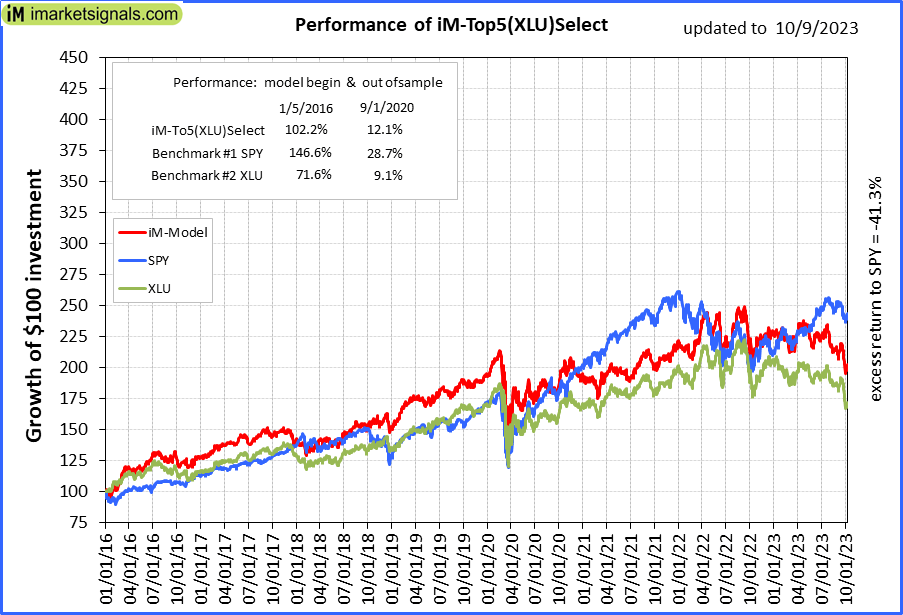 |
iM-Top5(XLU)Select: Since inception, on 1/5/2016, the model gained 101.92% while the benchmark SPY gained 143.17% over the same period. Over the previous week the market value of iM-Top5(XLU)Select gained 3.50% at a time when SPY gained 1.17%. A starting capital of $100,000 at inception on 1/5/2016 would have grown to $201,918 which includes $910 cash and excludes $12,530 spent on fees and slippage. |
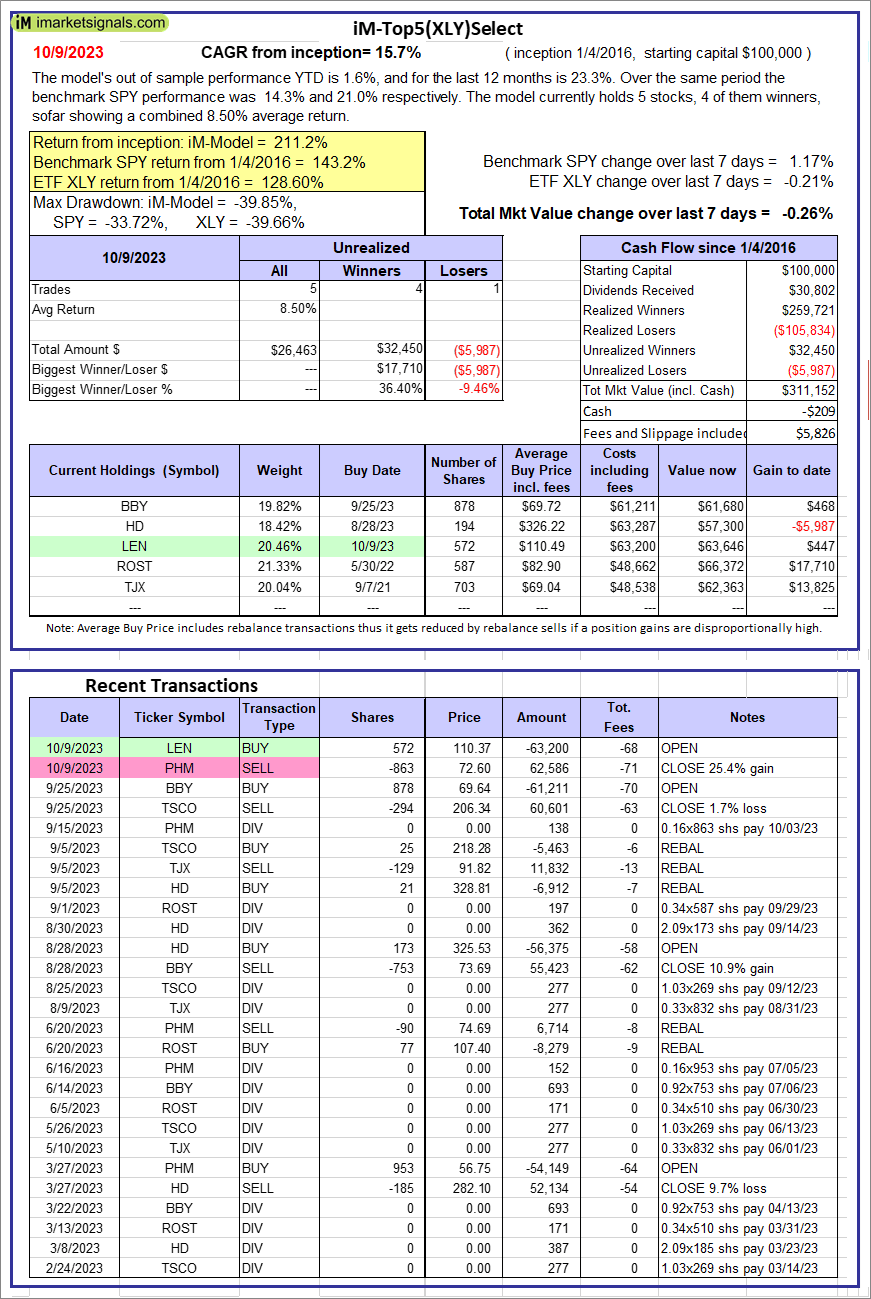 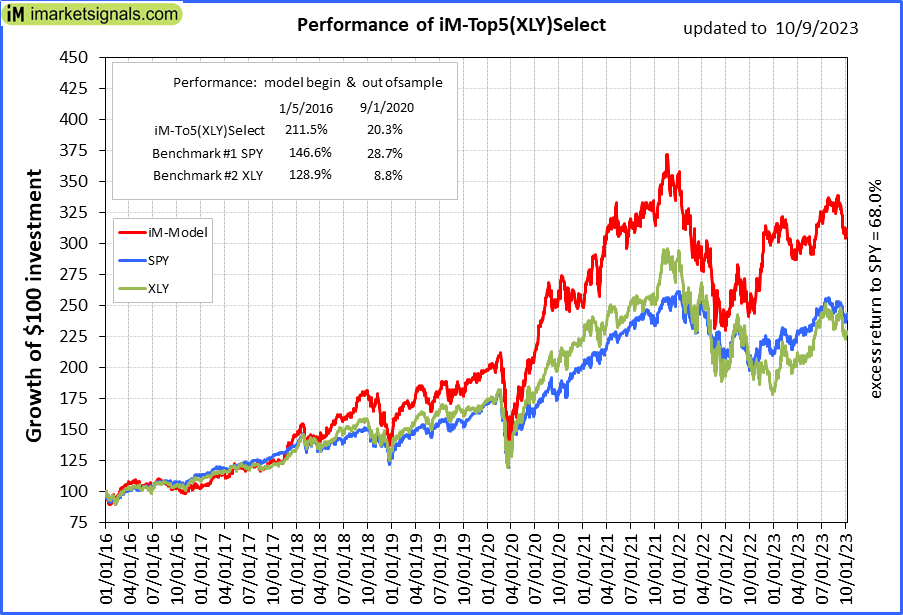 |
iM-Top5(XLY)Select: Since inception, on 1/5/2016, the model gained 211.15% while the benchmark SPY gained 143.17% over the same period. Over the previous week the market value of iM-Top5(XLY)Select gained -0.26% at a time when SPY gained 1.17%. A starting capital of $100,000 at inception on 1/5/2016 would have grown to $311,152 which includes -$209 cash and excludes $5,826 spent on fees and slippage. |
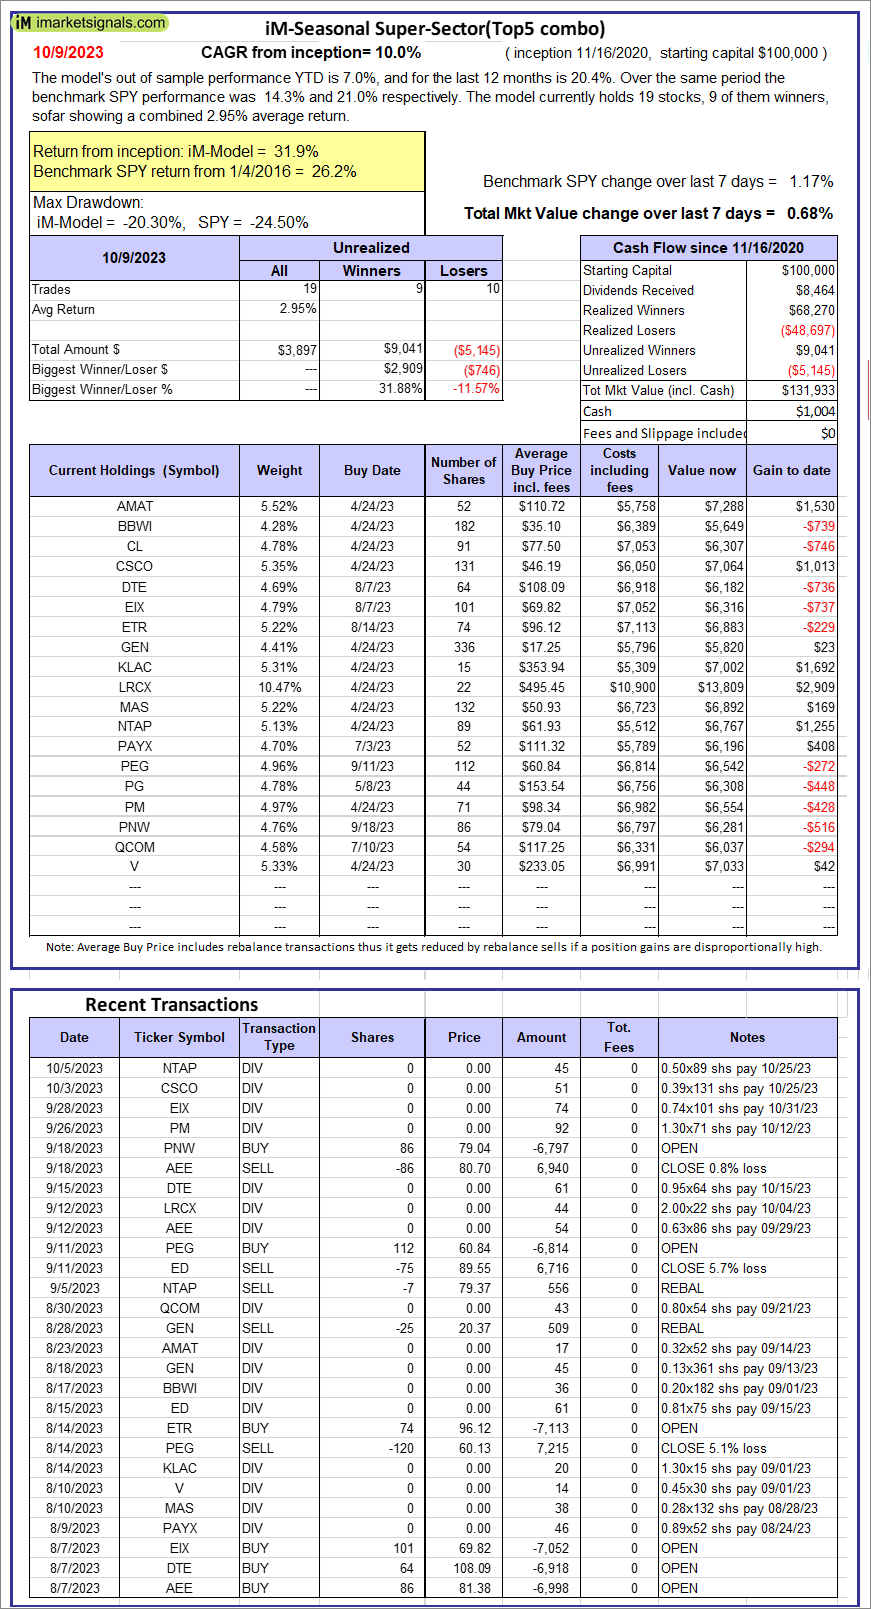 |
iM-Seasonal Super-Sectors (Top5 combo) : Since inception, on 11/17/2020, the model gained 31.93% while the benchmark SPY gained 26.23% over the same period. Over the previous week the market value of iM-Seasonal Super-Sectors (Top5 combo) gained 0.68% at a time when SPY gained 1.17%. A starting capital of $100,000 at inception on 11/17/2020 would have grown to $131,933 which includes $1,004 cash and excludes $00 spent on fees and slippage. |
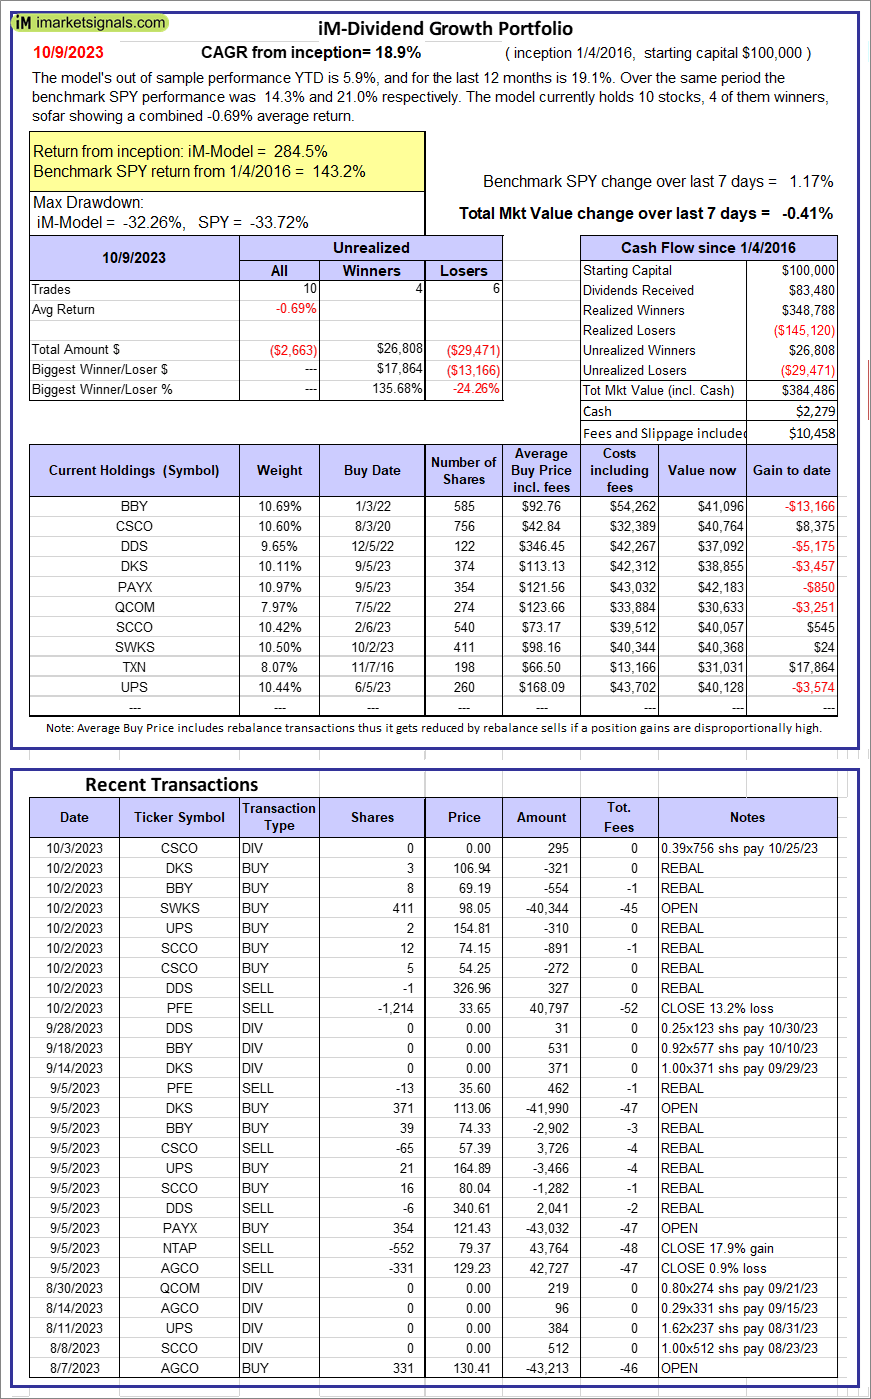 |
iM-Dividend Growth Portfolio: The model’s out of sample performance YTD is 5.9%, and for the last 12 months is 19.1%. Over the same period the benchmark SPY performance was 14.3% and 21.0% respectively. Over the previous week the market value of the iM-Dividend Growth Portfolio gained -0.41% at a time when SPY gained 1.17%. A starting capital of $100,000 at inception on 6/30/2016 would have grown to $384,486 which includes $2,279 cash and excludes $10,458 spent on fees and slippage. |
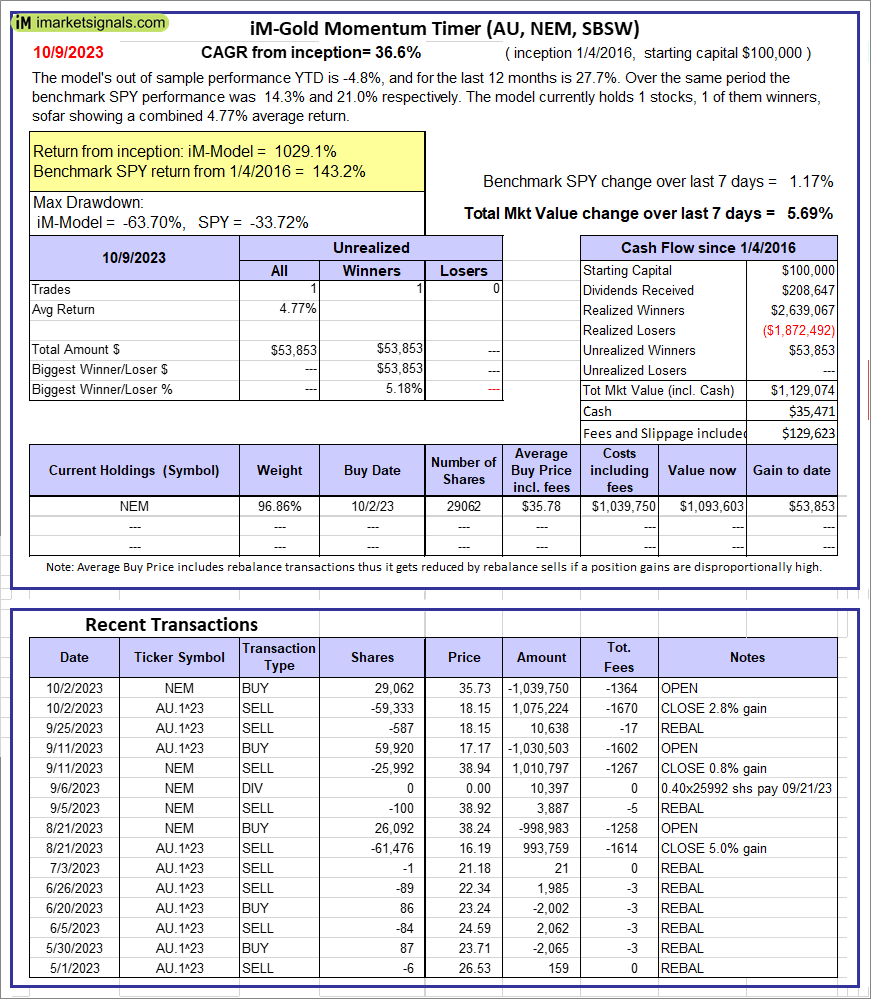 |
iM-Gold Momentum Timer (AU, NEM, SBSW): The model’s out of sample performance YTD is -4.8%, and for the last 12 months is 27.7%. Over the same period the benchmark SPY performance was 14.3% and 21.0% respectively. Over the previous week the market value of iM-Gold Momentum Timer (AU, NEM, SBSW) gained 5.69% at a time when SPY gained 1.17%. A starting capital of $100,000 at inception on 6/30/2016 would have grown to $35,471 which includes $129,623 cash and excludes Gain to date spent on fees and slippage. |
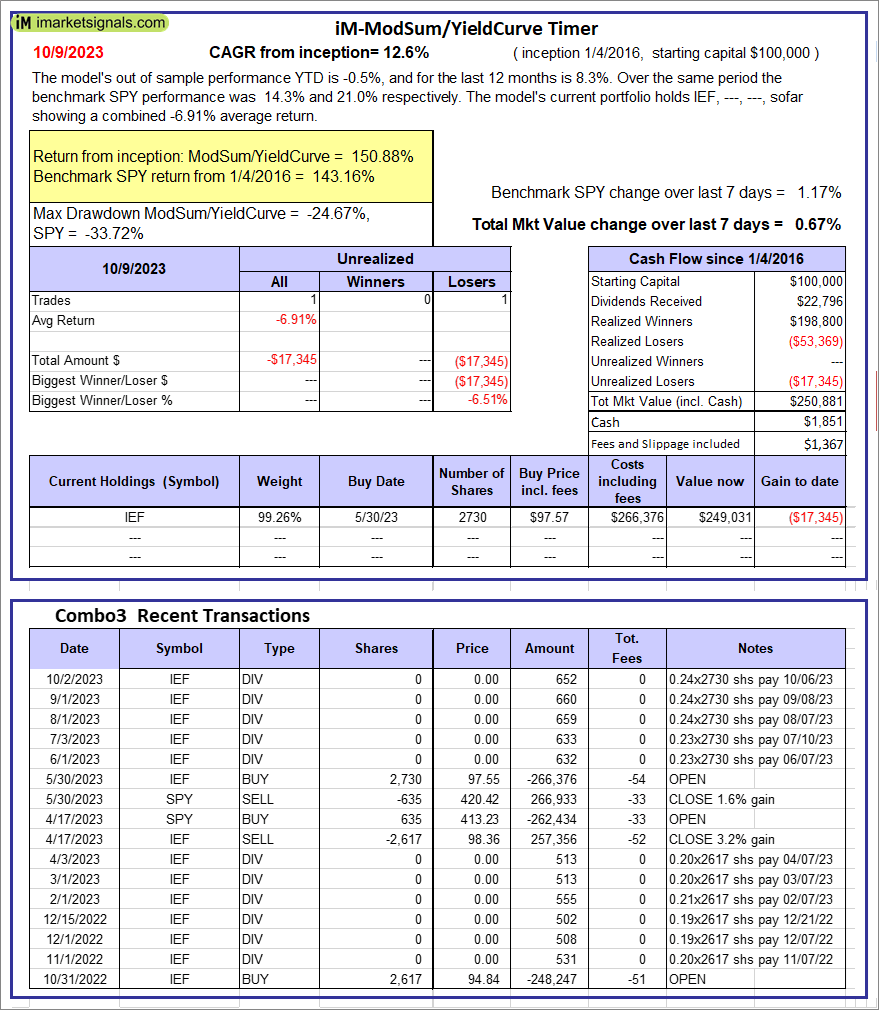 |
iM-ModSum/YieldCurve Timer: The model’s out of sample performance YTD is -0.5%, and for the last 12 months is 8.3%. Over the same period the benchmark SPY performance was 14.3% and 21.0% respectively. Over the previous week the market value of iM-PortSum/YieldCurve Timer gained 0.67% at a time when SPY gained 1.17%. A starting capital of $100,000 at inception on 1/1/2016 would have grown to $250,881 which includes $1,851 cash and excludes $1,367 spent on fees and slippage. |
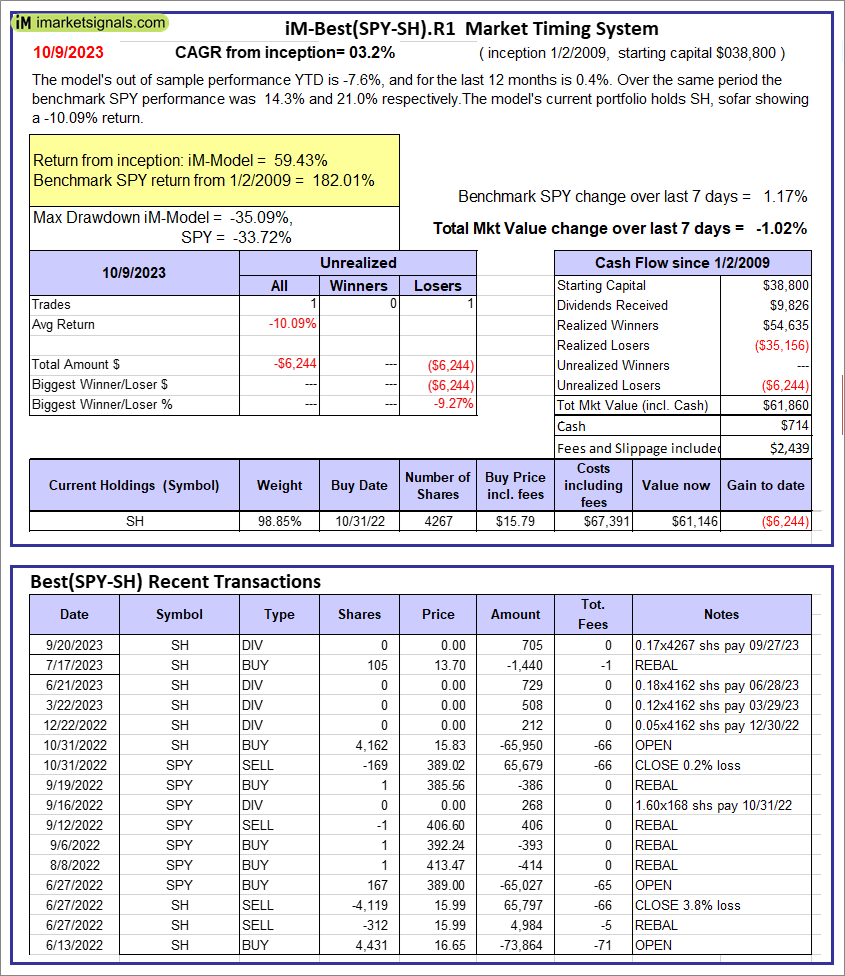 |
iM-Best(SPY-SH).R1: The model’s out of sample performance YTD is -7.6%, and for the last 12 months is 0.4%. Over the same period the benchmark SPY performance was 14.3% and 21.0% respectively. Over the previous week the market value of Best(SPY-SH) gained -1.02% at a time when SPY gained 1.17%. A starting capital of $100,000 at inception on 1/2/2009 would have grown to $61,860 which includes $714 cash and excludes $2,439 spent on fees and slippage. |
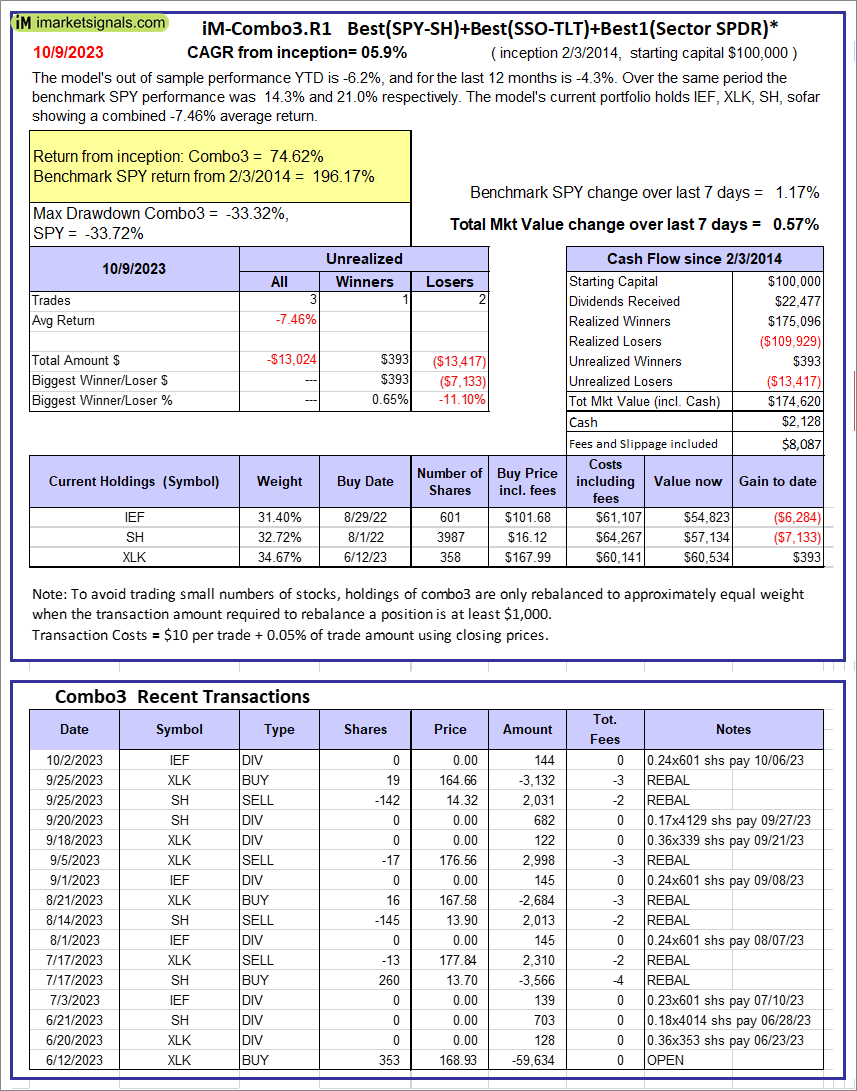 |
iM-Combo3.R1: The model’s out of sample performance YTD is -6.2%, and for the last 12 months is -4.3%. Over the same period the benchmark SPY performance was 14.3% and 21.0% respectively. Over the previous week the market value of iM-Combo3.R1 gained 0.57% at a time when SPY gained 1.17%. A starting capital of $100,000 at inception on 2/3/2014 would have grown to $174,620 which includes $2,128 cash and excludes $8,087 spent on fees and slippage. |
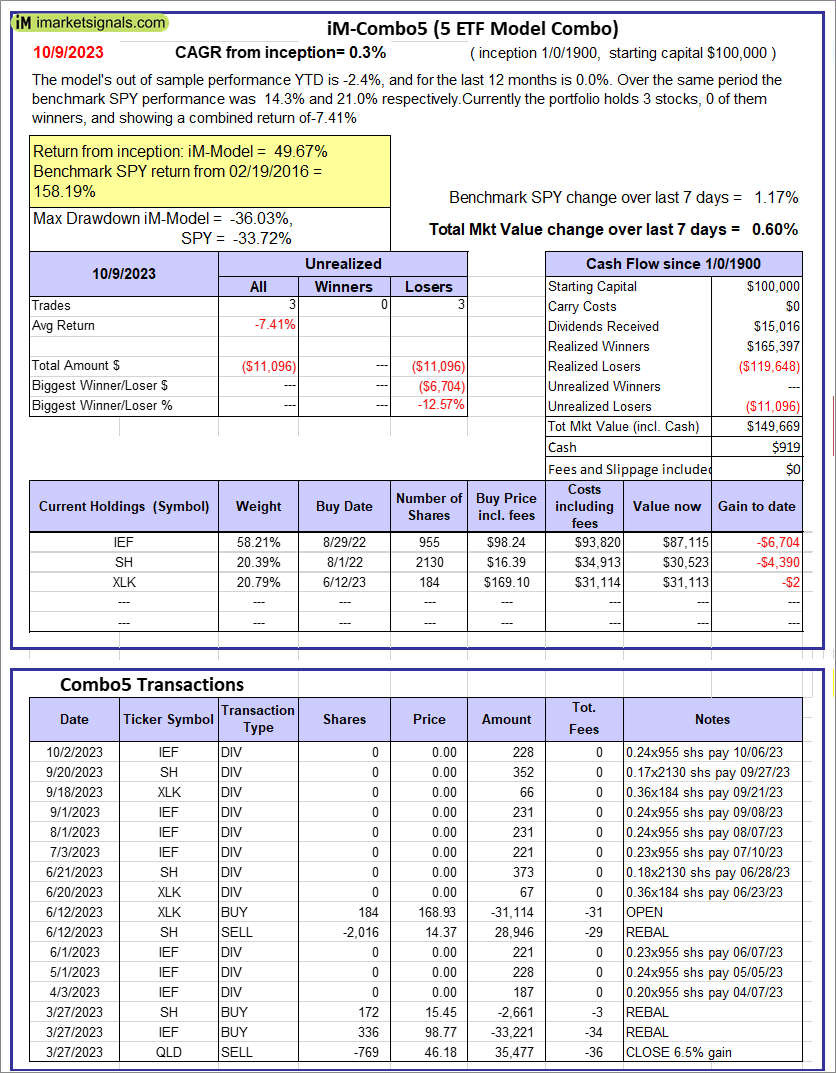 |
iM-Combo5: The model’s out of sample performance YTD is -2.4%, and for the last 12 months is 0.0%. Over the same period the benchmark SPY performance was 14.3% and 21.0% respectively. Over the previous week the market value of iM-Combo5 gained 0.60% at a time when SPY gained 1.17%. A starting capital of $100,000 at inception on 2/22/2016 would have grown to $149,669 which includes $919 cash and excludes $0 spent on fees and slippage. |
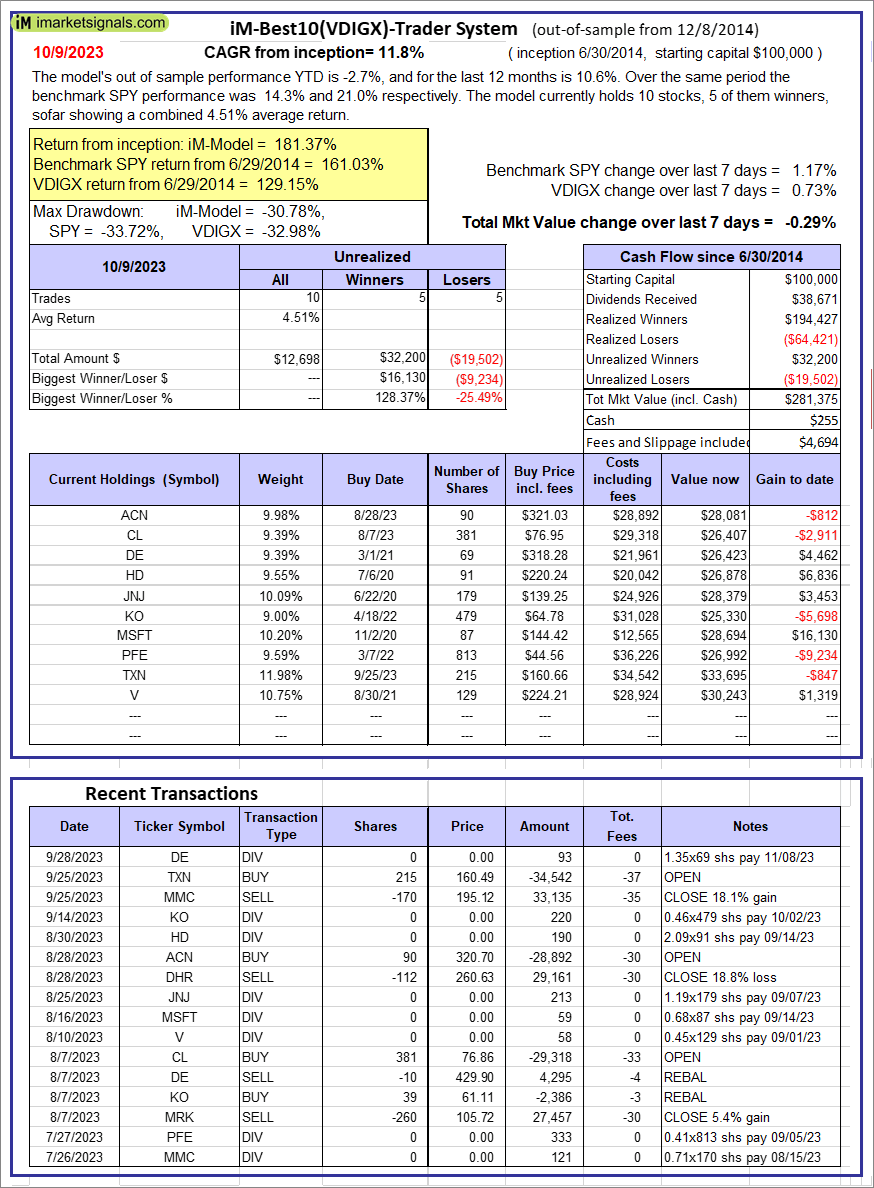 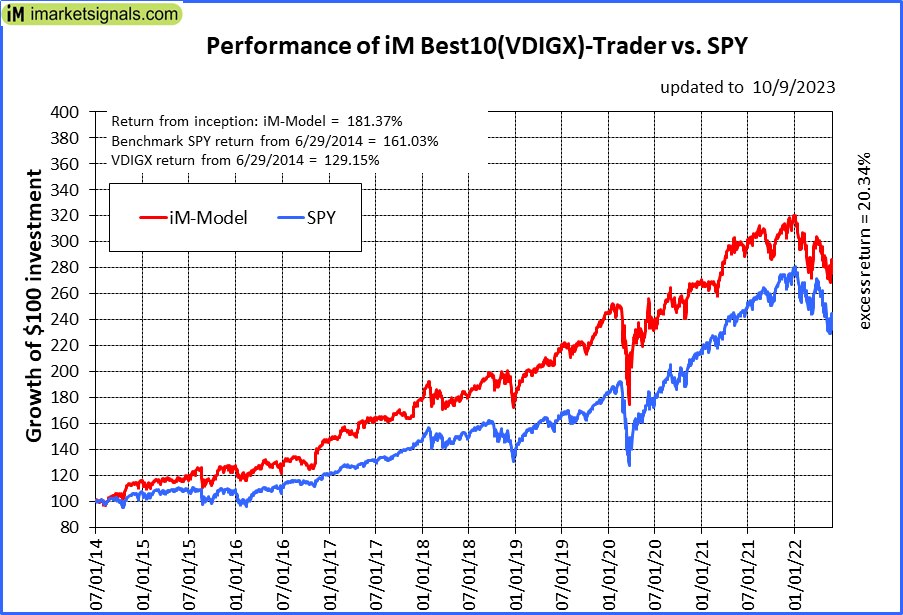 |
iM-Best10(VDIGX)-Trader: The model’s out of sample performance YTD is -2.7%, and for the last 12 months is 10.6%. Over the same period the benchmark SPY performance was 14.3% and 21.0% respectively. Since inception, on 7/1/2014, the model gained 181.37% while the benchmark SPY gained 161.03% and VDIGX gained 129.15% over the same period. Over the previous week the market value of iM-Best10(VDIGX) gained -0.29% at a time when SPY gained 1.17%. A starting capital of $100,000 at inception on 7/1/2014 would have grown to $281,375 which includes $255 cash and excludes $4,694 spent on fees and slippage. |
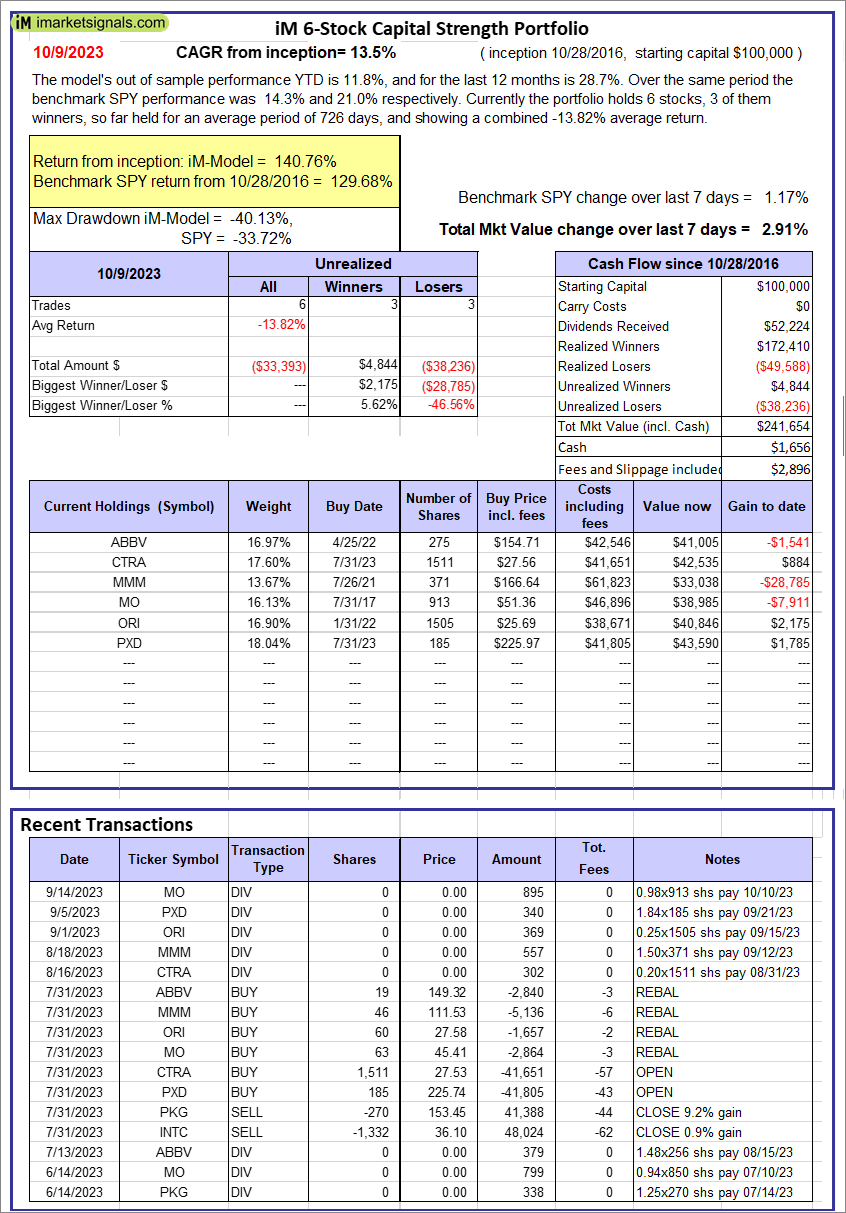 |
iM 6-Stock Capital Strength Portfolio: The model’s out of sample performance YTD is 11.8%, and for the last 12 months is 28.7%. Over the same period the benchmark SPY performance was 14.3% and 21.0% respectively. Over the previous week the market value of the iM 6-Stock Capital Strength Portfolio gained 2.91% at a time when SPY gained 1.17%. A starting capital of $100,000 at inception on 10/28/2016 would have grown to $241,654 which includes $1,656 cash and excludes $2,896 spent on fees and slippage. |
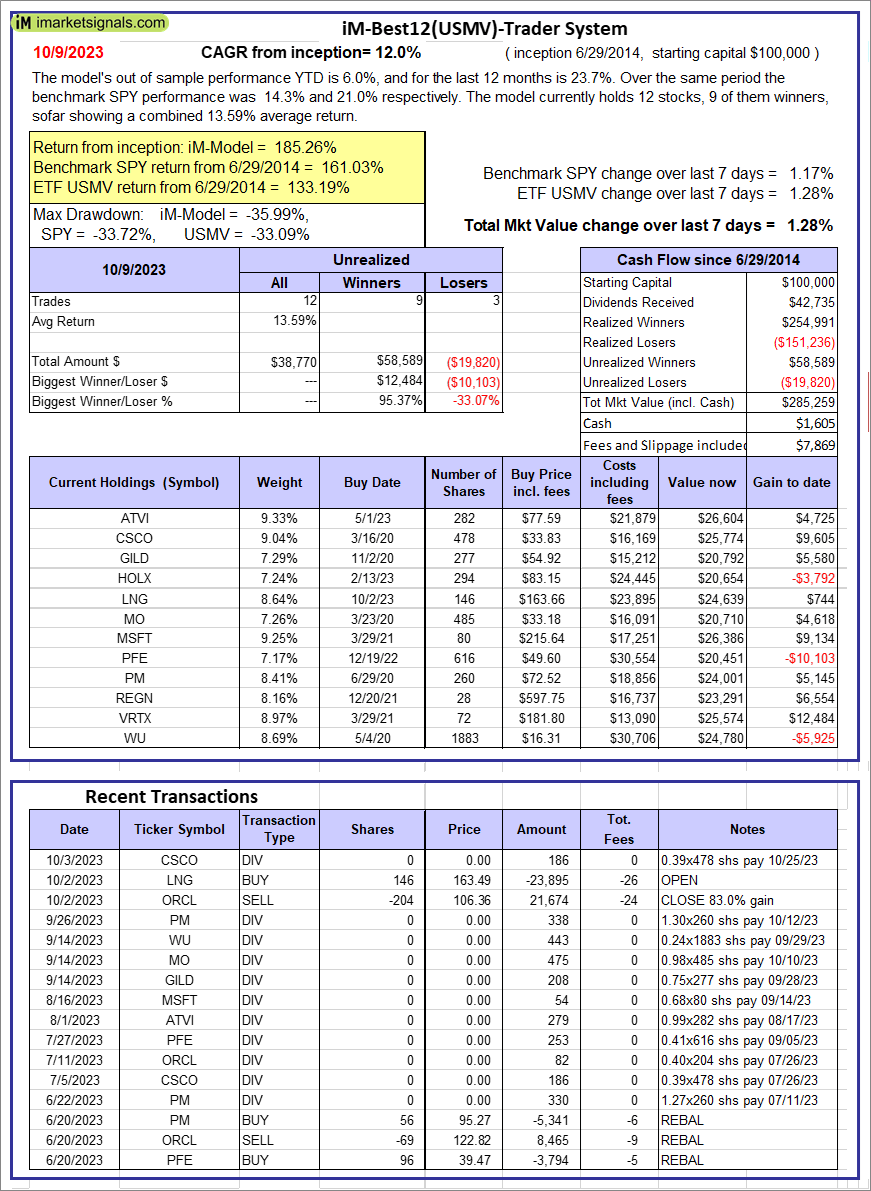 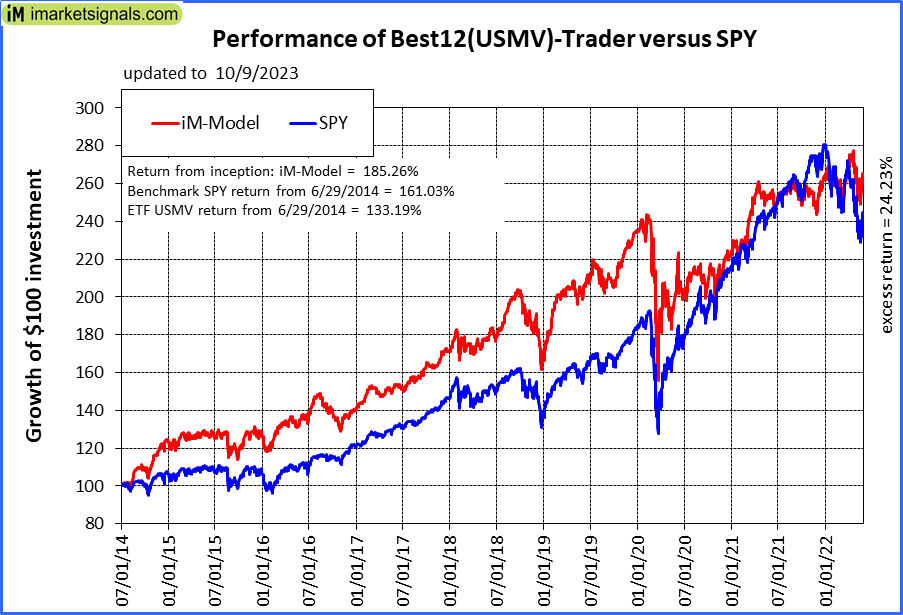 |
iM-Best12(USMV)-Trader: The model’s out of sample performance YTD is 6.0%, and for the last 12 months is 23.7%. Over the same period the benchmark SPY performance was 14.3% and 21.0% respectively. Since inception, on 6/30/2014, the model gained 185.26% while the benchmark SPY gained 161.03% and the ETF USMV gained 133.19% over the same period. Over the previous week the market value of iM-Best12(USMV)-Trader gained 1.28% at a time when SPY gained 1.17%. A starting capital of $100,000 at inception on 6/30/2014 would have grown to $285,259 which includes $1,605 cash and excludes $7,869 spent on fees and slippage. |
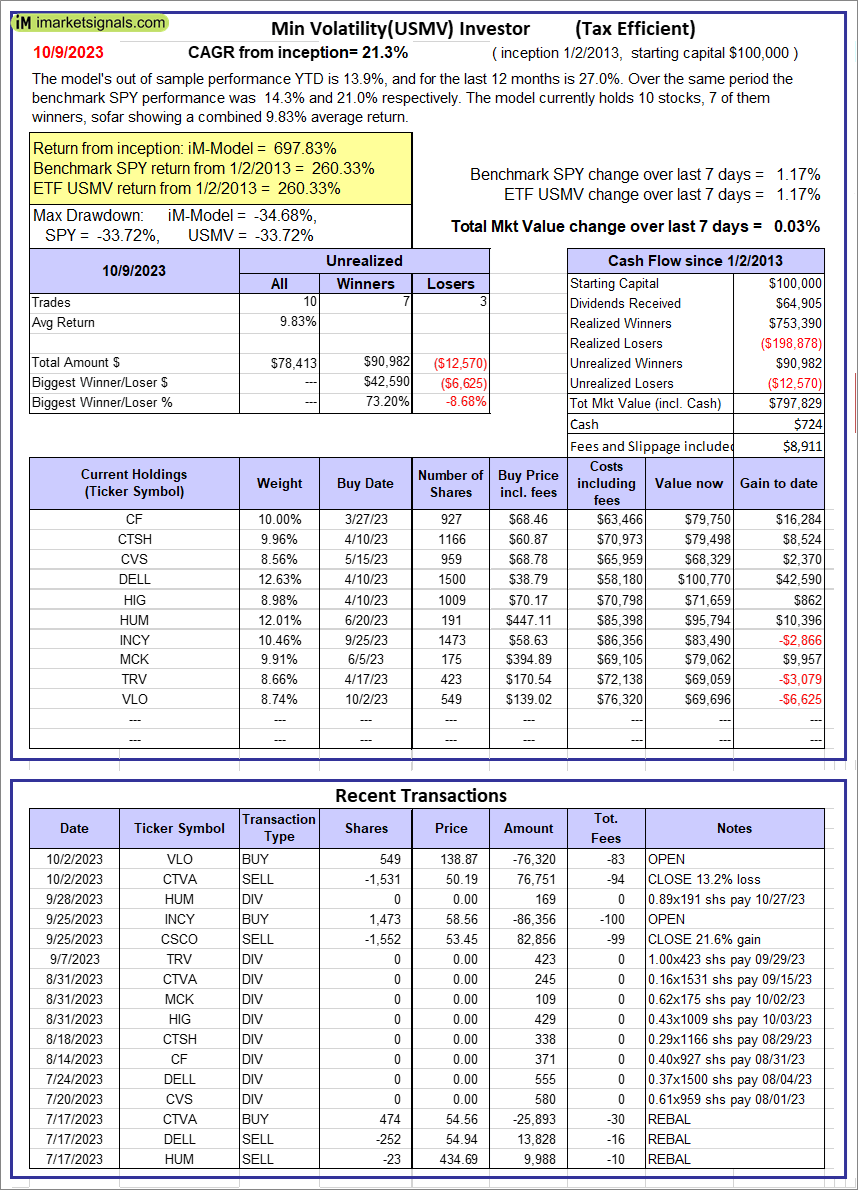 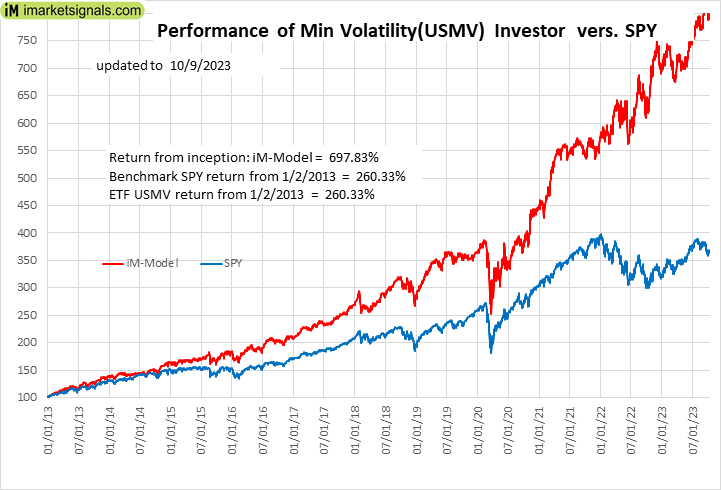 |
iM-Min Volatility(USMV) Investor (Tax Efficient): The model’s out of sample performance YTD is 13.9%, and for the last 12 months is 27.0%. Over the same period the benchmark SPY performance was 14.3% and 21.0% respectively. Since inception, on 1/3/2013, the model gained 697.83% while the benchmark SPY gained 260.33% and the ETF USMV gained 260.33% over the same period. Over the previous week the market value of iM-Best12(USMV)Q1 gained 0.03% at a time when SPY gained 1.17%. A starting capital of $100,000 at inception on 1/3/2013 would have grown to $797,829 which includes $724 cash and excludes $8,911 spent on fees and slippage. |
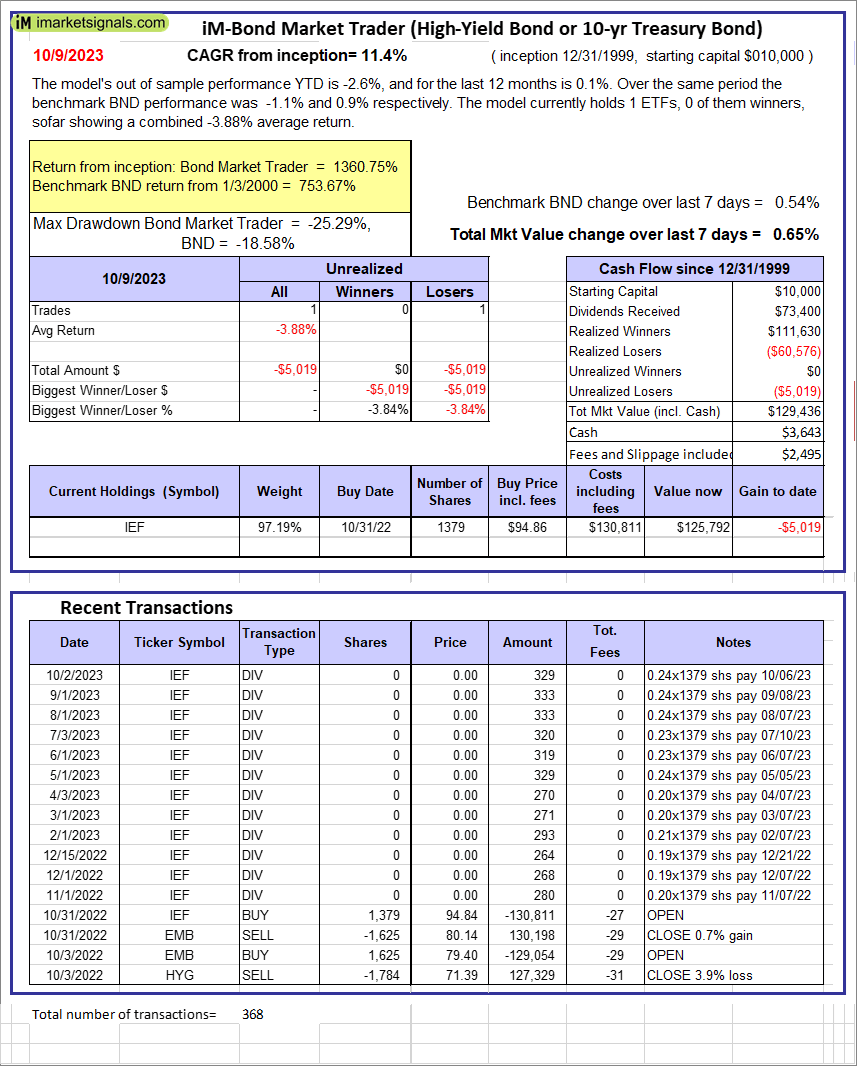 |
iM-Bond Market Trader (High-Yield Bond or 10-yr Treasury Bond): The model’s out of sample performance YTD is -2.6%, and for the last 12 months is 0.1%. Over the same period the benchmark BND performance was -1.1% and 0.9% respectively. Over the previous week the market value of the iM-Bond Market Trader (High-Yield Bond or 10-yr Treasury Bond) gained 0.65% at a time when BND gained 0.54%. A starting capital of $10,000 at inception on 1/3/2000 would have grown to $129,436 which includes $3,643 cash and excludes $2,495 spent on fees and slippage. |
|
|
iM-ModSum/YieldCurve Timer: The model’s out of sample performance YTD is -0.5%, and for the last 12 months is 8.3%. Over the same period the benchmark SPY performance was 14.3% and 21.0% respectively. Over the previous week the market value of iM-PortSum/YieldCurve Timer gained 0.67% at a time when SPY gained 1.17%. A starting capital of $100,000 at inception on 1/1/2016 would have grown to $250,881 which includes $1,851 cash and excludes $1,367 spent on fees and slippage. |
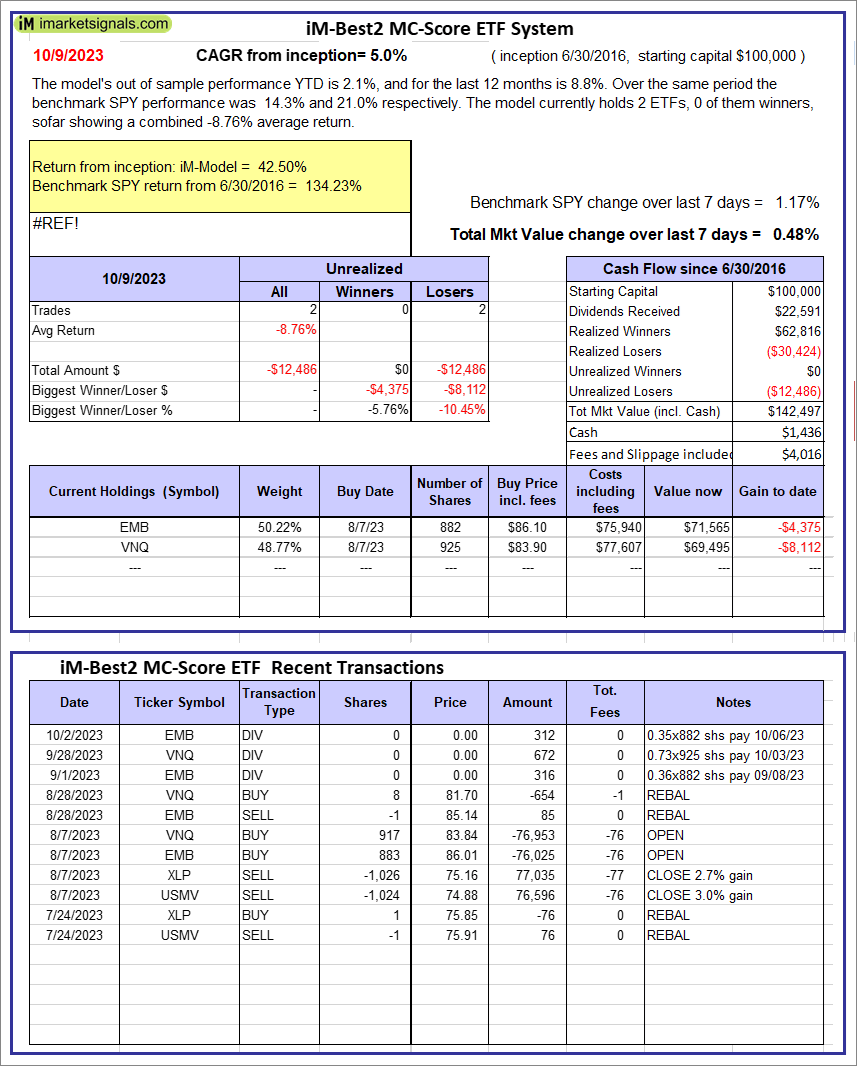 |
iM-Best2 MC-Score ETF System: The model’s out of sample performance YTD is 2.1%, and for the last 12 months is 8.8%. Over the same period the benchmark SPY performance was 14.3% and 21.0% respectively. Over the previous week the market value of the iM-Best2 MC-Score ETF System gained 0.48% at a time when SPY gained 1.17%. A starting capital of $100,000 at inception on 6/30/2016 would have grown to $142,497 which includes $1,436 cash and excludes $4,016 spent on fees and slippage. |
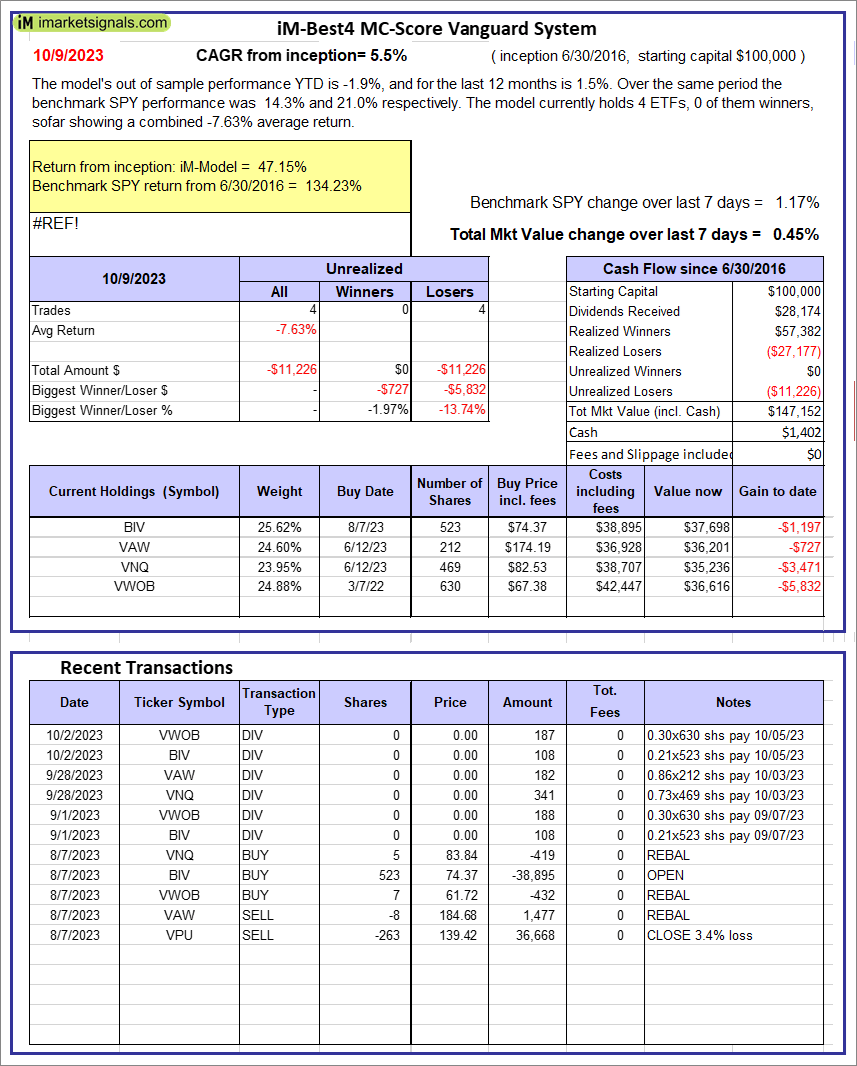 |
iM-Best4 MC-Score Vanguard System: The model’s out of sample performance YTD is -1.9%, and for the last 12 months is 1.5%. Over the same period the benchmark SPY performance was 14.3% and 21.0% respectively. Over the previous week the market value of the iM-Best4 MC-Score Vanguard System gained 0.45% at a time when SPY gained 1.17%. A starting capital of $100,000 at inception on 6/30/2016 would have grown to $147,152 which includes $1,402 cash and excludes $00 spent on fees and slippage. |
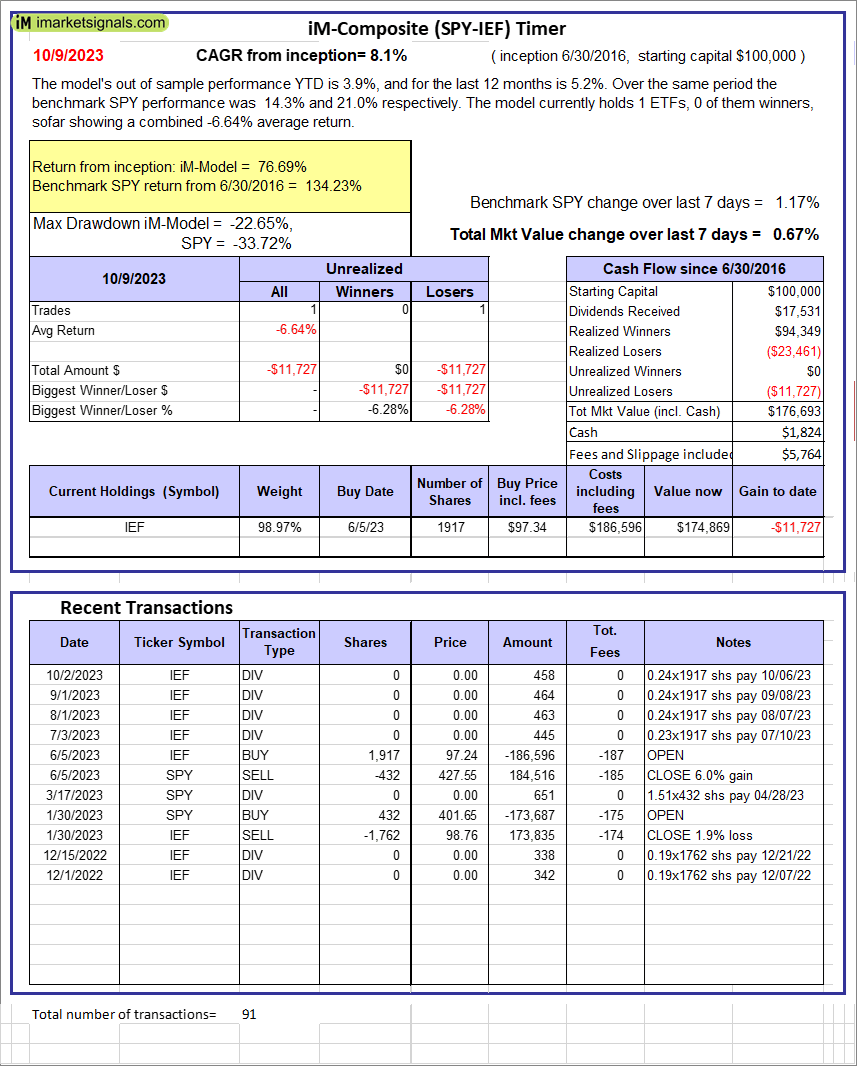 |
iM-Composite (SPY-IEF) Timer: The model’s out of sample performance YTD is 3.9%, and for the last 12 months is 5.2%. Over the same period the benchmark SPY performance was 14.3% and 21.0% respectively. Over the previous week the market value of the iM-Composite (SPY-IEF) Timer gained 0.67% at a time when SPY gained 1.17%. A starting capital of $100,000 at inception on 6/30/2016 would have grown to $176,693 which includes $1,824 cash and excludes $5,764 spent on fees and slippage. |
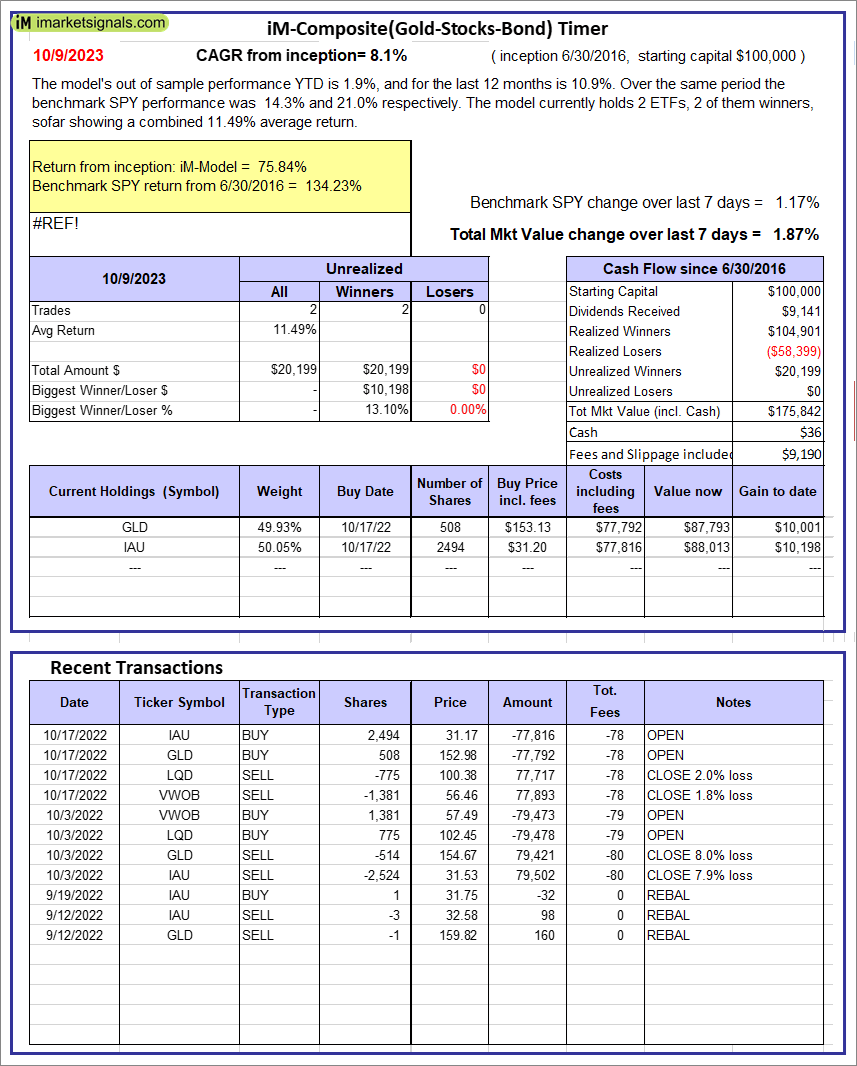 |
iM-Composite(Gold-Stocks-Bond) Timer: The model’s out of sample performance YTD is 1.9%, and for the last 12 months is 10.9%. Over the same period the benchmark SPY performance was 14.3% and 21.0% respectively. Over the previous week the market value of the iM-Composite(Gold-Stocks-Bond) Timer gained 1.87% at a time when SPY gained 1.17%. A starting capital of $100,000 at inception on 6/30/2016 would have grown to $175,842 which includes $36 cash and excludes $9,190 spent on fees and slippage. |
iM-Best Reports – 10/9/2023
Posted in pmp SPY-SH
Leave a Reply
You must be logged in to post a comment.