
  |
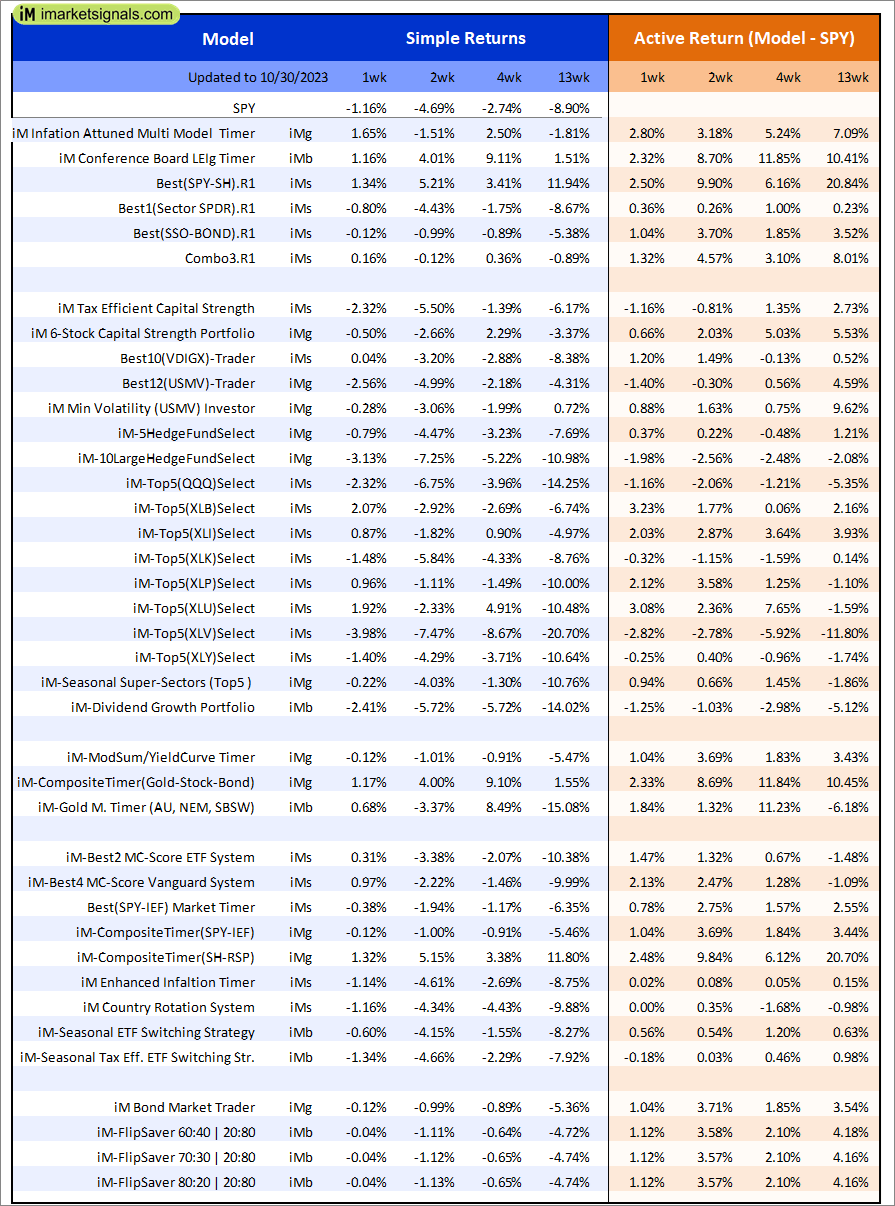
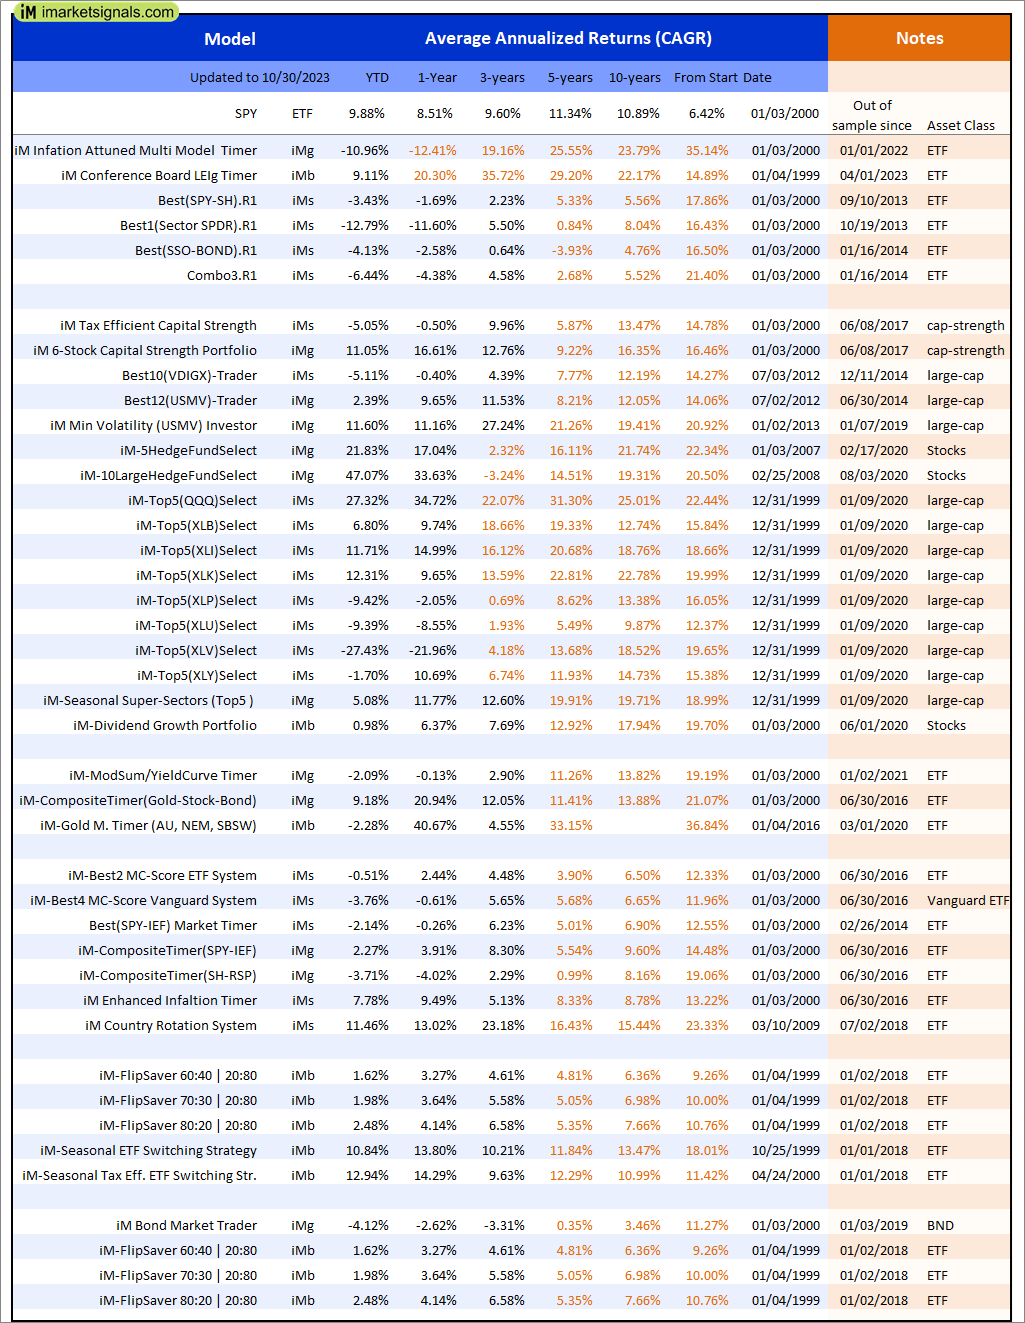
Out of sample performance summary of our models for the past 1, 2, 4 and 13 week periods. The active active return indicates how the models over- or underperformed the benchmark ETF SPY. Also the YTD, and the 1-, 3-, 5- and 10-year annualized returns are shown in the second table |
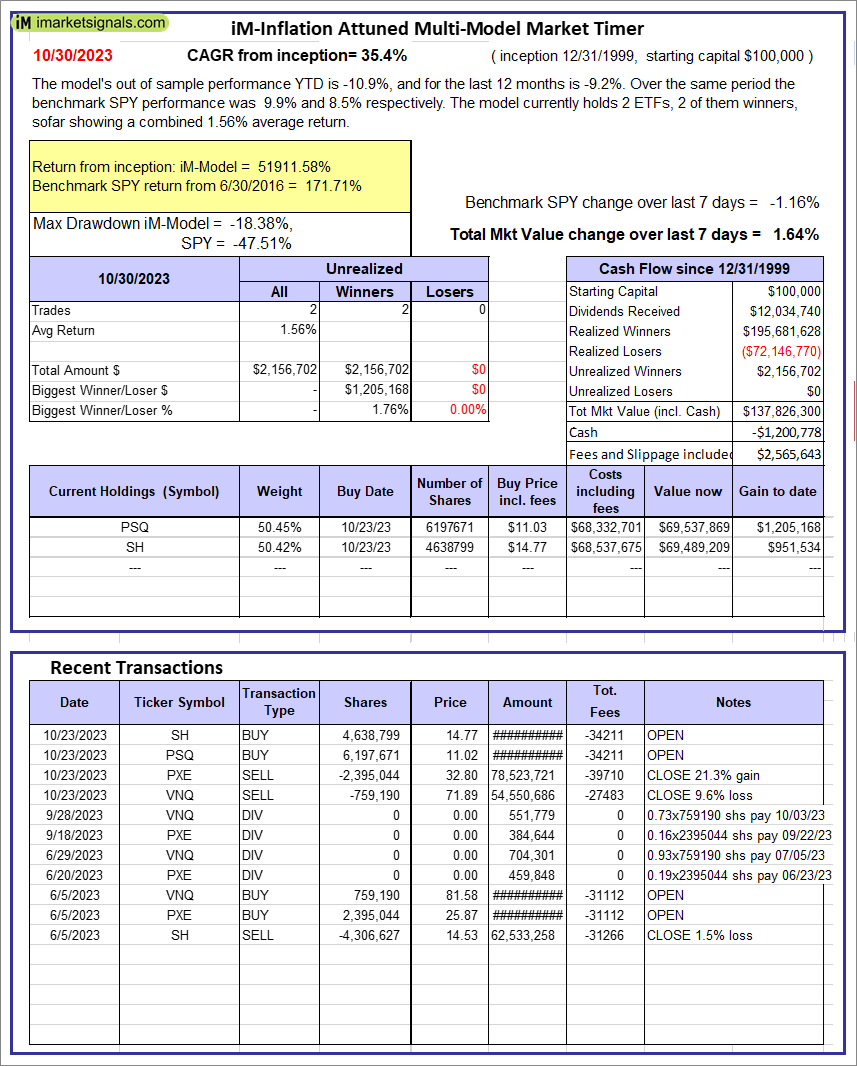 |
iM-Inflation Attuned Multi-Model Market Timer: The model’s out of sample performance YTD is -10.9%, and for the last 12 months is -9.2%. Over the same period the benchmark SPY performance was 9.9% and 8.5% respectively. Over the previous week the market value of the iM-Inflation Attuned Multi-Model Market Timer gained 1.64% at a time when SPY gained -1.16%. A starting capital of $100,000 at inception on 3/24/2017 would have grown to $137,826,300 which includes -$1,200,778 cash and excludes $2,565,643 spent on fees and slippage. |
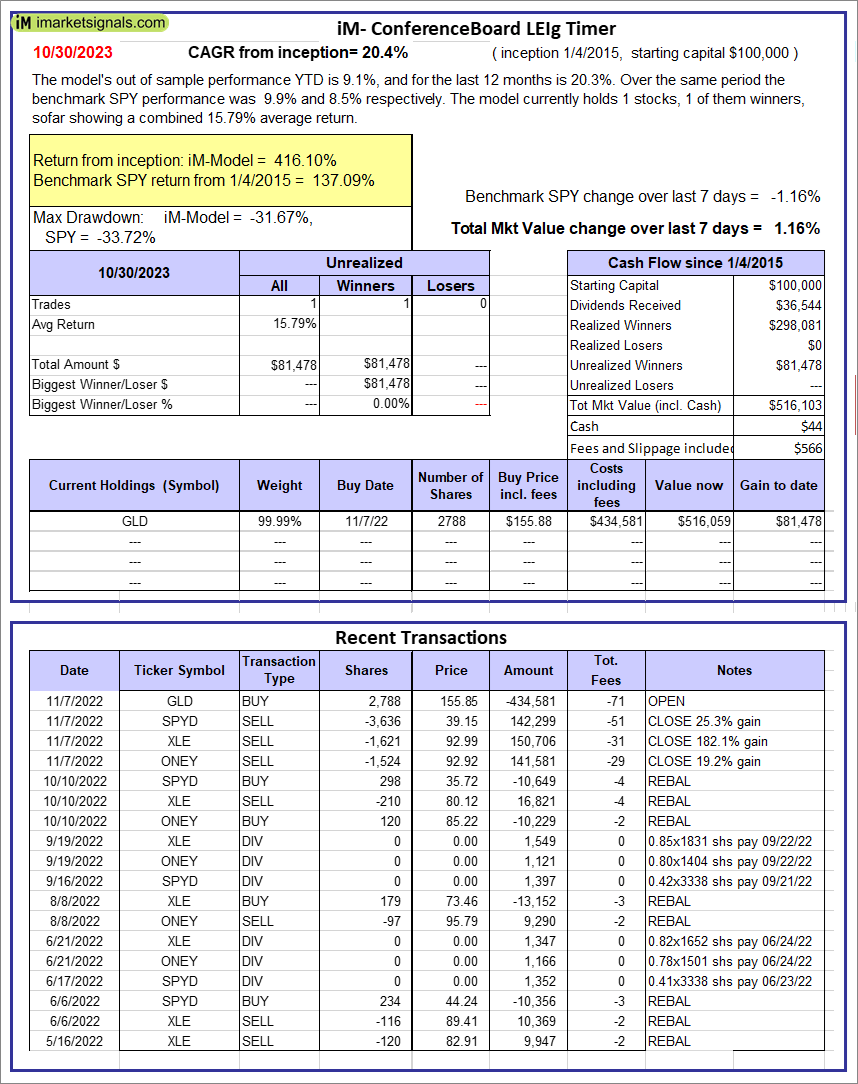 |
iM-Conference Board LEIg Timer: The model’s performance YTD is 14.3%, and for the last 12 months is 7.3%. Over the same period the benchmark SPY performance was 20.1% and 9.4% respectively. Over the previous week the market value of the iM-Conference Board LEIg Timer gained 1.16% at a time when SPY gained -1.16%. A starting capital of $100,000 at inception on 4/5/2017 would have grown to $516,103 which includes $44 cash and excludes $566 spent on fees and slippage. |
 |
iM-FlipSaver 60:40 | 20:80 – 2017: The model’s out of sample performance YTD is 1.5%, and for the last 12 months is 3.1%. Over the same period the benchmark E60B40 performance was 5.0% and 5.4% respectively. Over the previous week the market value of iM-FlipSaver 80:20 | 20:80 gained -0.04% at a time when SPY gained -0.69%. A starting capital of $100,000 at inception on 7/16/2015 would have grown to $143,103 which includes $1,631 cash and excludes $3,255 spent on fees and slippage. |
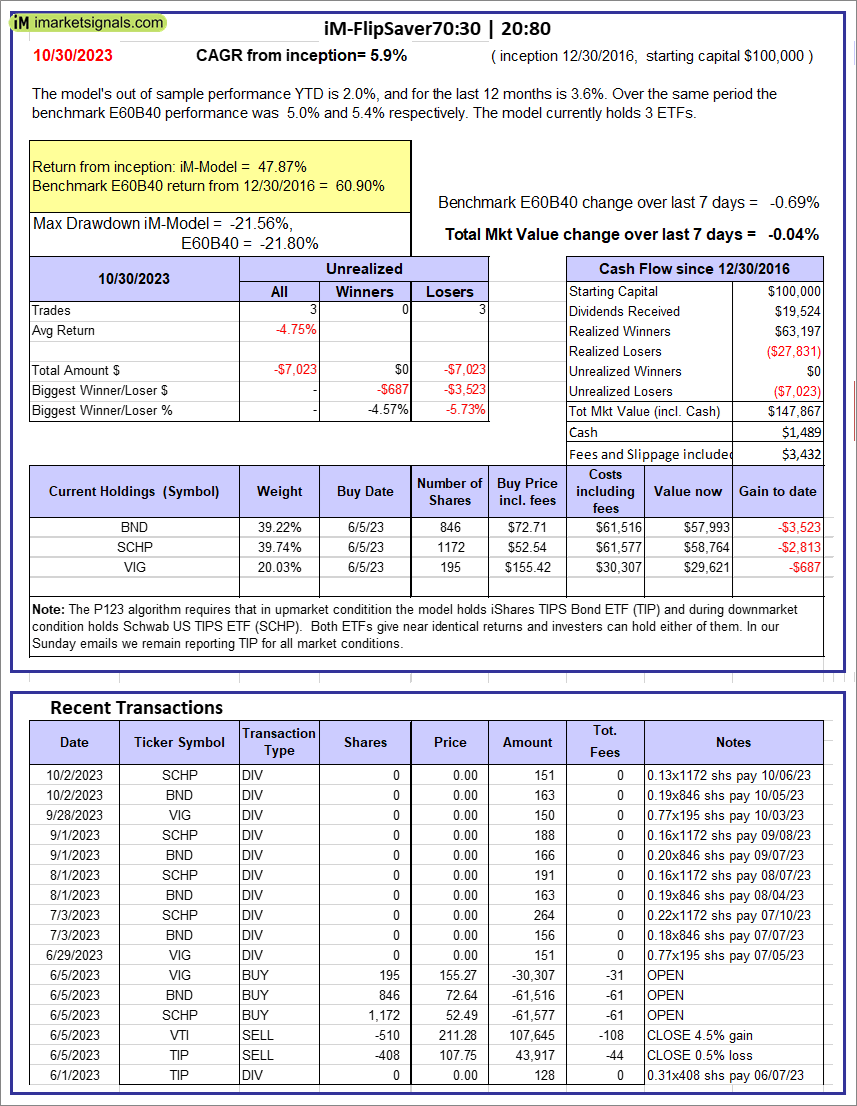 |
iM-FlipSaver 70:30 | 20:80 – 2017: The model’s out of sample performance YTD is 2.0%, and for the last 12 months is 3.6%. Over the same period the benchmark E60B40 performance was 5.0% and 5.4% respectively. Over the previous week the market value of iM-FlipSaver 70:30 | 20:80 gained -0.04% at a time when SPY gained -0.69%. A starting capital of $100,000 at inception on 7/15/2015 would have grown to $147,867 which includes $1,489 cash and excludes $3,432 spent on fees and slippage. |
 |
iM-FlipSaver 80:20 | 20:80 – 2017: The model’s out of sample performance YTD is 2.5%, and for the last 12 months is 4.1%. Over the same period the benchmark E60B40 performance was 5.0% and 5.4% respectively. Over the previous week the market value of iM-FlipSaver 80:20 | 20:80 gained -0.04% at a time when SPY gained -0.69%. A starting capital of $100,000 at inception on 1/2/2017 would have grown to $152,510 which includes $1,515 cash and excludes $3,600 spent on fees and slippage. |
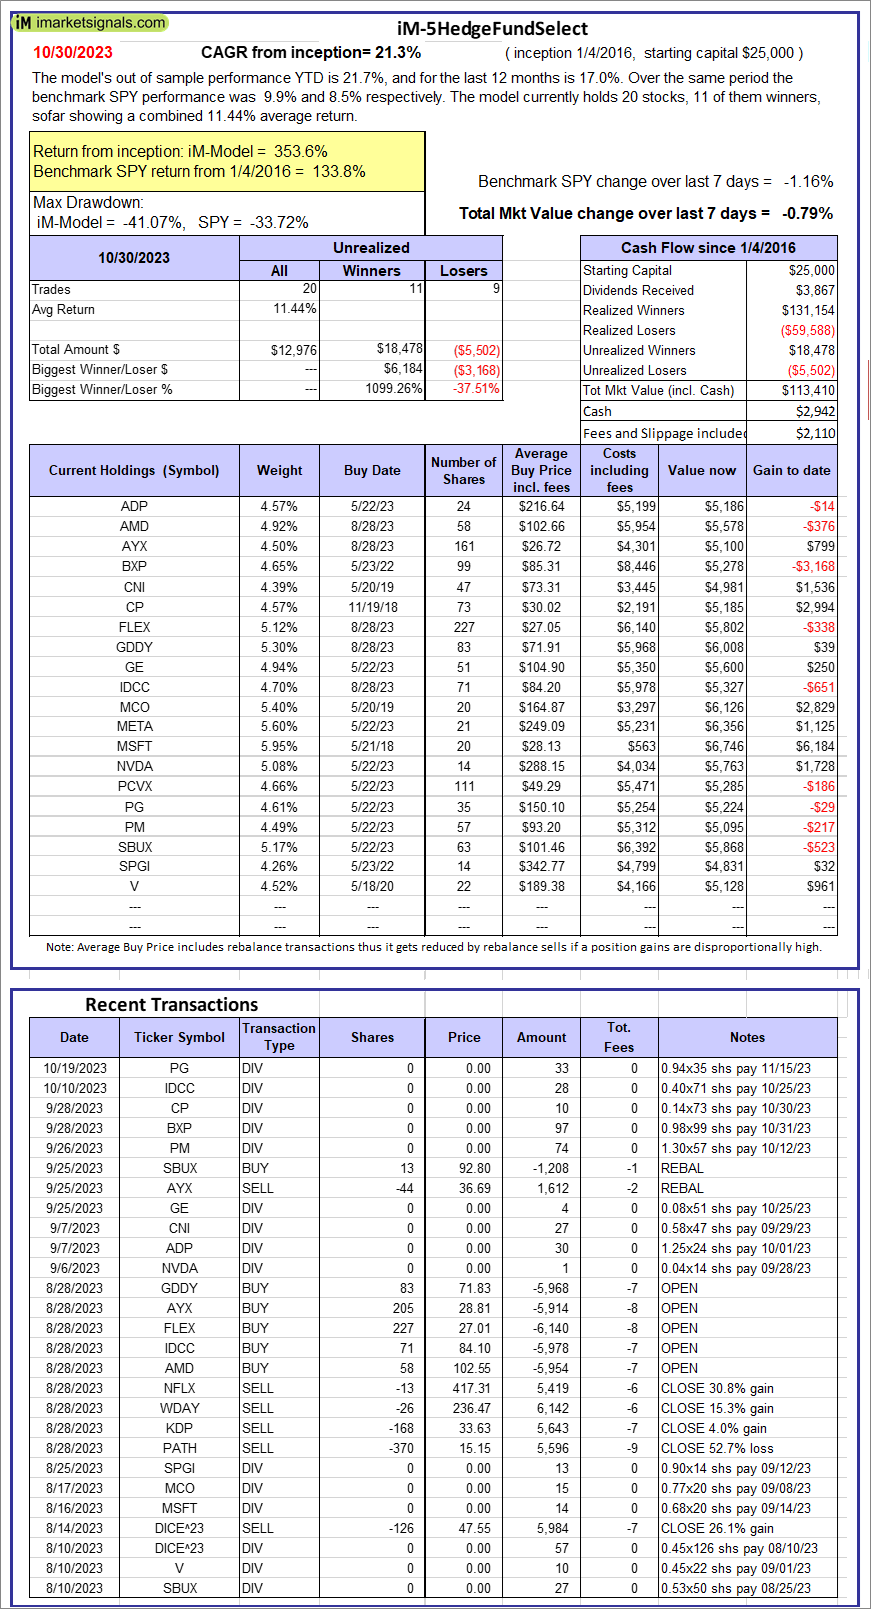 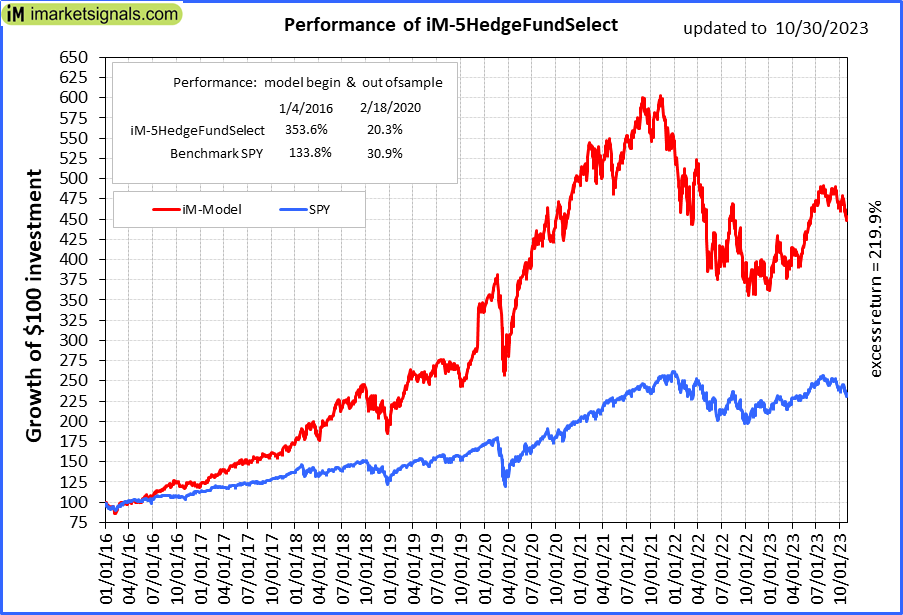 |
iM-5HedgeFundSelect: Since inception, on 1/5/2016, the model gained 353.64% while the benchmark SPY gained 133.77% over the same period. Over the previous week the market value of iM-5HedgeFundSelect gained -0.79% at a time when SPY gained -1.16%. A starting capital of $25,000 at inception on 1/5/2016 would have grown to $113,410 which includes $2,942 cash and excludes $2,110 spent on fees and slippage. |
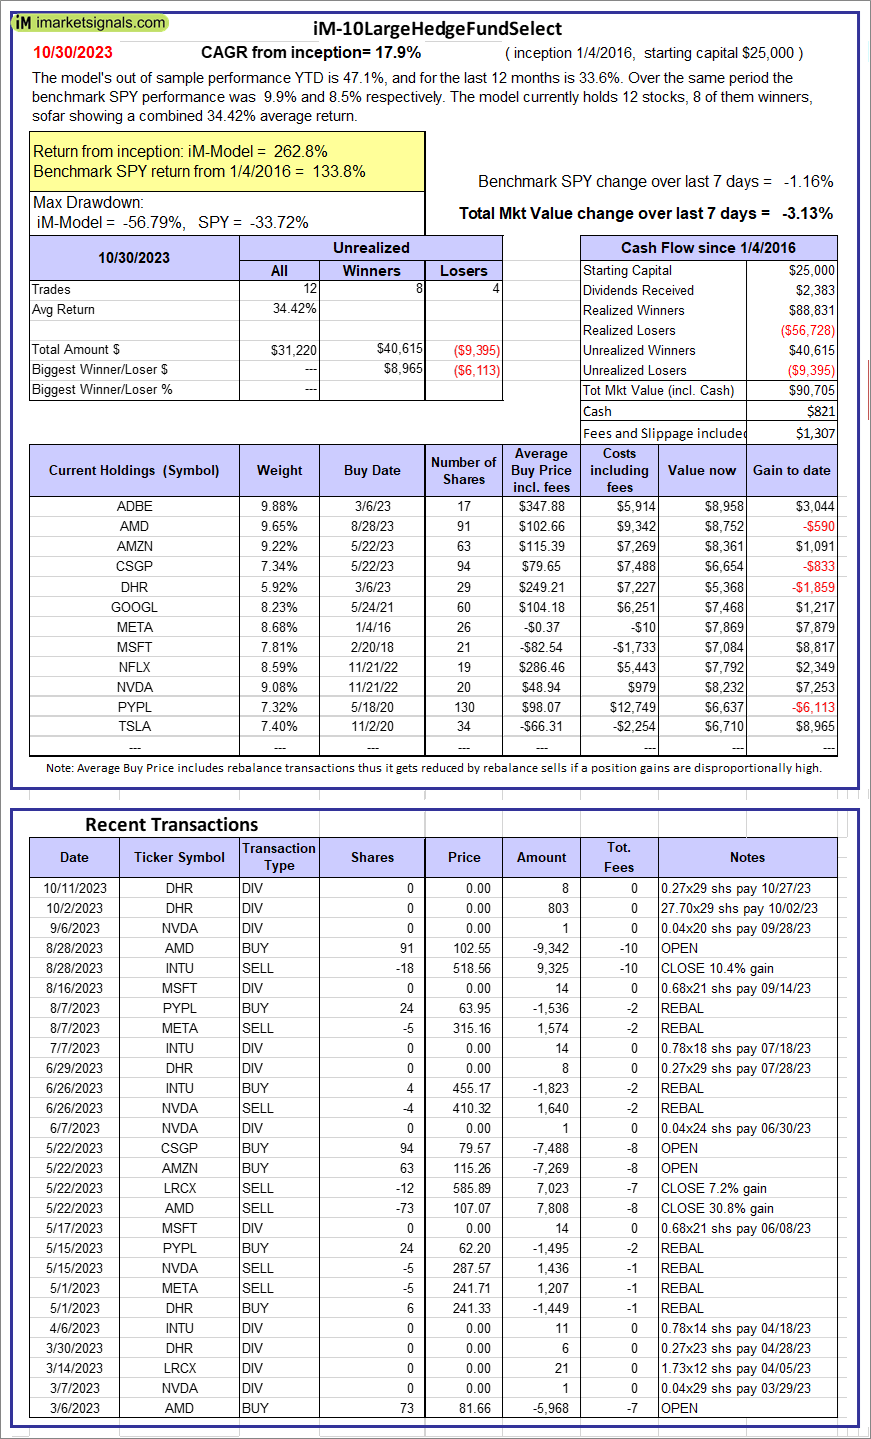 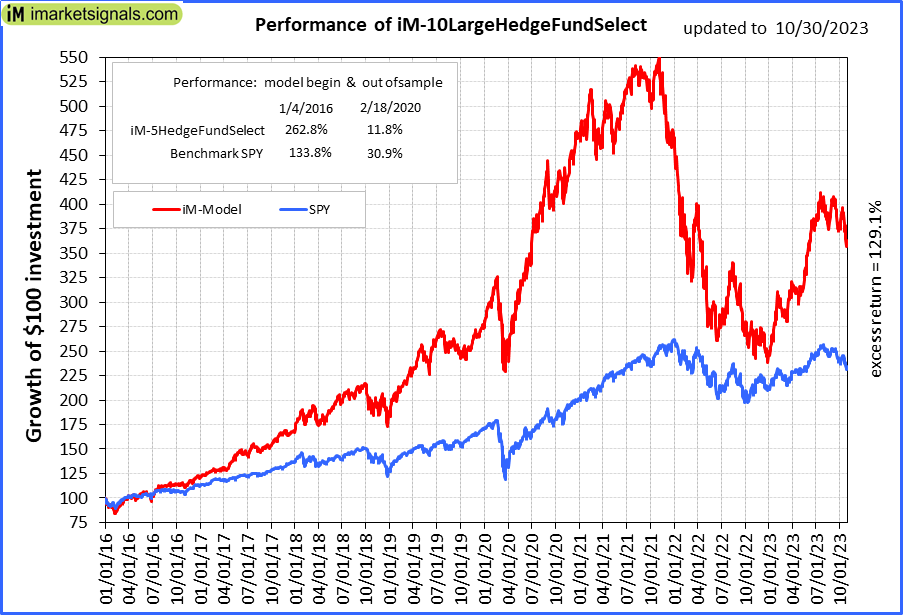 |
iM-10LargeHedgeFundSelect: Since inception, on 1/5/2016, the model gained 262.82% while the benchmark SPY gained 133.77% over the same period. Over the previous week the market value of iM-10LargeHedgeFundSelect gained -3.13% at a time when SPY gained -1.16%. A starting capital of $25,000 at inception on 1/5/2016 would have grown to $90,705 which includes $821 cash and excludes $1,307 spent on fees and slippage. |
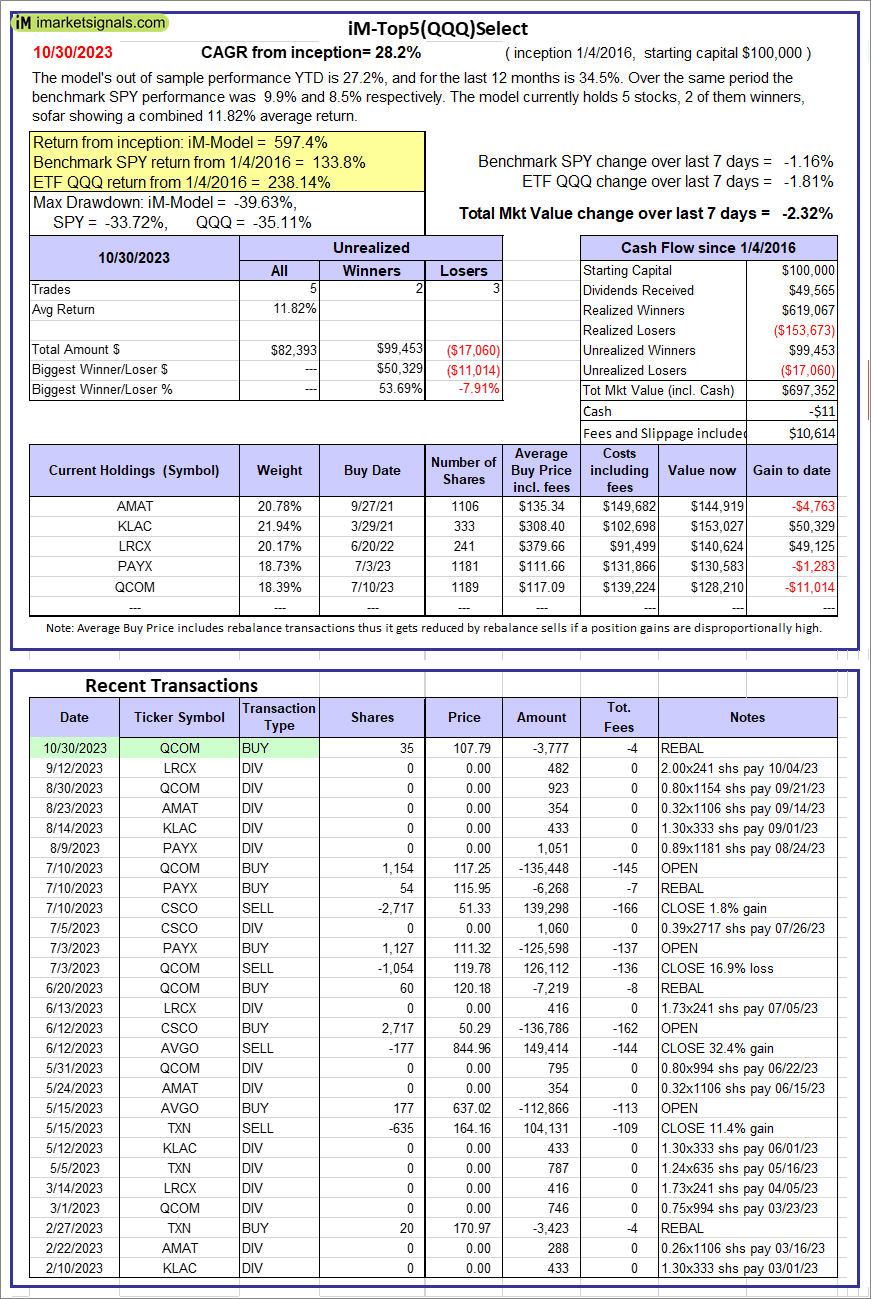 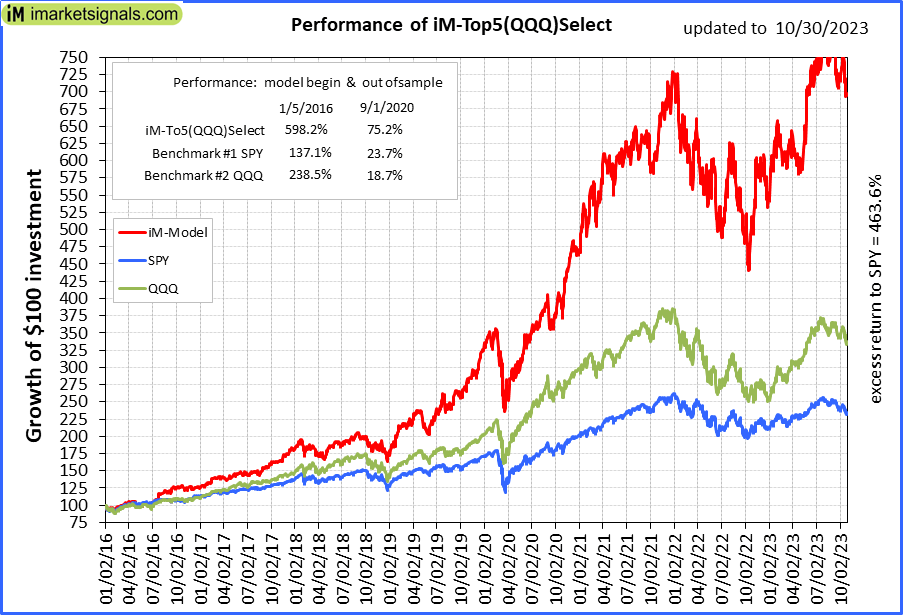 |
iM-Top5(QQQ)Select: Since inception, on 1/5/2016, the model gained 597.35% while the benchmark SPY gained 133.77% over the same period. Over the previous week the market value of iM-Top5(QQQ)Select gained -2.32% at a time when SPY gained -1.16%. A starting capital of $100,000 at inception on 1/5/2016 would have grown to $697,352 which includes -$11 cash and excludes $10,614 spent on fees and slippage. |
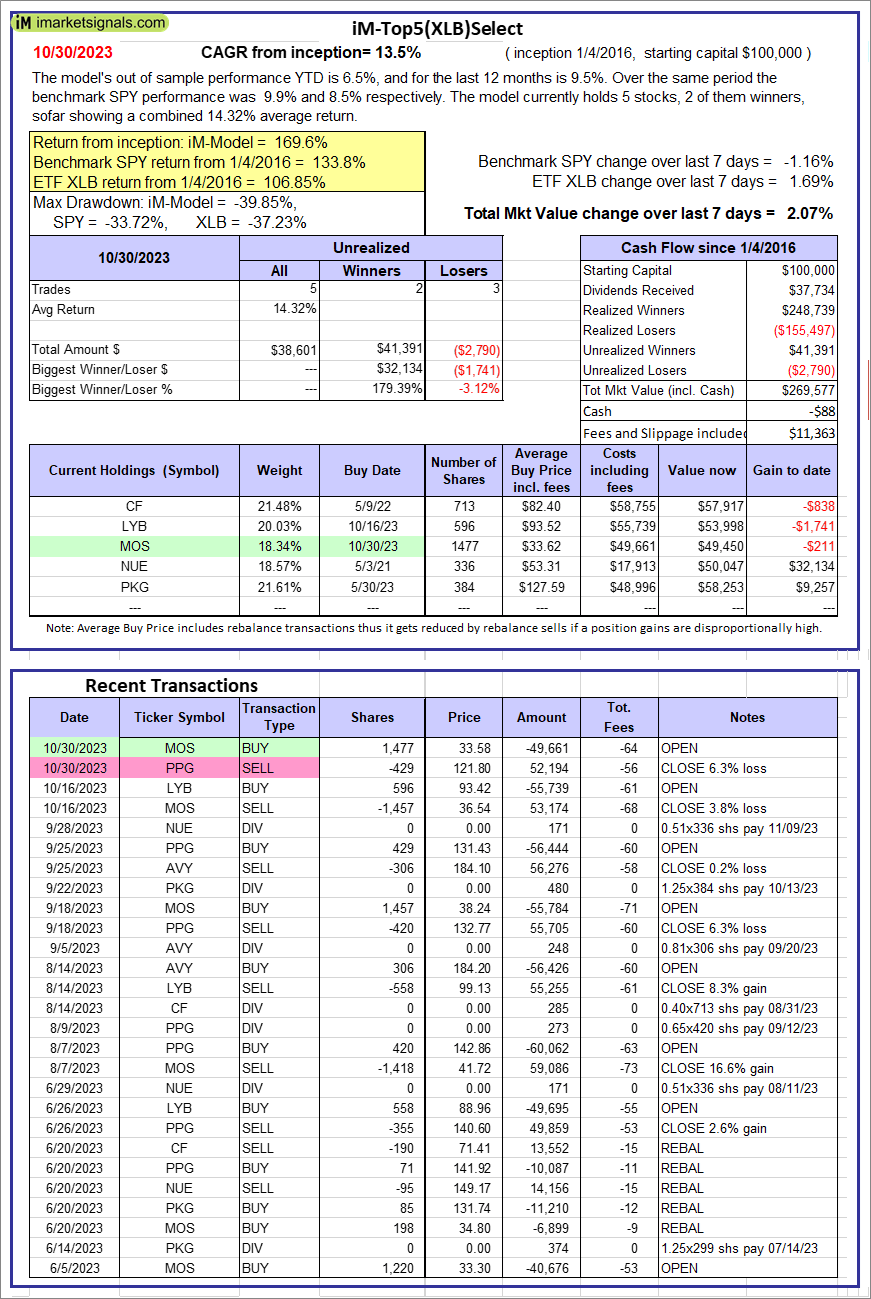 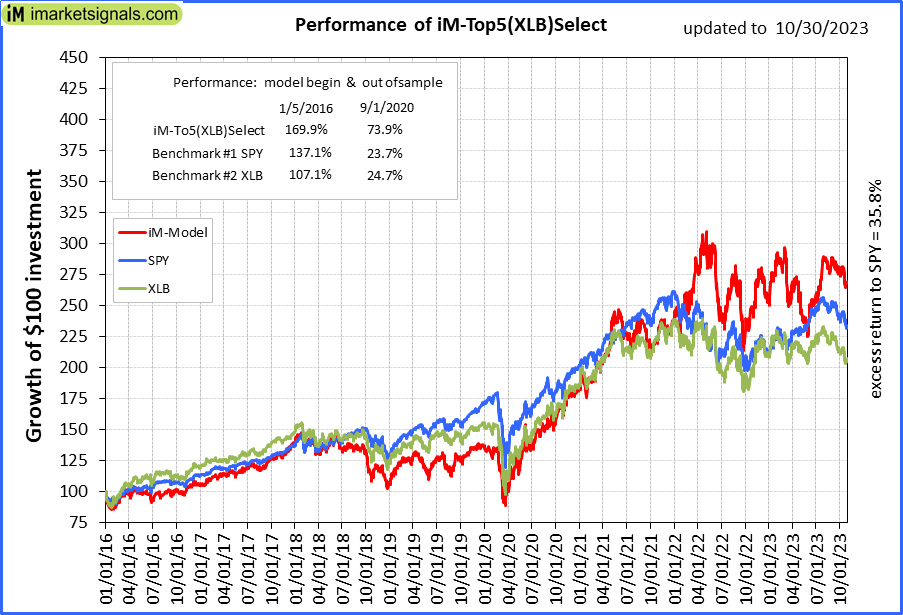 |
iM-Top5(XLB)Select: Since inception, on 1/5/2016, the model gained 169.58% while the benchmark SPY gained 133.77% over the same period. Over the previous week the market value of iM-Top5(XLB)Select gained 2.07% at a time when SPY gained -1.16%. A starting capital of $100,000 at inception on 1/5/2016 would have grown to $269,577 which includes -$88 cash and excludes $11,363 spent on fees and slippage. |
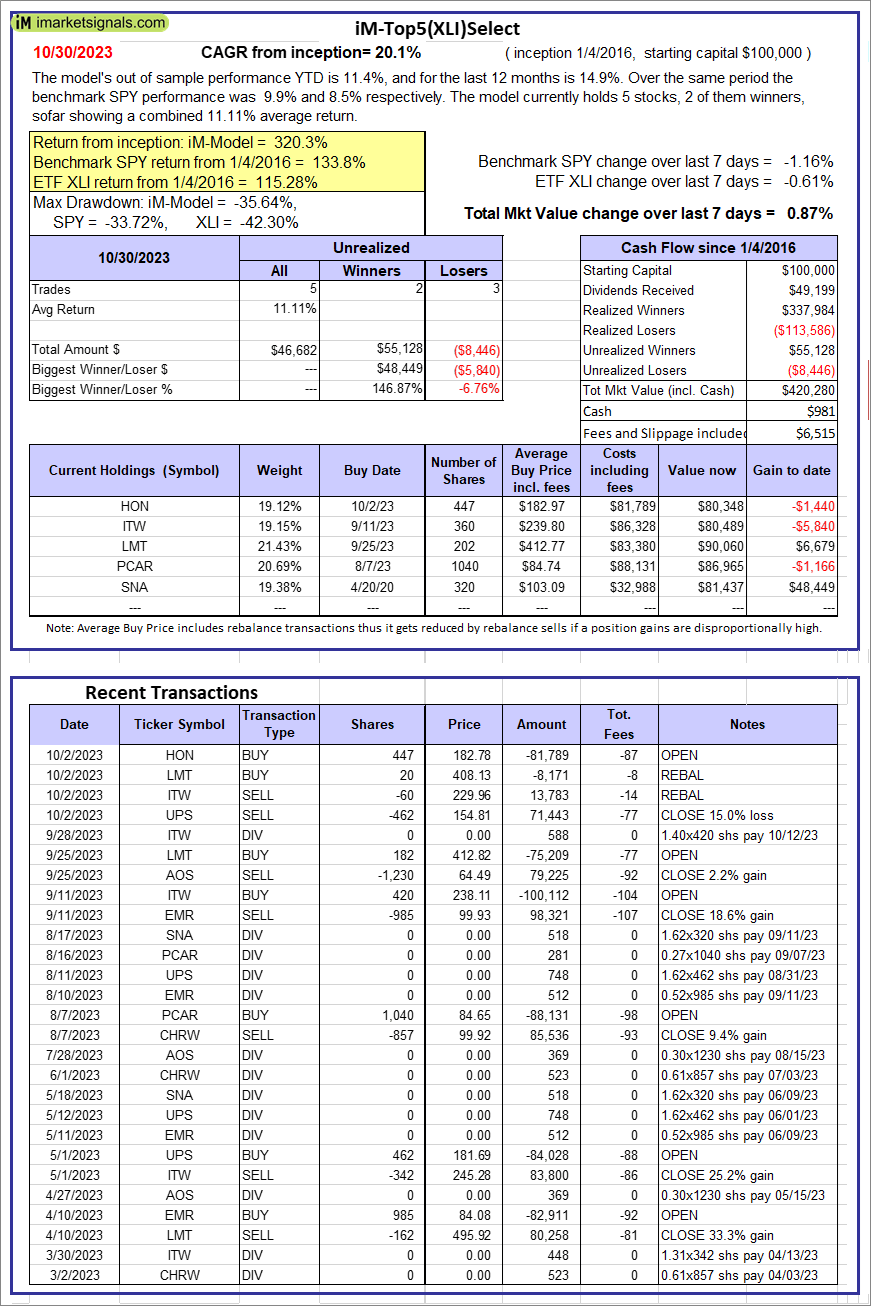 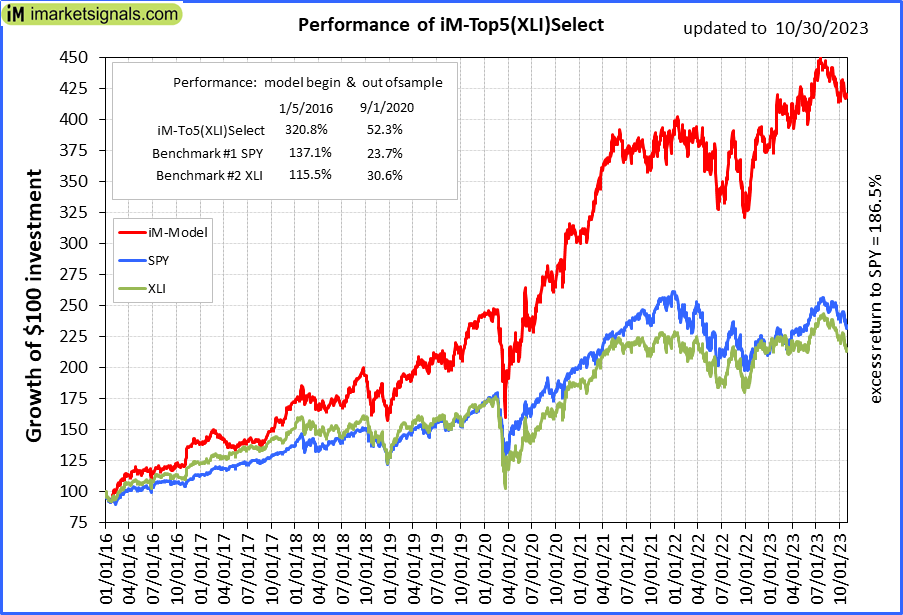 |
iM-Top5(XLI)Select: Since inception, on 1/5/2016, the model gained 320.28% while the benchmark SPY gained 133.77% over the same period. Over the previous week the market value of iM-Top5(XLI)Select gained 0.87% at a time when SPY gained -1.16%. A starting capital of $100,000 at inception on 1/5/2016 would have grown to $420,280 which includes $981 cash and excludes $6,515 spent on fees and slippage. |
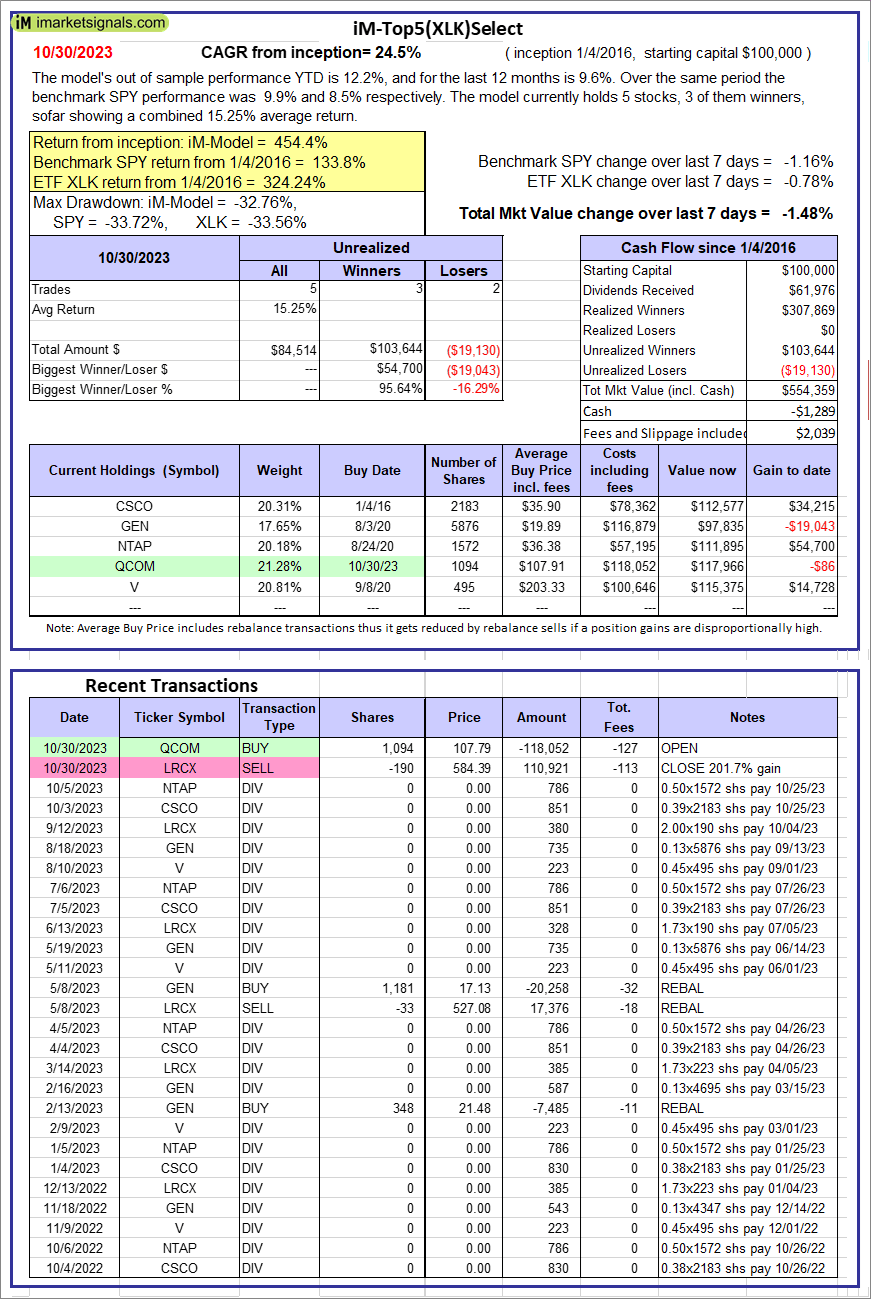 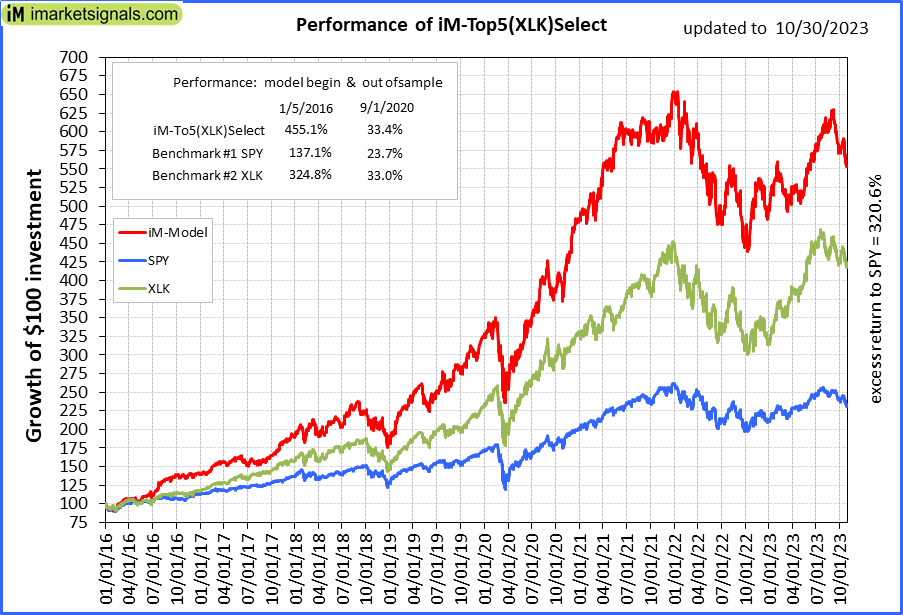 |
iM-Top5(XLK)Select: Since inception, on 1/5/2016, the model gained 454.36% while the benchmark SPY gained 133.77% over the same period. Over the previous week the market value of iM-Top5(XLK)Select gained -1.48% at a time when SPY gained -1.16%. A starting capital of $100,000 at inception on 1/5/2016 would have grown to $554,359 which includes -$1,289 cash and excludes $2,039 spent on fees and slippage. |
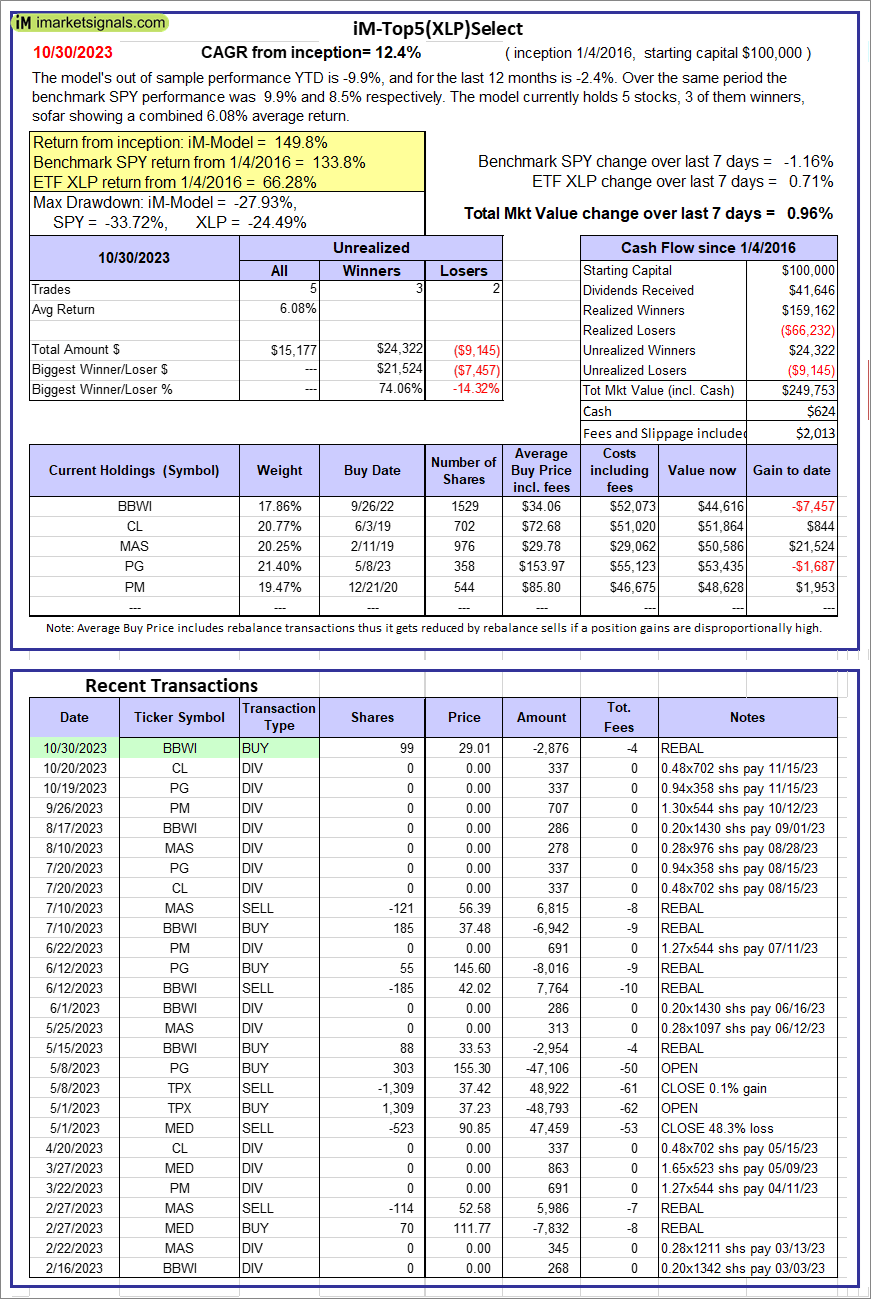  |
iM-Top5(XLP)Select: Since inception, on 1/5/2016, the model gained 149.75% while the benchmark SPY gained 133.77% over the same period. Over the previous week the market value of iM-Top5(XLP)Select gained 0.96% at a time when SPY gained -1.16%. A starting capital of $100,000 at inception on 1/5/2016 would have grown to $249,753 which includes $624 cash and excludes $2,013 spent on fees and slippage. |
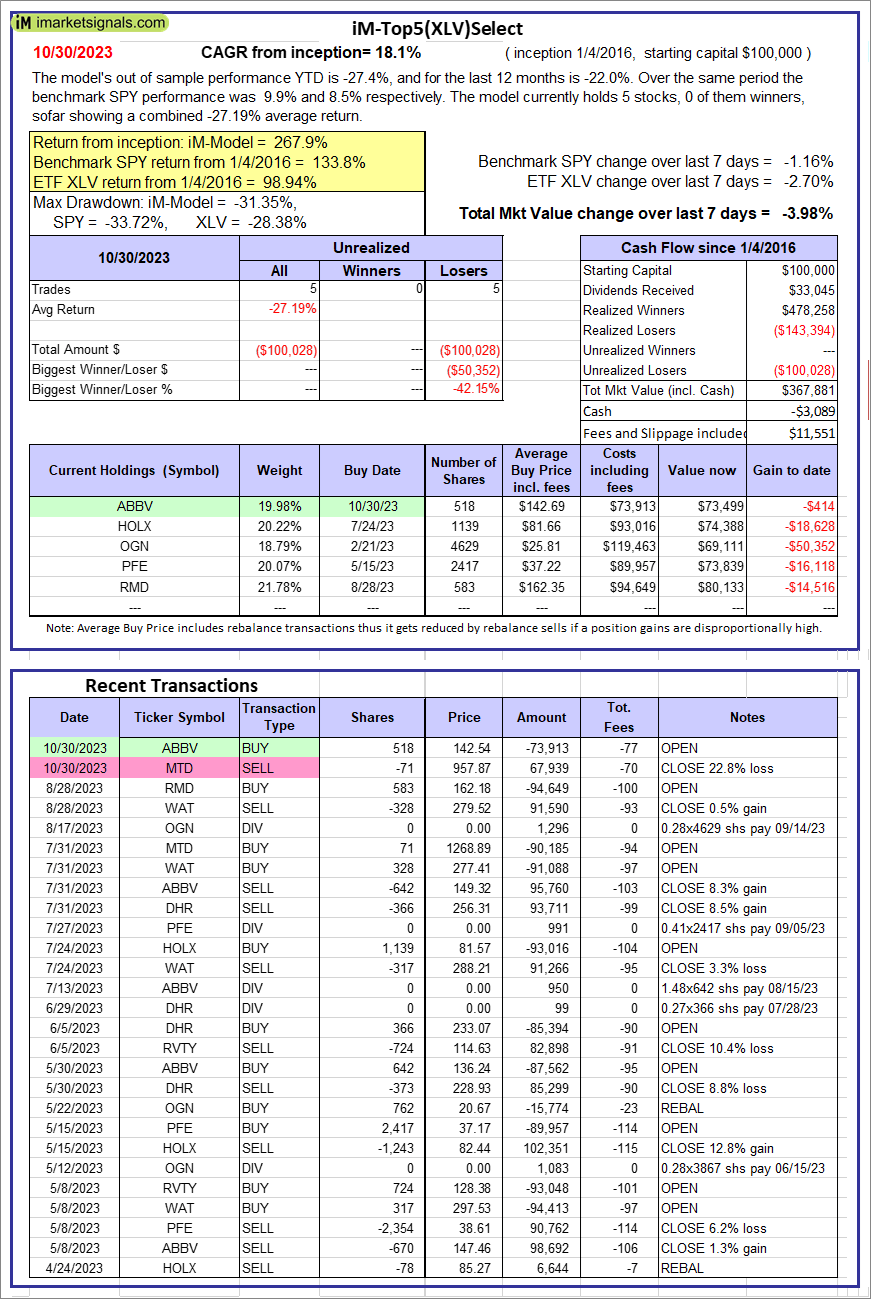 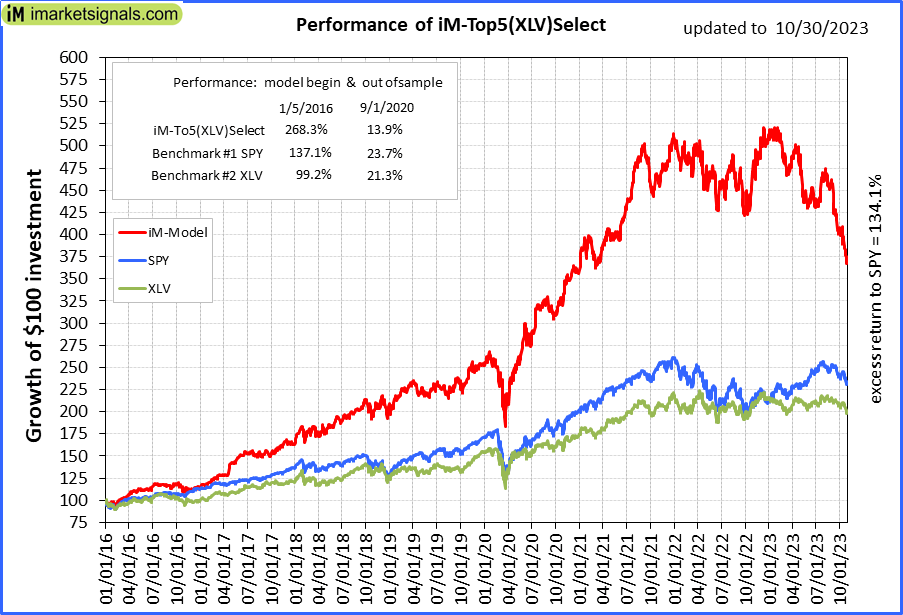 |
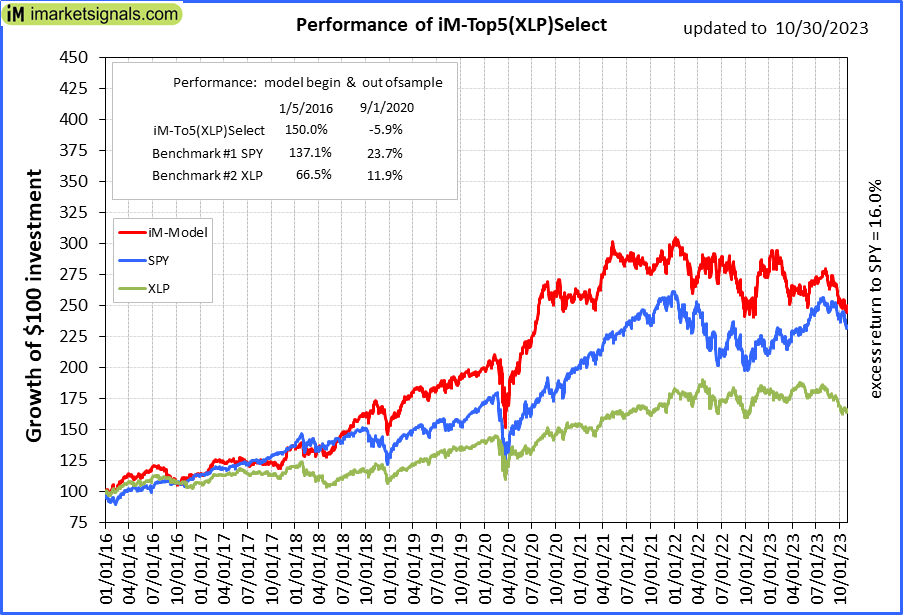
iM-Top5(XLV)Select: Since inception, on 1/5/2016, the model gained 267.88% while the benchmark SPY gained 133.77% over the same period. Over the previous week the market value of iM-Top5(XLV)Select gained -3.98% at a time when SPY gained -1.16%. A starting capital of $100,000 at inception on 1/5/2016 would have grown to $367,881 which includes -$3,089 cash and excludes $11,551 spent on fees and slippage. |
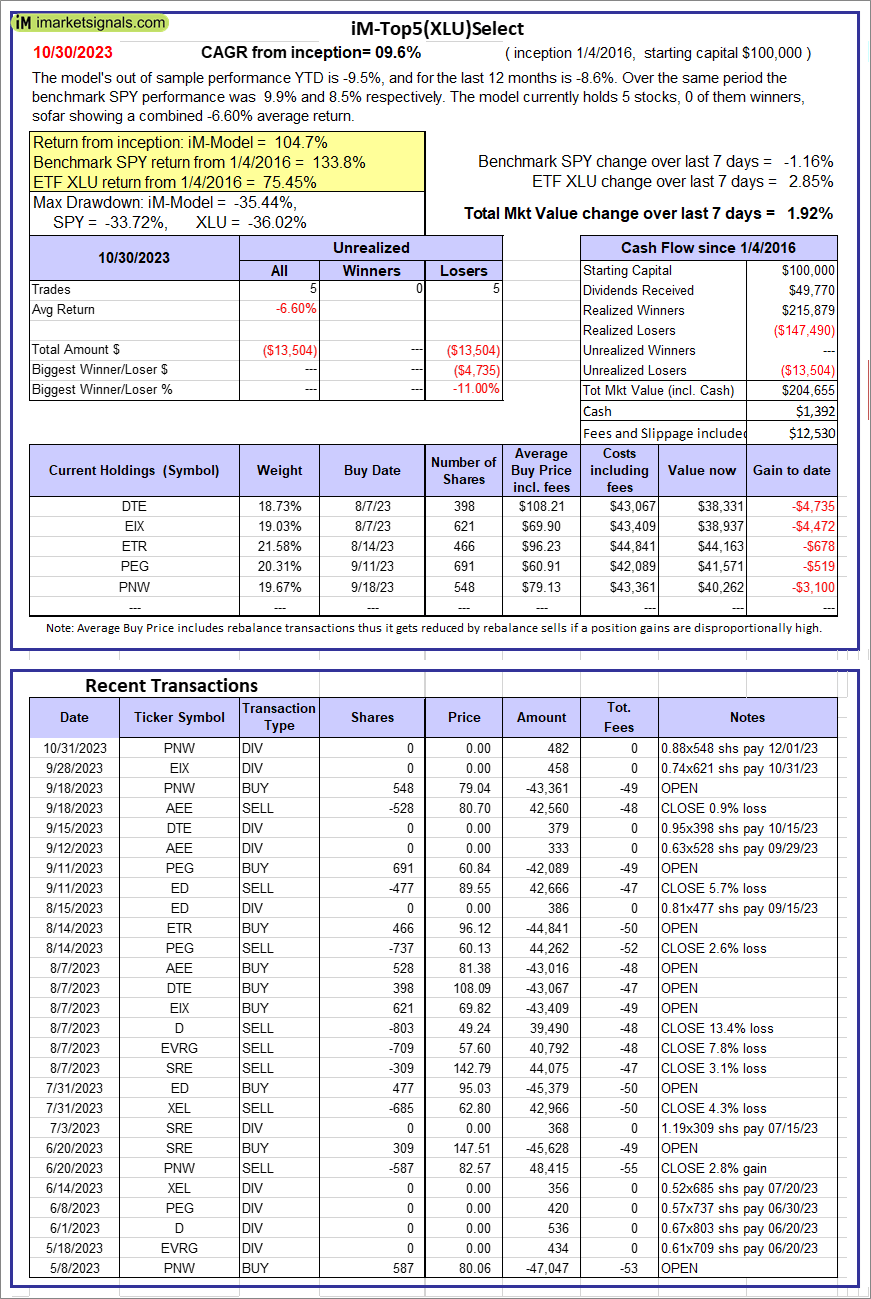 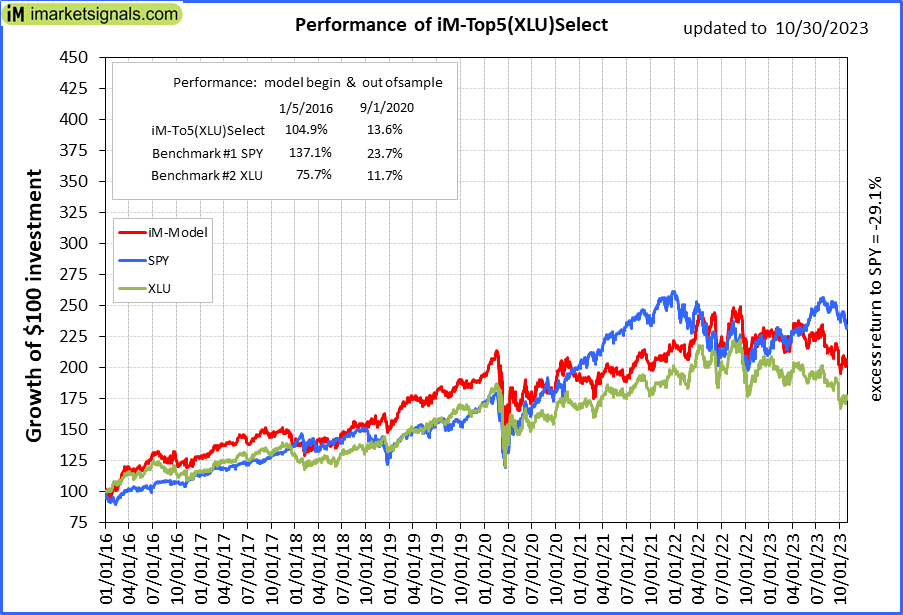 |
iM-Top5(XLU)Select: Since inception, on 1/5/2016, the model gained 104.65% while the benchmark SPY gained 133.77% over the same period. Over the previous week the market value of iM-Top5(XLU)Select gained 1.92% at a time when SPY gained -1.16%. A starting capital of $100,000 at inception on 1/5/2016 would have grown to $204,655 which includes $1,392 cash and excludes $12,530 spent on fees and slippage. |
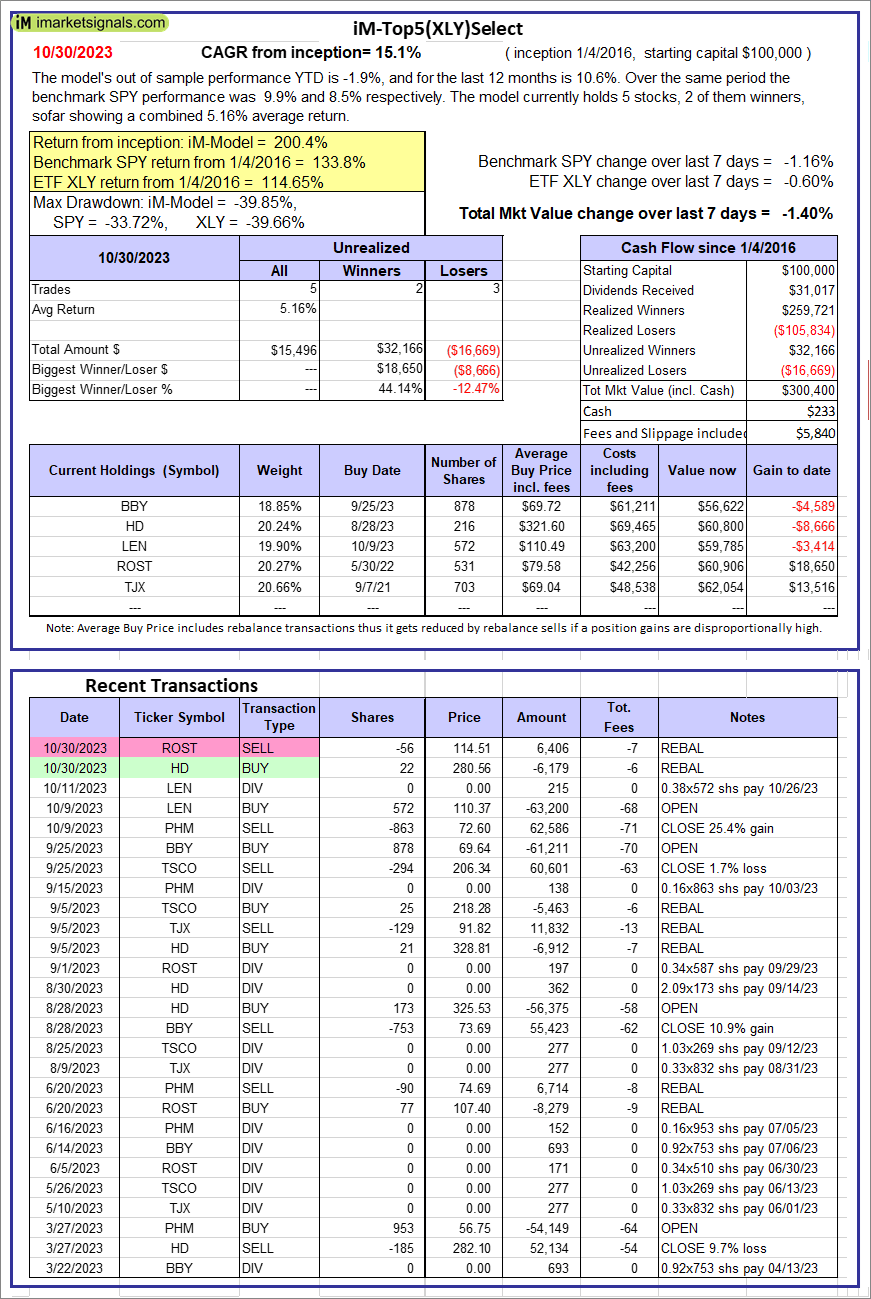 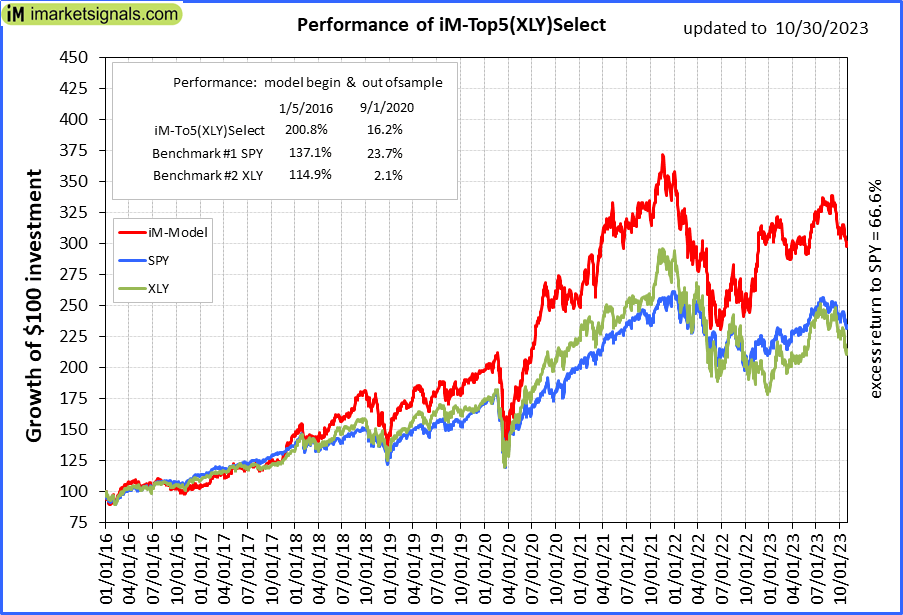 |
iM-Top5(XLY)Select: Since inception, on 1/5/2016, the model gained 200.40% while the benchmark SPY gained 133.77% over the same period. Over the previous week the market value of iM-Top5(XLY)Select gained -1.40% at a time when SPY gained -1.16%. A starting capital of $100,000 at inception on 1/5/2016 would have grown to $300,400 which includes $233 cash and excludes $5,840 spent on fees and slippage. |
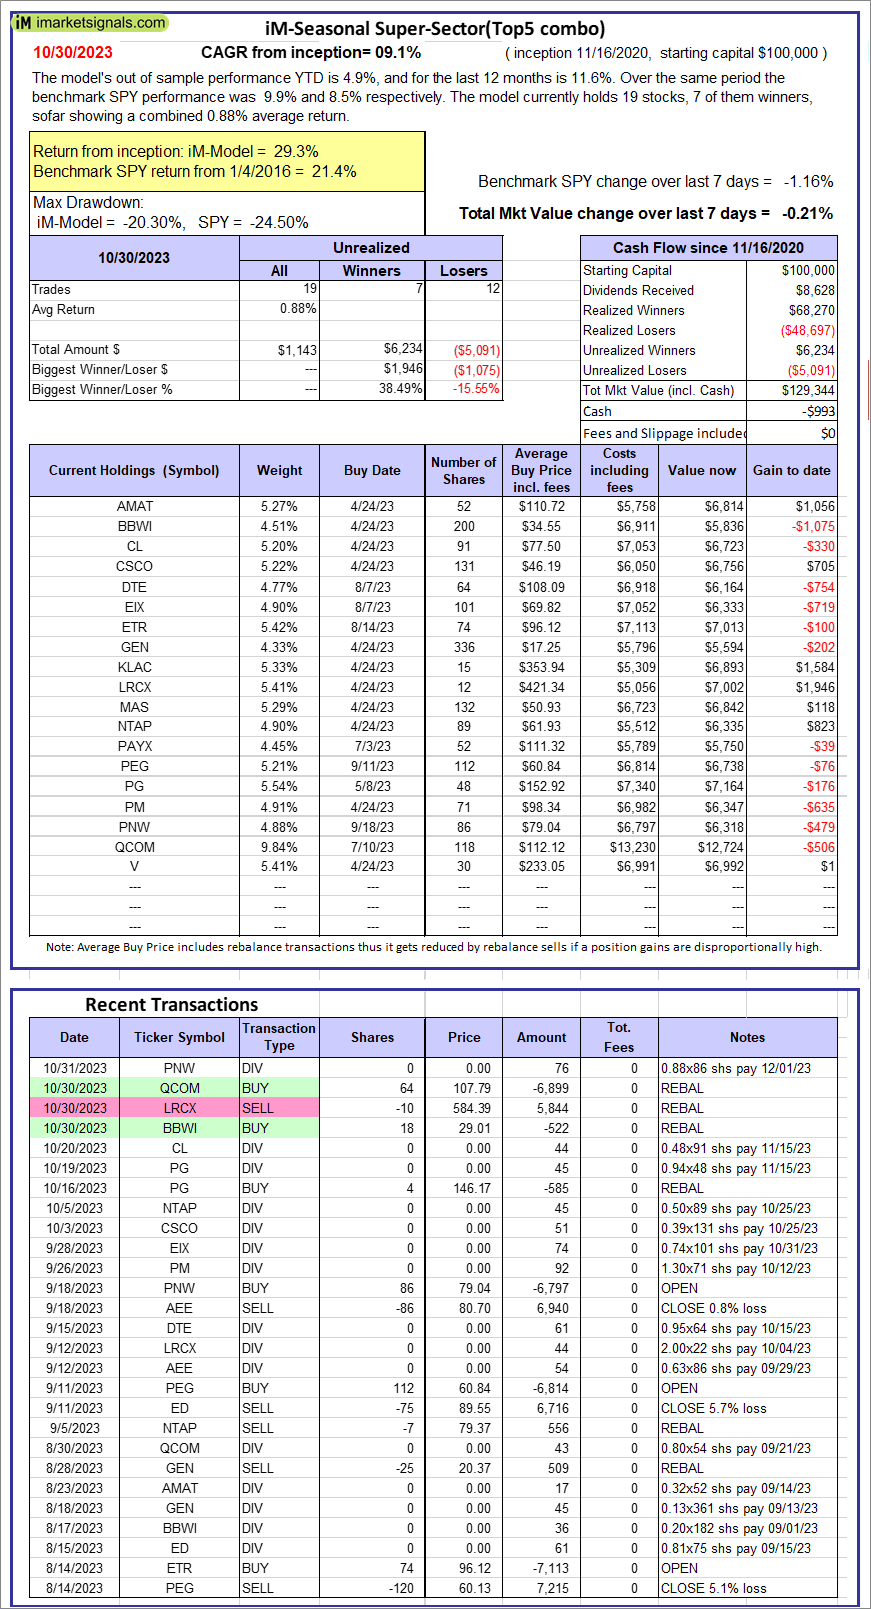 |
iM-Seasonal Super-Sectors (Top5 combo) : Since inception, on 11/17/2020, the model gained 29.34% while the benchmark SPY gained 21.35% over the same period. Over the previous week the market value of iM-Seasonal Super-Sectors (Top5 combo) gained -0.21% at a time when SPY gained -1.16%. A starting capital of $100,000 at inception on 11/17/2020 would have grown to $129,344 which includes -$993 cash and excludes $00 spent on fees and slippage. |
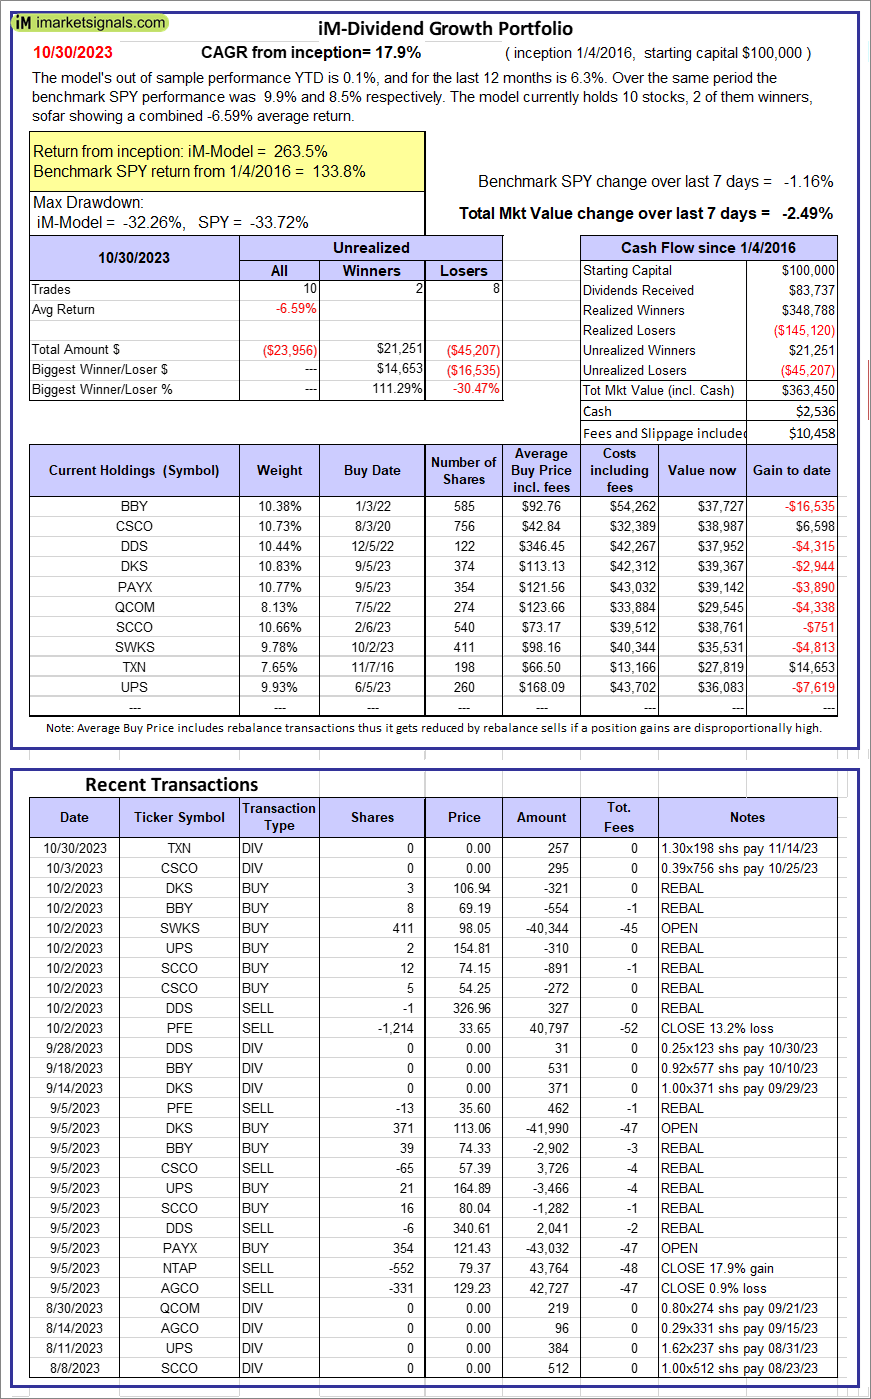 |
iM-Dividend Growth Portfolio: The model’s out of sample performance YTD is 0.1%, and for the last 12 months is 6.3%. Over the same period the benchmark SPY performance was 9.9% and 8.5% respectively. Over the previous week the market value of the iM-Dividend Growth Portfolio gained -2.49% at a time when SPY gained -1.16%. A starting capital of $100,000 at inception on 6/30/2016 would have grown to $363,450 which includes $2,536 cash and excludes $10,458 spent on fees and slippage. |
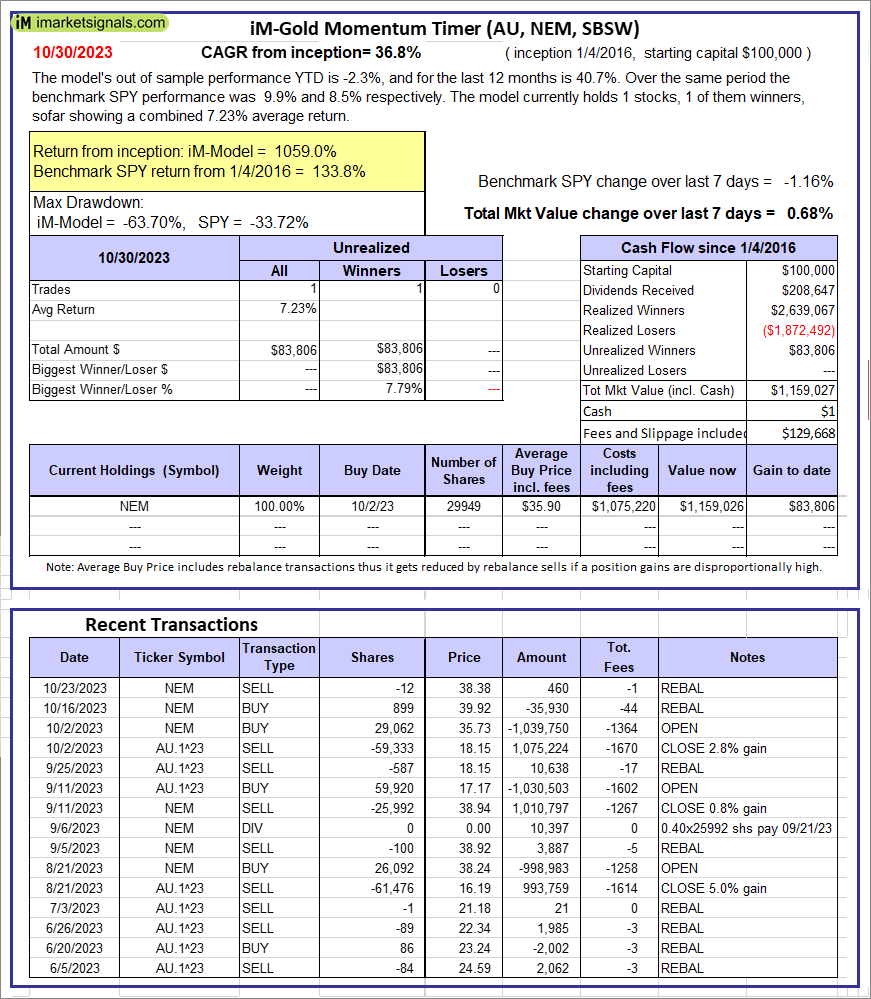 |
iM-Gold Momentum Timer (AU, NEM, SBSW): The model’s out of sample performance YTD is -2.3%, and for the last 12 months is 40.7%. Over the same period the benchmark SPY performance was 9.9% and 8.5% respectively. Over the previous week the market value of iM-Gold Momentum Timer (AU, NEM, SBSW) gained 0.68% at a time when SPY gained -1.16%. A starting capital of $100,000 at inception on 6/30/2016 would have grown to $01 which includes $129,668 cash and excludes Gain to date spent on fees and slippage. |
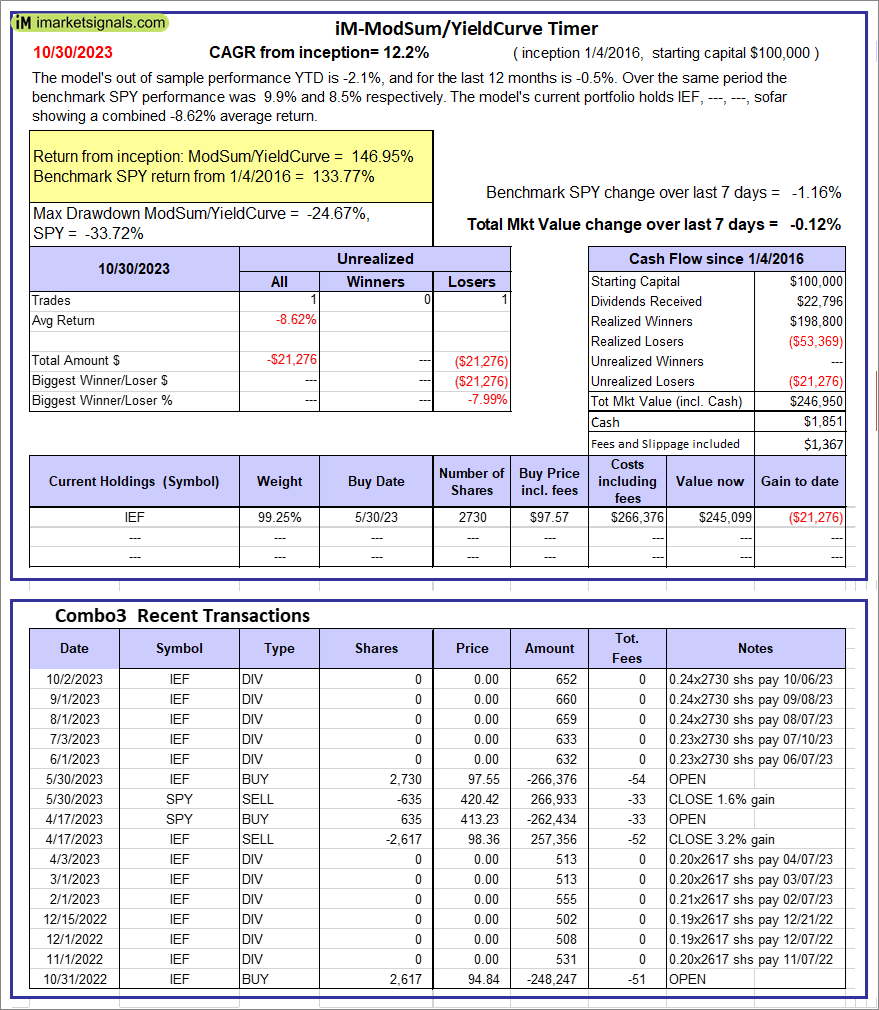 |
iM-ModSum/YieldCurve Timer: The model’s out of sample performance YTD is -2.1%, and for the last 12 months is -0.5%. Over the same period the benchmark SPY performance was 9.9% and 8.5% respectively. Over the previous week the market value of iM-PortSum/YieldCurve Timer gained -0.12% at a time when SPY gained -1.16%. A starting capital of $100,000 at inception on 1/1/2016 would have grown to $246,950 which includes $1,851 cash and excludes $1,367 spent on fees and slippage. |
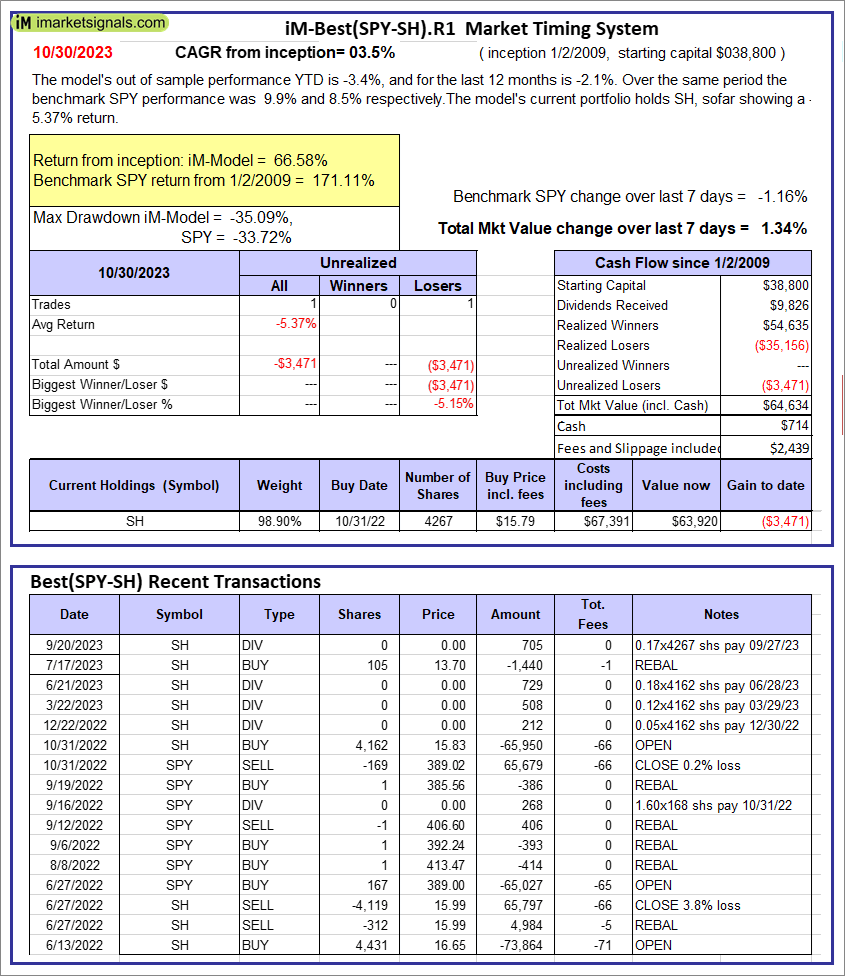 |
iM-Best(SPY-SH).R1: The model’s out of sample performance YTD is -3.4%, and for the last 12 months is -2.1%. Over the same period the benchmark SPY performance was 9.9% and 8.5% respectively. Over the previous week the market value of Best(SPY-SH) gained 1.34% at a time when SPY gained -1.16%. A starting capital of $100,000 at inception on 1/2/2009 would have grown to $64,634 which includes $714 cash and excludes $2,439 spent on fees and slippage. |
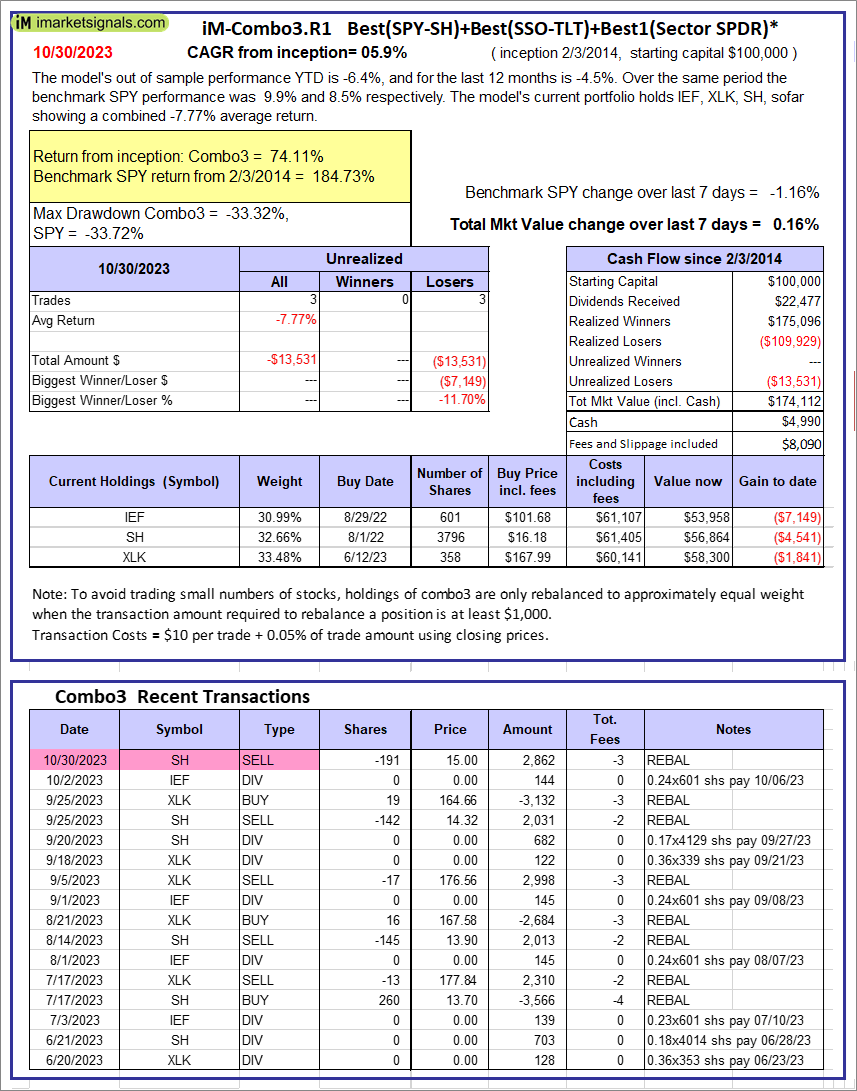 |
iM-Combo3.R1: The model’s out of sample performance YTD is -6.4%, and for the last 12 months is -4.5%. Over the same period the benchmark SPY performance was 9.9% and 8.5% respectively. Over the previous week the market value of iM-Combo3.R1 gained 0.16% at a time when SPY gained -1.16%. A starting capital of $100,000 at inception on 2/3/2014 would have grown to $174,112 which includes $4,990 cash and excludes $8,090 spent on fees and slippage. |
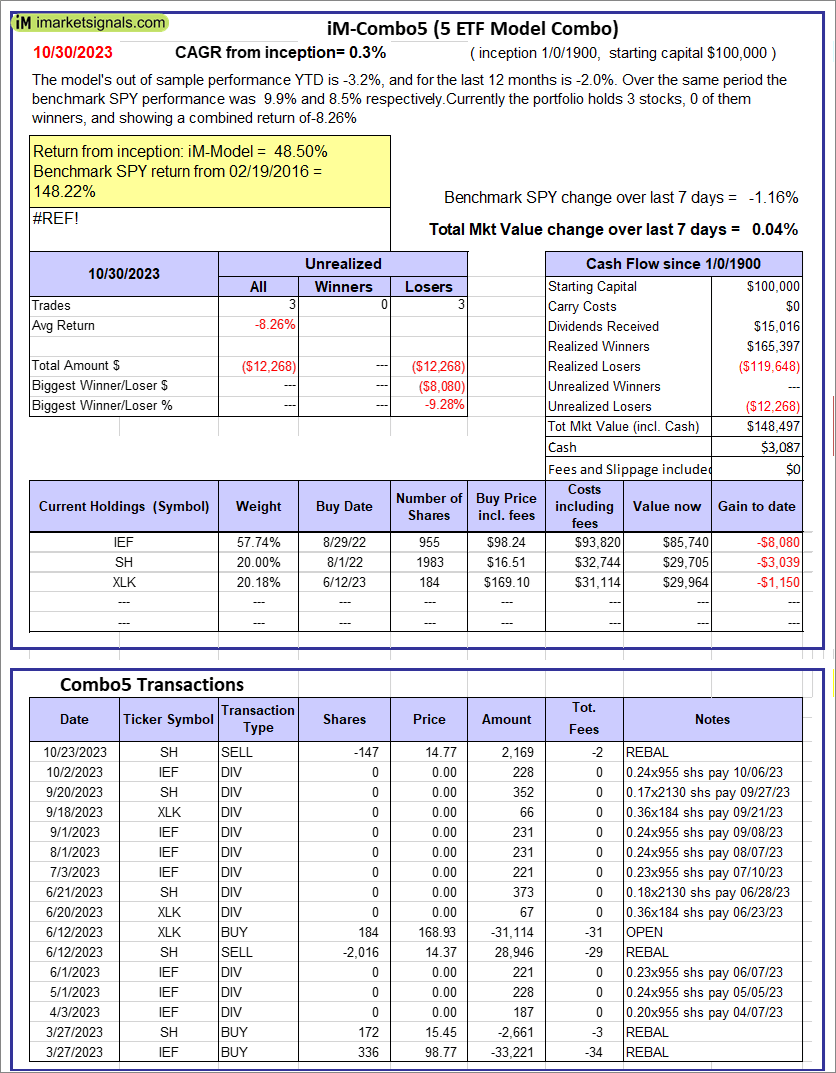 |
iM-Combo5: The model’s out of sample performance YTD is -3.2%, and for the last 12 months is -2.0%. Over the same period the benchmark SPY performance was 9.9% and 8.5% respectively. Over the previous week the market value of iM-Combo5 gained 0.04% at a time when SPY gained -1.16%. A starting capital of $100,000 at inception on 2/22/2016 would have grown to $148,497 which includes $3,087 cash and excludes $0 spent on fees and slippage. |
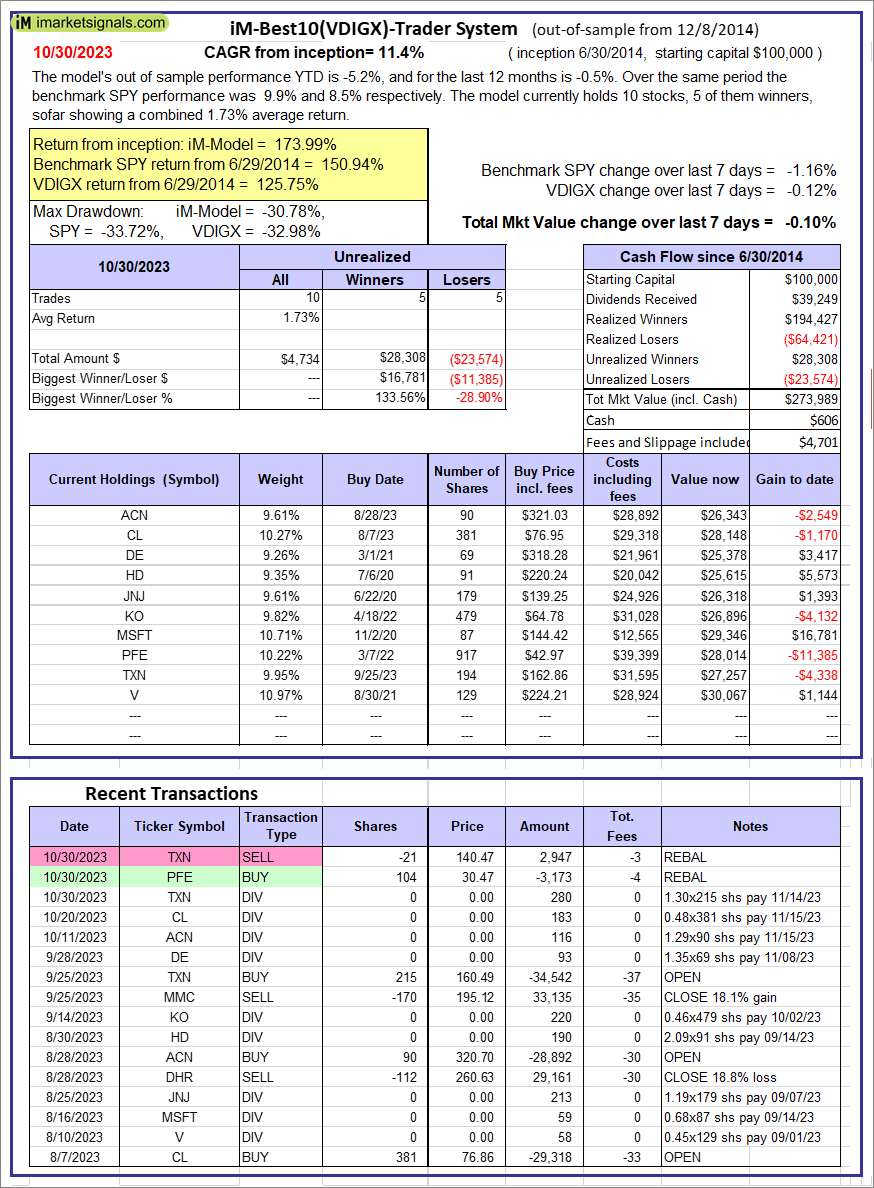 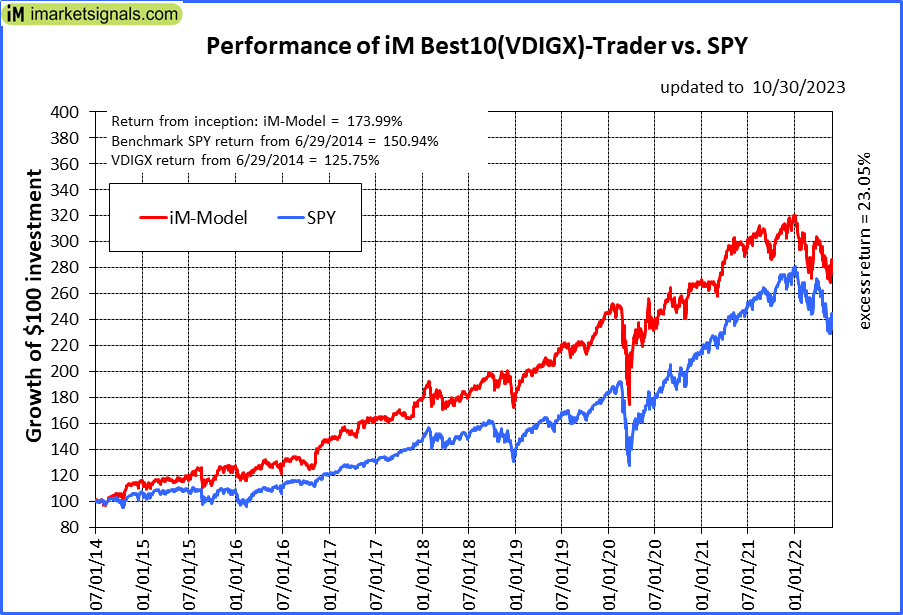 |
iM-Best10(VDIGX)-Trader: The model’s out of sample performance YTD is -5.2%, and for the last 12 months is -0.5%. Over the same period the benchmark SPY performance was 9.9% and 8.5% respectively. Since inception, on 7/1/2014, the model gained 173.99% while the benchmark SPY gained 150.94% and VDIGX gained 125.75% over the same period. Over the previous week the market value of iM-Best10(VDIGX) gained -0.10% at a time when SPY gained -1.16%. A starting capital of $100,000 at inception on 7/1/2014 would have grown to $273,989 which includes $606 cash and excludes $4,701 spent on fees and slippage. |
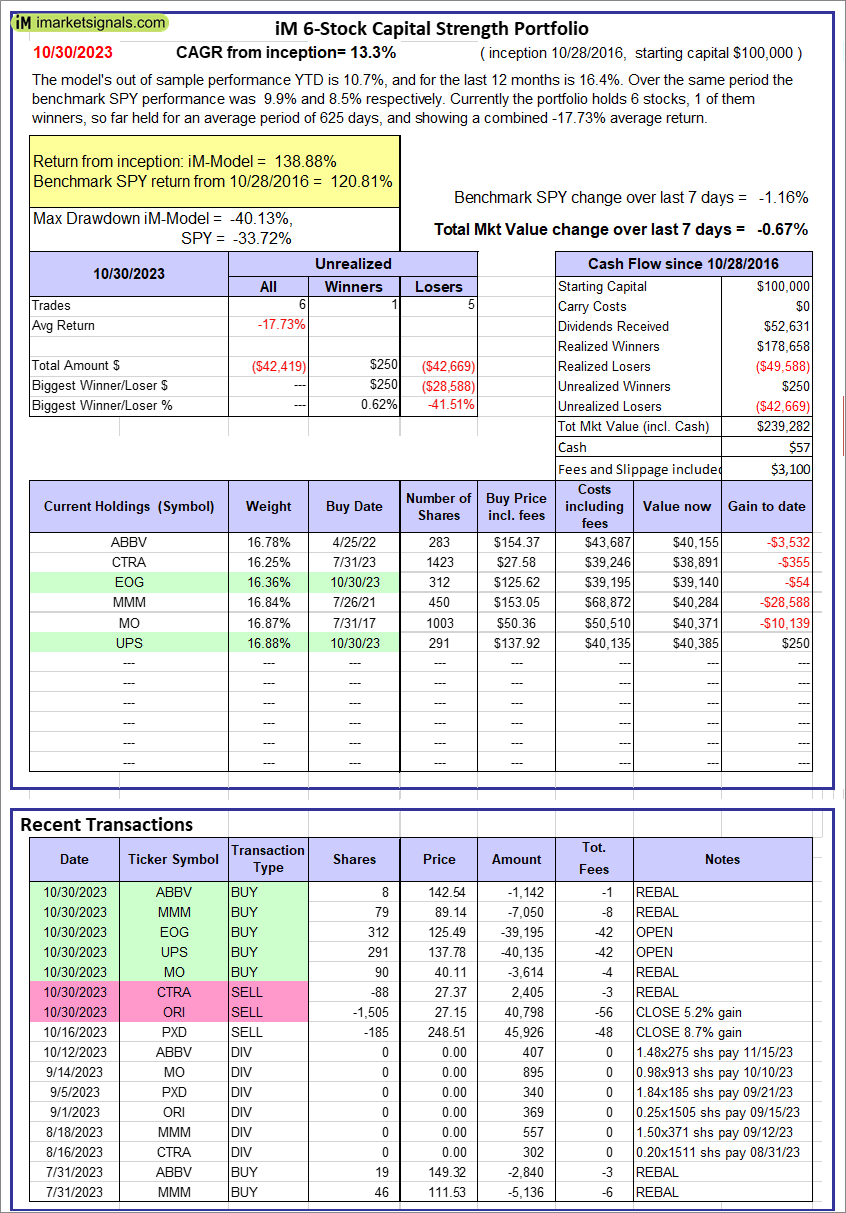 |
iM 6-Stock Capital Strength Portfolio: The model’s out of sample performance YTD is 10.7%, and for the last 12 months is 16.4%. Over the same period the benchmark SPY performance was 9.9% and 8.5% respectively. Over the previous week the market value of the iM 6-Stock Capital Strength Portfolio gained -0.67% at a time when SPY gained -1.16%. A starting capital of $100,000 at inception on 10/28/2016 would have grown to $239,282 which includes $57 cash and excludes $3,100 spent on fees and slippage. |
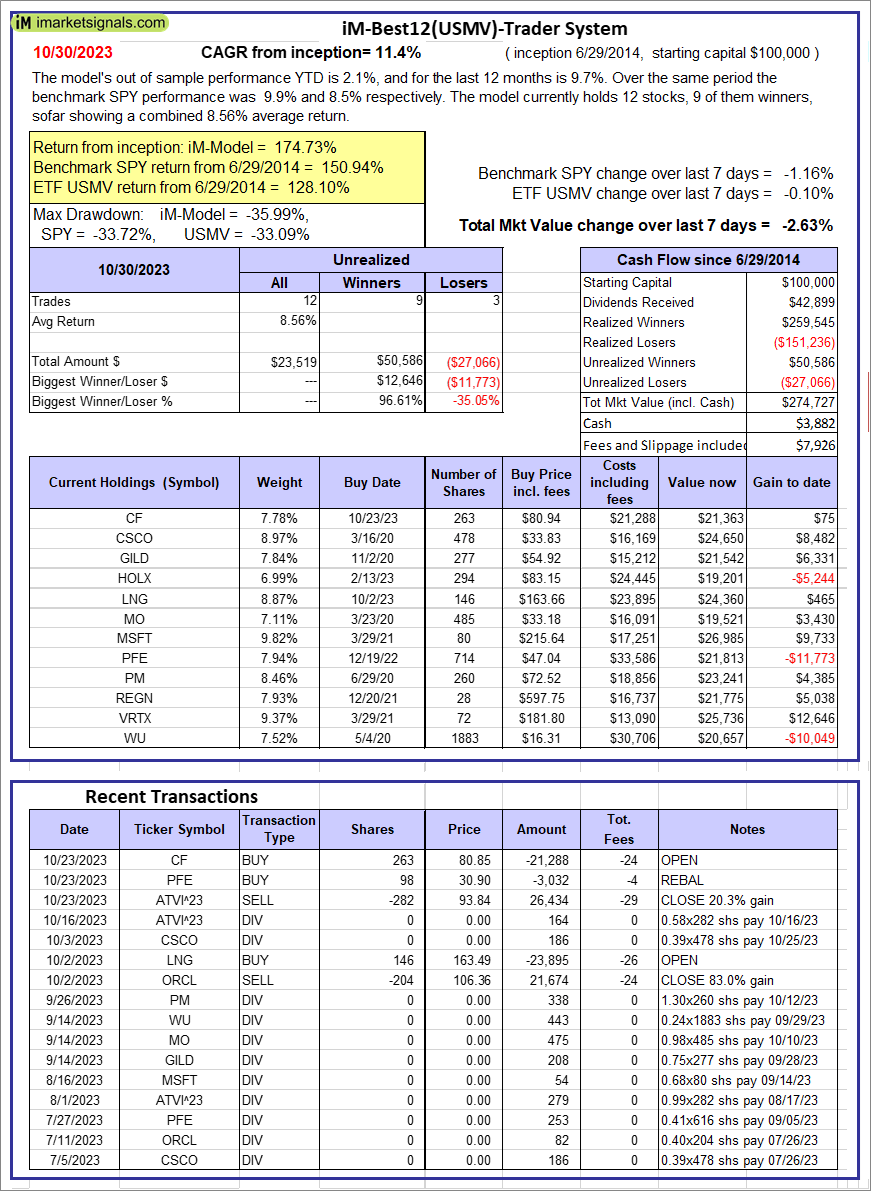 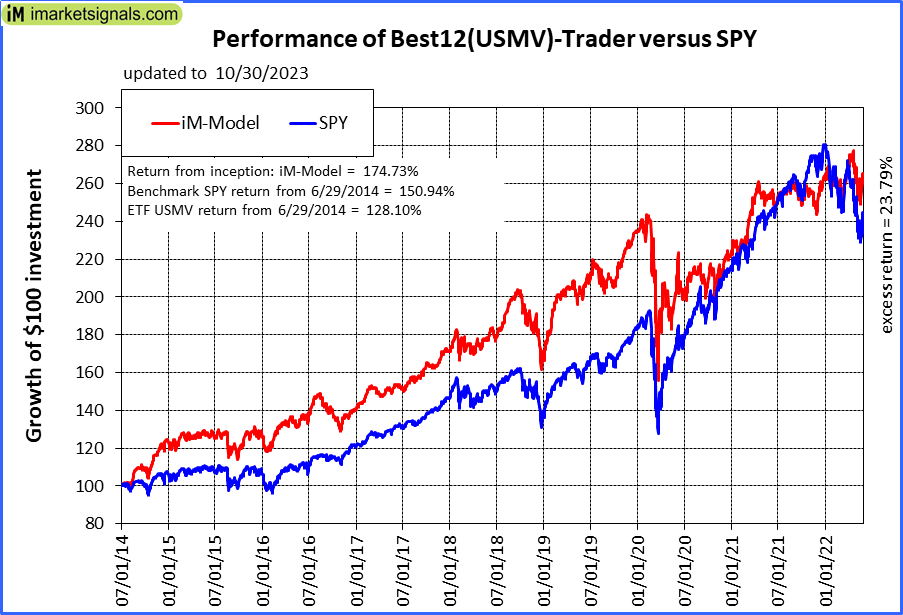 |
iM-Best12(USMV)-Trader: The model’s out of sample performance YTD is 2.1%, and for the last 12 months is 9.7%. Over the same period the benchmark SPY performance was 9.9% and 8.5% respectively. Since inception, on 6/30/2014, the model gained 174.73% while the benchmark SPY gained 150.94% and the ETF USMV gained 128.10% over the same period. Over the previous week the market value of iM-Best12(USMV)-Trader gained -2.63% at a time when SPY gained -1.16%. A starting capital of $100,000 at inception on 6/30/2014 would have grown to $274,727 which includes $3,882 cash and excludes $7,926 spent on fees and slippage. |
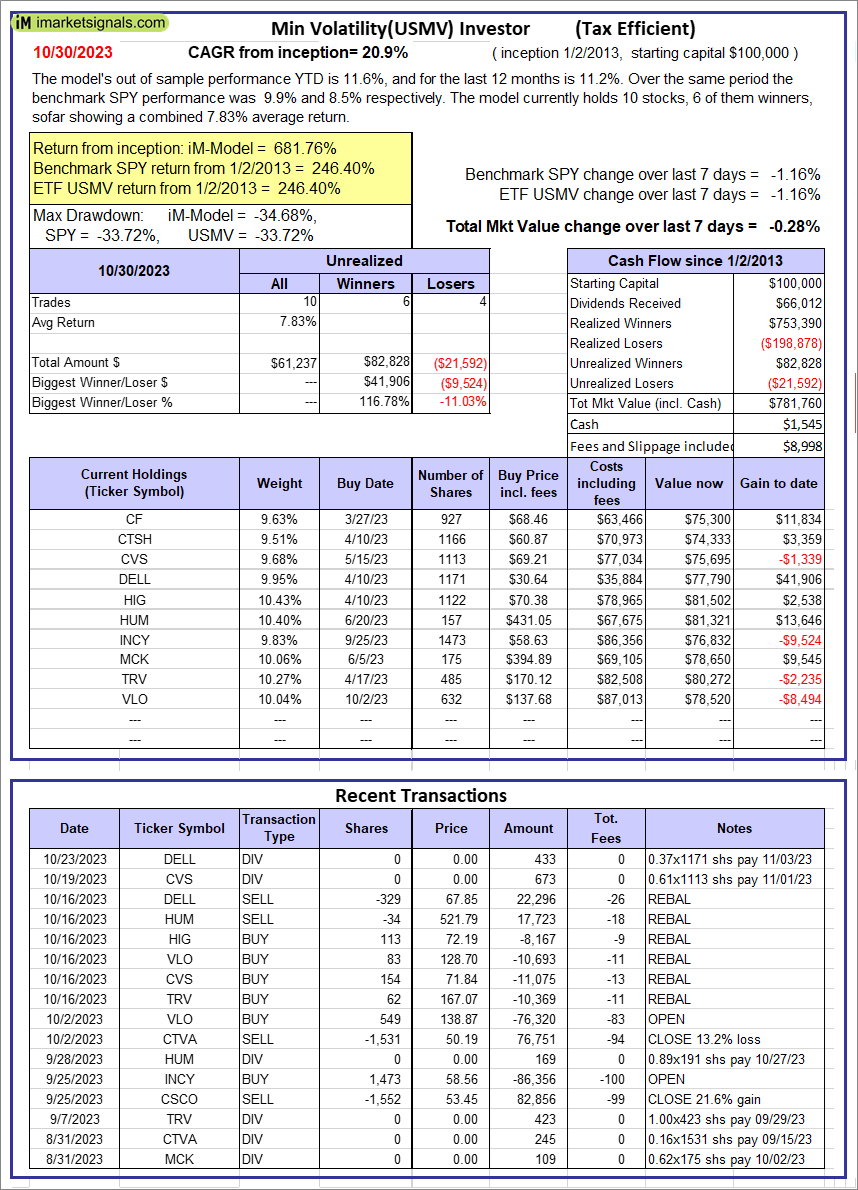 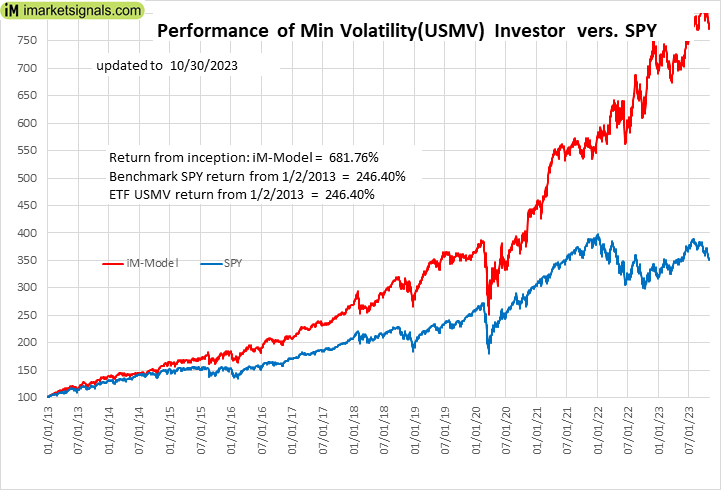 |
iM-Min Volatility(USMV) Investor (Tax Efficient): The model’s out of sample performance YTD is 11.6%, and for the last 12 months is 11.2%. Over the same period the benchmark SPY performance was 9.9% and 8.5% respectively. Since inception, on 1/3/2013, the model gained 681.76% while the benchmark SPY gained 246.40% and the ETF USMV gained 246.40% over the same period. Over the previous week the market value of iM-Best12(USMV)Q1 gained -0.28% at a time when SPY gained -1.16%. A starting capital of $100,000 at inception on 1/3/2013 would have grown to $781,760 which includes $1,545 cash and excludes $8,998 spent on fees and slippage. |
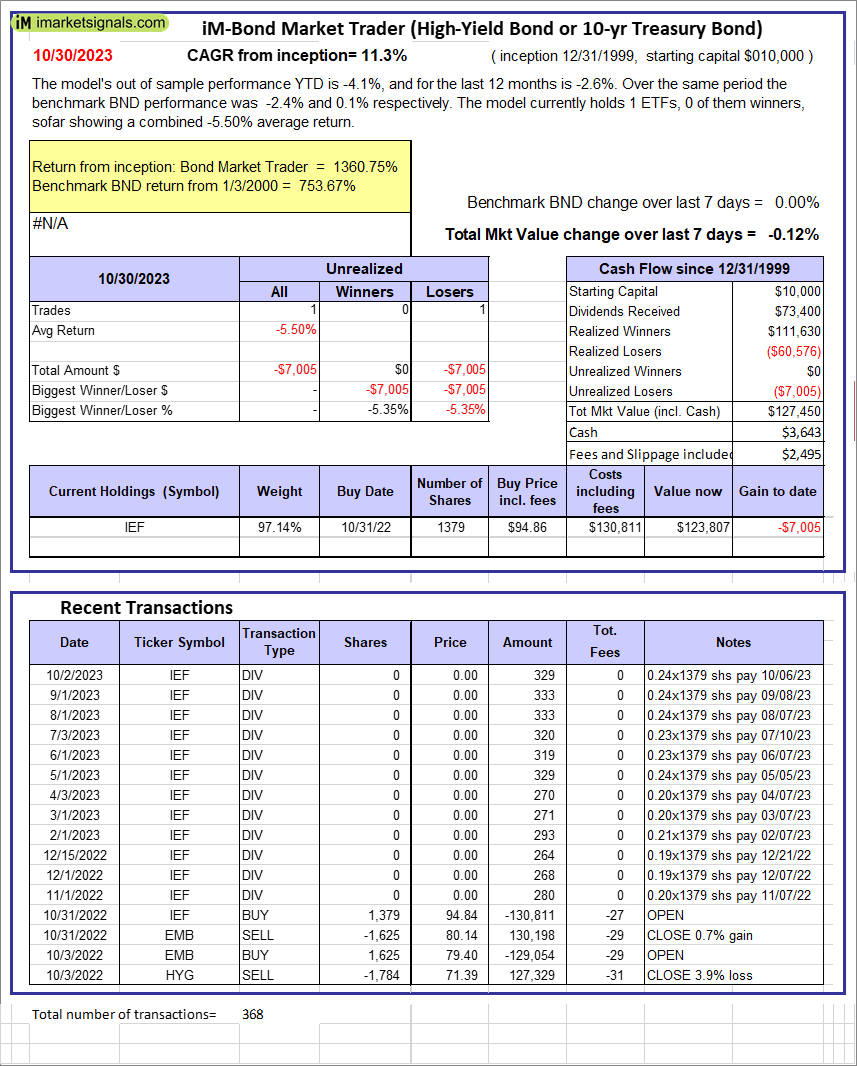 |
iM-Bond Market Trader (High-Yield Bond or 10-yr Treasury Bond): The model’s out of sample performance YTD is -4.1%, and for the last 12 months is -2.6%. Over the same period the benchmark BND performance was -2.4% and 0.1% respectively. Over the previous week the market value of the iM-Bond Market Trader (High-Yield Bond or 10-yr Treasury Bond) gained -0.12% at a time when BND gained 0.00%. A starting capital of $10,000 at inception on 1/3/2000 would have grown to $127,450 which includes $3,643 cash and excludes $2,495 spent on fees and slippage. |
|
|
iM-ModSum/YieldCurve Timer: The model’s out of sample performance YTD is -2.1%, and for the last 12 months is -0.5%. Over the same period the benchmark SPY performance was 9.9% and 8.5% respectively. Over the previous week the market value of iM-PortSum/YieldCurve Timer gained -0.12% at a time when SPY gained -1.16%. A starting capital of $100,000 at inception on 1/1/2016 would have grown to $246,950 which includes $1,851 cash and excludes $1,367 spent on fees and slippage. |
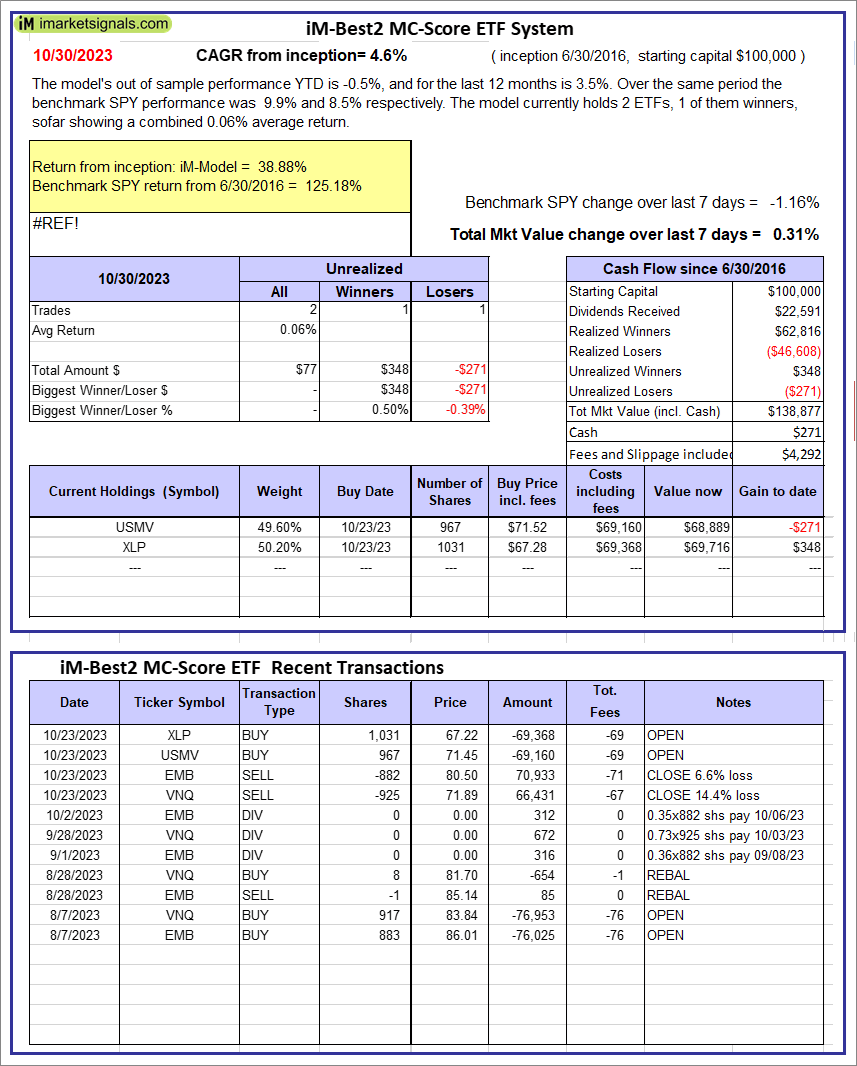 |
iM-Best2 MC-Score ETF System: The model’s out of sample performance YTD is -0.5%, and for the last 12 months is 3.5%. Over the same period the benchmark SPY performance was 9.9% and 8.5% respectively. Over the previous week the market value of the iM-Best2 MC-Score ETF System gained 0.31% at a time when SPY gained -1.16%. A starting capital of $100,000 at inception on 6/30/2016 would have grown to $138,877 which includes $271 cash and excludes $4,292 spent on fees and slippage. |
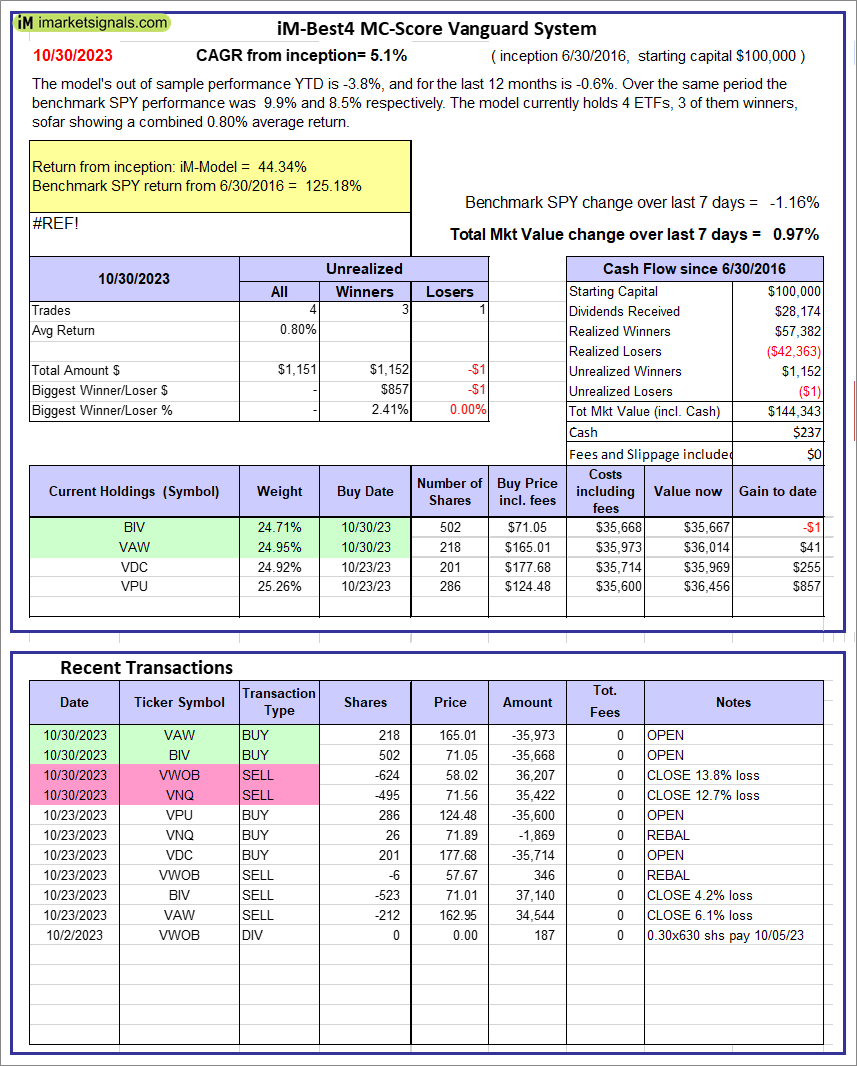 |
iM-Best4 MC-Score Vanguard System: The model’s out of sample performance YTD is -3.8%, and for the last 12 months is -0.6%. Over the same period the benchmark SPY performance was 9.9% and 8.5% respectively. Over the previous week the market value of the iM-Best4 MC-Score Vanguard System gained 0.97% at a time when SPY gained -1.16%. A starting capital of $100,000 at inception on 6/30/2016 would have grown to $144,343 which includes $237 cash and excludes $00 spent on fees and slippage. |
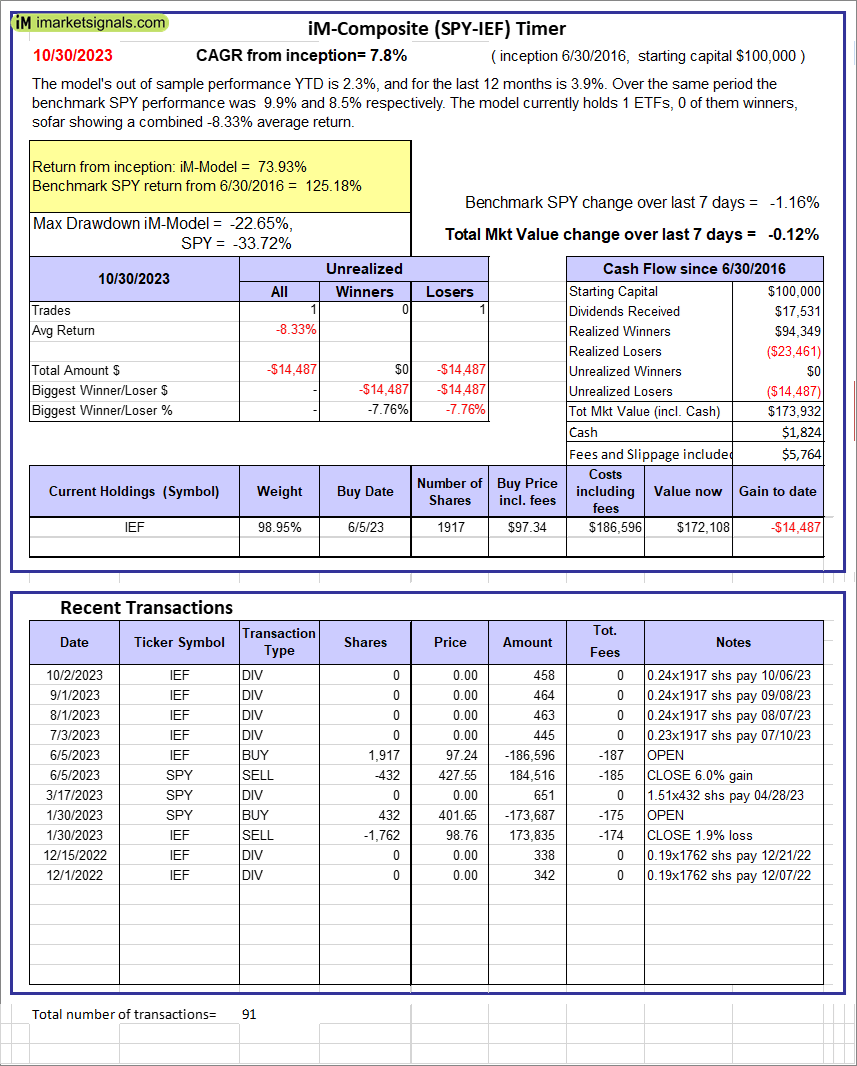 |
iM-Composite (SPY-IEF) Timer: The model’s out of sample performance YTD is 2.3%, and for the last 12 months is 3.9%. Over the same period the benchmark SPY performance was 9.9% and 8.5% respectively. Over the previous week the market value of the iM-Composite (SPY-IEF) Timer gained -0.12% at a time when SPY gained -1.16%. A starting capital of $100,000 at inception on 6/30/2016 would have grown to $173,932 which includes $1,824 cash and excludes $5,764 spent on fees and slippage. |
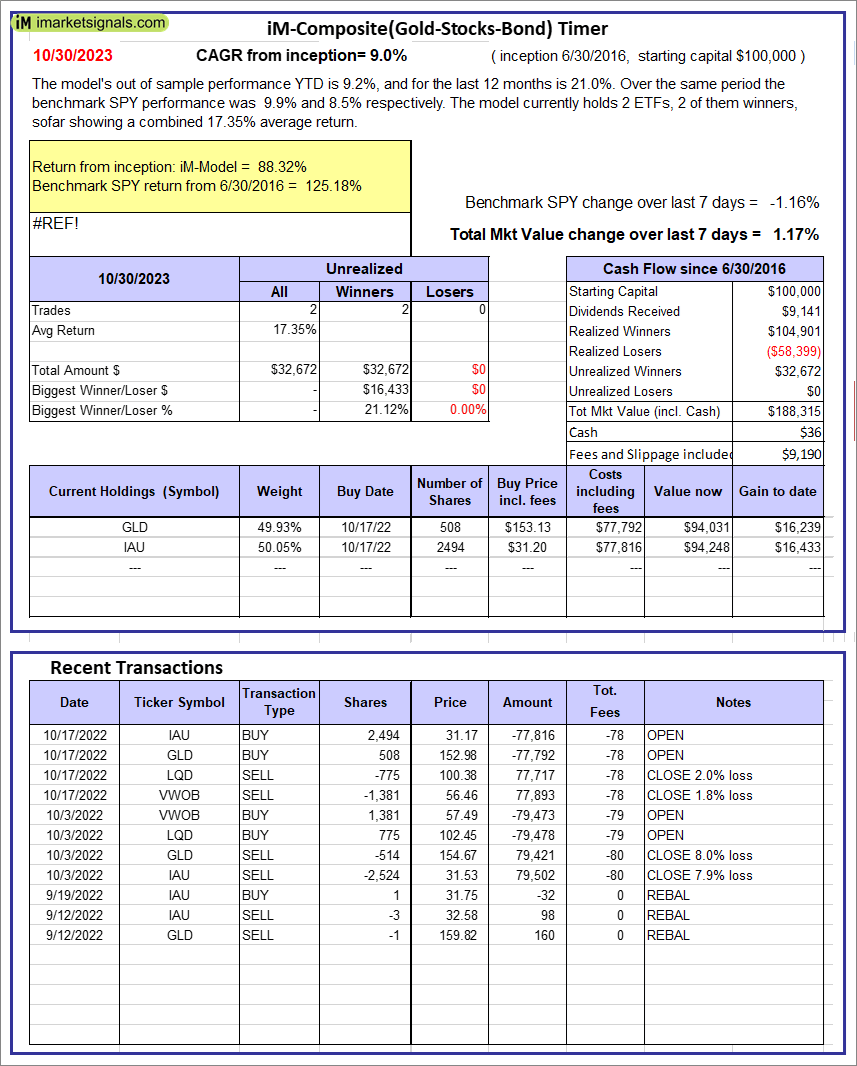 |
iM-Composite(Gold-Stocks-Bond) Timer: The model’s out of sample performance YTD is 9.2%, and for the last 12 months is 21.0%. Over the same period the benchmark SPY performance was 9.9% and 8.5% respectively. Over the previous week the market value of the iM-Composite(Gold-Stocks-Bond) Timer gained 1.17% at a time when SPY gained -1.16%. A starting capital of $100,000 at inception on 6/30/2016 would have grown to $188,315 which includes $36 cash and excludes $9,190 spent on fees and slippage. |
iM-Best Reports – 10/30/2023
Posted in pmp SPY-SH
Leave a Reply
You must be logged in to post a comment.