
  |
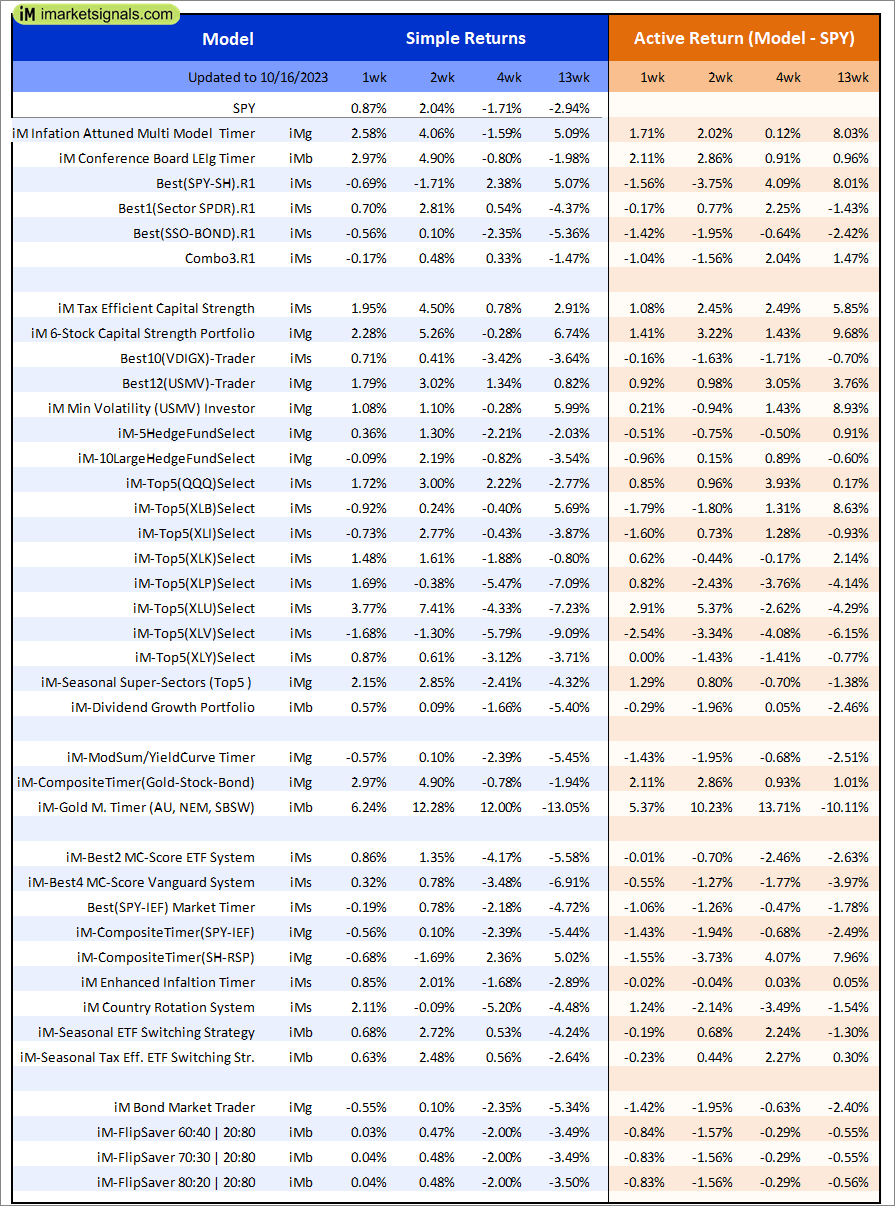
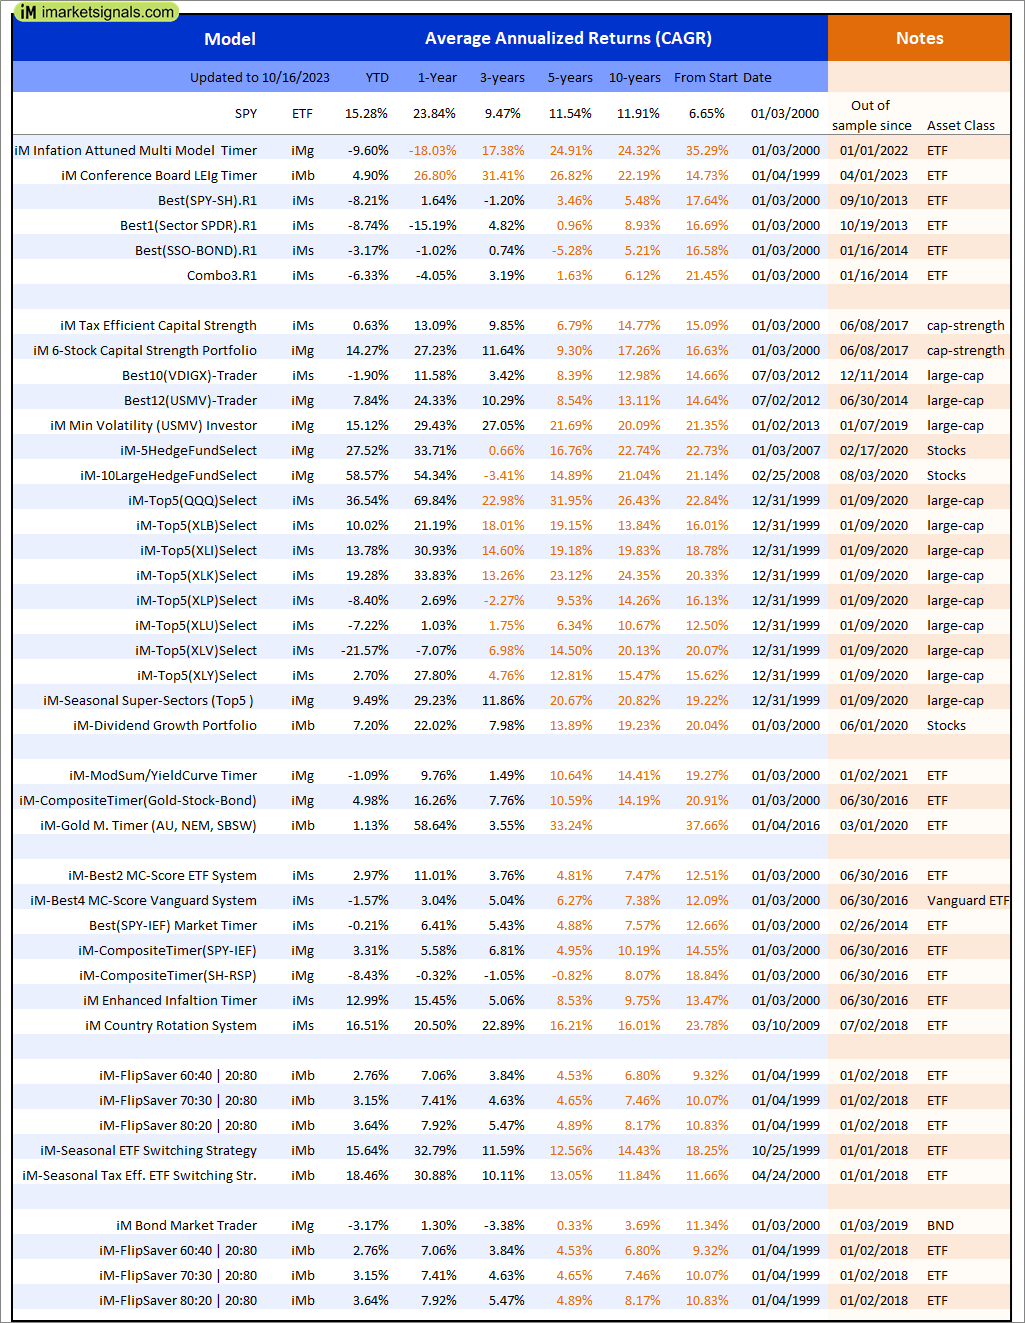
Out of sample performance summary of our models for the past 1, 2, 4 and 13 week periods. The active active return indicates how the models over- or underperformed the benchmark ETF SPY. Also the YTD, and the 1-, 3-, 5- and 10-year annualized returns are shown in the second table |
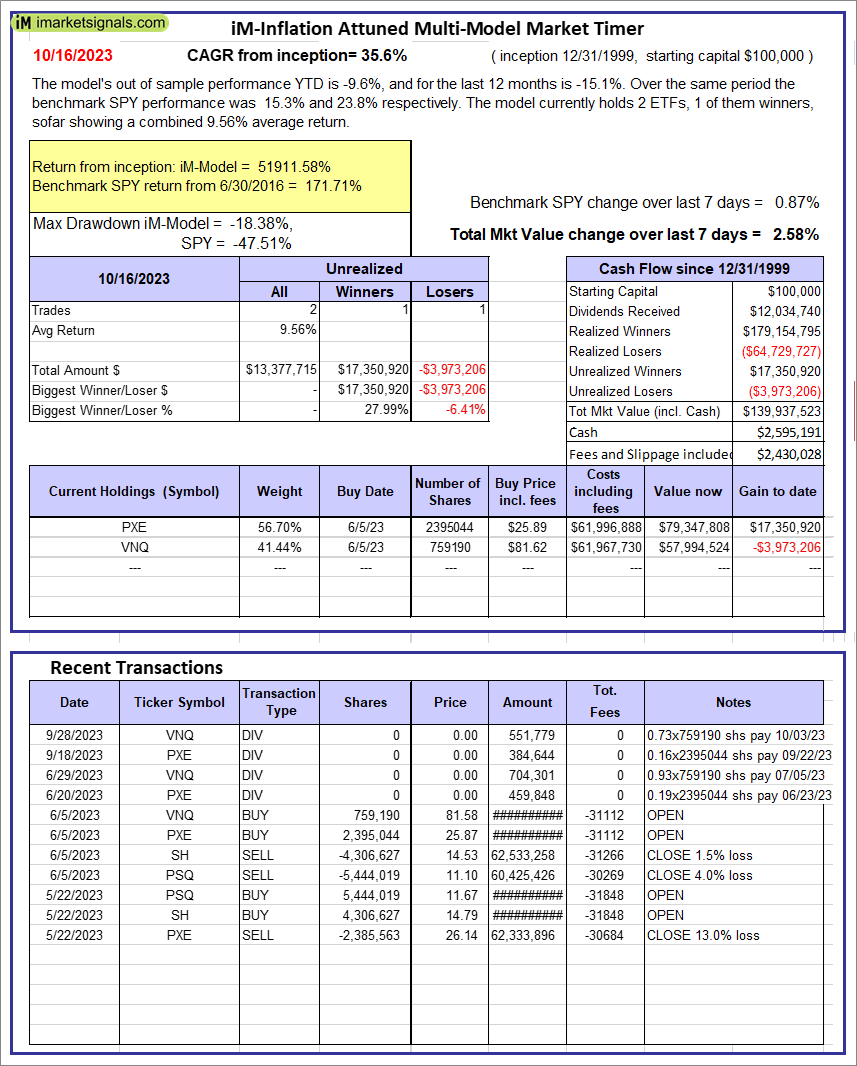 |
iM-Inflation Attuned Multi-Model Market Timer: The model’s out of sample performance YTD is -9.6%, and for the last 12 months is -15.1%. Over the same period the benchmark SPY performance was 15.3% and 23.8% respectively. Over the previous week the market value of the iM-Inflation Attuned Multi-Model Market Timer gained 2.58% at a time when SPY gained 0.87%. A starting capital of $100,000 at inception on 3/24/2017 would have grown to $139,937,523 which includes $2,595,191 cash and excludes $2,430,028 spent on fees and slippage. |
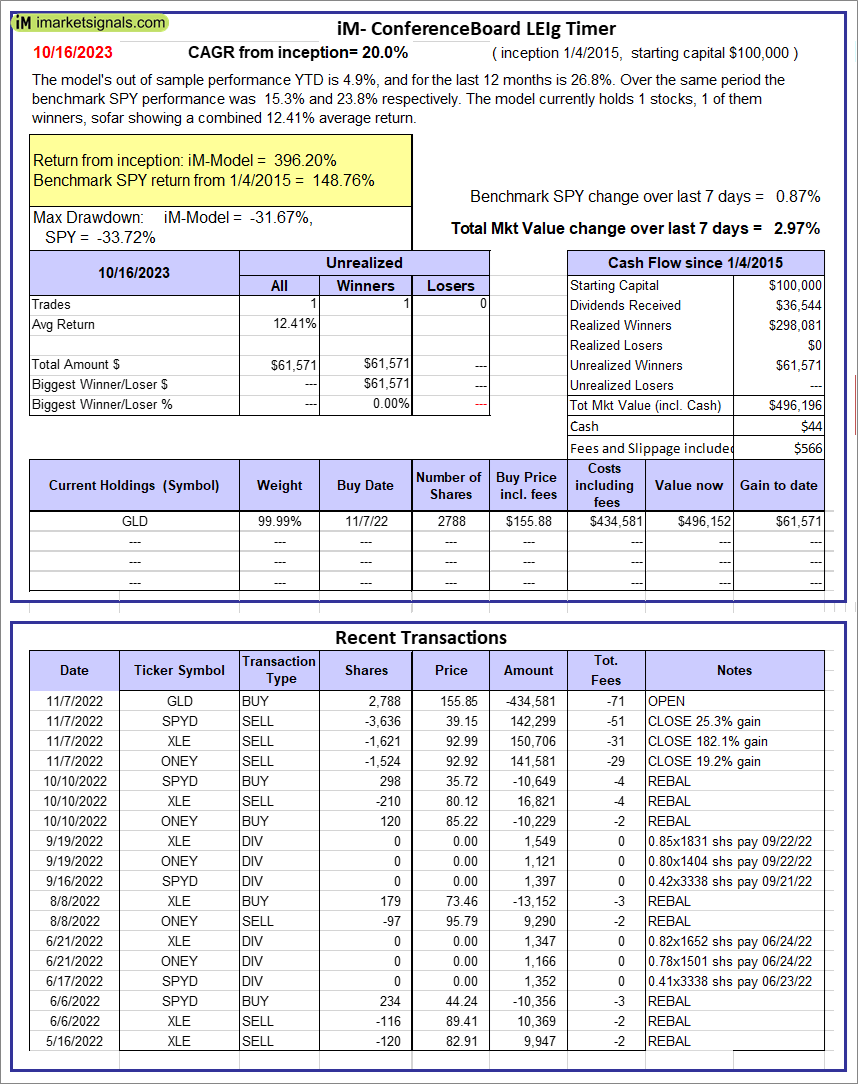 |
iM-Conference Board LEIg Timer: The model’s performance YTD is 14.3%, and for the last 12 months is 7.3%. Over the same period the benchmark SPY performance was 20.1% and 9.4% respectively. Over the previous week the market value of the iM-Conference Board LEIg Timer gained 2.97% at a time when SPY gained 0.87%. A starting capital of $100,000 at inception on 4/5/2017 would have grown to $496,196 which includes $44 cash and excludes $566 spent on fees and slippage. |
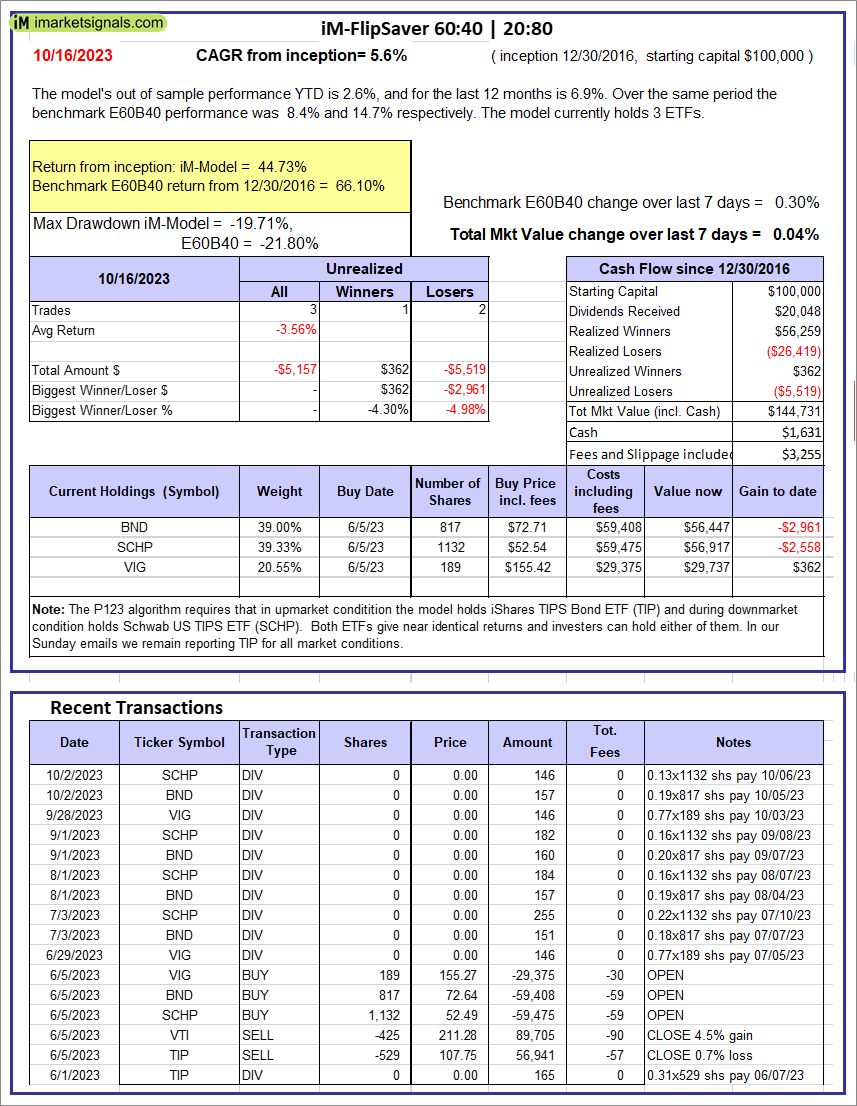 |
iM-FlipSaver 60:40 | 20:80 – 2017: The model’s out of sample performance YTD is 2.6%, and for the last 12 months is 6.9%. Over the same period the benchmark E60B40 performance was 8.4% and 14.7% respectively. Over the previous week the market value of iM-FlipSaver 80:20 | 20:80 gained 0.04% at a time when SPY gained 0.30%. A starting capital of $100,000 at inception on 7/16/2015 would have grown to $144,731 which includes $1,631 cash and excludes $3,255 spent on fees and slippage. |
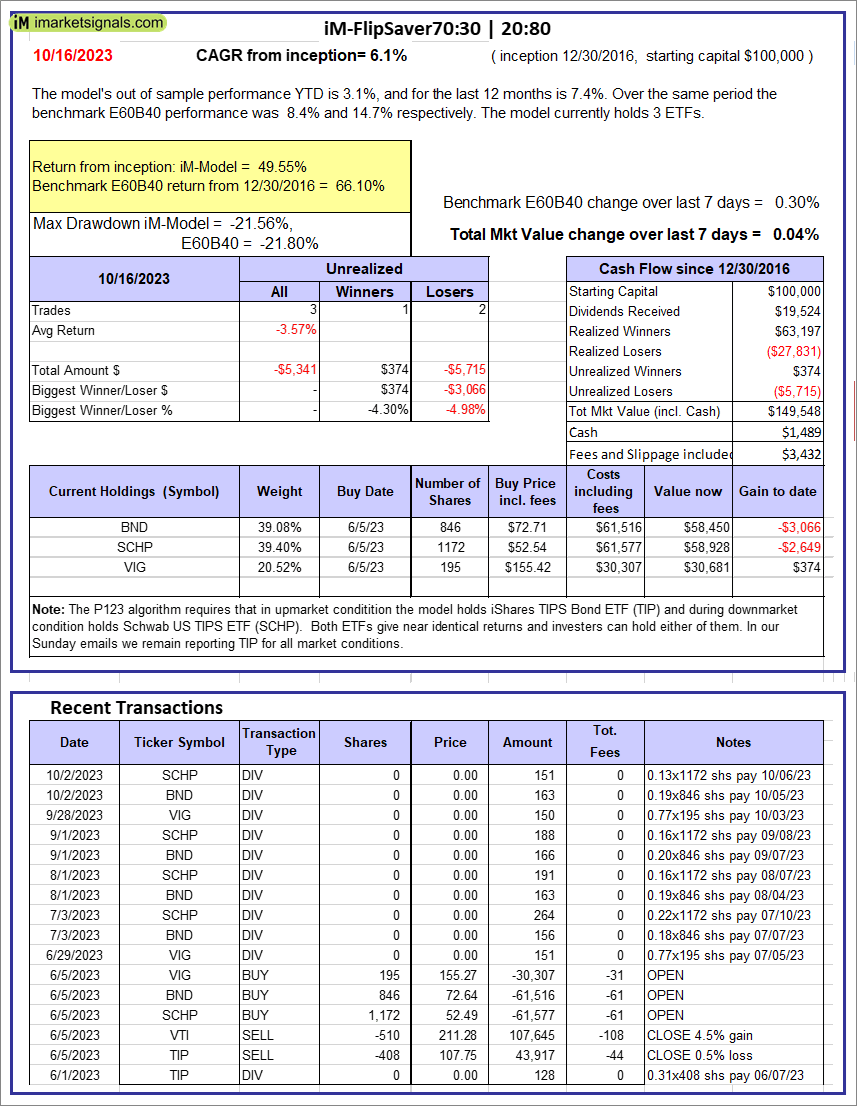 |
iM-FlipSaver 70:30 | 20:80 – 2017: The model’s out of sample performance YTD is 3.1%, and for the last 12 months is 7.4%. Over the same period the benchmark E60B40 performance was 8.4% and 14.7% respectively. Over the previous week the market value of iM-FlipSaver 70:30 | 20:80 gained 0.04% at a time when SPY gained 0.30%. A starting capital of $100,000 at inception on 7/15/2015 would have grown to $149,548 which includes $1,489 cash and excludes $3,432 spent on fees and slippage. |
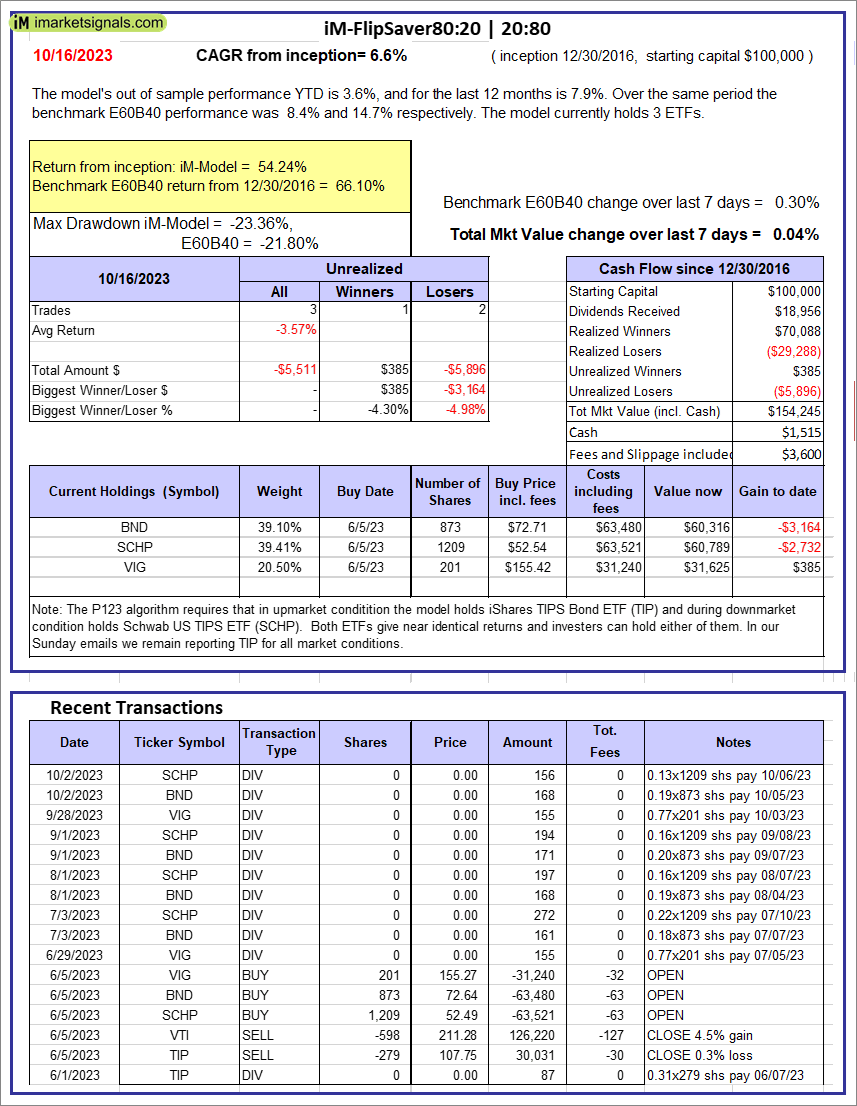 |
iM-FlipSaver 80:20 | 20:80 – 2017: The model’s out of sample performance YTD is 3.6%, and for the last 12 months is 7.9%. Over the same period the benchmark E60B40 performance was 8.4% and 14.7% respectively. Over the previous week the market value of iM-FlipSaver 80:20 | 20:80 gained 0.04% at a time when SPY gained 0.30%. A starting capital of $100,000 at inception on 1/2/2017 would have grown to $154,245 which includes $1,515 cash and excludes $3,600 spent on fees and slippage. |
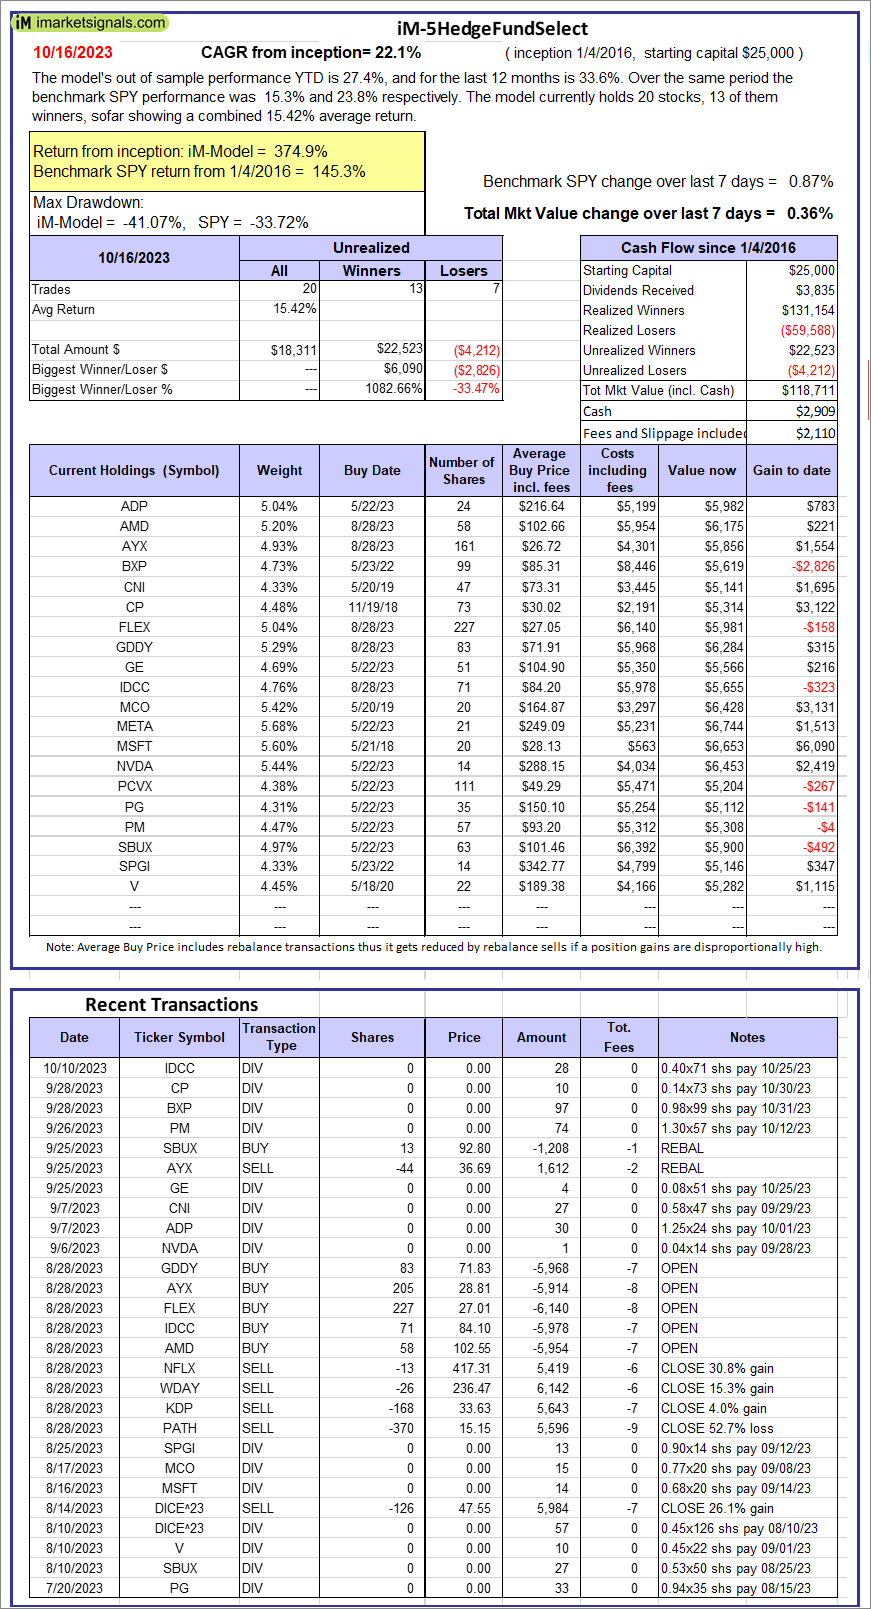 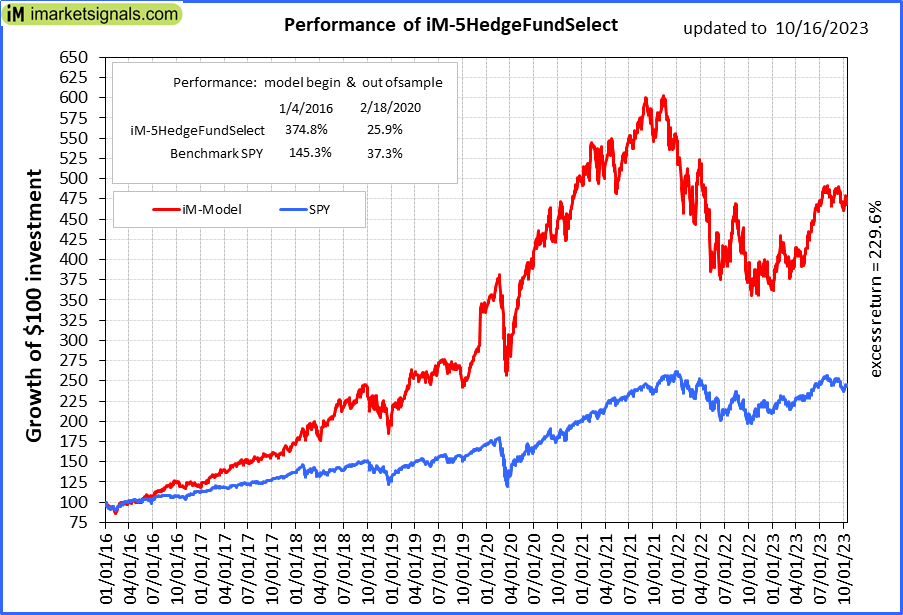 |
iM-5HedgeFundSelect: Since inception, on 1/5/2016, the model gained 374.85% while the benchmark SPY gained 145.28% over the same period. Over the previous week the market value of iM-5HedgeFundSelect gained 0.36% at a time when SPY gained 0.87%. A starting capital of $25,000 at inception on 1/5/2016 would have grown to $118,711 which includes $2,909 cash and excludes $2,110 spent on fees and slippage. |
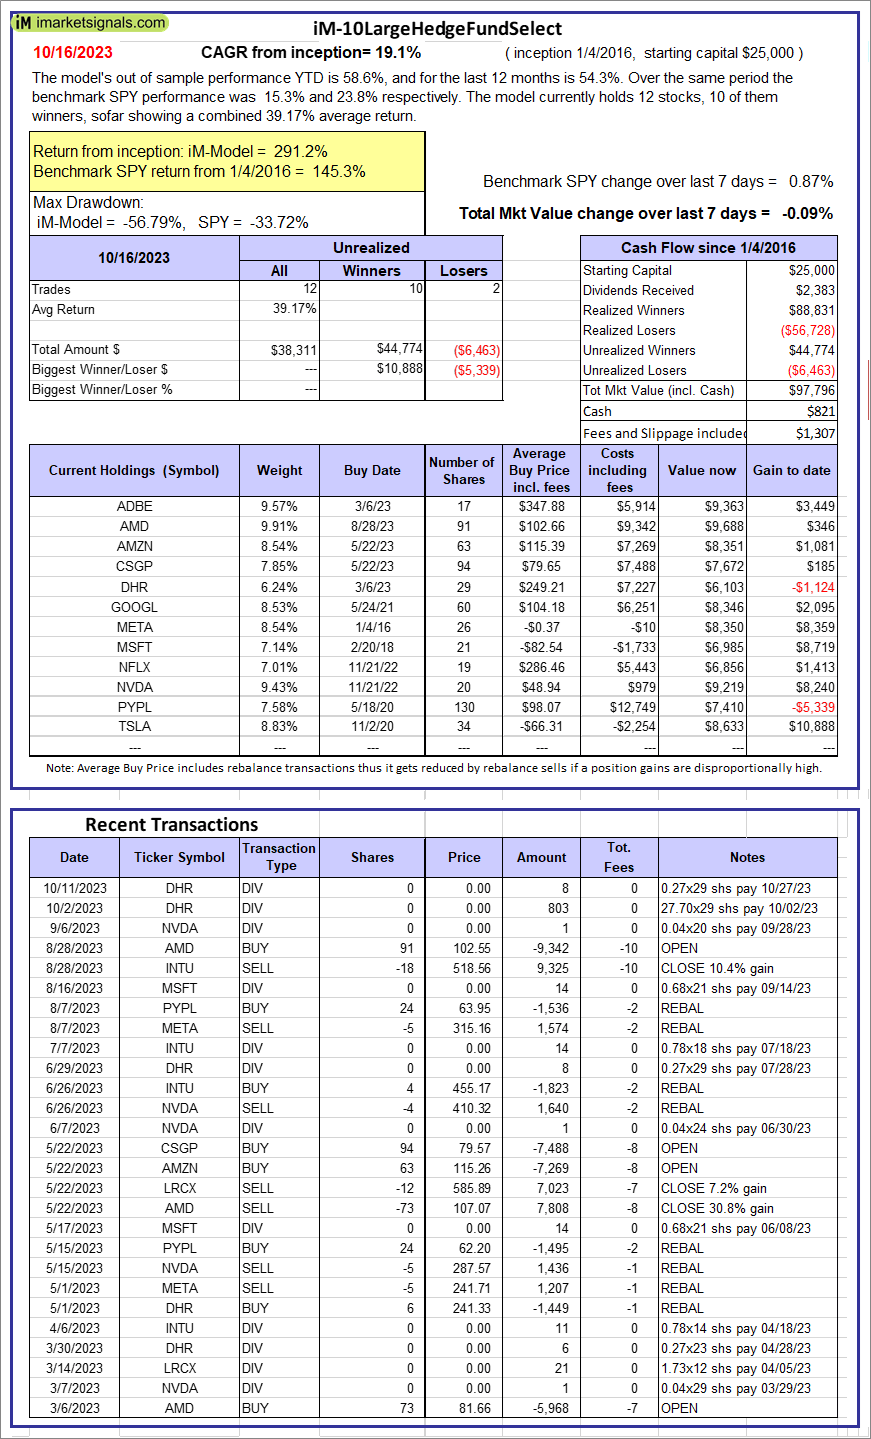 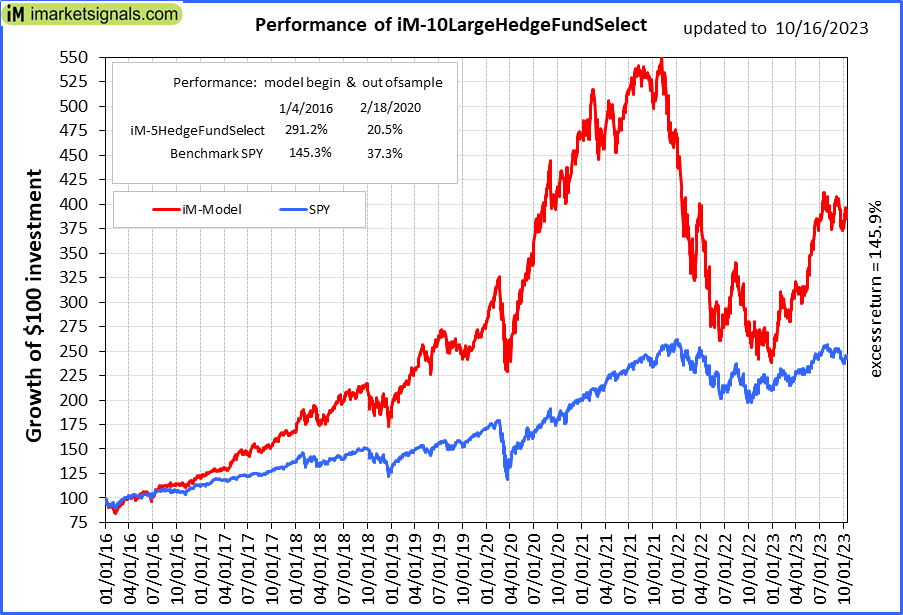 |
iM-10LargeHedgeFundSelect: Since inception, on 1/5/2016, the model gained 291.18% while the benchmark SPY gained 145.28% over the same period. Over the previous week the market value of iM-10LargeHedgeFundSelect gained -0.09% at a time when SPY gained 0.87%. A starting capital of $25,000 at inception on 1/5/2016 would have grown to $97,796 which includes $821 cash and excludes $1,307 spent on fees and slippage. |
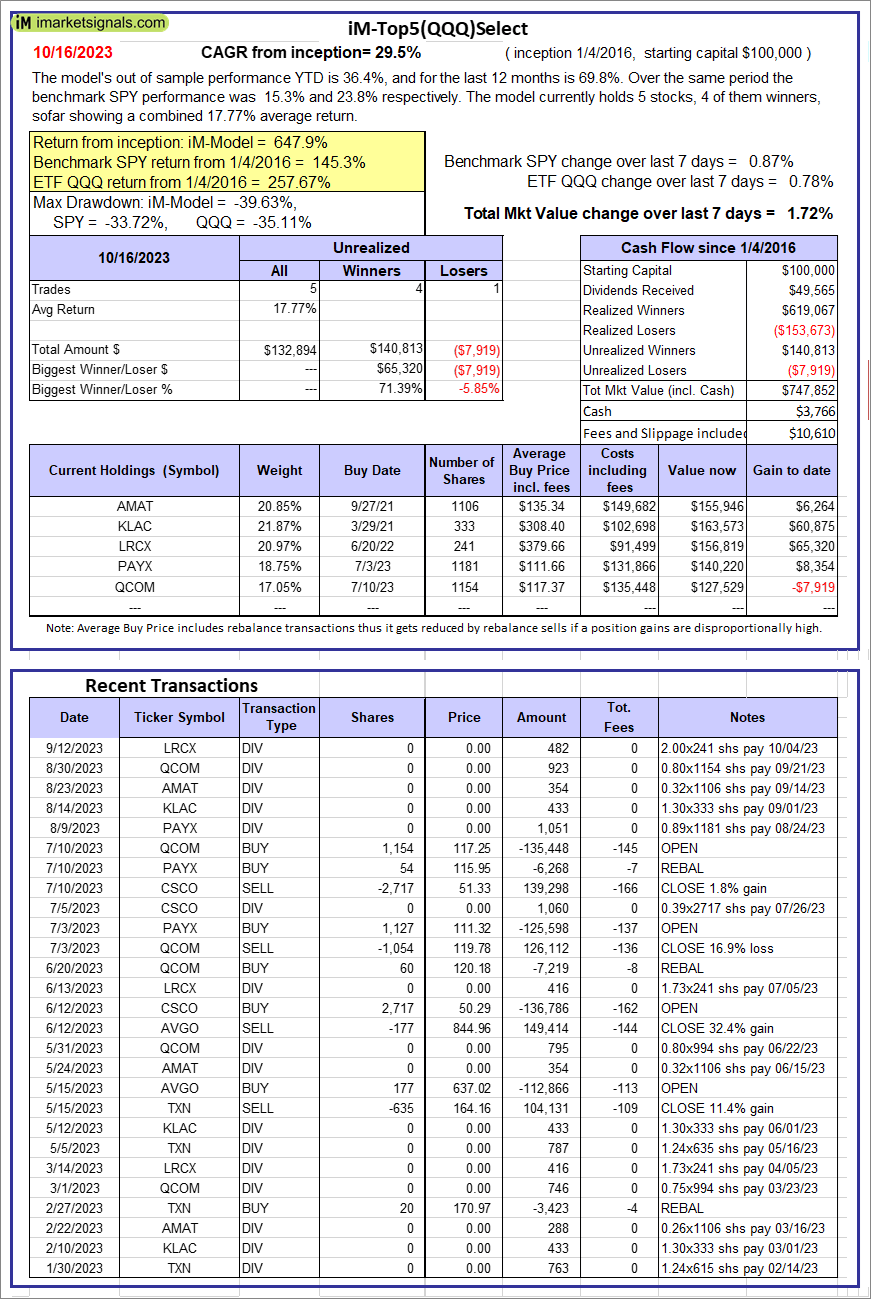 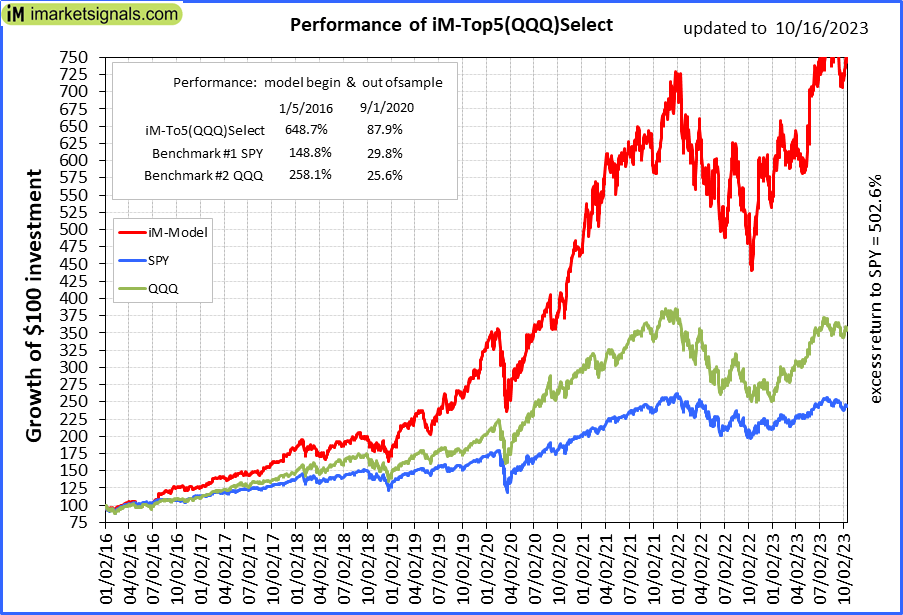 |
iM-Top5(QQQ)Select: Since inception, on 1/5/2016, the model gained 647.85% while the benchmark SPY gained 145.28% over the same period. Over the previous week the market value of iM-Top5(QQQ)Select gained 1.72% at a time when SPY gained 0.87%. A starting capital of $100,000 at inception on 1/5/2016 would have grown to $747,852 which includes $3,766 cash and excludes $10,610 spent on fees and slippage. |
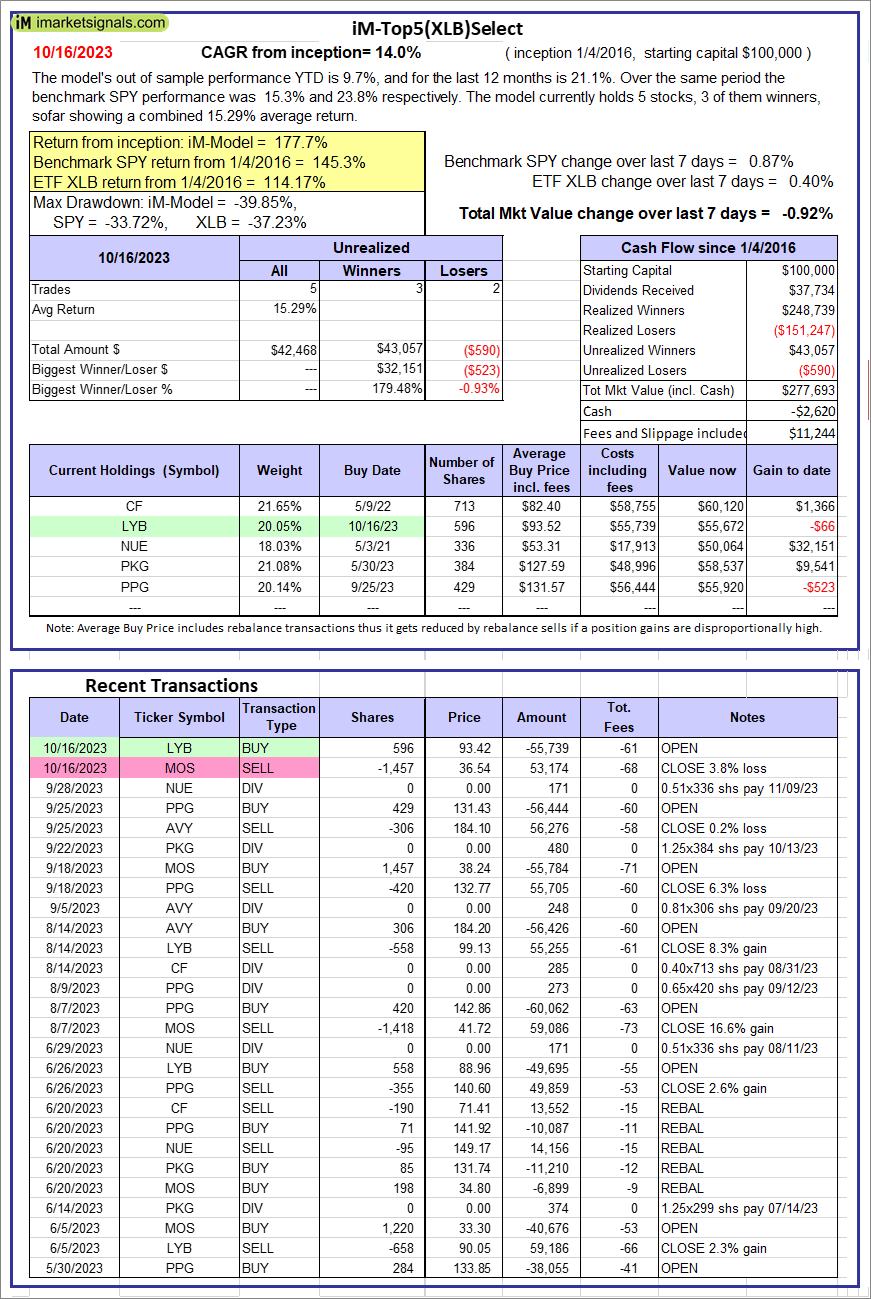 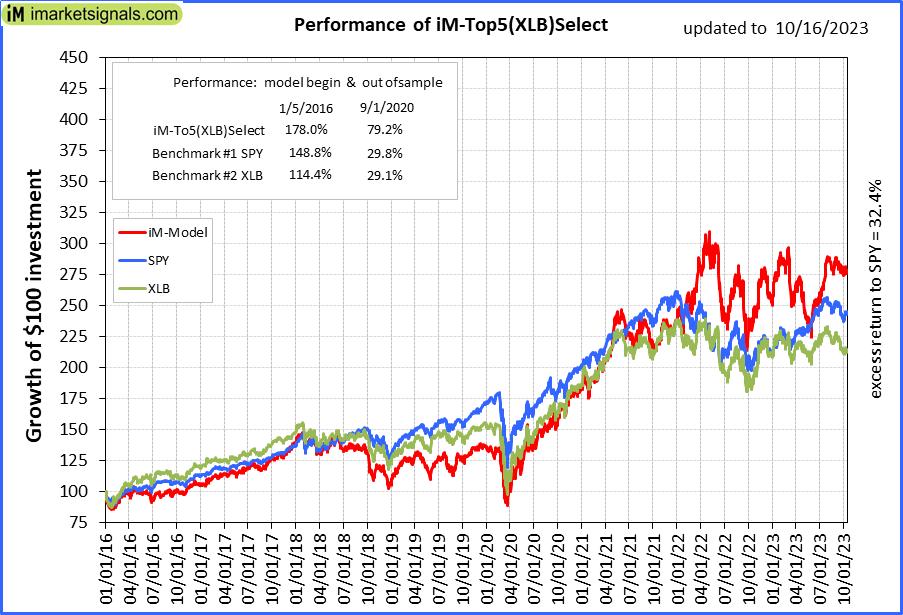 |
iM-Top5(XLB)Select: Since inception, on 1/5/2016, the model gained 177.69% while the benchmark SPY gained 145.28% over the same period. Over the previous week the market value of iM-Top5(XLB)Select gained -0.92% at a time when SPY gained 0.87%. A starting capital of $100,000 at inception on 1/5/2016 would have grown to $277,693 which includes -$2,620 cash and excludes $11,244 spent on fees and slippage. |
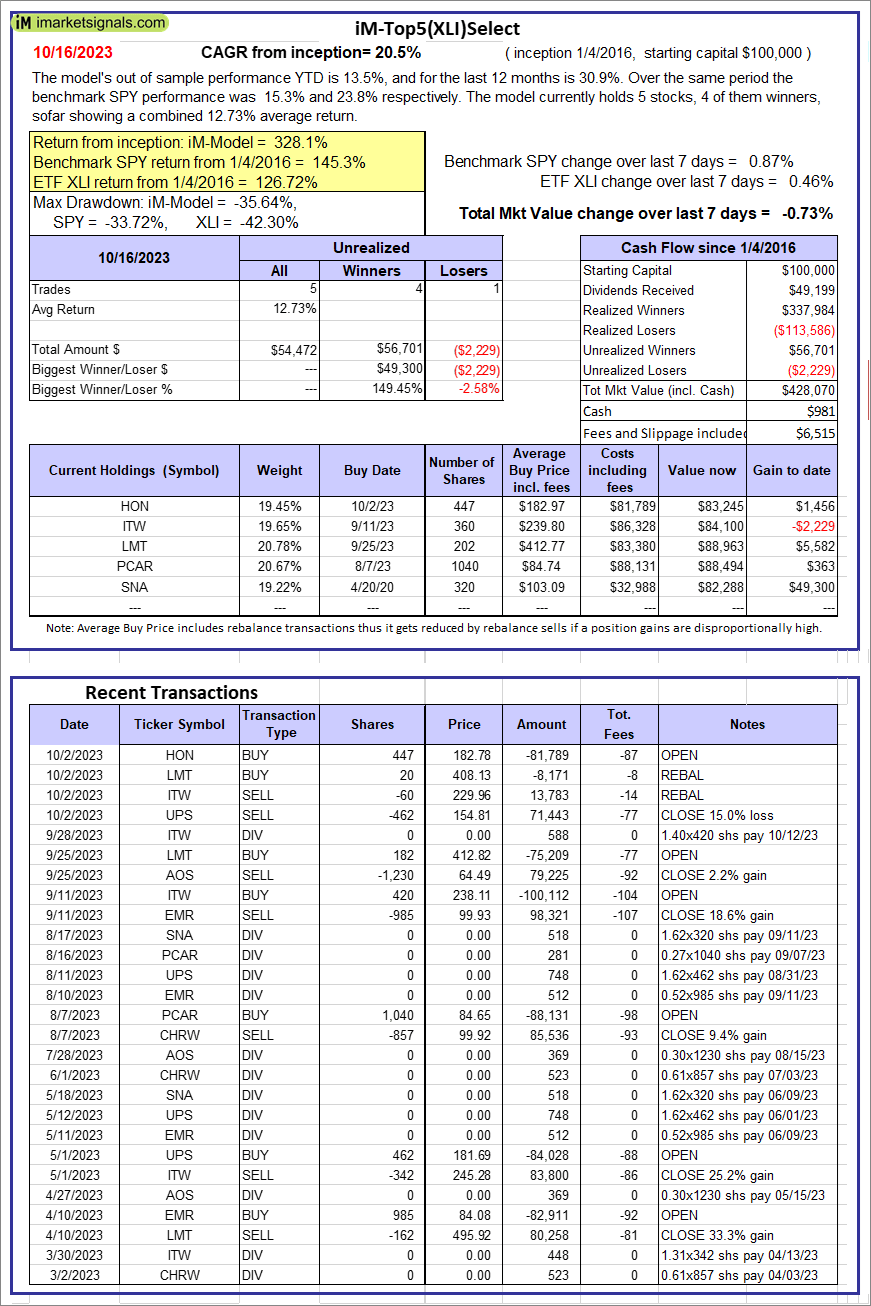 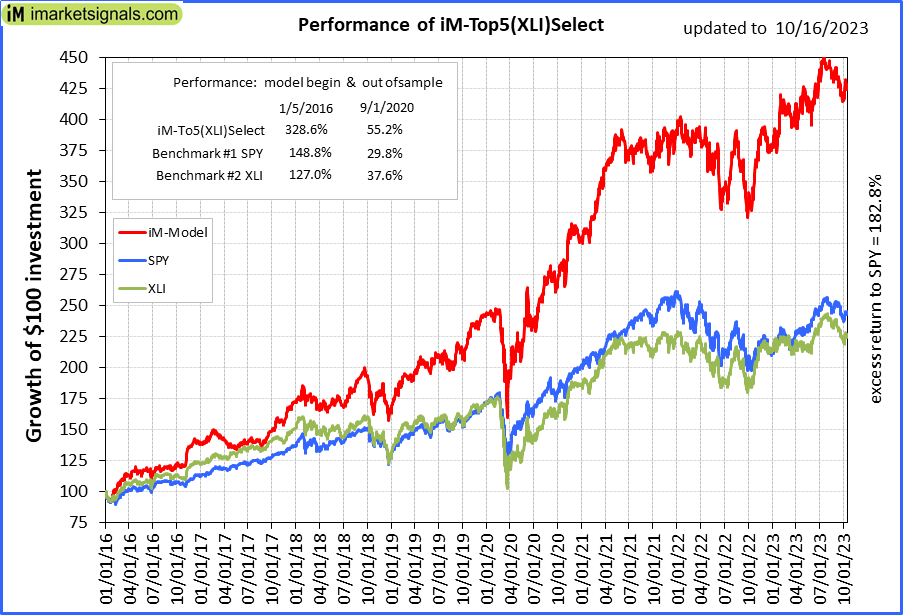 |
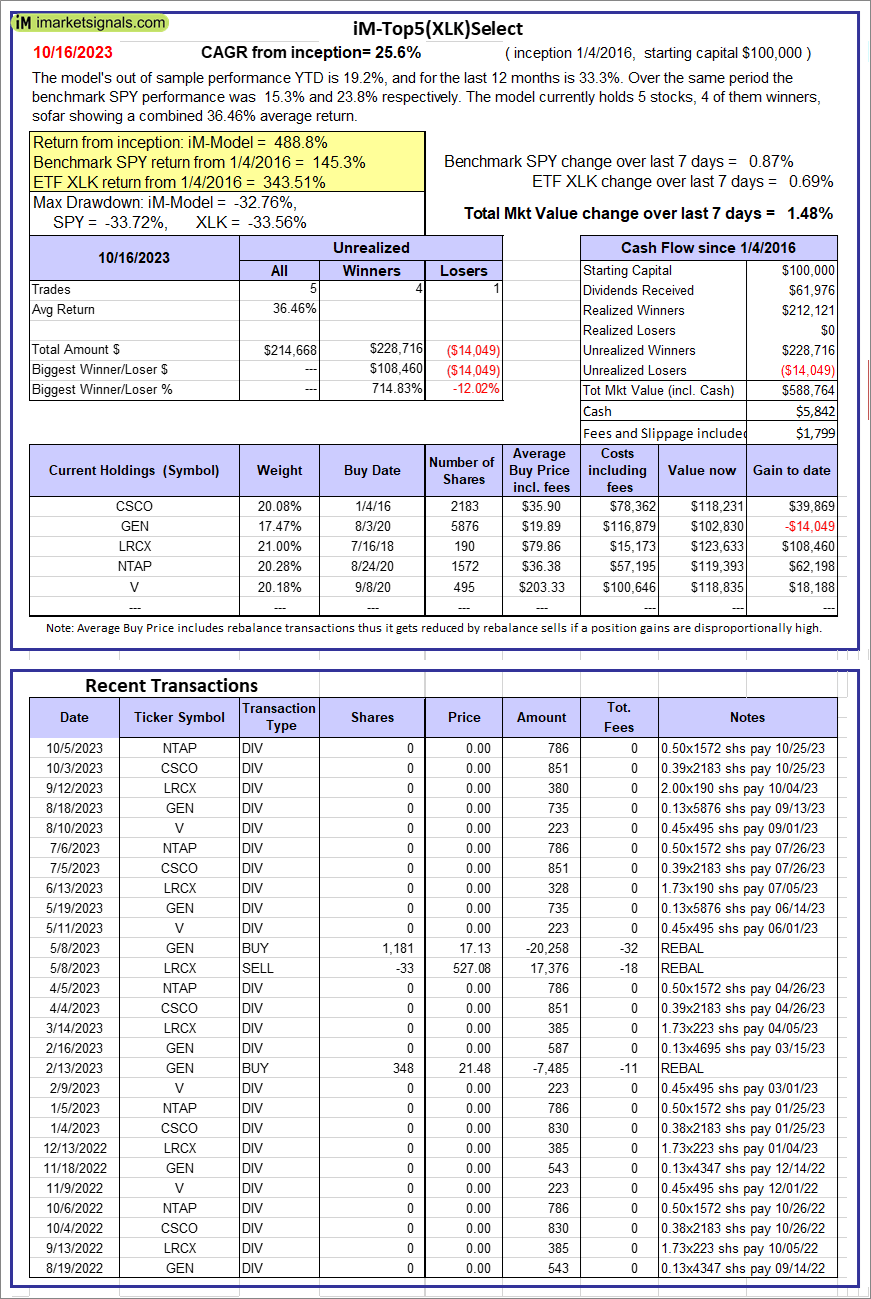
iM-Top5(XLI)Select: Since inception, on 1/5/2016, the model gained 328.07% while the benchmark SPY gained 145.28% over the same period. Over the previous week the market value of iM-Top5(XLI)Select gained -0.73% at a time when SPY gained 0.87%. A starting capital of $100,000 at inception on 1/5/2016 would have grown to $428,070 which includes $981 cash and excludes $6,515 spent on fees and slippage. |
 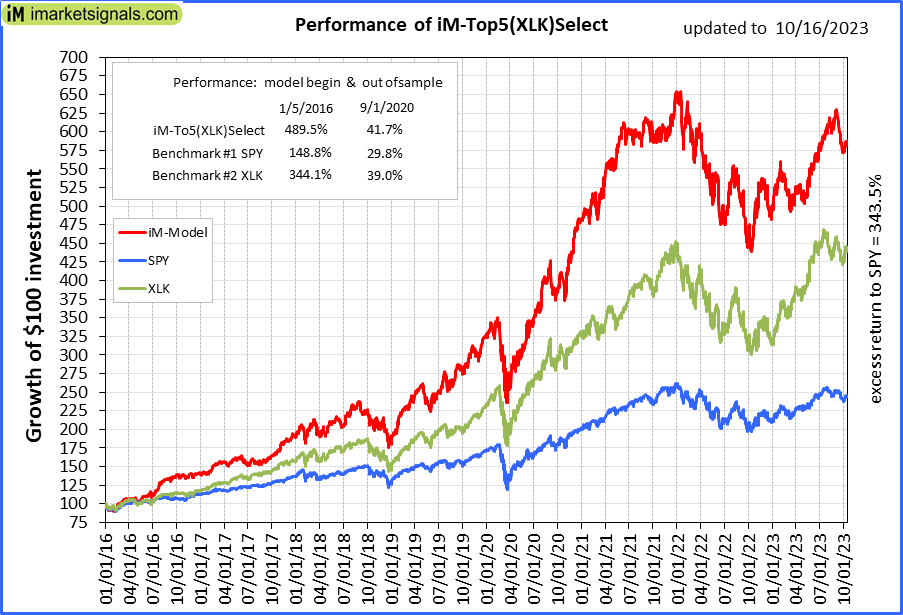 |
iM-Top5(XLK)Select: Since inception, on 1/5/2016, the model gained 488.76% while the benchmark SPY gained 145.28% over the same period. Over the previous week the market value of iM-Top5(XLK)Select gained 1.48% at a time when SPY gained 0.87%. A starting capital of $100,000 at inception on 1/5/2016 would have grown to $588,764 which includes $5,842 cash and excludes $1,799 spent on fees and slippage. |
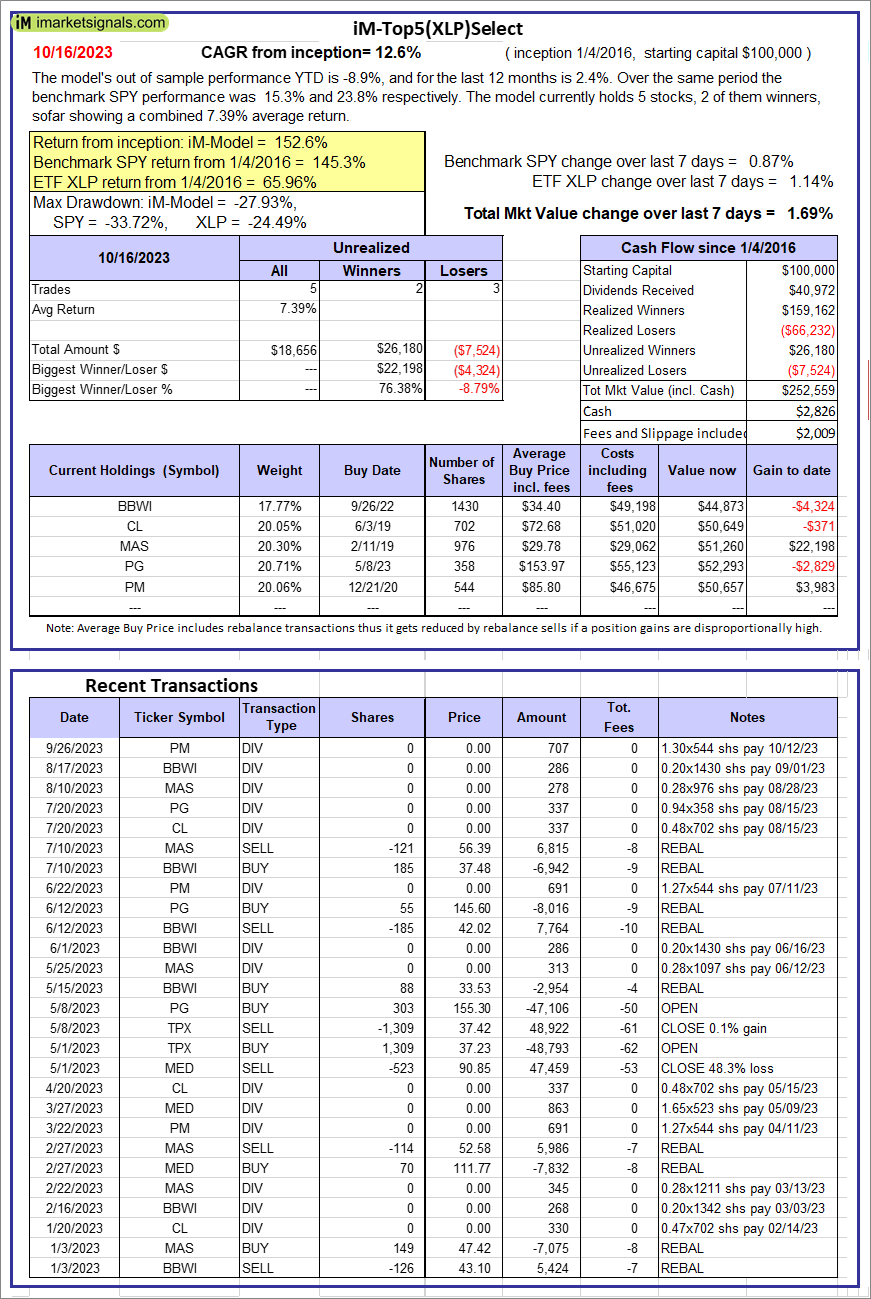 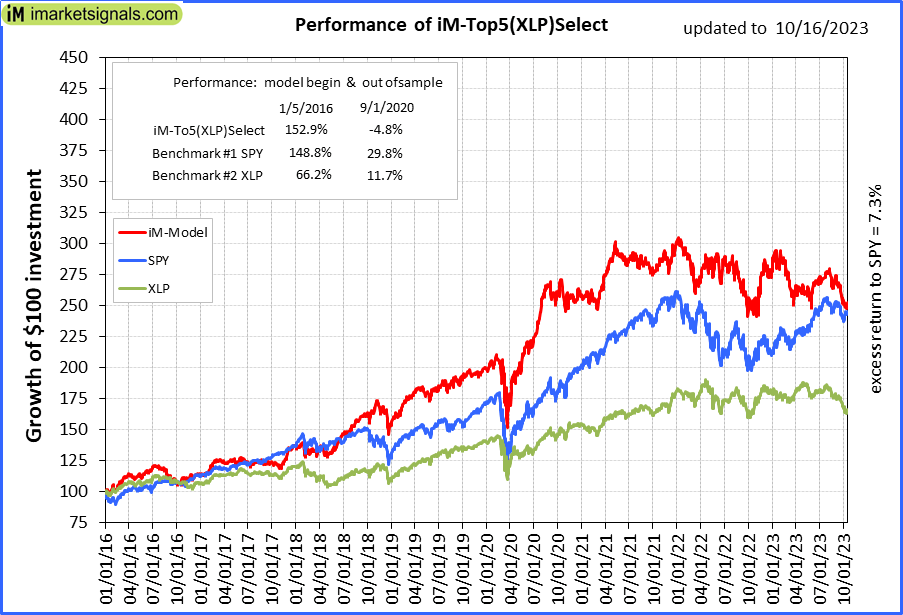 |
iM-Top5(XLP)Select: Since inception, on 1/5/2016, the model gained 152.56% while the benchmark SPY gained 145.28% over the same period. Over the previous week the market value of iM-Top5(XLP)Select gained 1.69% at a time when SPY gained 0.87%. A starting capital of $100,000 at inception on 1/5/2016 would have grown to $252,559 which includes $2,826 cash and excludes $2,009 spent on fees and slippage. |
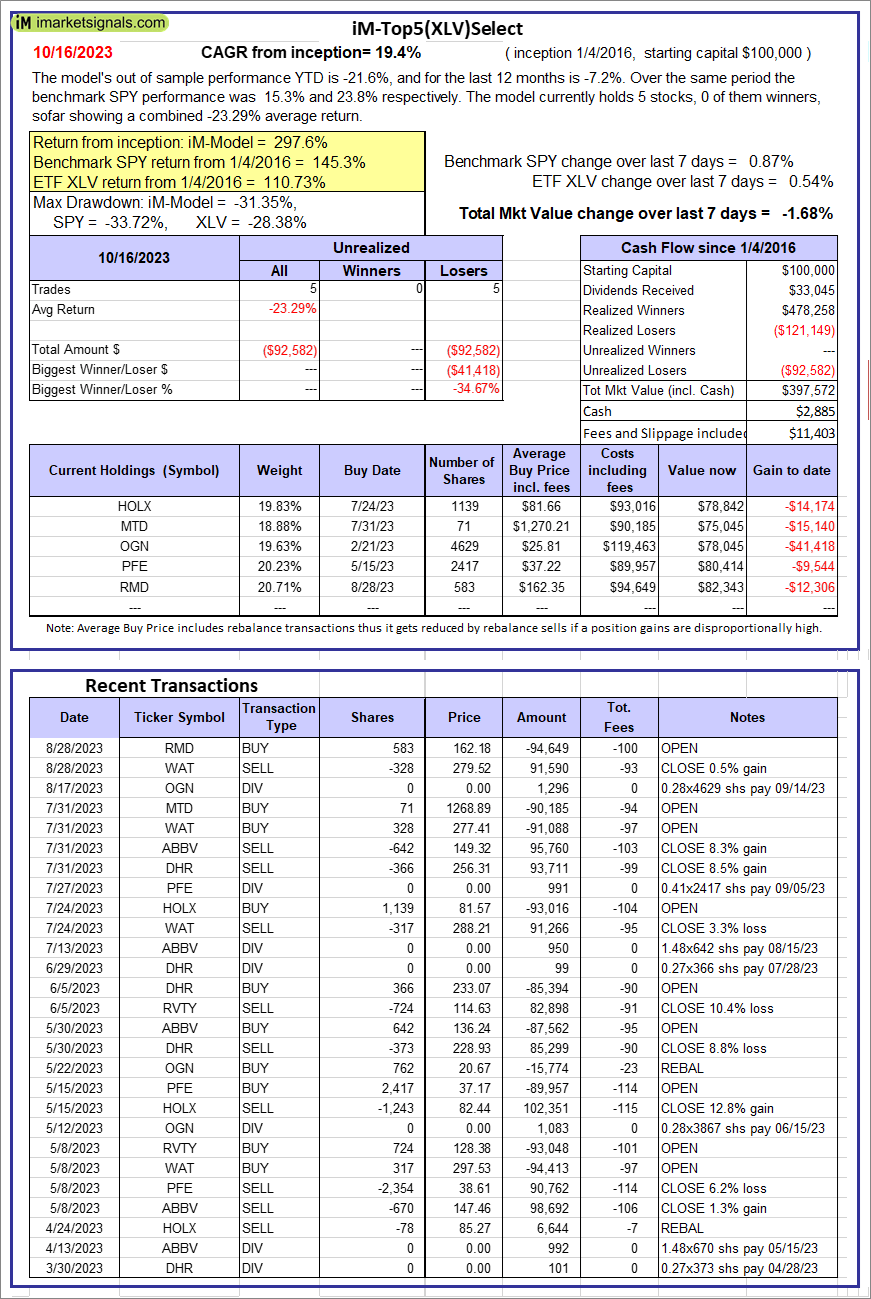 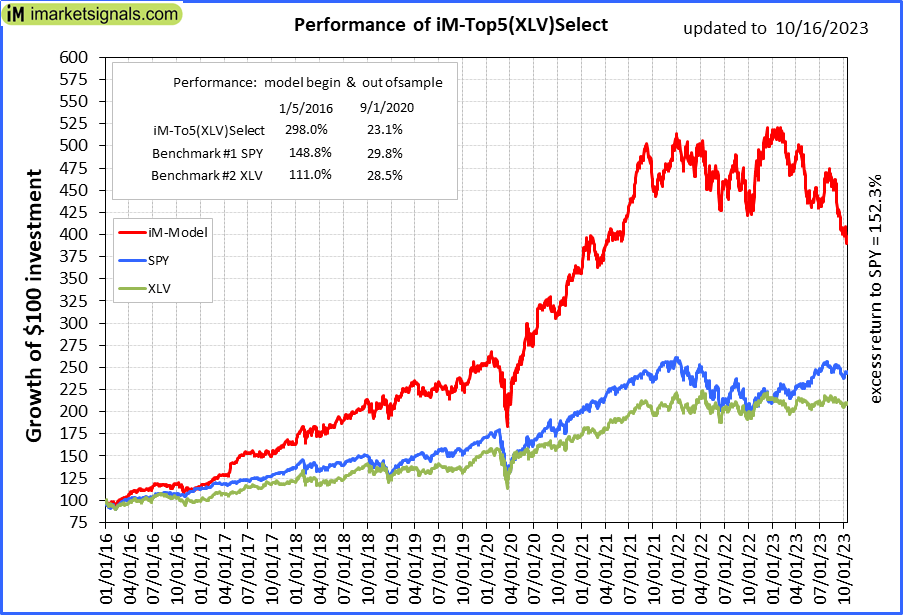 |
iM-Top5(XLV)Select: Since inception, on 1/5/2016, the model gained 297.57% while the benchmark SPY gained 145.28% over the same period. Over the previous week the market value of iM-Top5(XLV)Select gained -1.68% at a time when SPY gained 0.87%. A starting capital of $100,000 at inception on 1/5/2016 would have grown to $397,572 which includes $2,885 cash and excludes $11,403 spent on fees and slippage. |
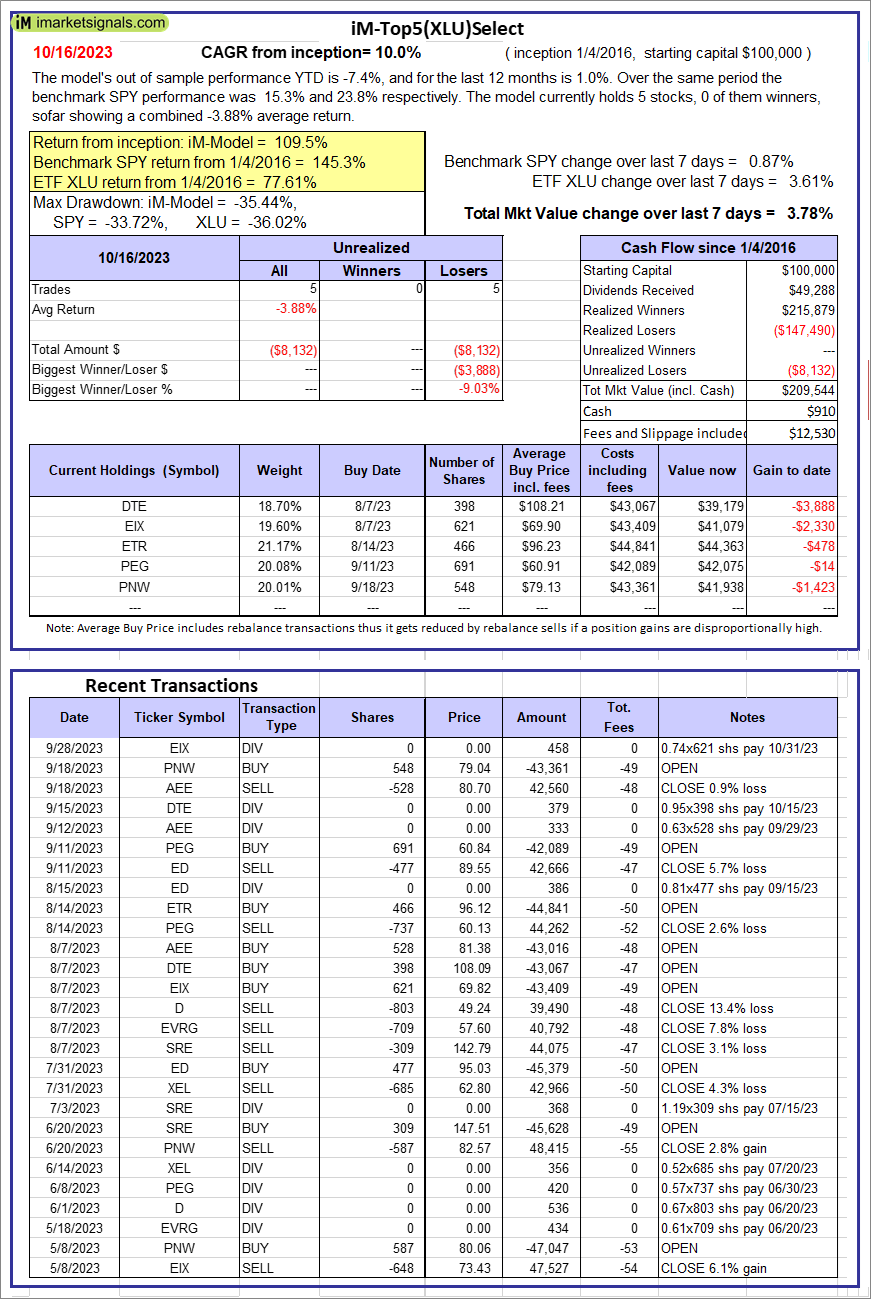 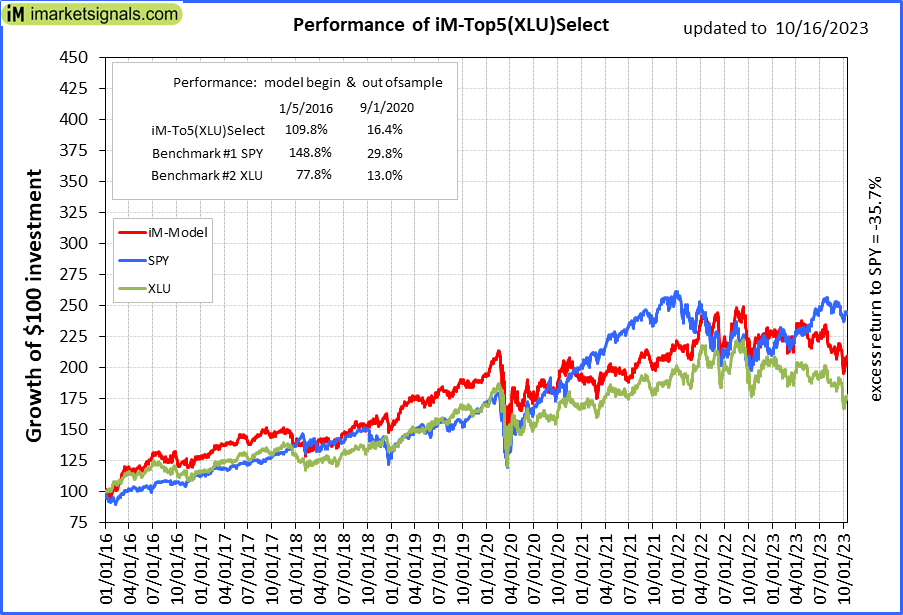 |
iM-Top5(XLU)Select: Since inception, on 1/5/2016, the model gained 109.54% while the benchmark SPY gained 145.28% over the same period. Over the previous week the market value of iM-Top5(XLU)Select gained 3.78% at a time when SPY gained 0.87%. A starting capital of $100,000 at inception on 1/5/2016 would have grown to $209,544 which includes $910 cash and excludes $12,530 spent on fees and slippage. |
 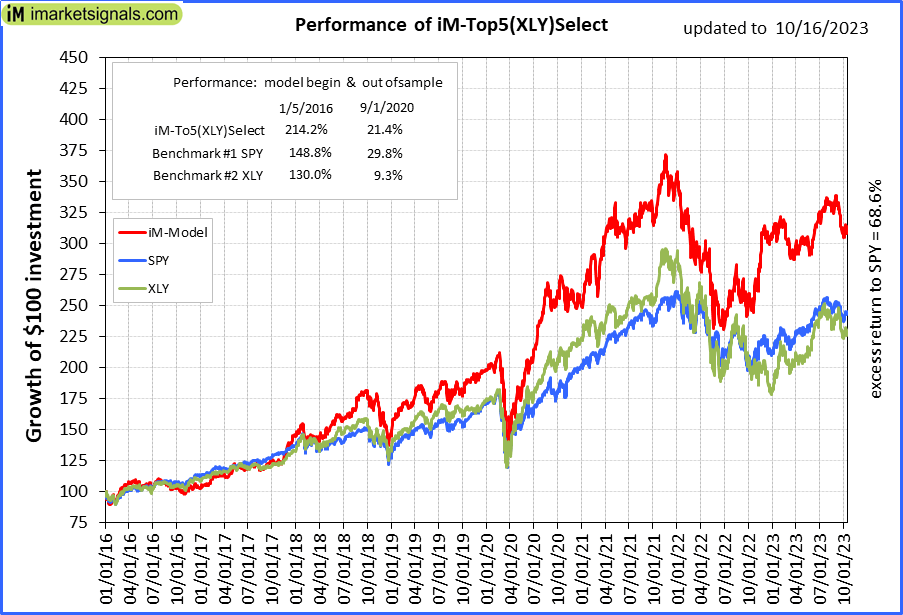 |
iM-Top5(XLY)Select: Since inception, on 1/5/2016, the model gained 213.86% while the benchmark SPY gained 145.28% over the same period. Over the previous week the market value of iM-Top5(XLY)Select gained 0.87% at a time when SPY gained 0.87%. A starting capital of $100,000 at inception on 1/5/2016 would have grown to $313,861 which includes $6 cash and excludes $5,826 spent on fees and slippage. |
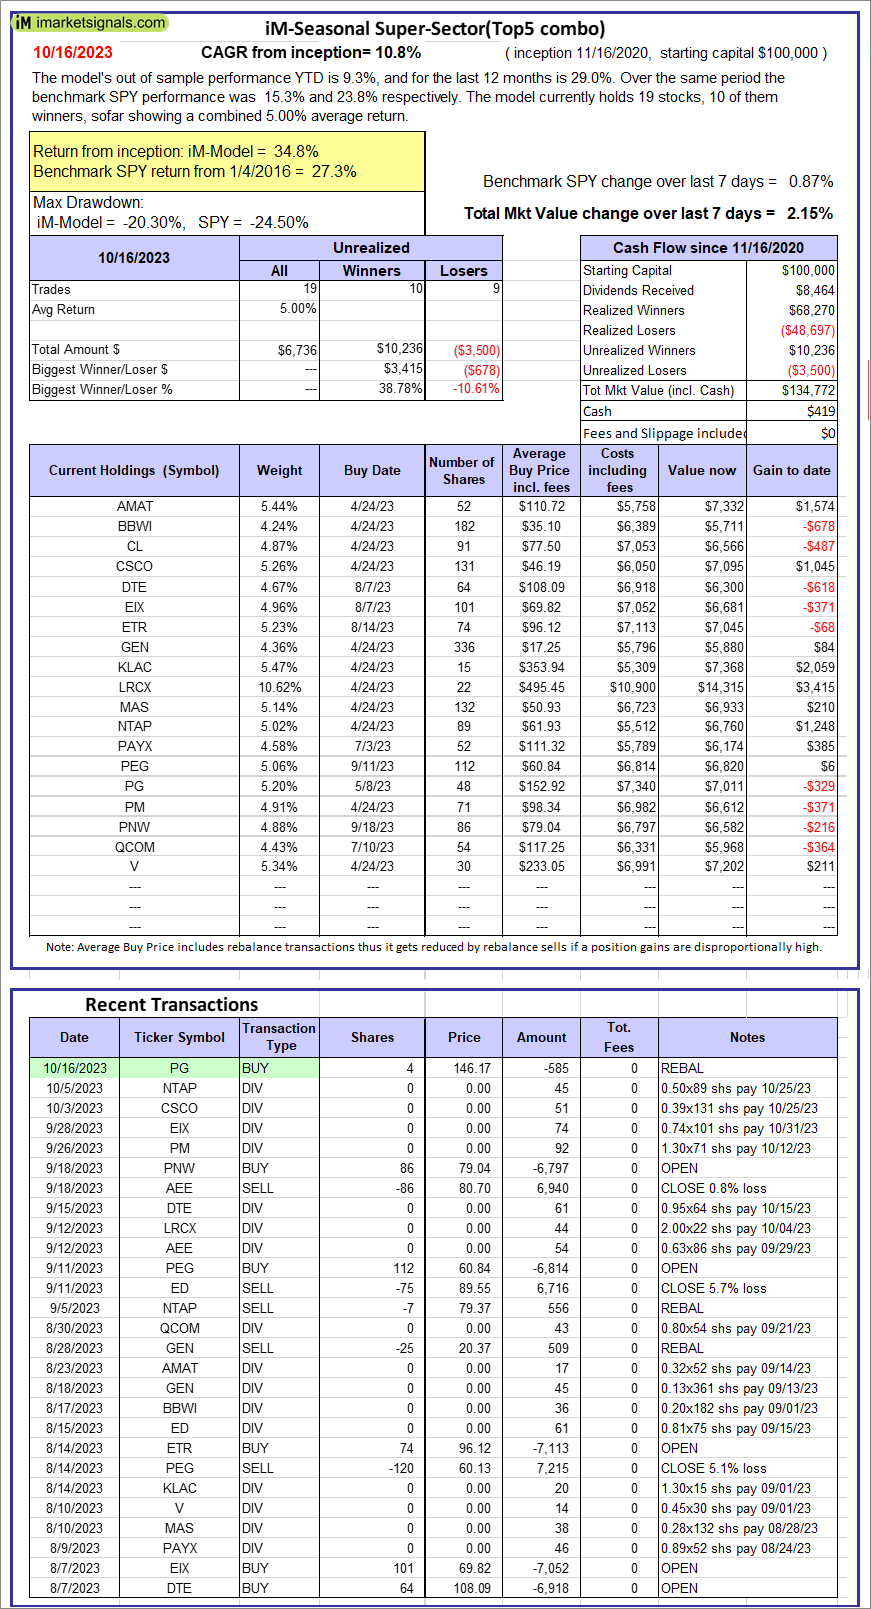 |
iM-Seasonal Super-Sectors (Top5 combo) : Since inception, on 11/17/2020, the model gained 34.77% while the benchmark SPY gained 27.32% over the same period. Over the previous week the market value of iM-Seasonal Super-Sectors (Top5 combo) gained 2.15% at a time when SPY gained 0.87%. A starting capital of $100,000 at inception on 11/17/2020 would have grown to $134,772 which includes $419 cash and excludes $00 spent on fees and slippage. |
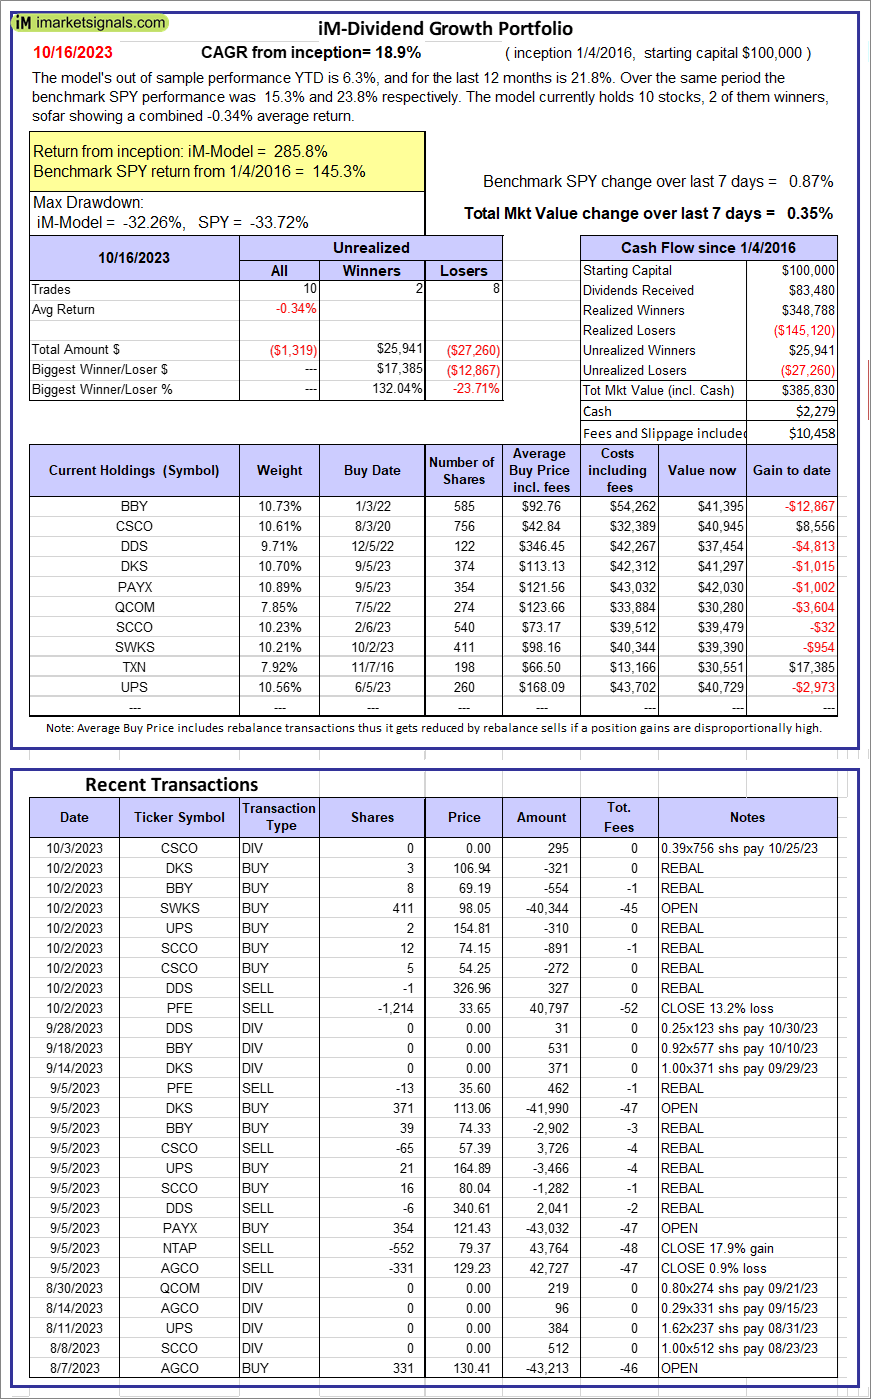 |
iM-Dividend Growth Portfolio: The model’s out of sample performance YTD is 6.3%, and for the last 12 months is 21.8%. Over the same period the benchmark SPY performance was 15.3% and 23.8% respectively. Over the previous week the market value of the iM-Dividend Growth Portfolio gained 0.35% at a time when SPY gained 0.87%. A starting capital of $100,000 at inception on 6/30/2016 would have grown to $385,830 which includes $2,279 cash and excludes $10,458 spent on fees and slippage. |
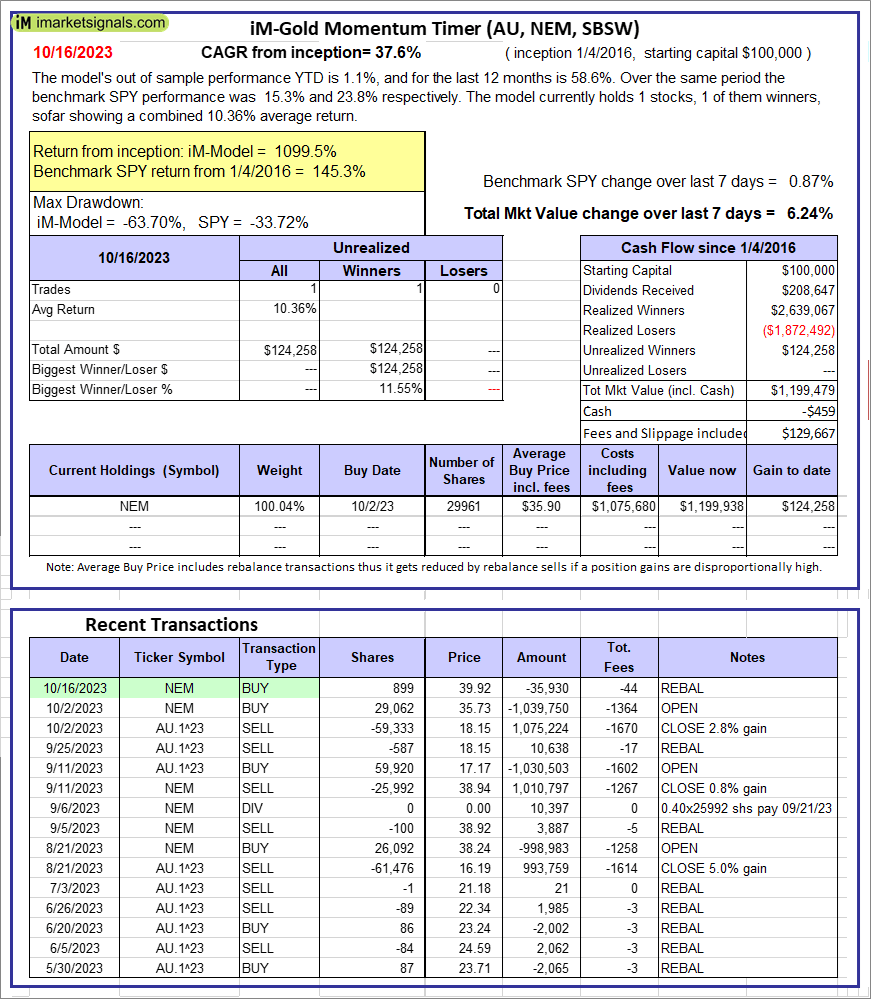 |
iM-Gold Momentum Timer (AU, NEM, SBSW): The model’s out of sample performance YTD is 1.1%, and for the last 12 months is 58.6%. Over the same period the benchmark SPY performance was 15.3% and 23.8% respectively. Over the previous week the market value of iM-Gold Momentum Timer (AU, NEM, SBSW) gained 6.24% at a time when SPY gained 0.87%. A starting capital of $100,000 at inception on 6/30/2016 would have grown to -$459 which includes $129,667 cash and excludes Gain to date spent on fees and slippage. |
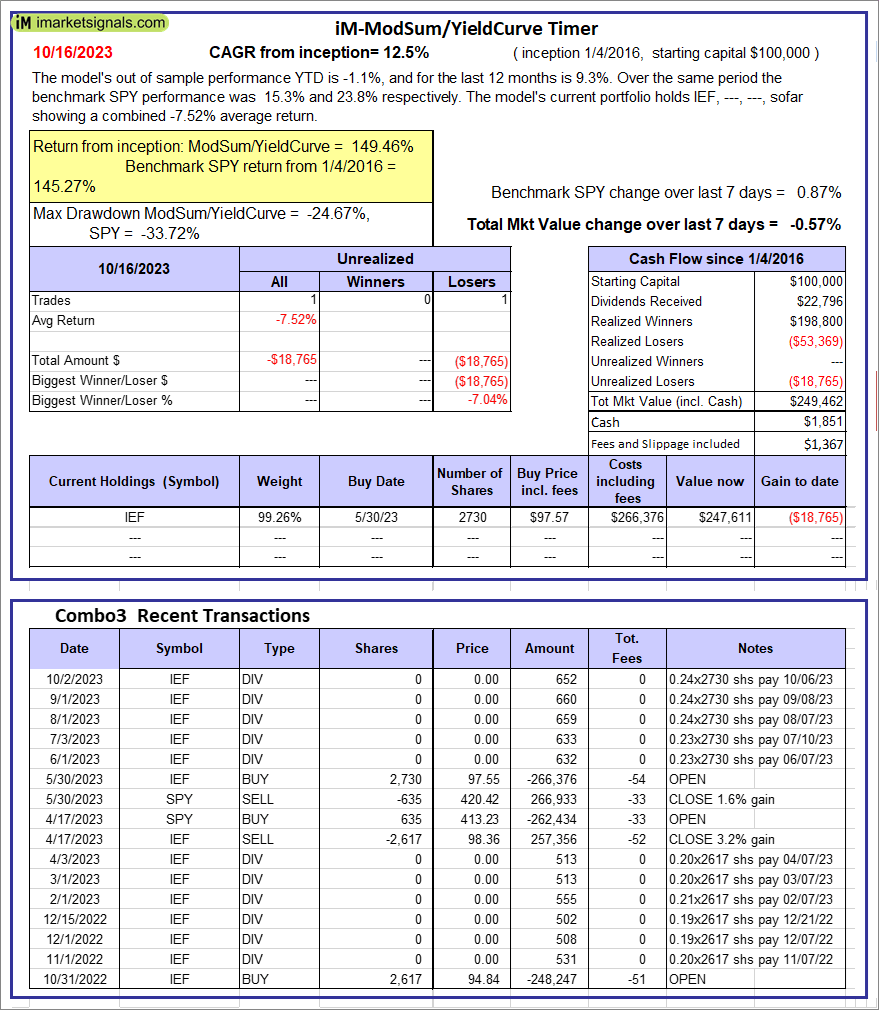 |
iM-ModSum/YieldCurve Timer: The model’s out of sample performance YTD is -1.1%, and for the last 12 months is 9.3%. Over the same period the benchmark SPY performance was 15.3% and 23.8% respectively. Over the previous week the market value of iM-PortSum/YieldCurve Timer gained -0.57% at a time when SPY gained 0.87%. A starting capital of $100,000 at inception on 1/1/2016 would have grown to $249,462 which includes $1,851 cash and excludes $1,367 spent on fees and slippage. |
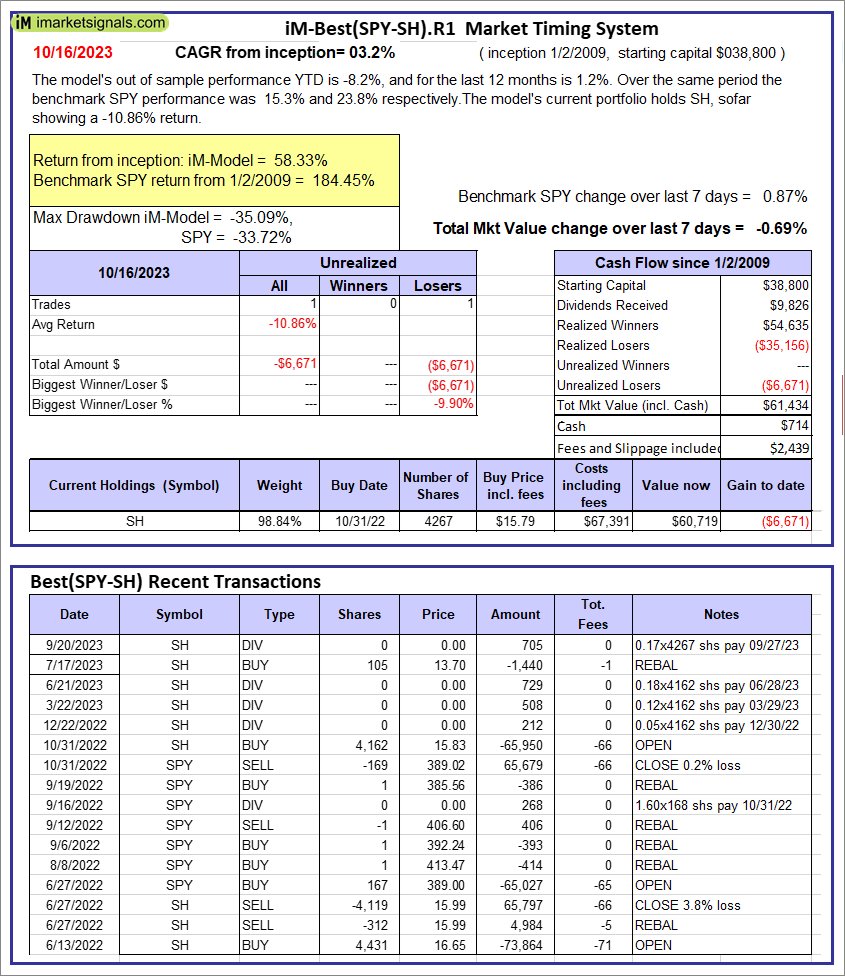 |
iM-Best(SPY-SH).R1: The model’s out of sample performance YTD is -8.2%, and for the last 12 months is 1.2%. Over the same period the benchmark SPY performance was 15.3% and 23.8% respectively. Over the previous week the market value of Best(SPY-SH) gained -0.69% at a time when SPY gained 0.87%. A starting capital of $100,000 at inception on 1/2/2009 would have grown to $61,434 which includes $714 cash and excludes $2,439 spent on fees and slippage. |
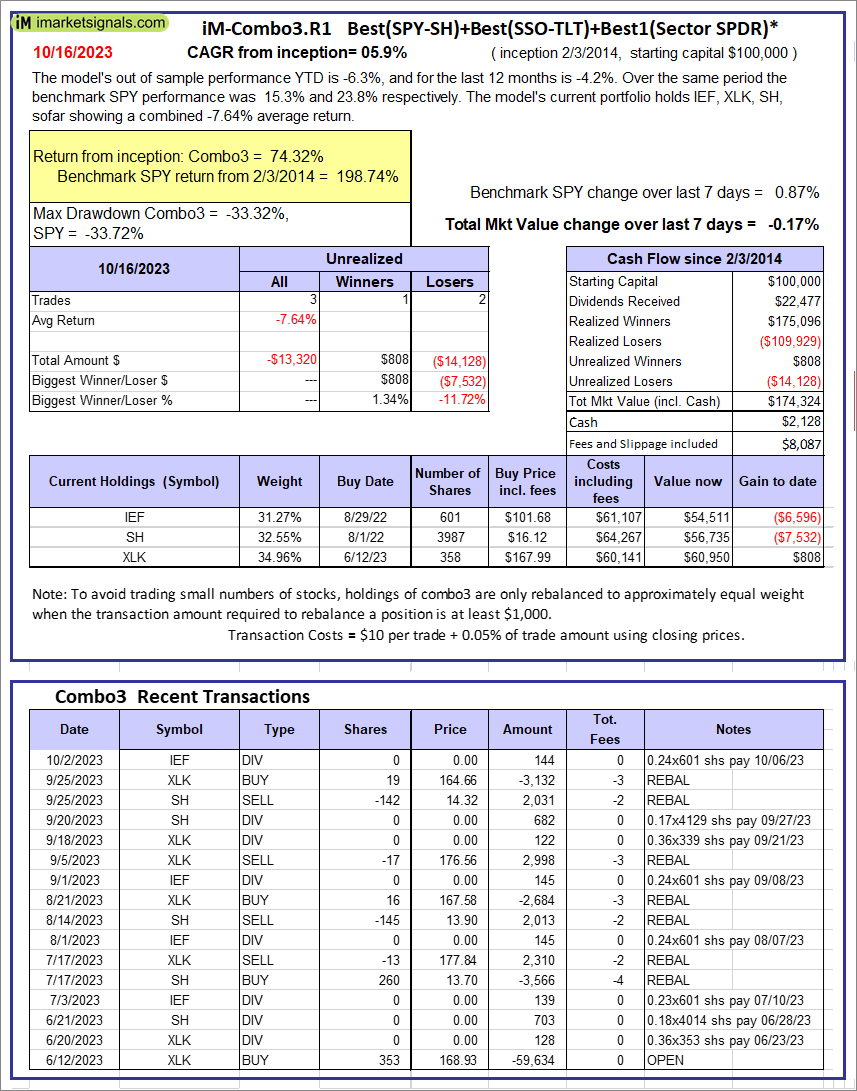 |
iM-Combo3.R1: The model’s out of sample performance YTD is -6.3%, and for the last 12 months is -4.2%. Over the same period the benchmark SPY performance was 15.3% and 23.8% respectively. Over the previous week the market value of iM-Combo3.R1 gained -0.17% at a time when SPY gained 0.87%. A starting capital of $100,000 at inception on 2/3/2014 would have grown to $174,324 which includes $2,128 cash and excludes $8,087 spent on fees and slippage. |
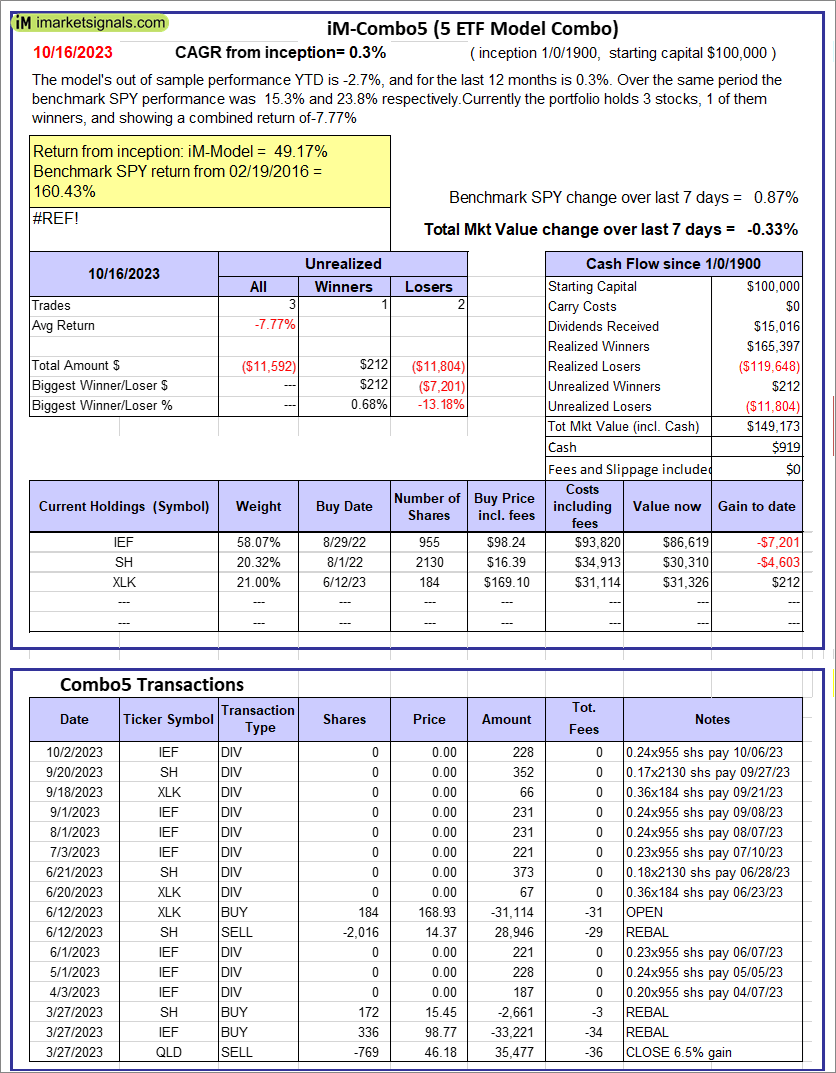 |
iM-Combo5: The model’s out of sample performance YTD is -2.7%, and for the last 12 months is 0.3%. Over the same period the benchmark SPY performance was 15.3% and 23.8% respectively. Over the previous week the market value of iM-Combo5 gained -0.33% at a time when SPY gained 0.87%. A starting capital of $100,000 at inception on 2/22/2016 would have grown to $149,173 which includes $919 cash and excludes $0 spent on fees and slippage. |
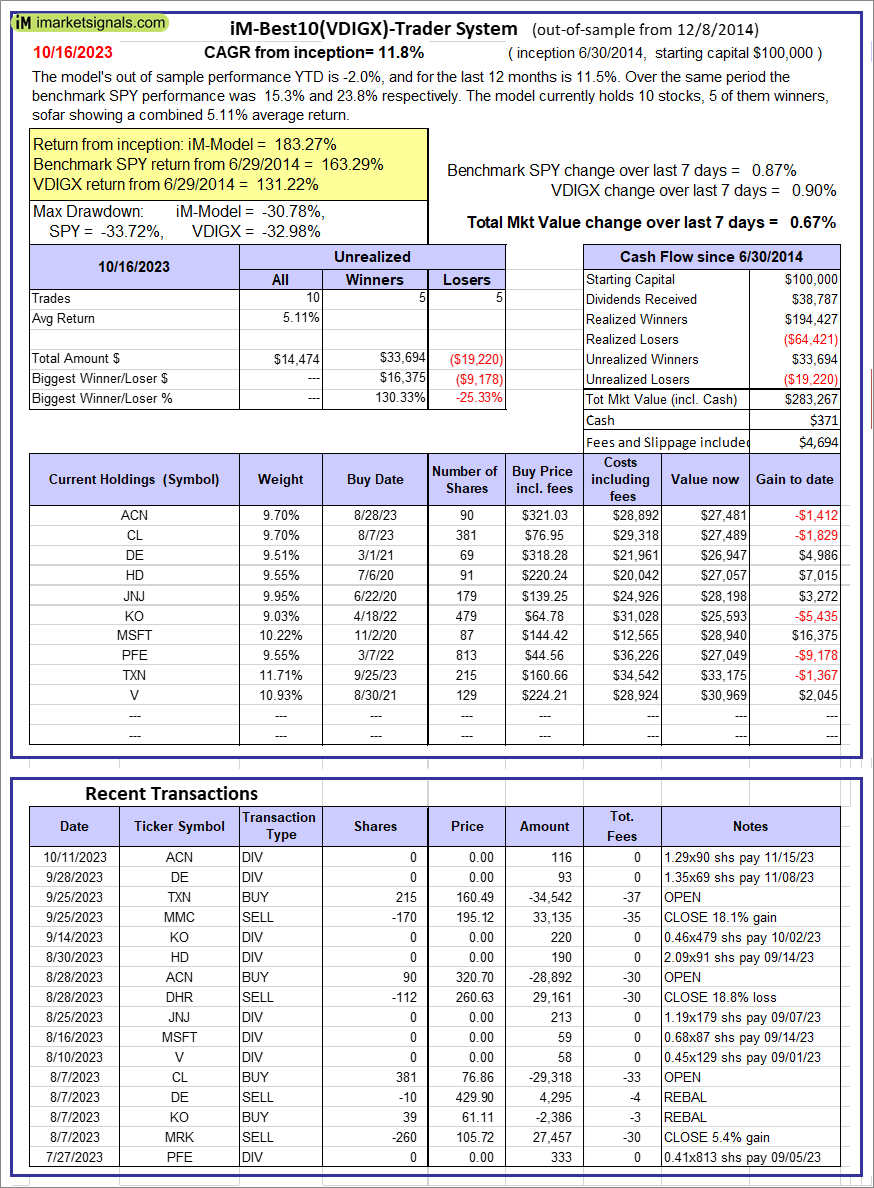 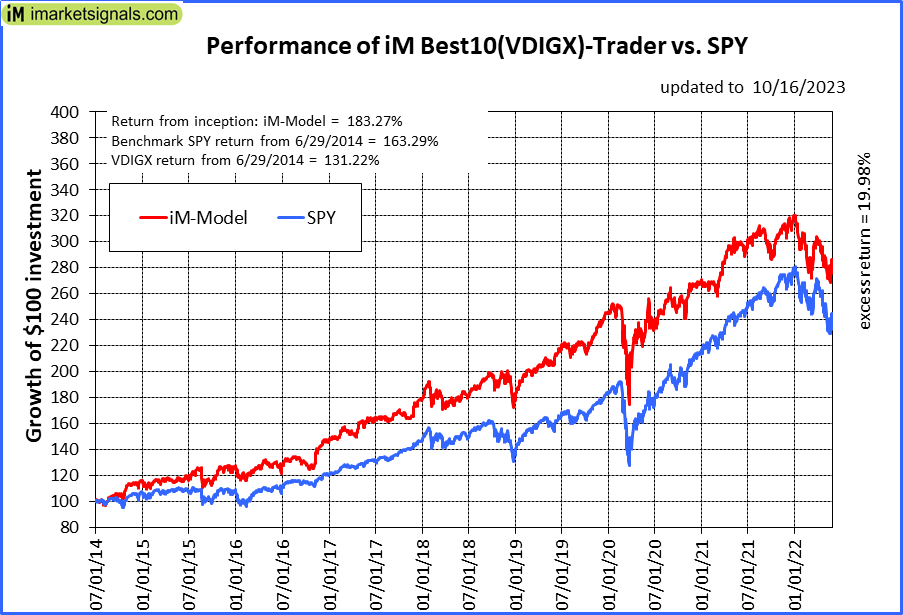 |
iM-Best10(VDIGX)-Trader: The model’s out of sample performance YTD is -2.0%, and for the last 12 months is 11.5%. Over the same period the benchmark SPY performance was 15.3% and 23.8% respectively. Since inception, on 7/1/2014, the model gained 183.27% while the benchmark SPY gained 163.29% and VDIGX gained 131.22% over the same period. Over the previous week the market value of iM-Best10(VDIGX) gained 0.67% at a time when SPY gained 0.87%. A starting capital of $100,000 at inception on 7/1/2014 would have grown to $283,267 which includes $371 cash and excludes $4,694 spent on fees and slippage. |
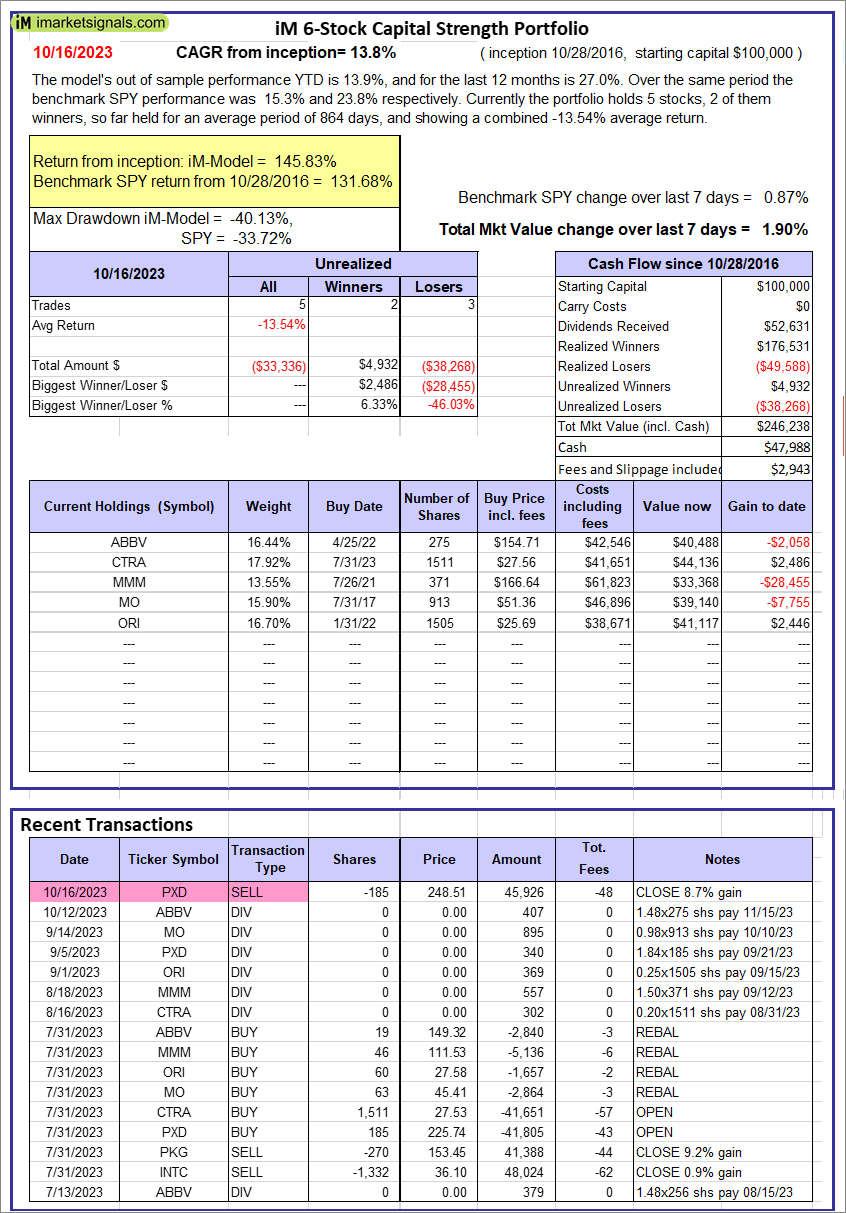 |
iM 6-Stock Capital Strength Portfolio: The model’s out of sample performance YTD is 13.9%, and for the last 12 months is 27.0%. Over the same period the benchmark SPY performance was 15.3% and 23.8% respectively. Over the previous week the market value of the iM 6-Stock Capital Strength Portfolio gained 1.90% at a time when SPY gained 0.87%. A starting capital of $100,000 at inception on 10/28/2016 would have grown to $246,238 which includes $47,988 cash and excludes $2,943 spent on fees and slippage. |
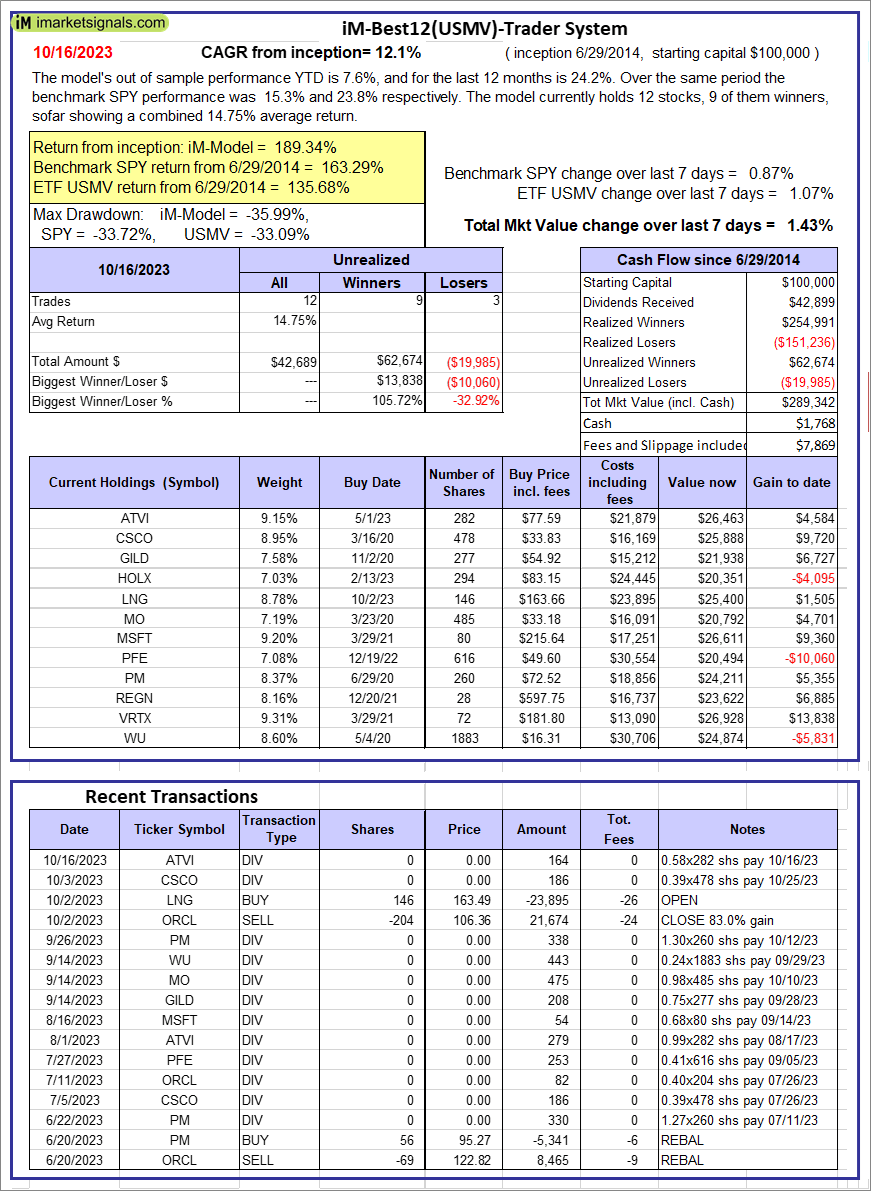 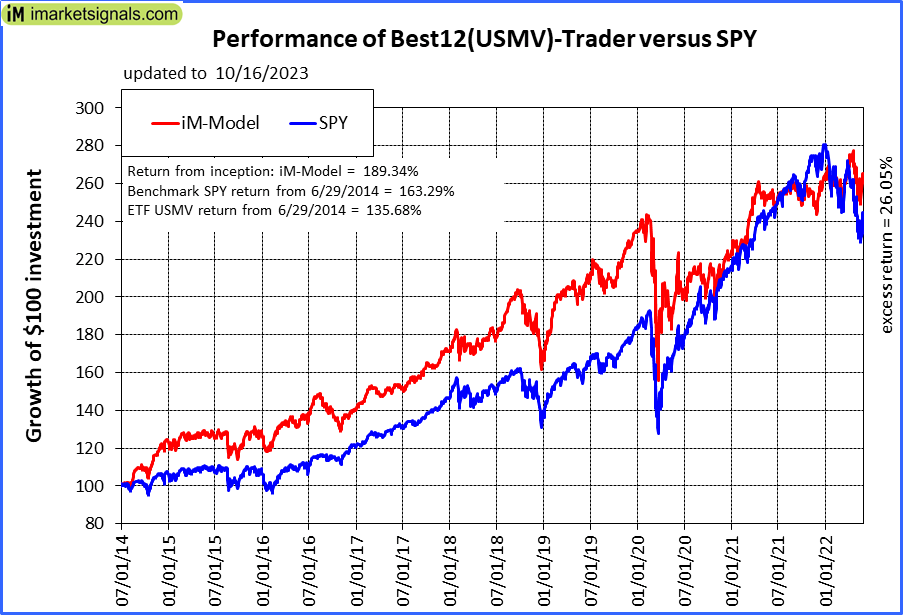 |
iM-Best12(USMV)-Trader: The model’s out of sample performance YTD is 7.6%, and for the last 12 months is 24.2%. Over the same period the benchmark SPY performance was 15.3% and 23.8% respectively. Since inception, on 6/30/2014, the model gained 189.34% while the benchmark SPY gained 163.29% and the ETF USMV gained 135.68% over the same period. Over the previous week the market value of iM-Best12(USMV)-Trader gained 1.43% at a time when SPY gained 0.87%. A starting capital of $100,000 at inception on 6/30/2014 would have grown to $289,342 which includes $1,768 cash and excludes $7,869 spent on fees and slippage. |
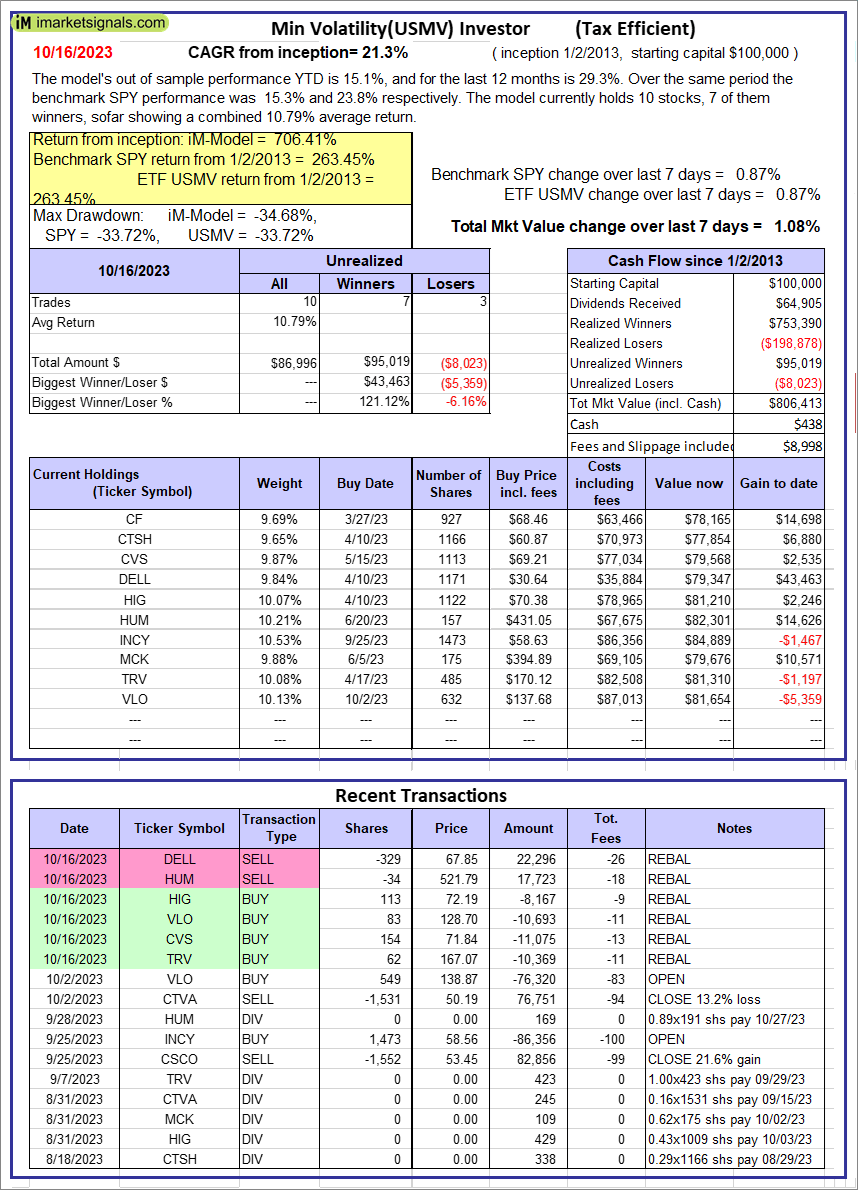 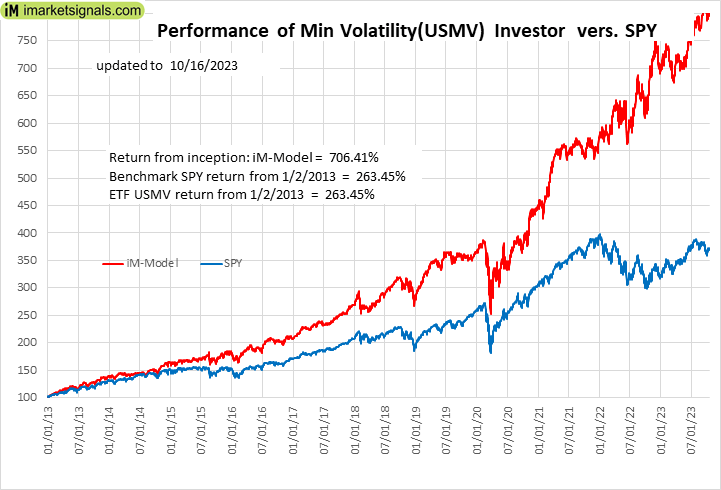 |
iM-Min Volatility(USMV) Investor (Tax Efficient): The model’s out of sample performance YTD is 15.1%, and for the last 12 months is 29.3%. Over the same period the benchmark SPY performance was 15.3% and 23.8% respectively. Since inception, on 1/3/2013, the model gained 706.41% while the benchmark SPY gained 263.45% and the ETF USMV gained 263.45% over the same period. Over the previous week the market value of iM-Best12(USMV)Q1 gained 1.08% at a time when SPY gained 0.87%. A starting capital of $100,000 at inception on 1/3/2013 would have grown to $806,413 which includes $438 cash and excludes $8,998 spent on fees and slippage. |
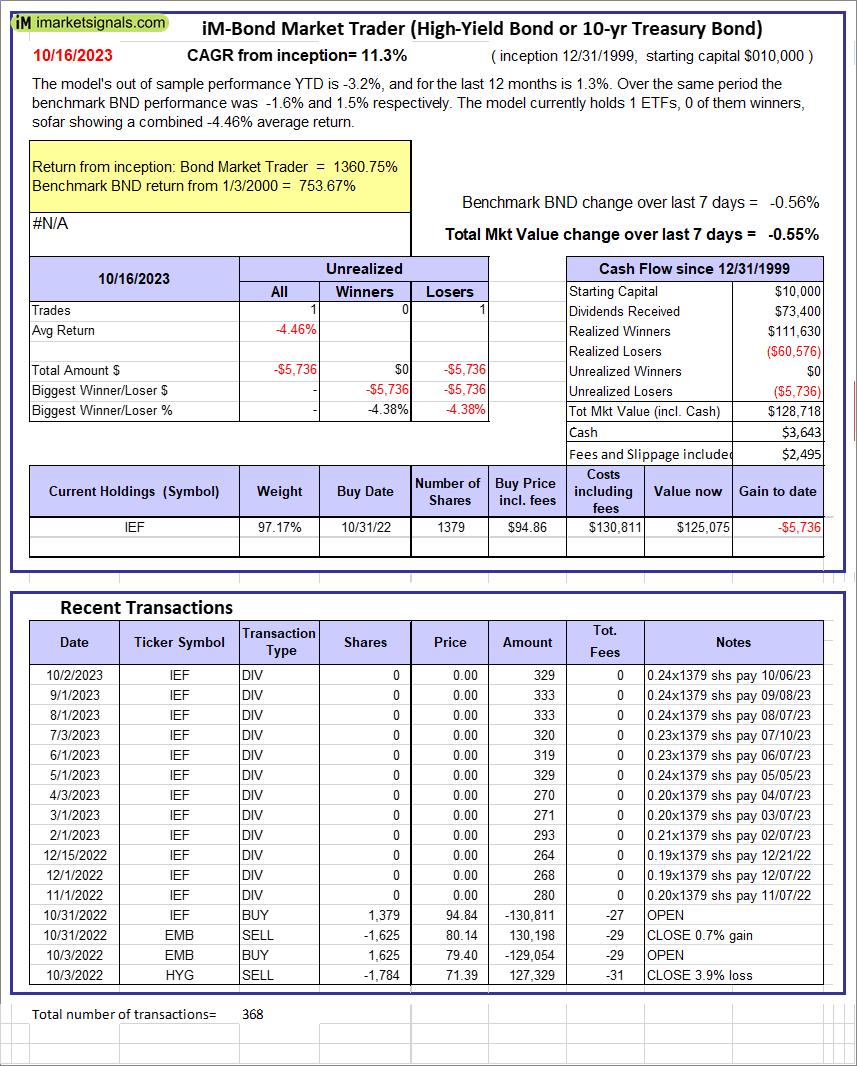 |
iM-Bond Market Trader (High-Yield Bond or 10-yr Treasury Bond): The model’s out of sample performance YTD is -3.2%, and for the last 12 months is 1.3%. Over the same period the benchmark BND performance was -1.6% and 1.5% respectively. Over the previous week the market value of the iM-Bond Market Trader (High-Yield Bond or 10-yr Treasury Bond) gained -0.55% at a time when BND gained -0.56%. A starting capital of $10,000 at inception on 1/3/2000 would have grown to $128,718 which includes $3,643 cash and excludes $2,495 spent on fees and slippage. |
|
|
iM-ModSum/YieldCurve Timer: The model’s out of sample performance YTD is -1.1%, and for the last 12 months is 9.3%. Over the same period the benchmark SPY performance was 15.3% and 23.8% respectively. Over the previous week the market value of iM-PortSum/YieldCurve Timer gained -0.57% at a time when SPY gained 0.87%. A starting capital of $100,000 at inception on 1/1/2016 would have grown to $249,462 which includes $1,851 cash and excludes $1,367 spent on fees and slippage. |
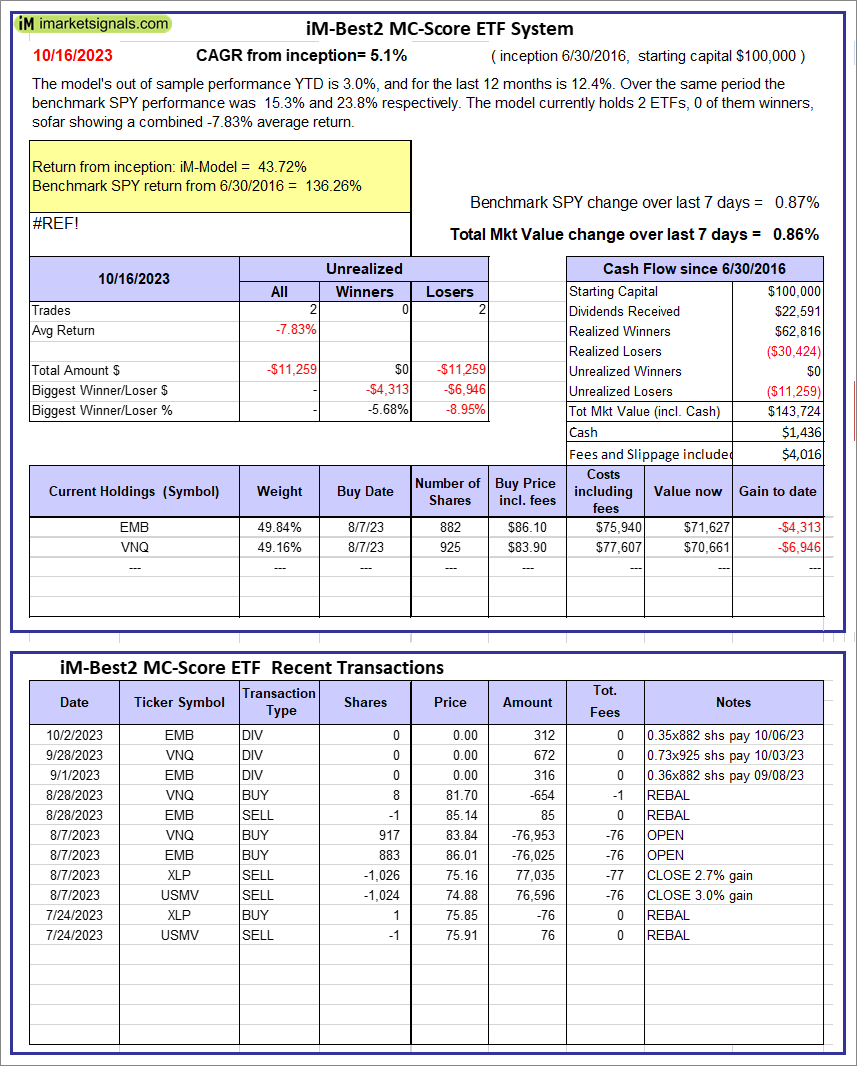 |
iM-Best2 MC-Score ETF System: The model’s out of sample performance YTD is 3.0%, and for the last 12 months is 12.4%. Over the same period the benchmark SPY performance was 15.3% and 23.8% respectively. Over the previous week the market value of the iM-Best2 MC-Score ETF System gained 0.86% at a time when SPY gained 0.87%. A starting capital of $100,000 at inception on 6/30/2016 would have grown to $143,724 which includes $1,436 cash and excludes $4,016 spent on fees and slippage. |
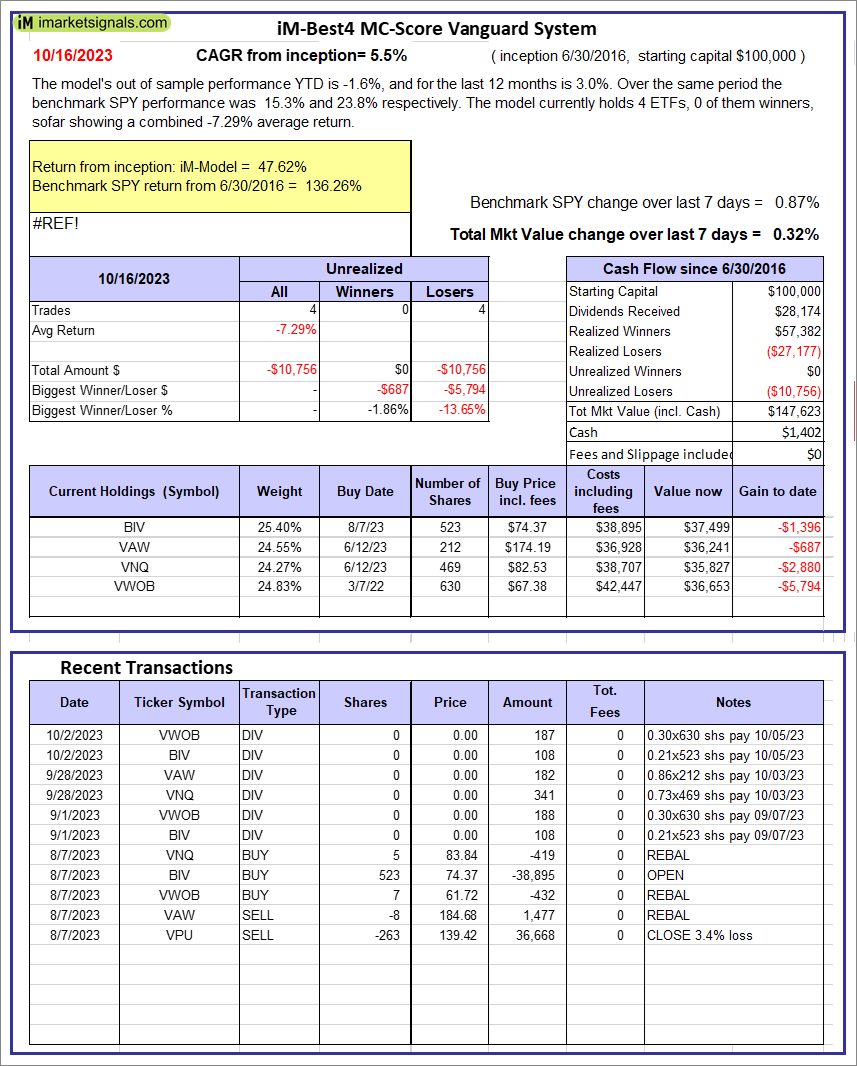 |
iM-Best4 MC-Score Vanguard System: The model’s out of sample performance YTD is -1.6%, and for the last 12 months is 3.0%. Over the same period the benchmark SPY performance was 15.3% and 23.8% respectively. Over the previous week the market value of the iM-Best4 MC-Score Vanguard System gained 0.32% at a time when SPY gained 0.87%. A starting capital of $100,000 at inception on 6/30/2016 would have grown to $147,623 which includes $1,402 cash and excludes $00 spent on fees and slippage. |
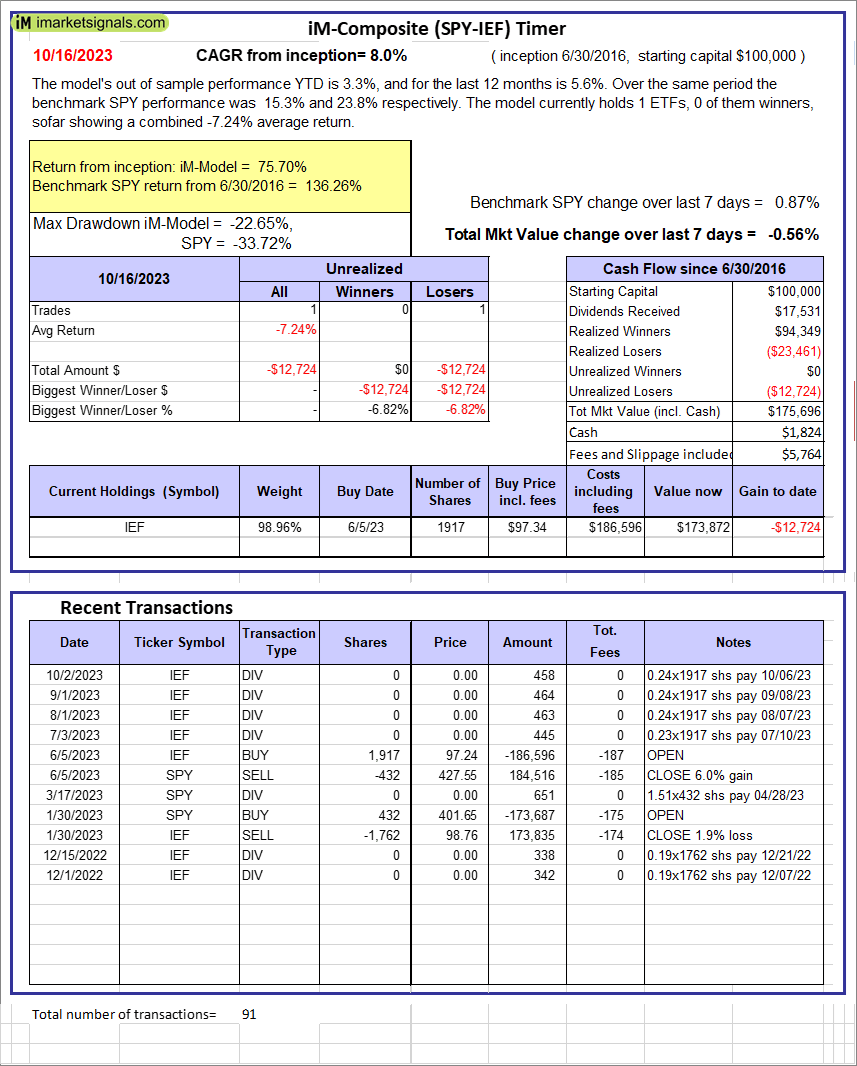 |
iM-Composite (SPY-IEF) Timer: The model’s out of sample performance YTD is 3.3%, and for the last 12 months is 5.6%. Over the same period the benchmark SPY performance was 15.3% and 23.8% respectively. Over the previous week the market value of the iM-Composite (SPY-IEF) Timer gained -0.56% at a time when SPY gained 0.87%. A starting capital of $100,000 at inception on 6/30/2016 would have grown to $175,696 which includes $1,824 cash and excludes $5,764 spent on fees and slippage. |
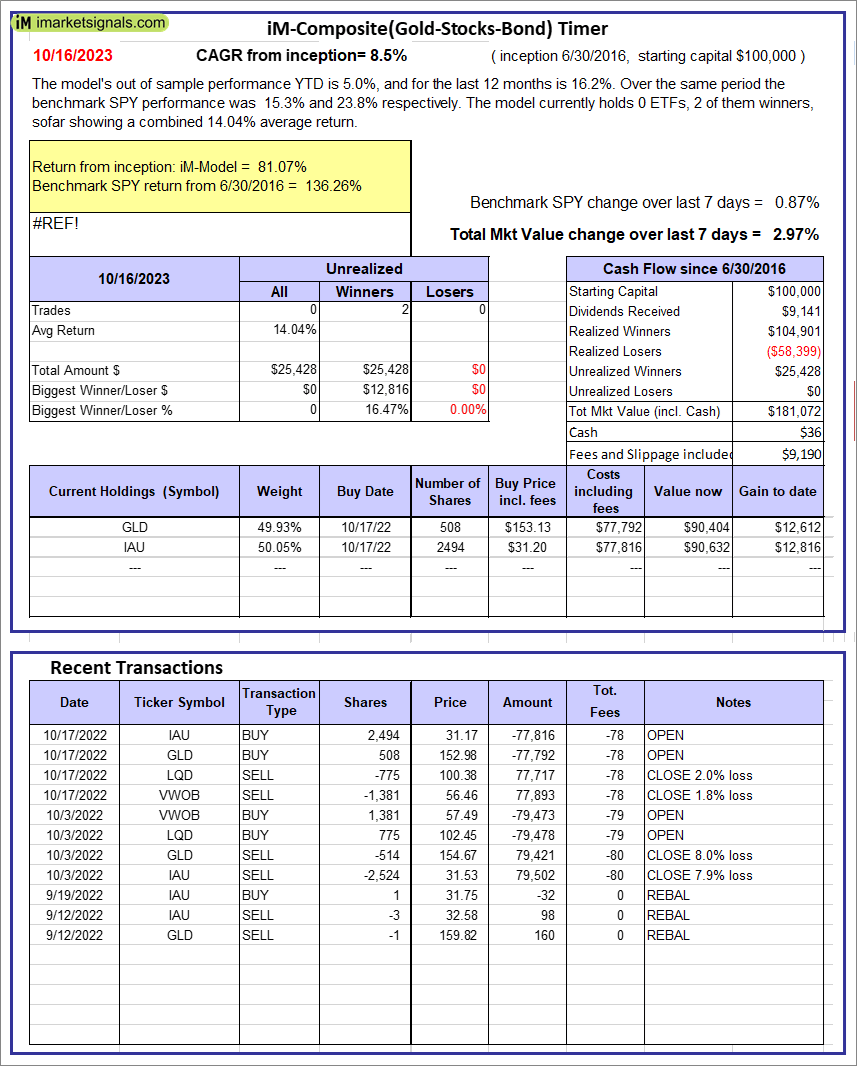 |
iM-Composite(Gold-Stocks-Bond) Timer: The model’s out of sample performance YTD is 5.0%, and for the last 12 months is 16.2%. Over the same period the benchmark SPY performance was 15.3% and 23.8% respectively. Over the previous week the market value of the iM-Composite(Gold-Stocks-Bond) Timer gained 2.97% at a time when SPY gained 0.87%. A starting capital of $100,000 at inception on 6/30/2016 would have grown to $181,072 which includes $36 cash and excludes $9,190 spent on fees and slippage. |
iM-Best Reports – 10/16/2023
Posted in pmp SPY-SH
Leave a Reply
You must be logged in to post a comment.