
  |
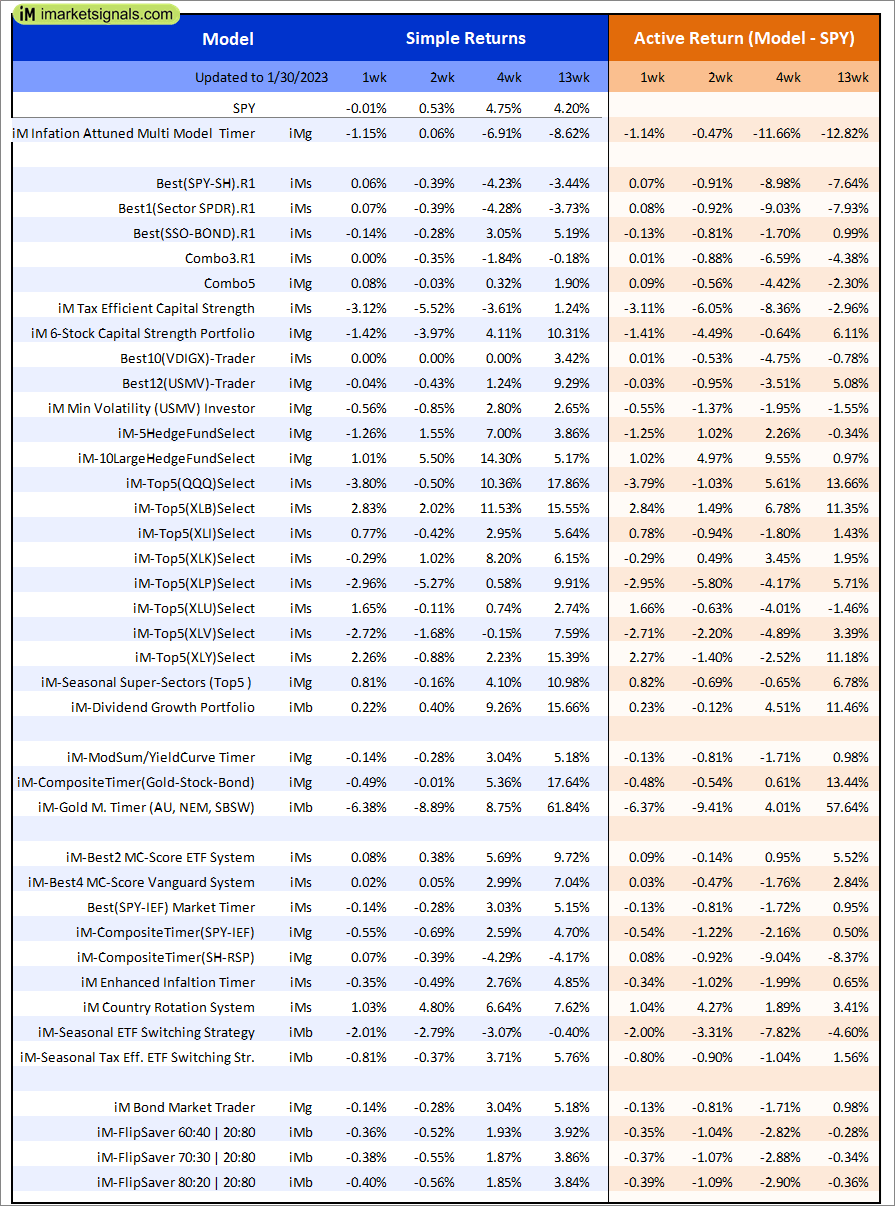
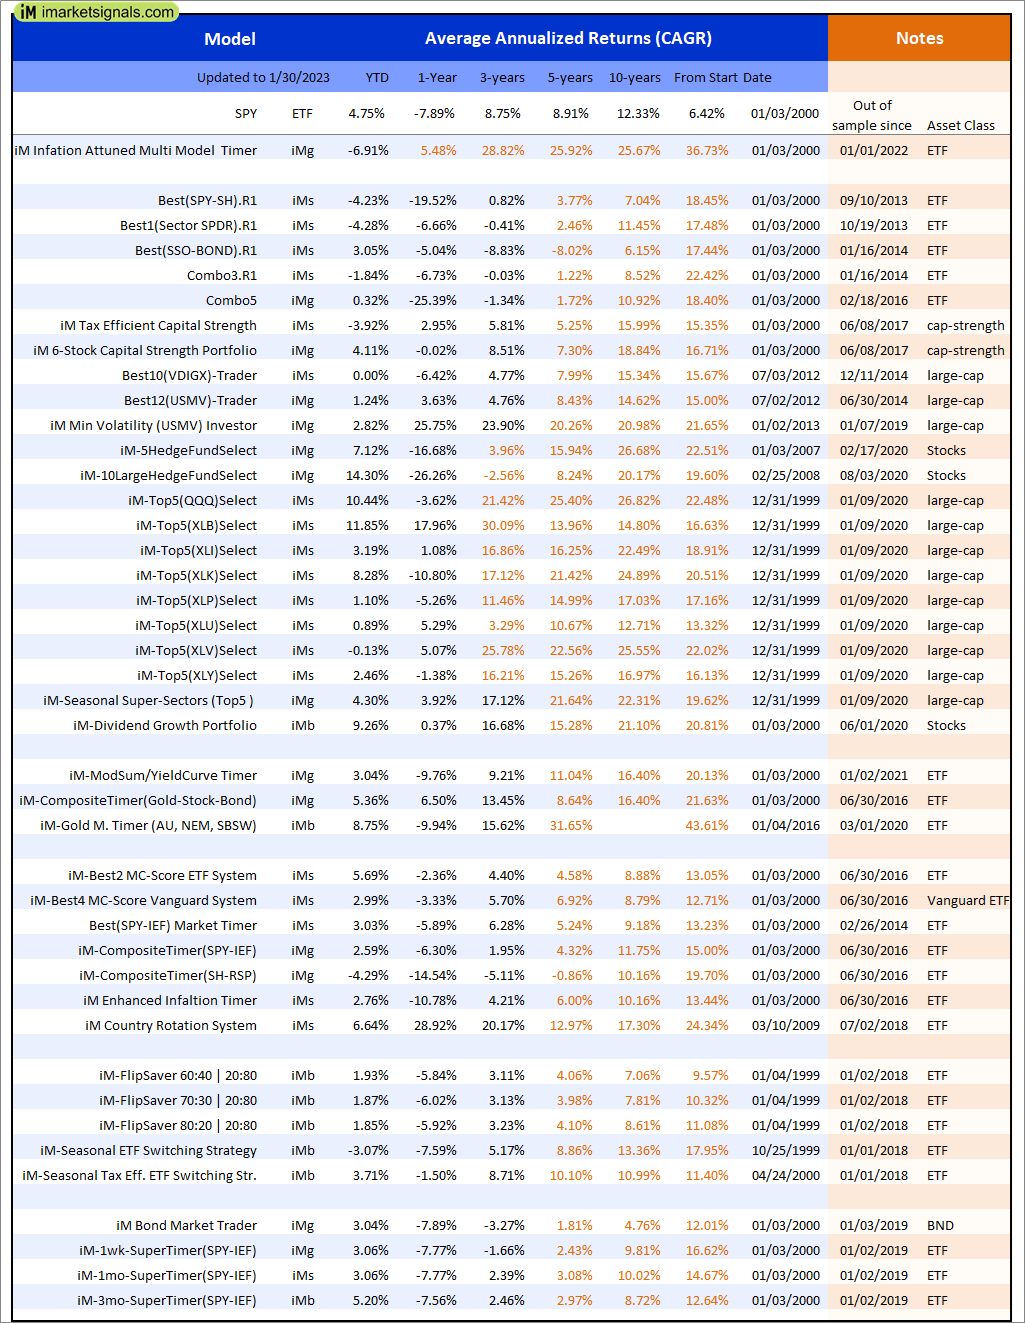
Out of sample performance summary of our models for the past 1, 2, 4 and 13 week periods. The active active return indicates how the models over- or underperformed the benchmark ETF SPY. Also the YTD, and the 1-, 3-, 5- and 10-year annualized returns are shown in the second table |
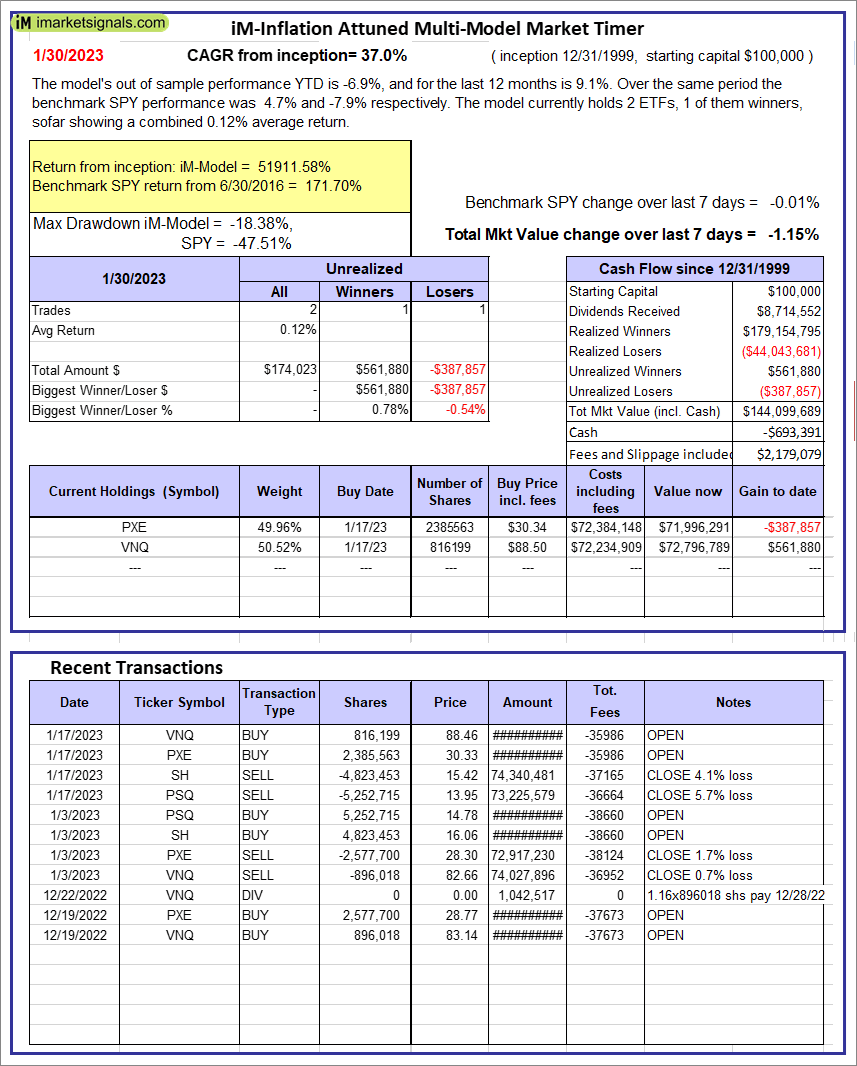 |
iM-Inflation Attuned Multi-Model Market Timer: The model’s out of sample performance YTD is -6.9%, and for the last 12 months is 9.1%. Over the same period the benchmark SPY performance was 4.7% and -7.9% respectively. Over the previous week the market value of the iM-Inflation Attuned Multi-Model Market Timer gained -1.15% at a time when SPY gained -0.01%. A starting capital of $100,000 at inception on 3/24/2017 would have grown to $144,099,689 which includes -$693,391 cash and excludes $2,179,079 spent on fees and slippage. |
 |
iM-FlipSaver 60:40 | 20:80 – 2017: The model’s out of sample performance YTD is 1.9%, and for the last 12 months is -6.1%. Over the same period the benchmark E60B40 performance was 4.0% and -7.7% respectively. Over the previous week the market value of iM-FlipSaver 80:20 | 20:80 gained -0.37% at a time when SPY gained -0.01%. A starting capital of $100,000 at inception on 7/16/2015 would have grown to $143,660 which includes $691 cash and excludes $2,960 spent on fees and slippage. |
 |
iM-FlipSaver 70:30 | 20:80 – 2017: The model’s out of sample performance YTD is 1.9%, and for the last 12 months is -6.0%. Over the same period the benchmark E60B40 performance was 4.0% and -7.7% respectively. Over the previous week the market value of iM-FlipSaver 70:30 | 20:80 gained -0.38% at a time when SPY gained -0.01%. A starting capital of $100,000 at inception on 7/15/2015 would have grown to $147,702 which includes $772 cash and excludes $3,126 spent on fees and slippage. |
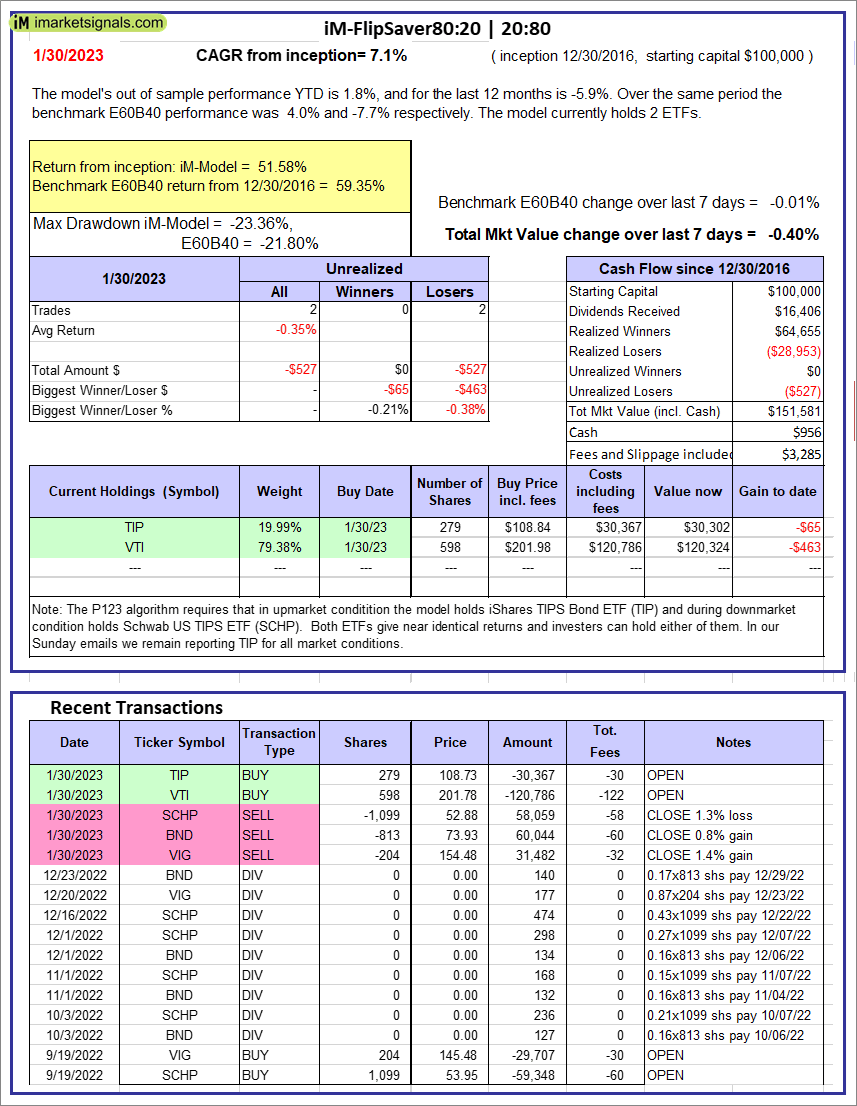 |
iM-FlipSaver 80:20 | 20:80 – 2017: The model’s out of sample performance YTD is 1.8%, and for the last 12 months is -5.9%. Over the same period the benchmark E60B40 performance was 4.0% and -7.7% respectively. Over the previous week the market value of iM-FlipSaver 80:20 | 20:80 gained -0.40% at a time when SPY gained -0.01%. A starting capital of $100,000 at inception on 1/2/2017 would have grown to $151,581 which includes $956 cash and excludes $3,285 spent on fees and slippage. |
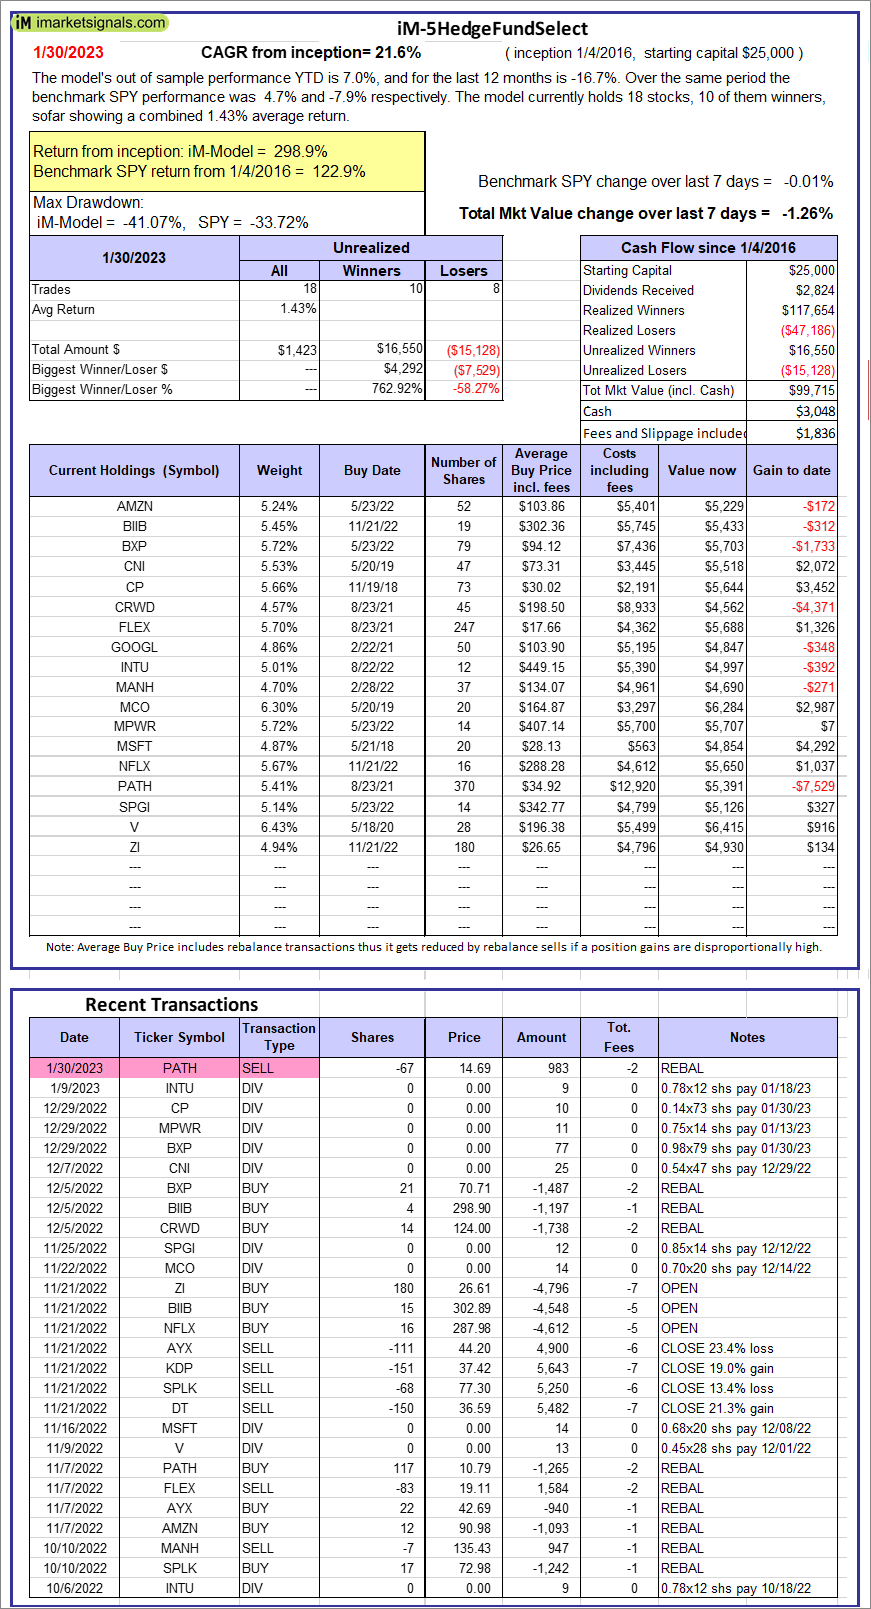  |
iM-5HedgeFundSelect: Since inception, on 1/5/2016, the model gained 298.86% while the benchmark SPY gained 122.86% over the same period. Over the previous week the market value of iM-5HedgeFundSelect gained -1.26% at a time when SPY gained -0.01%. A starting capital of $25,000 at inception on 1/5/2016 would have grown to $99,715 which includes $3,048 cash and excludes $1,836 spent on fees and slippage. |
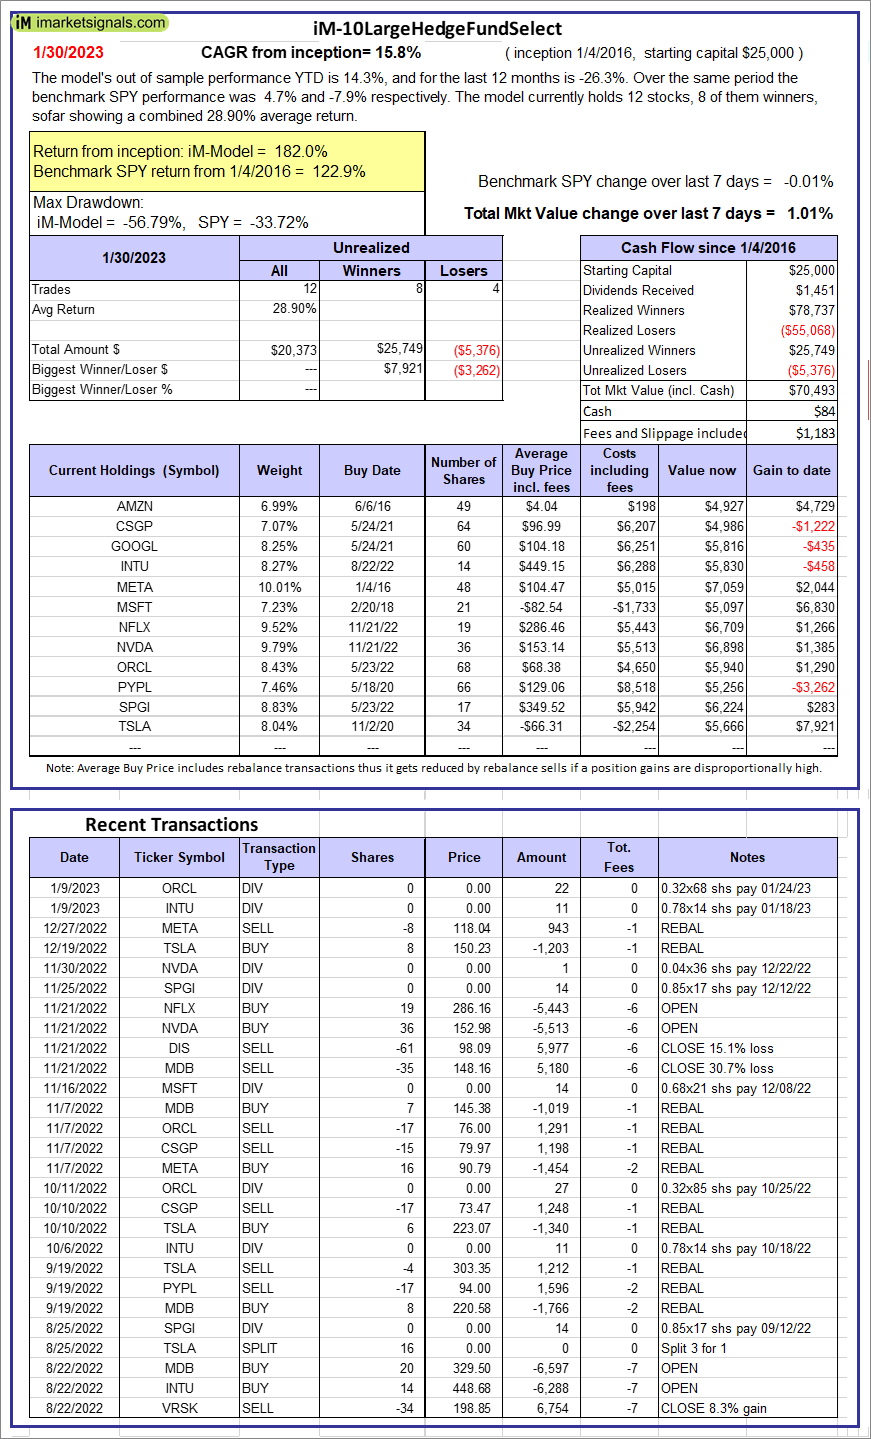 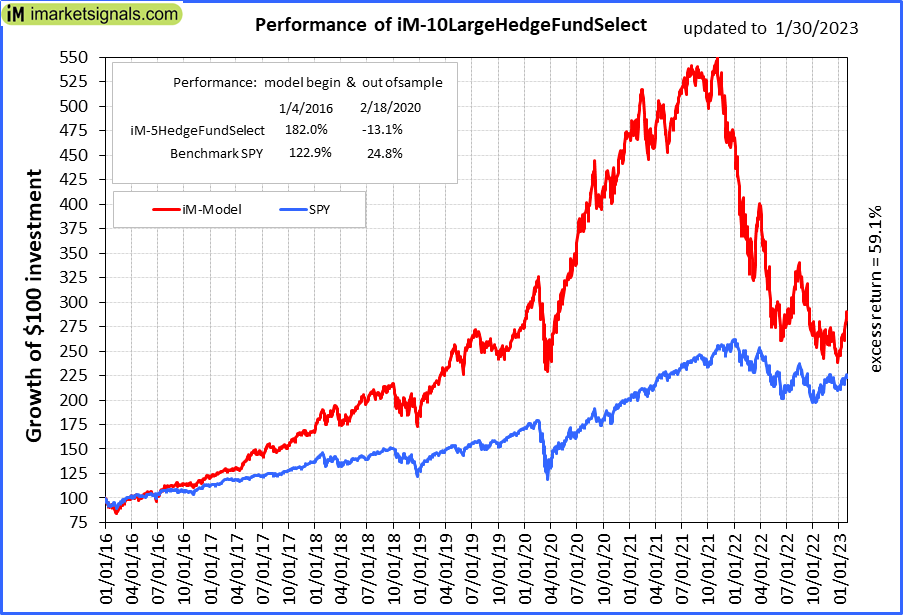 |
iM-10LargeHedgeFundSelect: Since inception, on 1/5/2016, the model gained 181.97% while the benchmark SPY gained 122.86% over the same period. Over the previous week the market value of iM-10LargeHedgeFundSelect gained 1.01% at a time when SPY gained -0.01%. A starting capital of $25,000 at inception on 1/5/2016 would have grown to $70,493 which includes $84 cash and excludes $1,183 spent on fees and slippage. |
 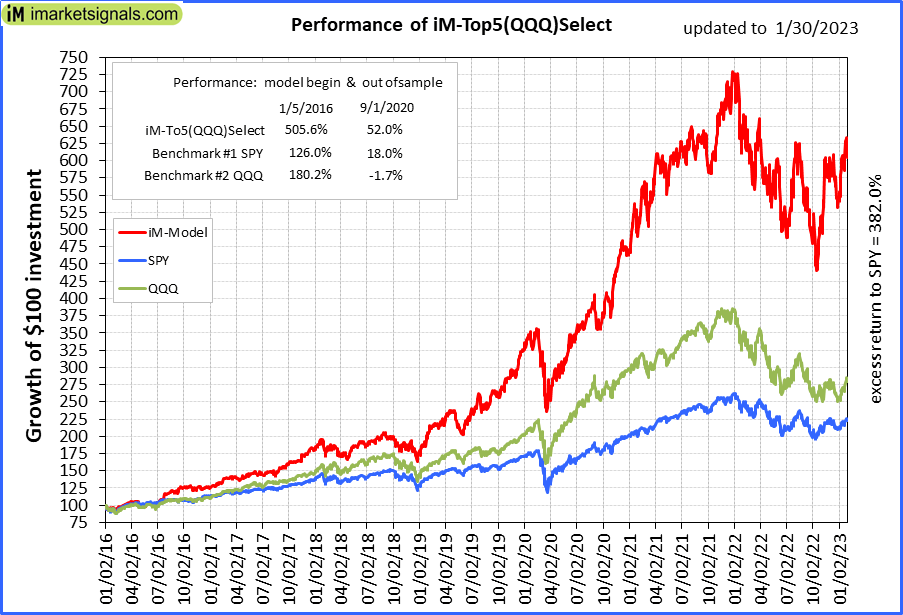 |
iM-Top5(QQQ)Select: Since inception, on 1/5/2016, the model gained 504.88% while the benchmark SPY gained 122.86% over the same period. Over the previous week the market value of iM-Top5(QQQ)Select gained -3.80% at a time when SPY gained -0.01%. A starting capital of $100,000 at inception on 1/5/2016 would have grown to $604,881 which includes $3,450 cash and excludes $9,478 spent on fees and slippage. |
 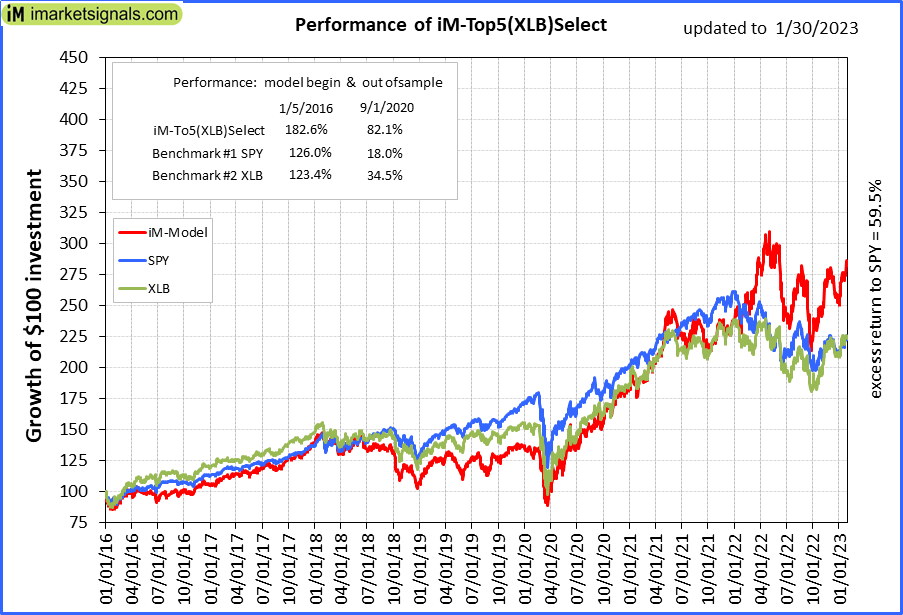 |
iM-Top5(XLB)Select: Since inception, on 1/5/2016, the model gained 182.32% while the benchmark SPY gained 122.86% over the same period. Over the previous week the market value of iM-Top5(XLB)Select gained 2.83% at a time when SPY gained -0.01%. A starting capital of $100,000 at inception on 1/5/2016 would have grown to $282,319 which includes $382 cash and excludes $9,399 spent on fees and slippage. |
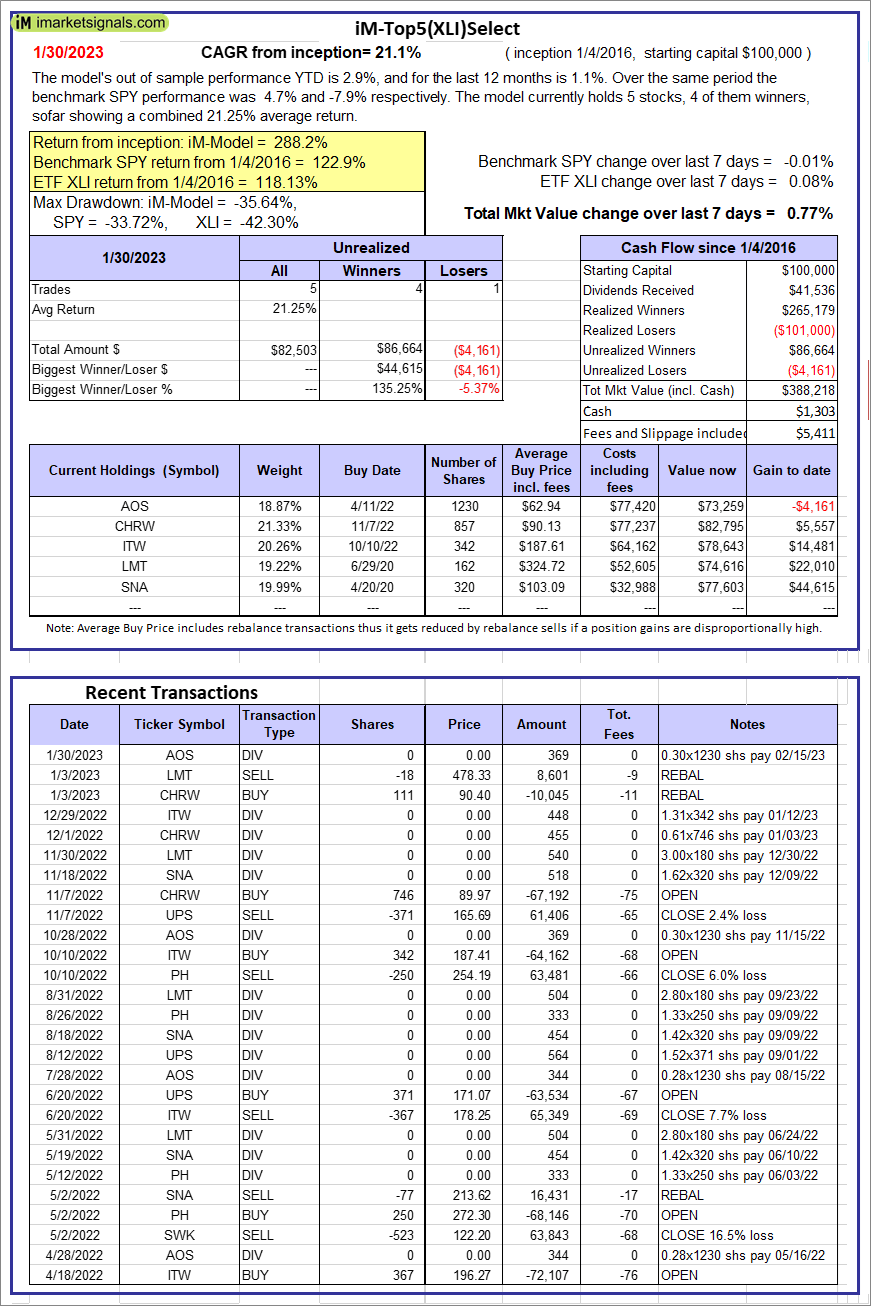 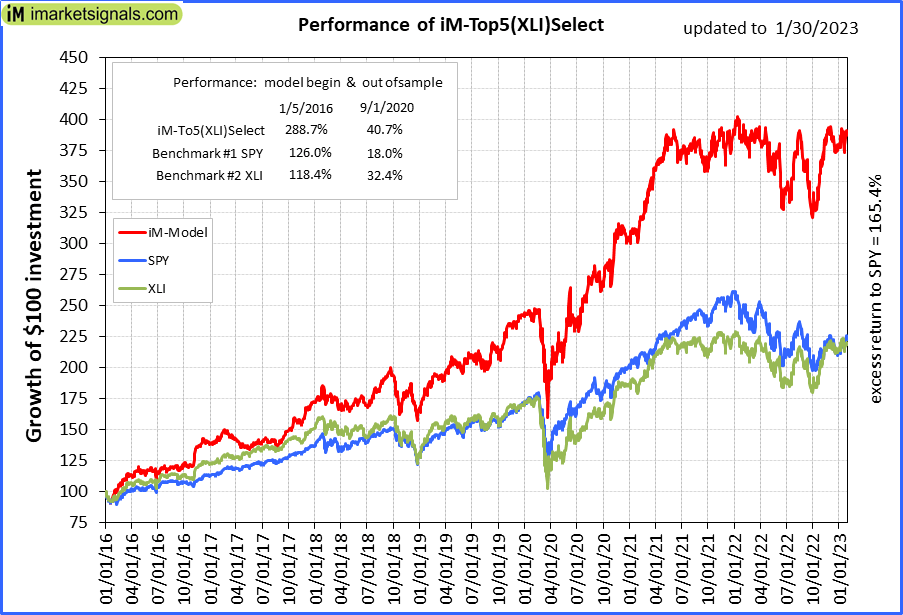 |
iM-Top5(XLI)Select: Since inception, on 1/5/2016, the model gained 288.22% while the benchmark SPY gained 122.86% over the same period. Over the previous week the market value of iM-Top5(XLI)Select gained 0.77% at a time when SPY gained -0.01%. A starting capital of $100,000 at inception on 1/5/2016 would have grown to $388,218 which includes $1,303 cash and excludes $5,411 spent on fees and slippage. |
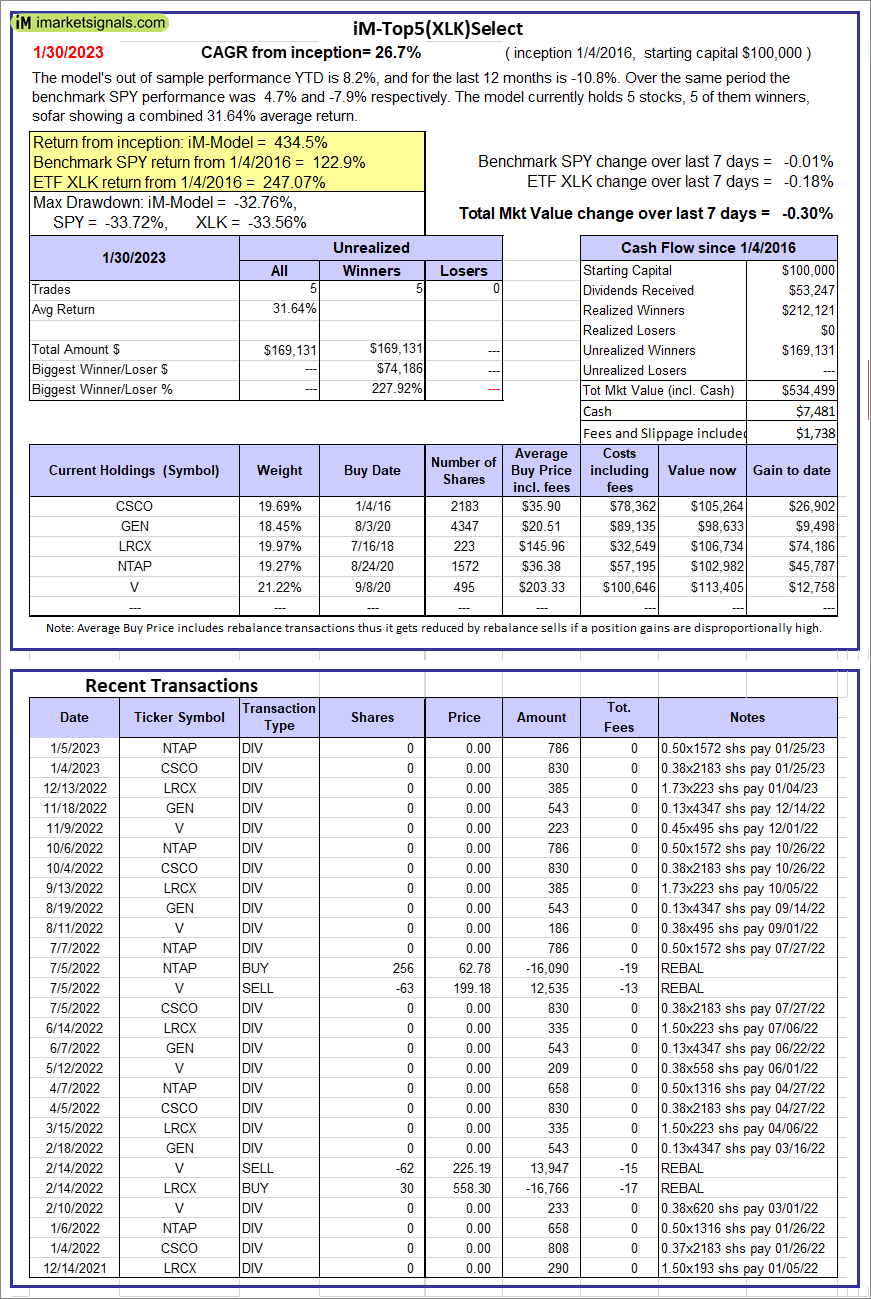 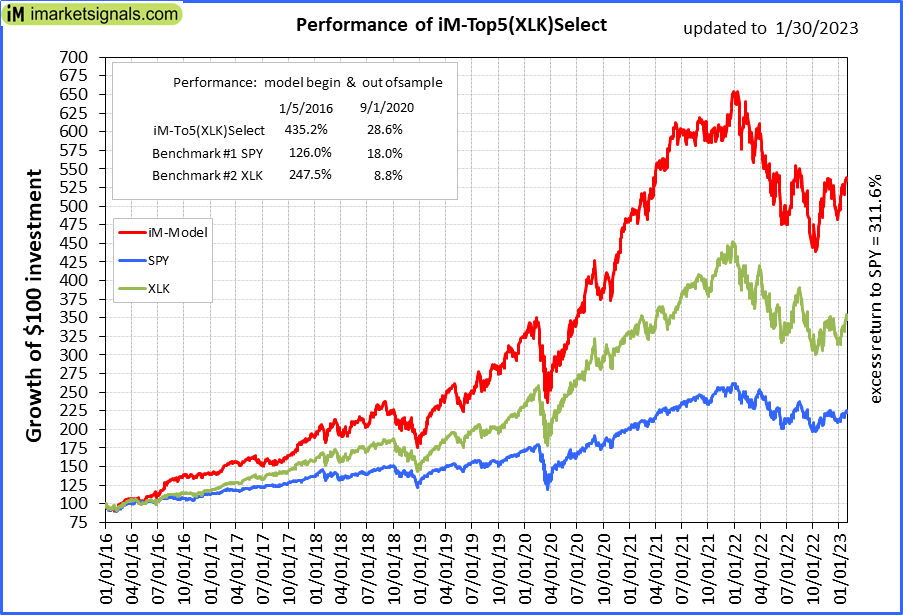 |
iM-Top5(XLK)Select: Since inception, on 1/5/2016, the model gained 434.50% while the benchmark SPY gained 122.86% over the same period. Over the previous week the market value of iM-Top5(XLK)Select gained -0.30% at a time when SPY gained -0.01%. A starting capital of $100,000 at inception on 1/5/2016 would have grown to $534,499 which includes $7,481 cash and excludes $1,738 spent on fees and slippage. |
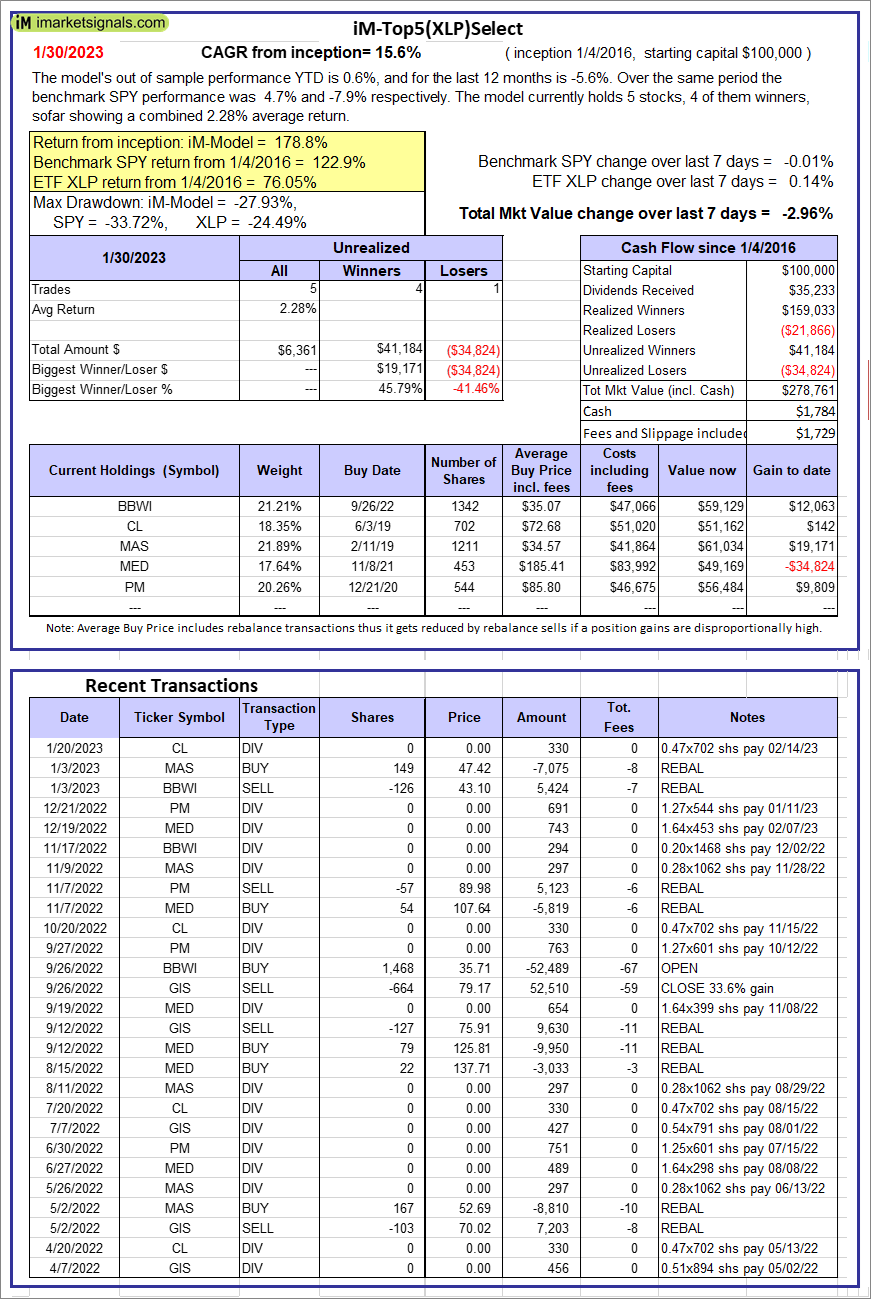 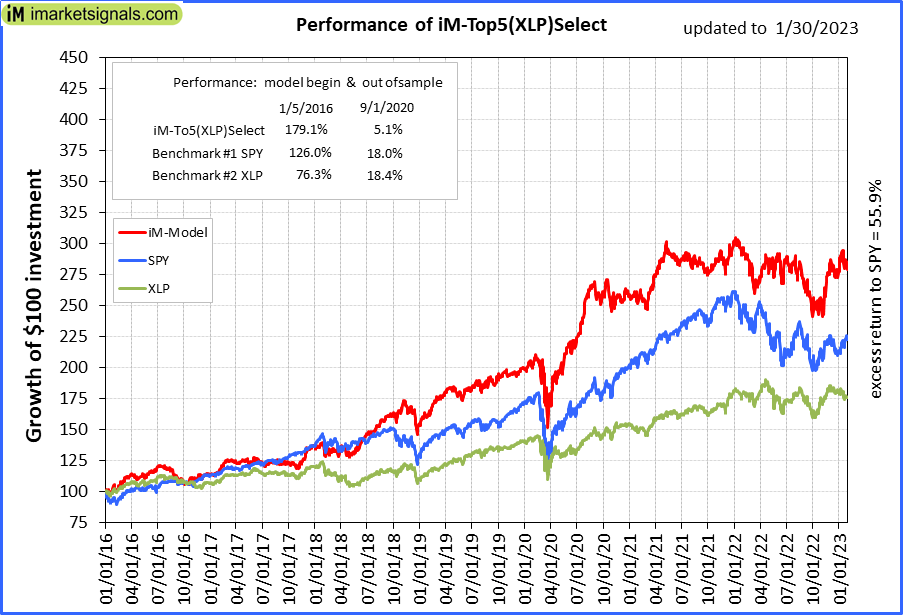 |
iM-Top5(XLP)Select: Since inception, on 1/5/2016, the model gained 178.76% while the benchmark SPY gained 122.86% over the same period. Over the previous week the market value of iM-Top5(XLP)Select gained -2.96% at a time when SPY gained -0.01%. A starting capital of $100,000 at inception on 1/5/2016 would have grown to $278,761 which includes $1,784 cash and excludes $1,729 spent on fees and slippage. |
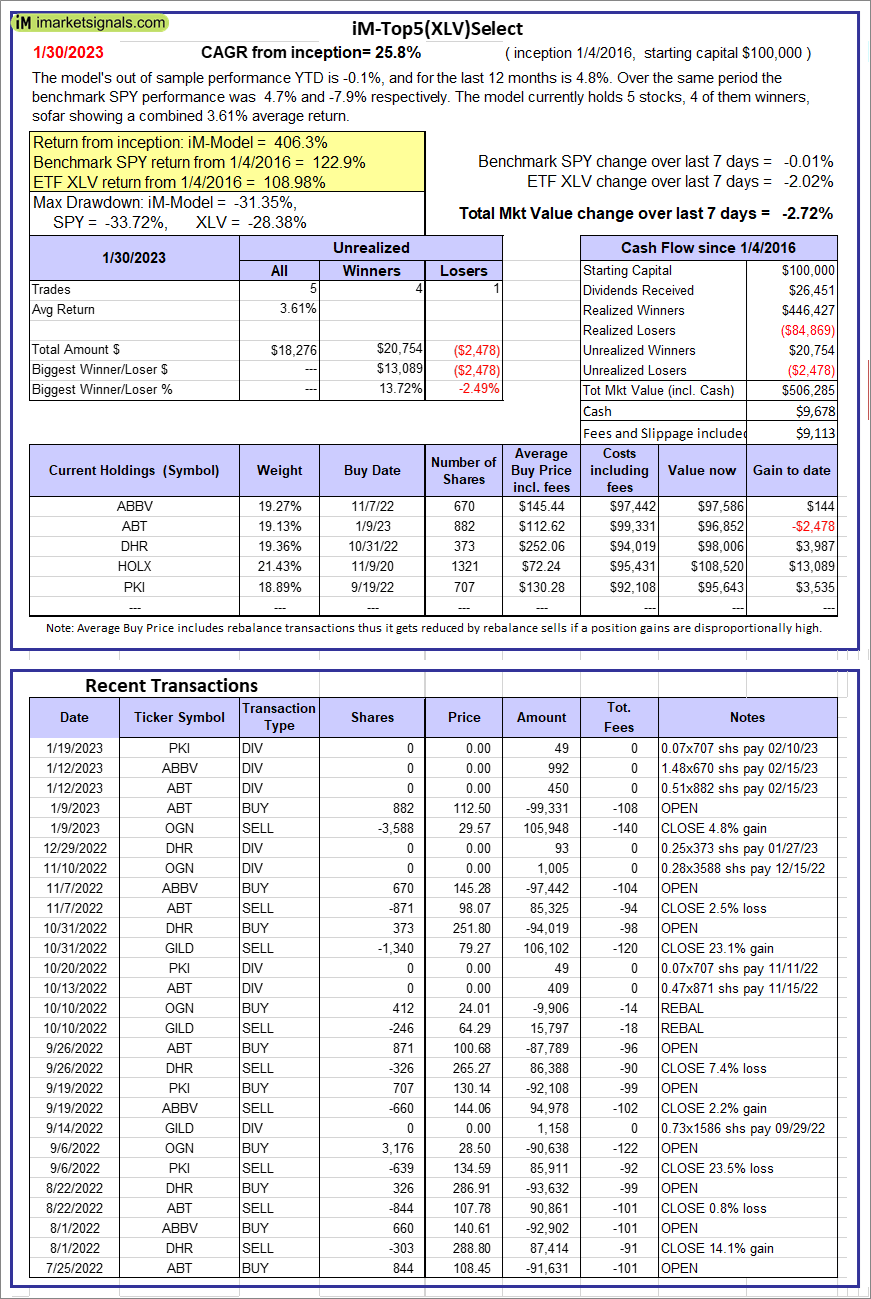 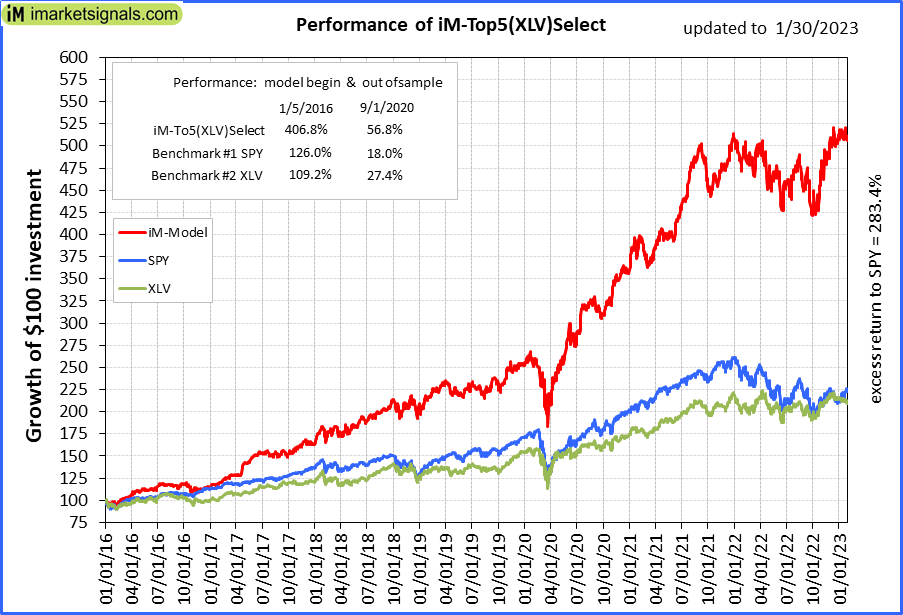 |
iM-Top5(XLV)Select: Since inception, on 1/5/2016, the model gained 406.28% while the benchmark SPY gained 122.86% over the same period. Over the previous week the market value of iM-Top5(XLV)Select gained -2.72% at a time when SPY gained -0.01%. A starting capital of $100,000 at inception on 1/5/2016 would have grown to $506,285 which includes $9,678 cash and excludes $9,113 spent on fees and slippage. |
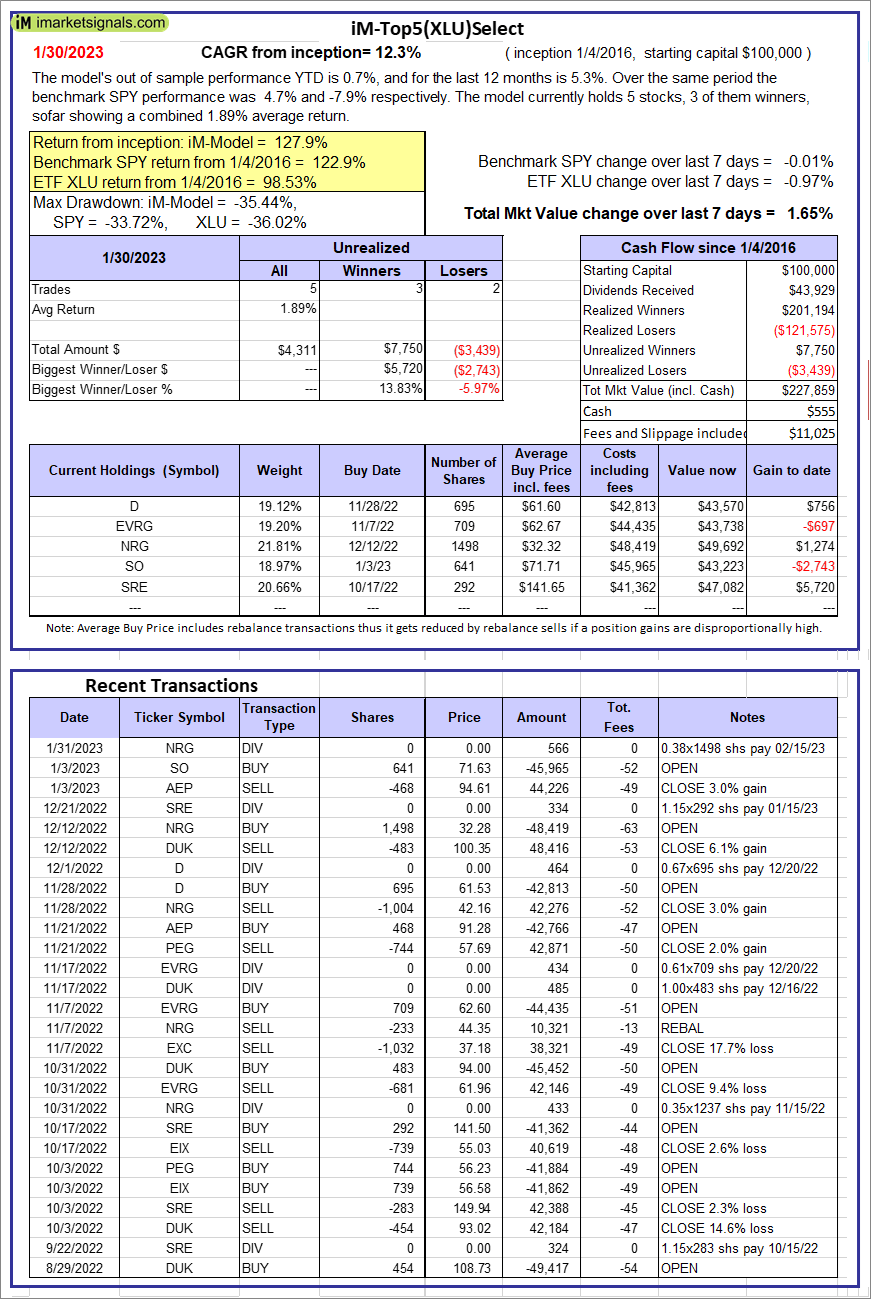 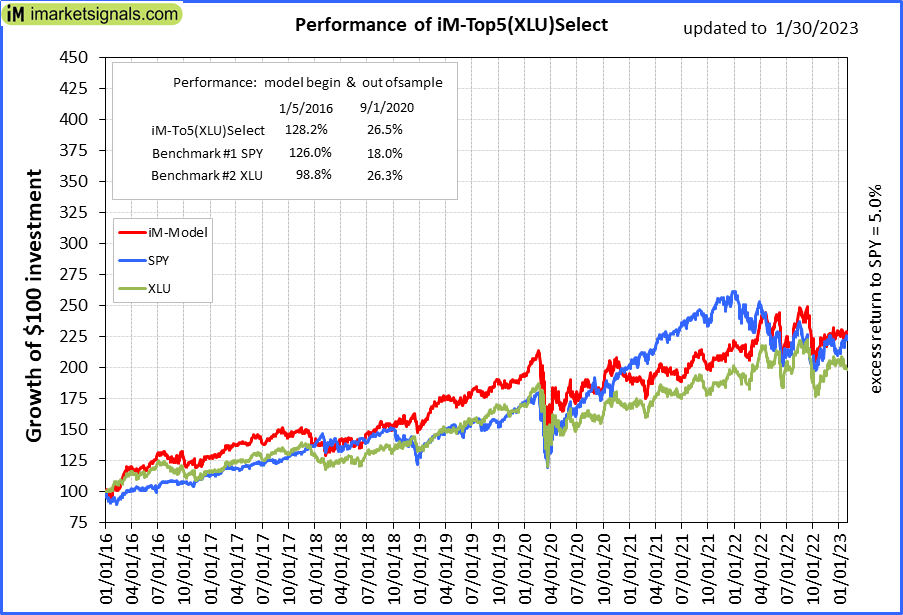 |
iM-Top5(XLU)Select: Since inception, on 1/5/2016, the model gained 127.86% while the benchmark SPY gained 122.86% over the same period. Over the previous week the market value of iM-Top5(XLU)Select gained 1.65% at a time when SPY gained -0.01%. A starting capital of $100,000 at inception on 1/5/2016 would have grown to $227,859 which includes $555 cash and excludes $11,025 spent on fees and slippage. |
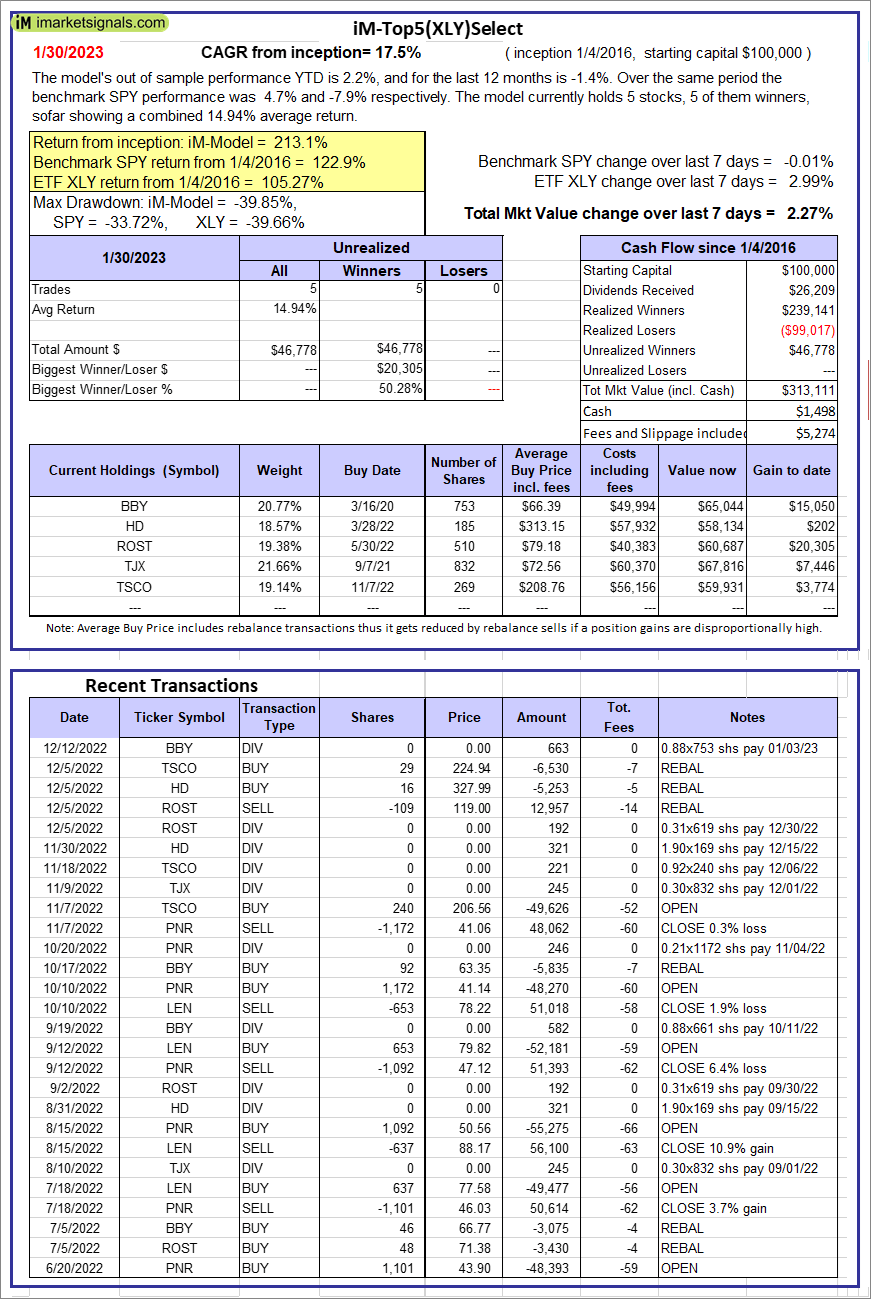 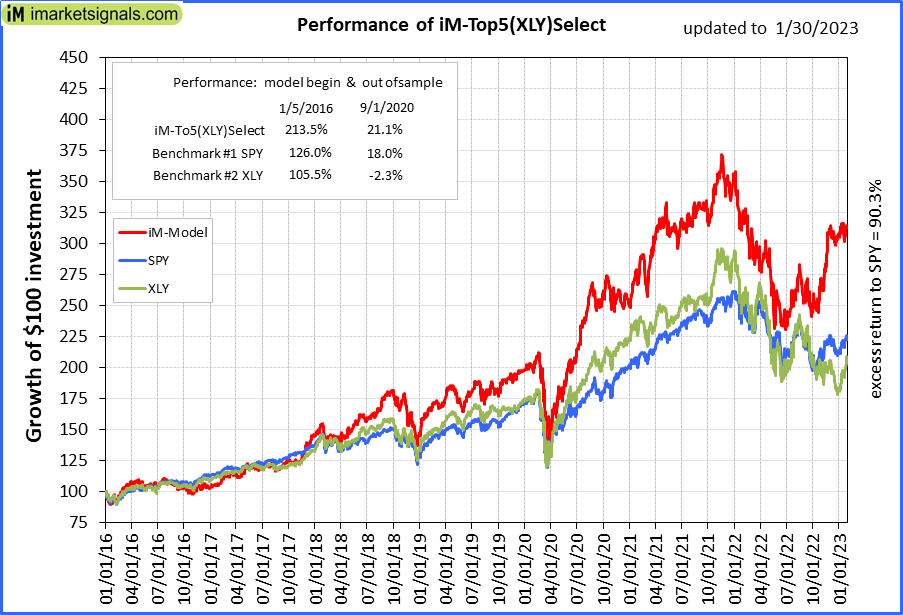 |
iM-Top5(XLY)Select: Since inception, on 1/5/2016, the model gained 213.11% while the benchmark SPY gained 122.86% over the same period. Over the previous week the market value of iM-Top5(XLY)Select gained 2.27% at a time when SPY gained -0.01%. A starting capital of $100,000 at inception on 1/5/2016 would have grown to $313,111 which includes $1,498 cash and excludes $5,274 spent on fees and slippage. |
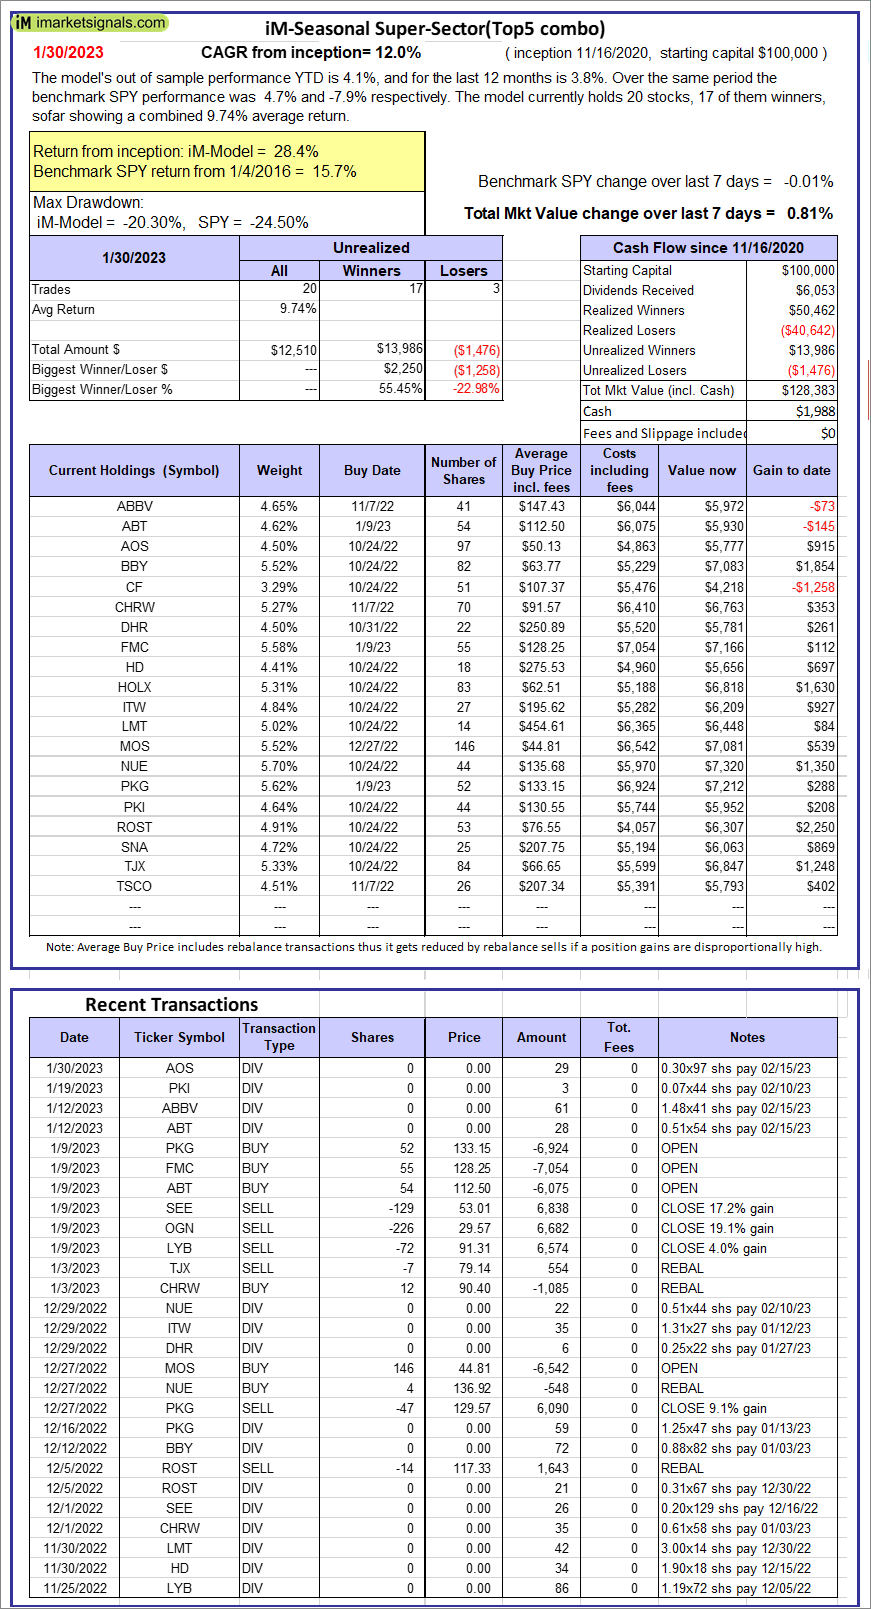 |
iM-Seasonal Super-Sectors (Top5 combo) : Since inception, on 11/17/2020, the model gained 28.38% while the benchmark SPY gained 15.69% over the same period. Over the previous week the market value of iM-Seasonal Super-Sectors (Top5 combo) gained 0.81% at a time when SPY gained -0.01%. A starting capital of $100,000 at inception on 11/17/2020 would have grown to $128,383 which includes $1,988 cash and excludes $00 spent on fees and slippage. |
 |
iM-Dividend Growth Portfolio: The model’s out of sample performance YTD is 8.3%, and for the last 12 months is 0.3%. Over the same period the benchmark SPY performance was 4.7% and -7.9% respectively. Over the previous week the market value of the iM-Dividend Growth Portfolio gained 0.05% at a time when SPY gained -0.01%. A starting capital of $100,000 at inception on 6/30/2016 would have grown to $393,228 which includes $3,162 cash and excludes $9,027 spent on fees and slippage. |
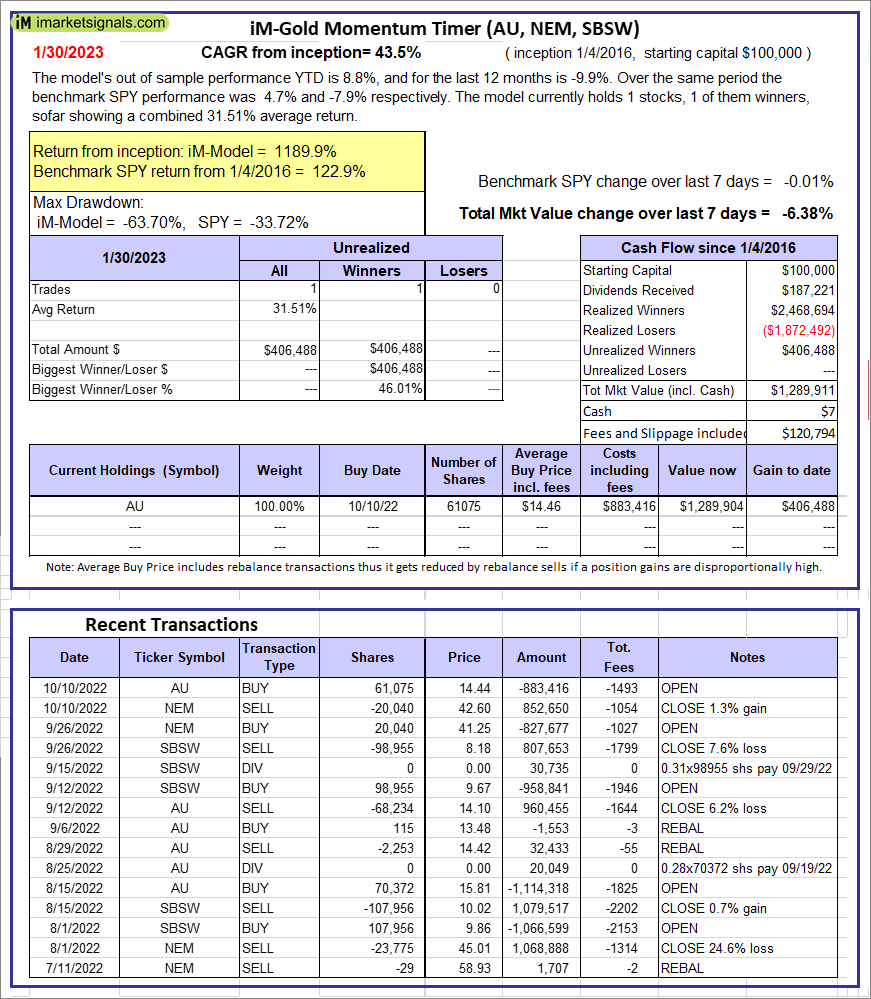 |
iM-Gold Momentum Timer (AU, NEM, SBSW): The model’s out of sample performance YTD is 8.8%, and for the last 12 months is -9.9%. Over the same period the benchmark SPY performance was 4.7% and -7.9% respectively. Over the previous week the market value of iM-Gold Momentum Timer (AU, NEM, SBSW) gained -6.38% at a time when SPY gained -0.01%. A starting capital of $100,000 at inception on 6/30/2016 would have grown to $07 which includes $120,794 cash and excludes Gain to date spent on fees and slippage. |
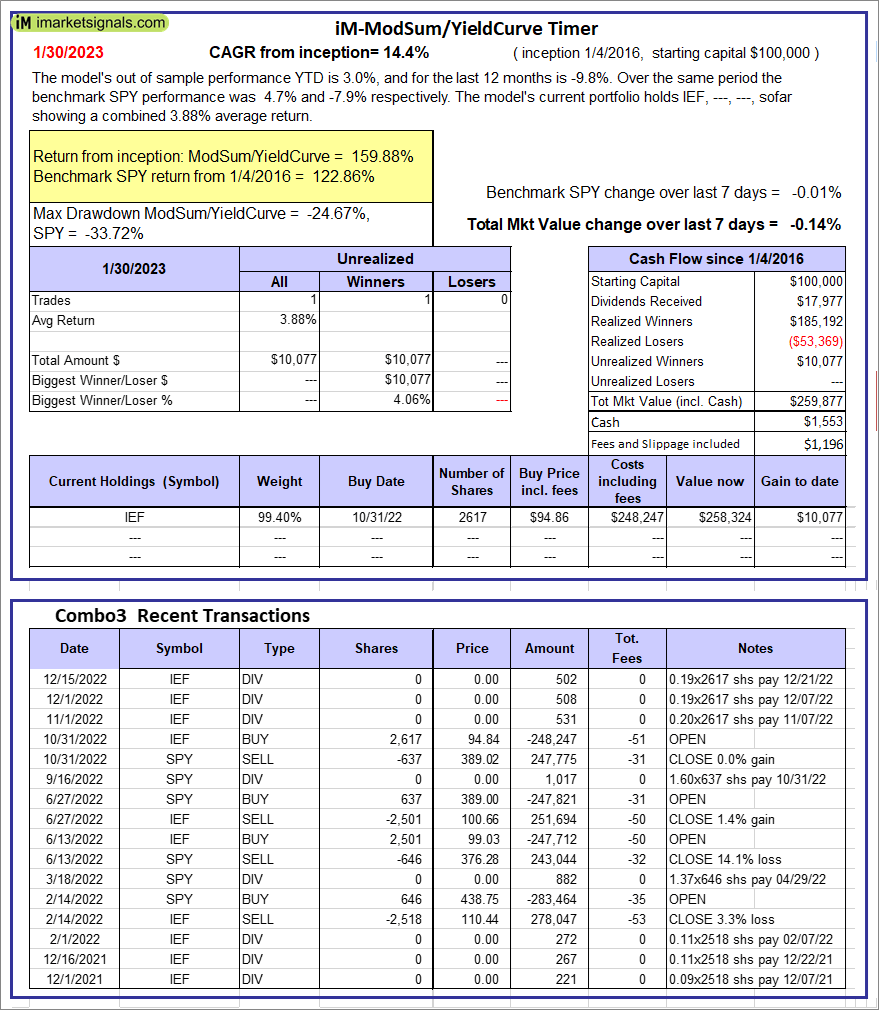 |
iM-ModSum/YieldCurve Timer: The model’s out of sample performance YTD is 3.0%, and for the last 12 months is -9.8%. Over the same period the benchmark SPY performance was 4.7% and -7.9% respectively. Over the previous week the market value of iM-PortSum/YieldCurve Timer gained -0.14% at a time when SPY gained -0.01%. A starting capital of $100,000 at inception on 1/1/2016 would have grown to $259,877 which includes $1,553 cash and excludes $1,196 spent on fees and slippage. |
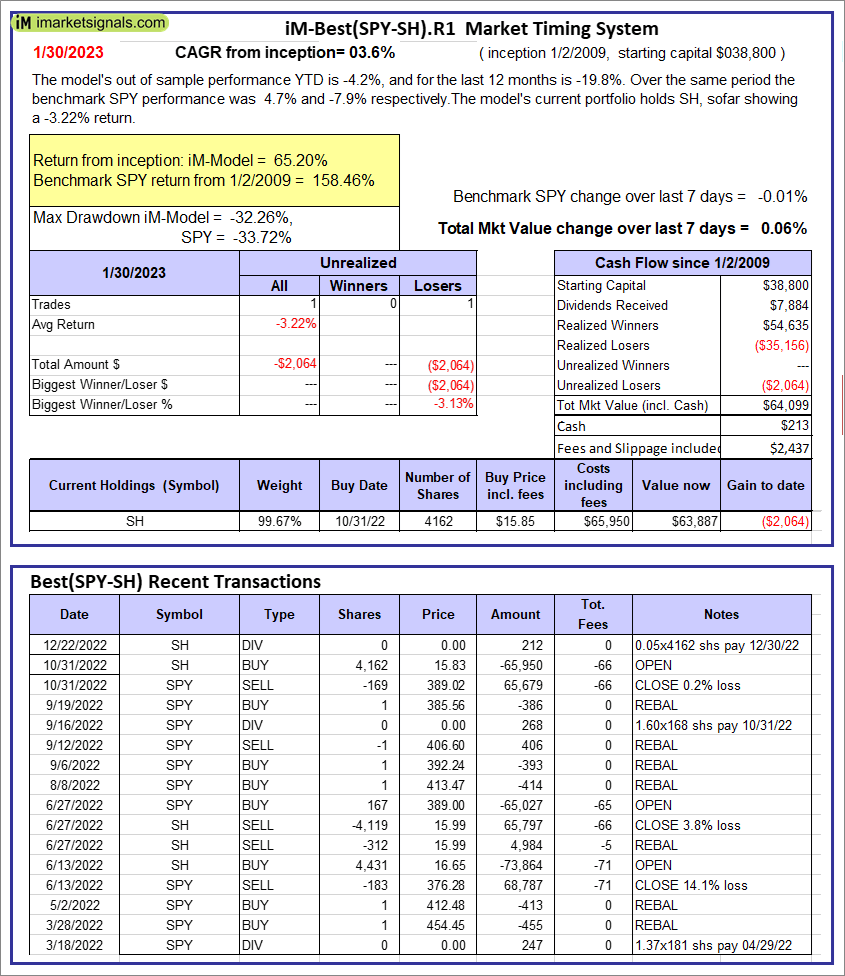 |
iM-Best(SPY-SH).R1: The model’s out of sample performance YTD is -4.2%, and for the last 12 months is -19.8%. Over the same period the benchmark SPY performance was 4.7% and -7.9% respectively. Over the previous week the market value of Best(SPY-SH) gained 0.06% at a time when SPY gained -0.01%. A starting capital of $100,000 at inception on 1/2/2009 would have grown to $64,099 which includes $213 cash and excludes $2,437 spent on fees and slippage. |
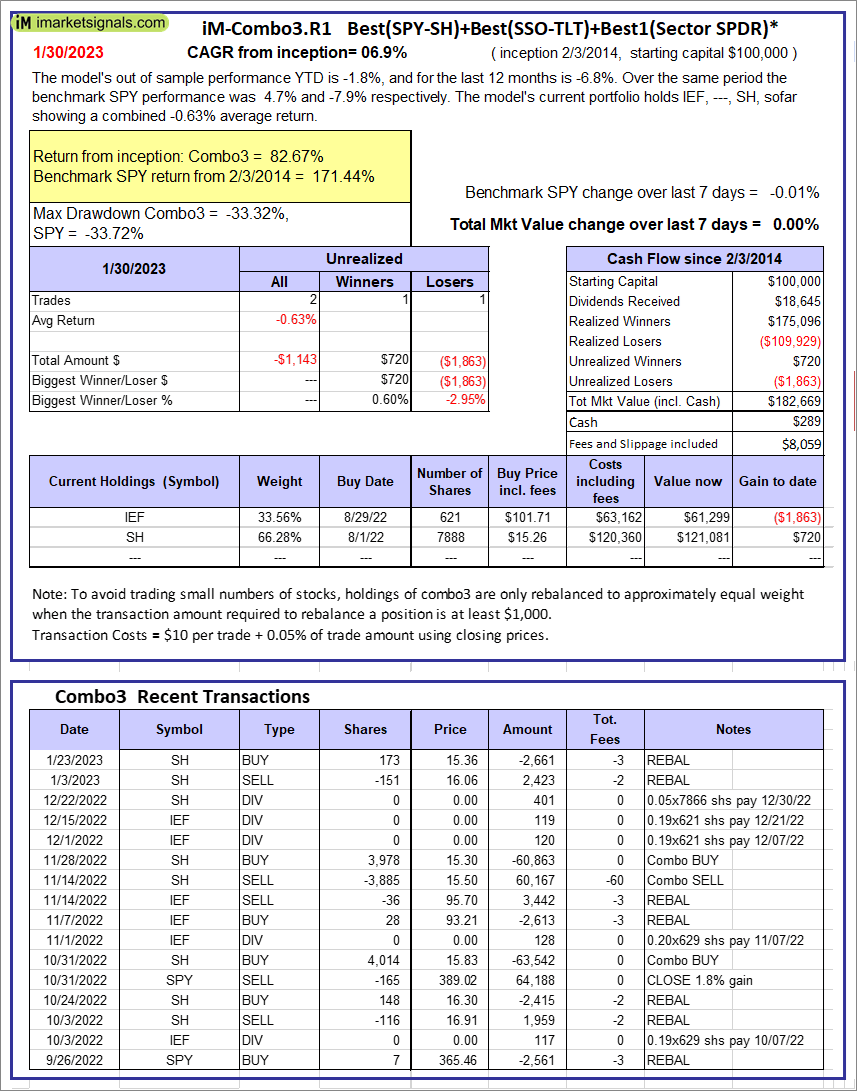 |
iM-Combo3.R1: The model’s out of sample performance YTD is -1.8%, and for the last 12 months is -6.8%. Over the same period the benchmark SPY performance was 4.7% and -7.9% respectively. Over the previous week the market value of iM-Combo3.R1 gained 0.00% at a time when SPY gained -0.01%. A starting capital of $100,000 at inception on 2/3/2014 would have grown to $182,669 which includes $289 cash and excludes $8,059 spent on fees and slippage. |
 |
iM-Combo5: The model’s out of sample performance YTD is 0.3%, and for the last 12 months is -25.4%. Over the same period the benchmark SPY performance was 4.7% and -7.9% respectively. Over the previous week the market value of iM-Combo5 gained 0.08% at a time when SPY gained -0.01%. A starting capital of $100,000 at inception on 2/22/2016 would have grown to $153,862 which includes -$2,854 cash and excludes $0 spent on fees and slippage. |
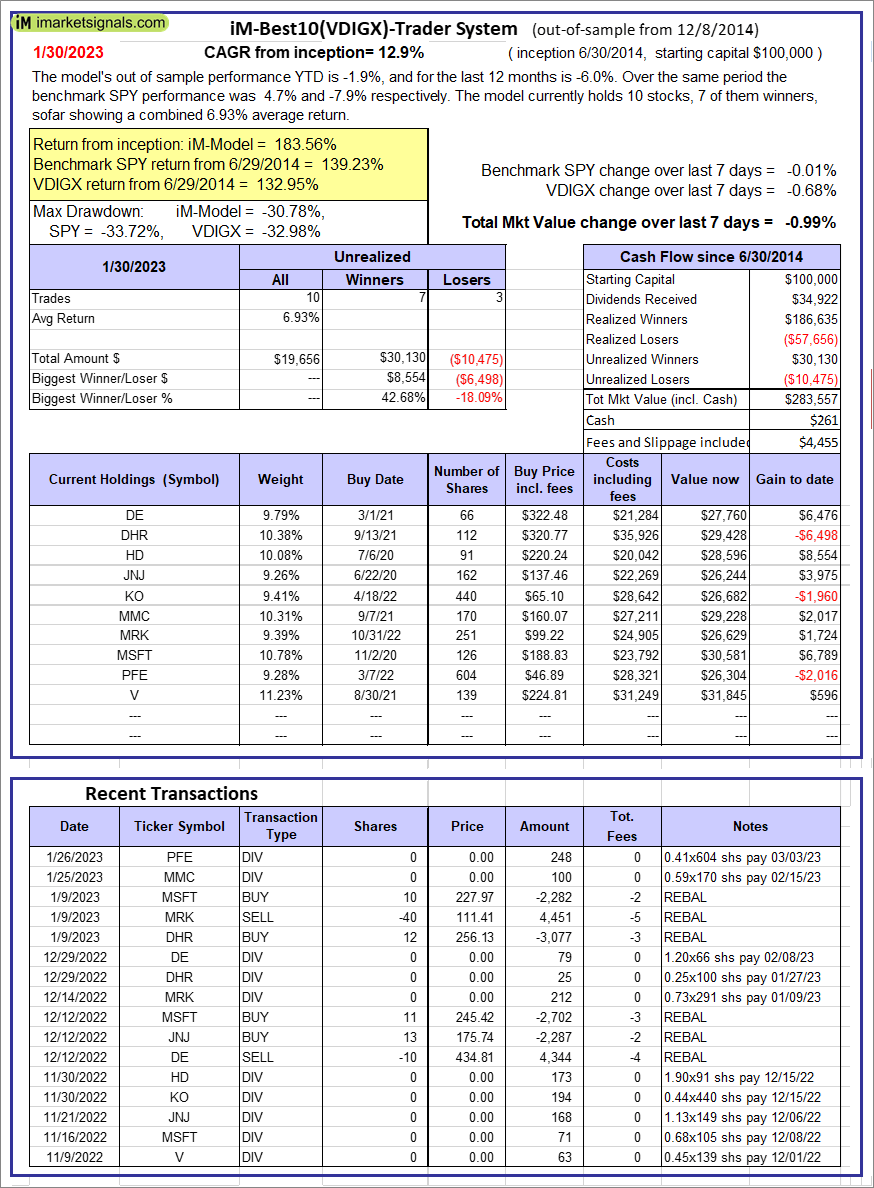 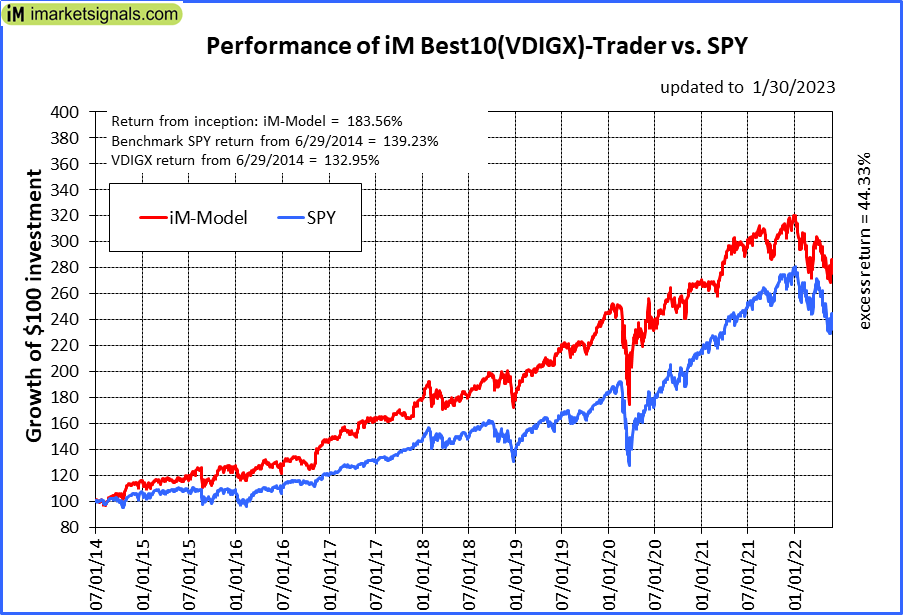 |
iM-Best10(VDIGX)-Trader: The model’s out of sample performance YTD is -1.9%, and for the last 12 months is -6.0%. Over the same period the benchmark SPY performance was 4.7% and -7.9% respectively. Since inception, on 7/1/2014, the model gained 183.56% while the benchmark SPY gained 139.23% and VDIGX gained 132.95% over the same period. Over the previous week the market value of iM-Best10(VDIGX) gained -0.99% at a time when SPY gained -0.01%. A starting capital of $100,000 at inception on 7/1/2014 would have grown to $283,557 which includes $261 cash and excludes $4,455 spent on fees and slippage. |
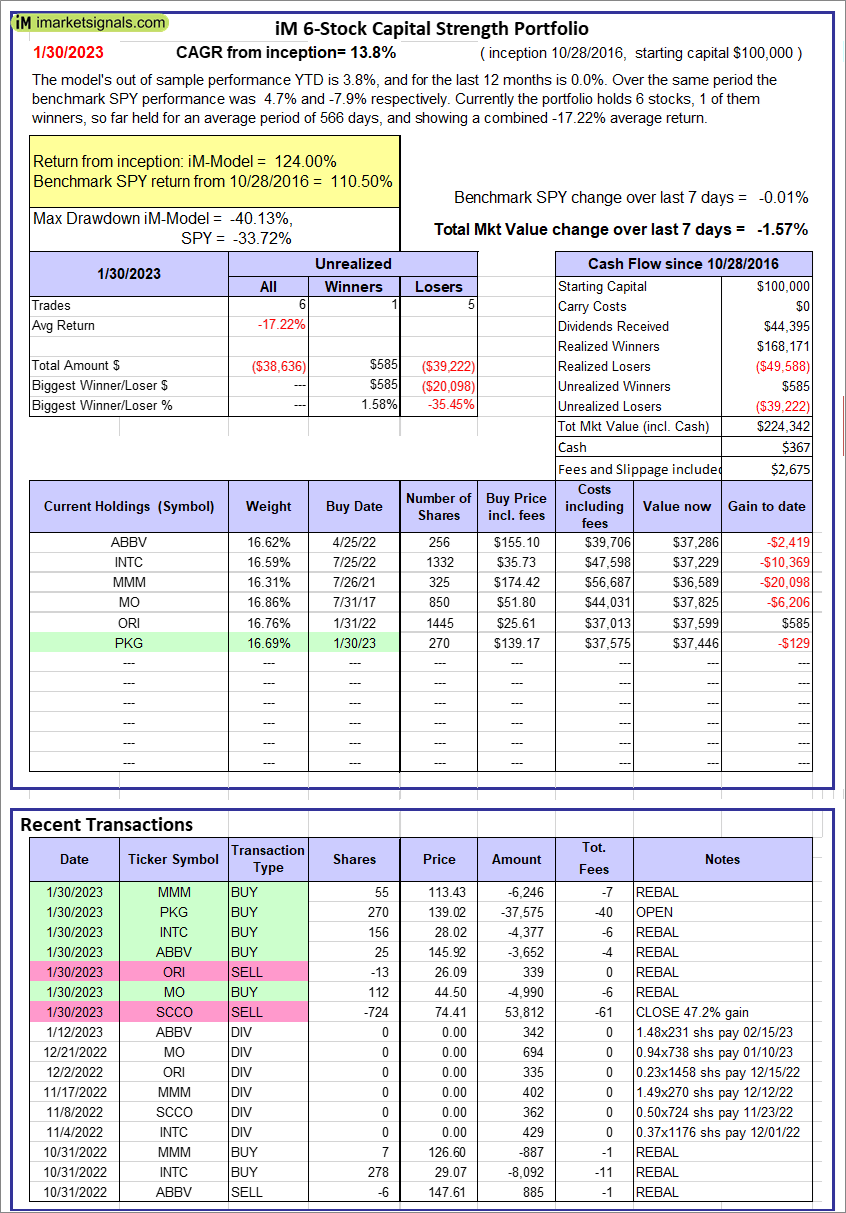 |
iM 6-Stock Capital Strength Portfolio: The model’s out of sample performance YTD is 3.8%, and for the last 12 months is 0.0%. Over the same period the benchmark SPY performance was 4.7% and -7.9% respectively. Over the previous week the market value of the iM 6-Stock Capital Strength Portfolio gained -1.57% at a time when SPY gained -0.01%. A starting capital of $100,000 at inception on 10/28/2016 would have grown to $224,342 which includes $367 cash and excludes $2,675 spent on fees and slippage. |
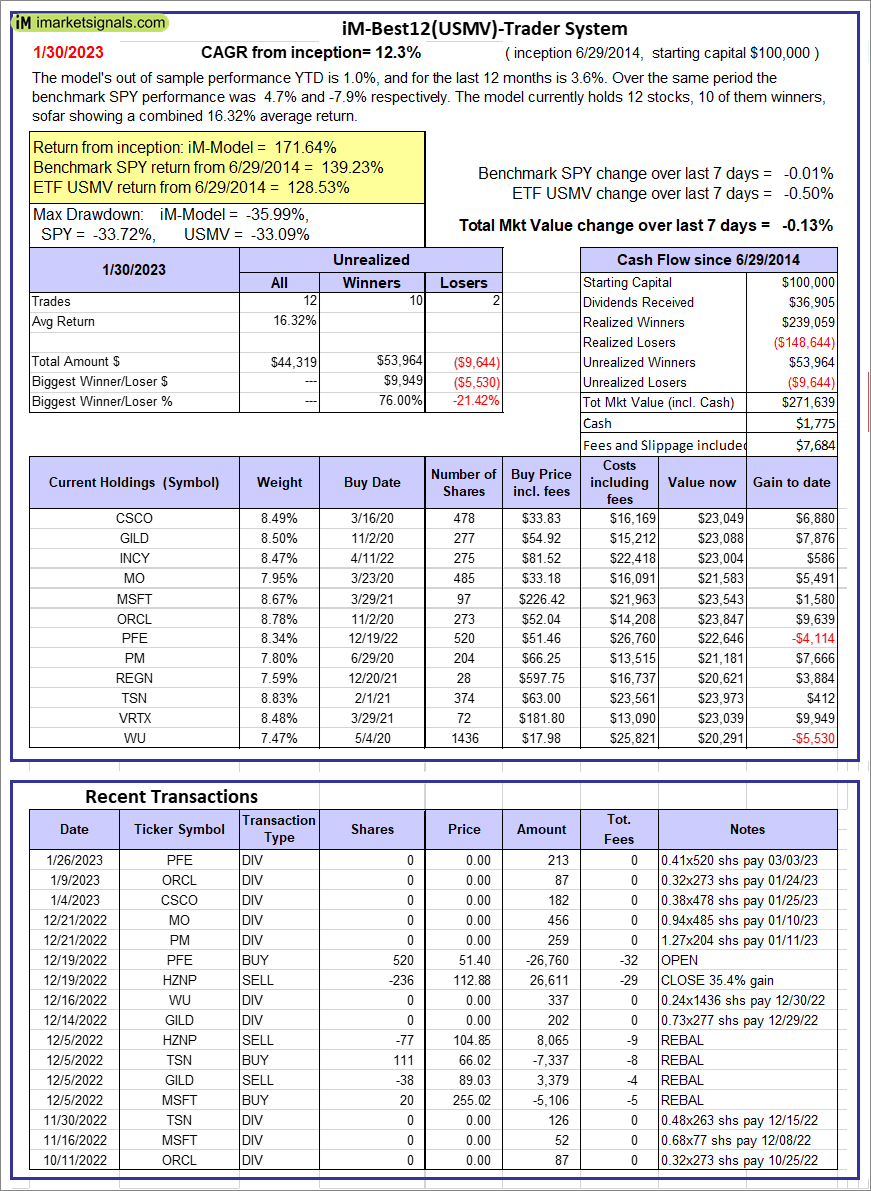 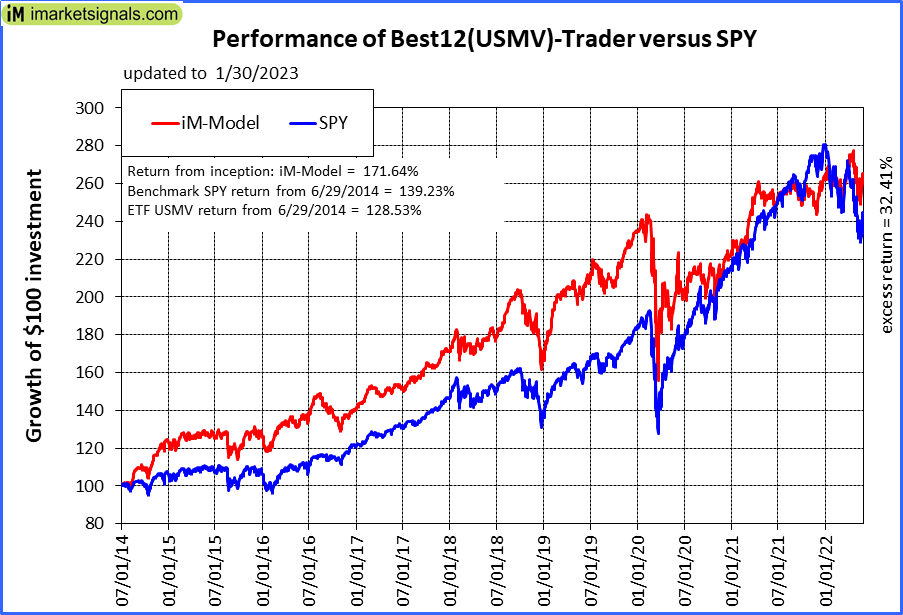 |
iM-Best12(USMV)-Trader: The model’s out of sample performance YTD is 1.0%, and for the last 12 months is 3.6%. Over the same period the benchmark SPY performance was 4.7% and -7.9% respectively. Since inception, on 6/30/2014, the model gained 171.64% while the benchmark SPY gained 139.23% and the ETF USMV gained 128.53% over the same period. Over the previous week the market value of iM-Best12(USMV)-Trader gained -0.13% at a time when SPY gained -0.01%. A starting capital of $100,000 at inception on 6/30/2014 would have grown to $271,639 which includes $1,775 cash and excludes $7,684 spent on fees and slippage. |
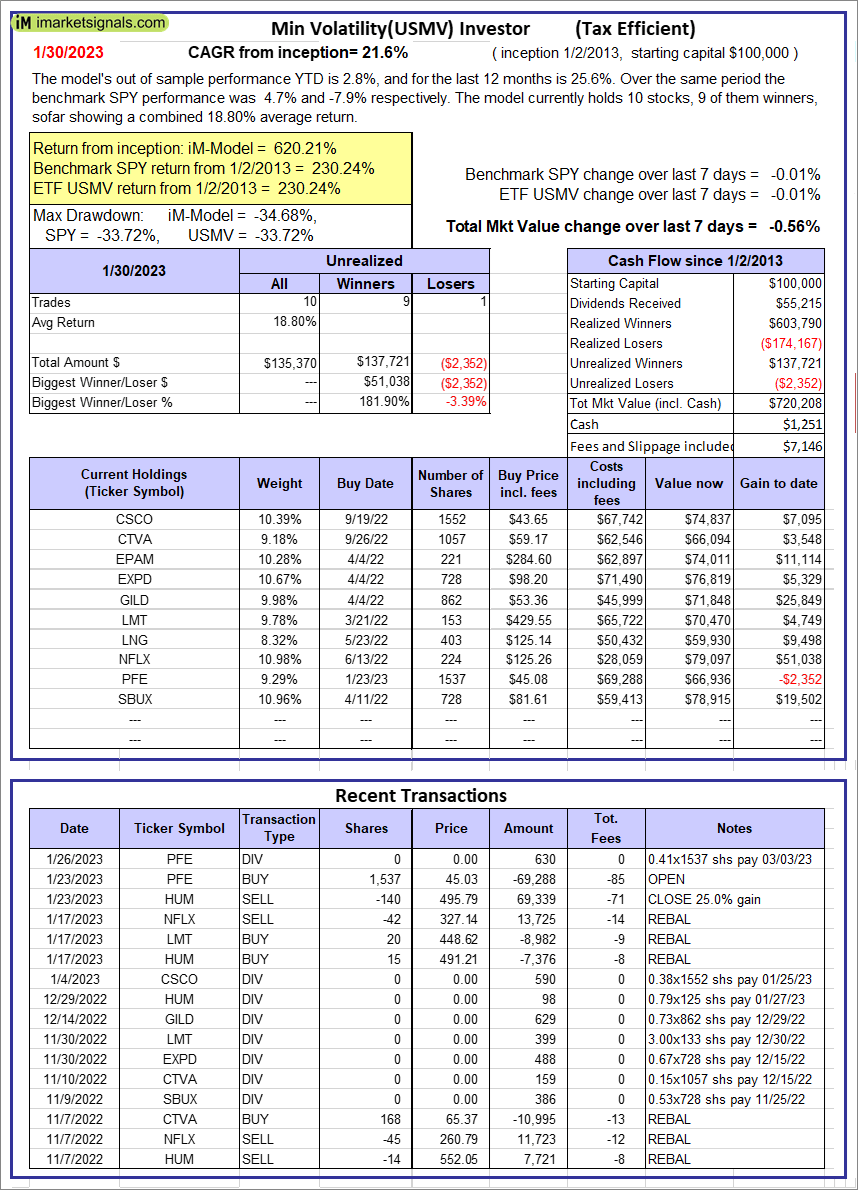 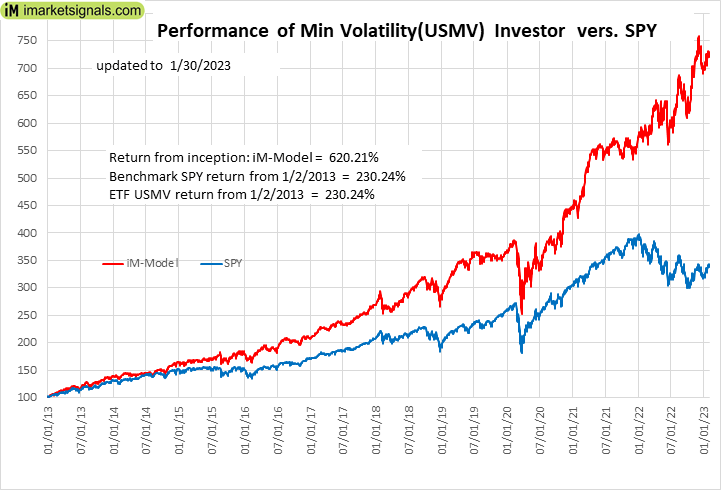 |
iM-Min Volatility(USMV) Investor (Tax Efficient): The model’s out of sample performance YTD is 2.8%, and for the last 12 months is 25.6%. Over the same period the benchmark SPY performance was 4.7% and -7.9% respectively. Since inception, on 1/3/2013, the model gained 620.21% while the benchmark SPY gained 230.24% and the ETF USMV gained 230.24% over the same period. Over the previous week the market value of iM-Best12(USMV)Q1 gained -0.56% at a time when SPY gained -0.01%. A starting capital of $100,000 at inception on 1/3/2013 would have grown to $720,208 which includes $1,251 cash and excludes $7,146 spent on fees and slippage. |
 |
iM-Bond Market Trader (High-Yield Bond or 10-yr Treasury Bond): The model’s out of sample performance YTD is 3.0%, and for the last 12 months is -7.9%. Over the same period the benchmark BND performance was 2.8% and -8.8% respectively. Over the previous week the market value of the iM-Bond Market Trader (High-Yield Bond or 10-yr Treasury Bond) gained -0.14% at a time when BND gained -0.01%. A starting capital of $10,000 at inception on 1/3/2000 would have grown to $136,967 which includes $846 cash and excludes $2,495 spent on fees and slippage. |
|
|
iM-ModSum/YieldCurve Timer: The model’s out of sample performance YTD is 3.0%, and for the last 12 months is -9.8%. Over the same period the benchmark SPY performance was 4.7% and -7.9% respectively. Over the previous week the market value of iM-PortSum/YieldCurve Timer gained -0.14% at a time when SPY gained -0.01%. A starting capital of $100,000 at inception on 1/1/2016 would have grown to $259,877 which includes $1,553 cash and excludes $1,196 spent on fees and slippage. |
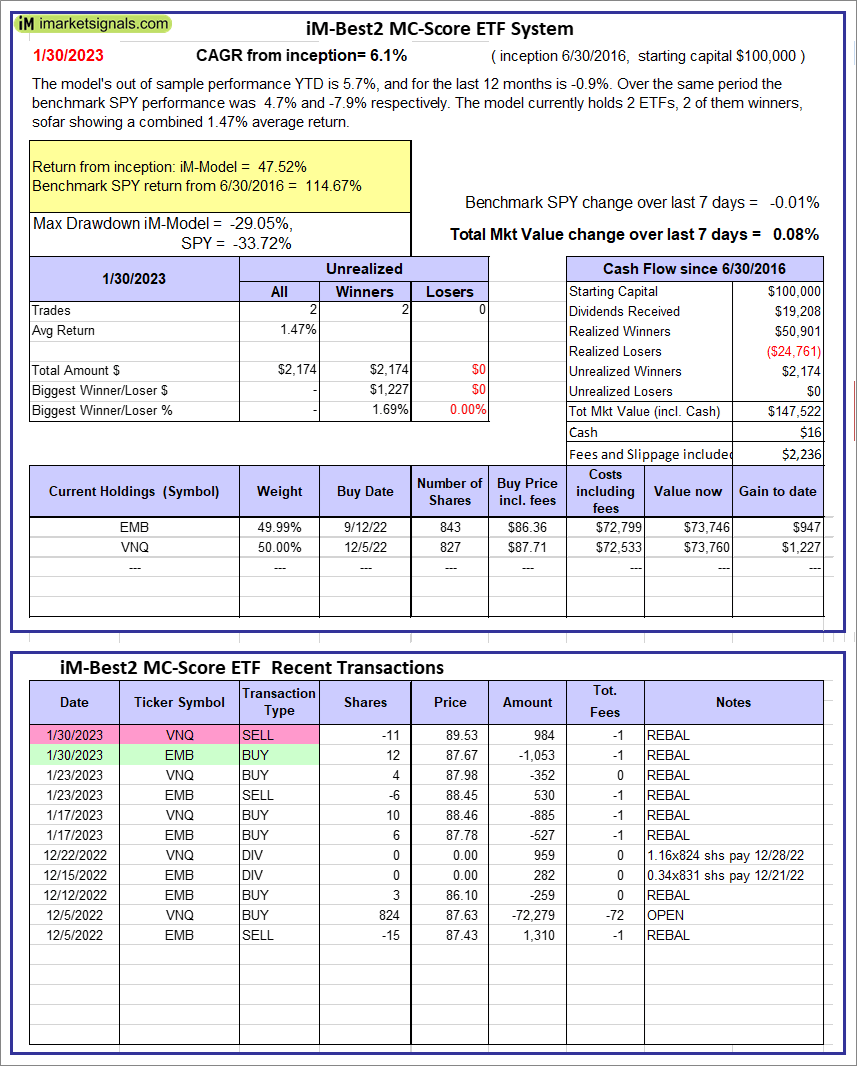 |
iM-Best2 MC-Score ETF System: The model’s out of sample performance YTD is 5.7%, and for the last 12 months is -0.9%. Over the same period the benchmark SPY performance was 4.7% and -7.9% respectively. Over the previous week the market value of the iM-Best2 MC-Score ETF System gained 0.08% at a time when SPY gained -0.01%. A starting capital of $100,000 at inception on 6/30/2016 would have grown to $147,522 which includes $16 cash and excludes $2,236 spent on fees and slippage. |
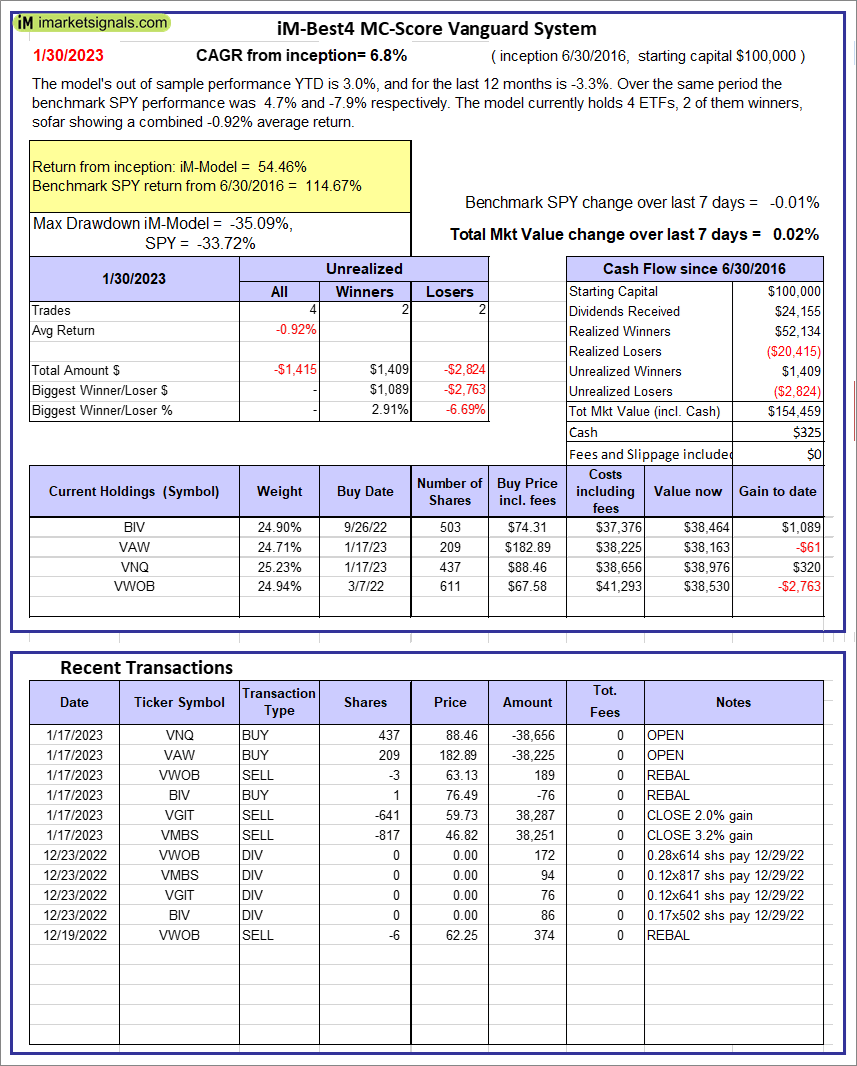 |
iM-Best4 MC-Score Vanguard System: The model’s out of sample performance YTD is 3.0%, and for the last 12 months is -3.3%. Over the same period the benchmark SPY performance was 4.7% and -7.9% respectively. Over the previous week the market value of the iM-Best4 MC-Score Vanguard System gained 0.02% at a time when SPY gained -0.01%. A starting capital of $100,000 at inception on 6/30/2016 would have grown to $154,459 which includes $325 cash and excludes $00 spent on fees and slippage. |
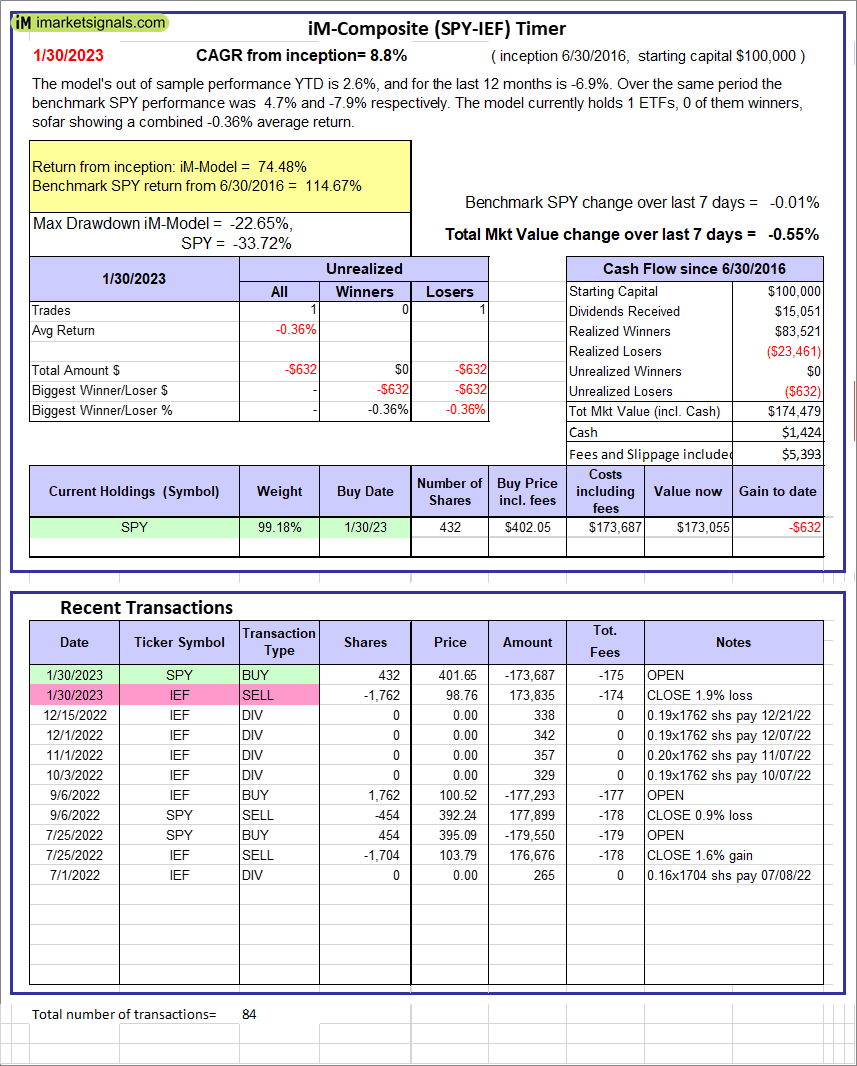 |
iM-Composite (SPY-IEF) Timer: The model’s out of sample performance YTD is 2.6%, and for the last 12 months is -6.9%. Over the same period the benchmark SPY performance was 4.7% and -7.9% respectively. Over the previous week the market value of the iM-Composite (SPY-IEF) Timer gained -0.55% at a time when SPY gained -0.01%. A starting capital of $100,000 at inception on 6/30/2016 would have grown to $174,479 which includes $1,424 cash and excludes $5,393 spent on fees and slippage. |
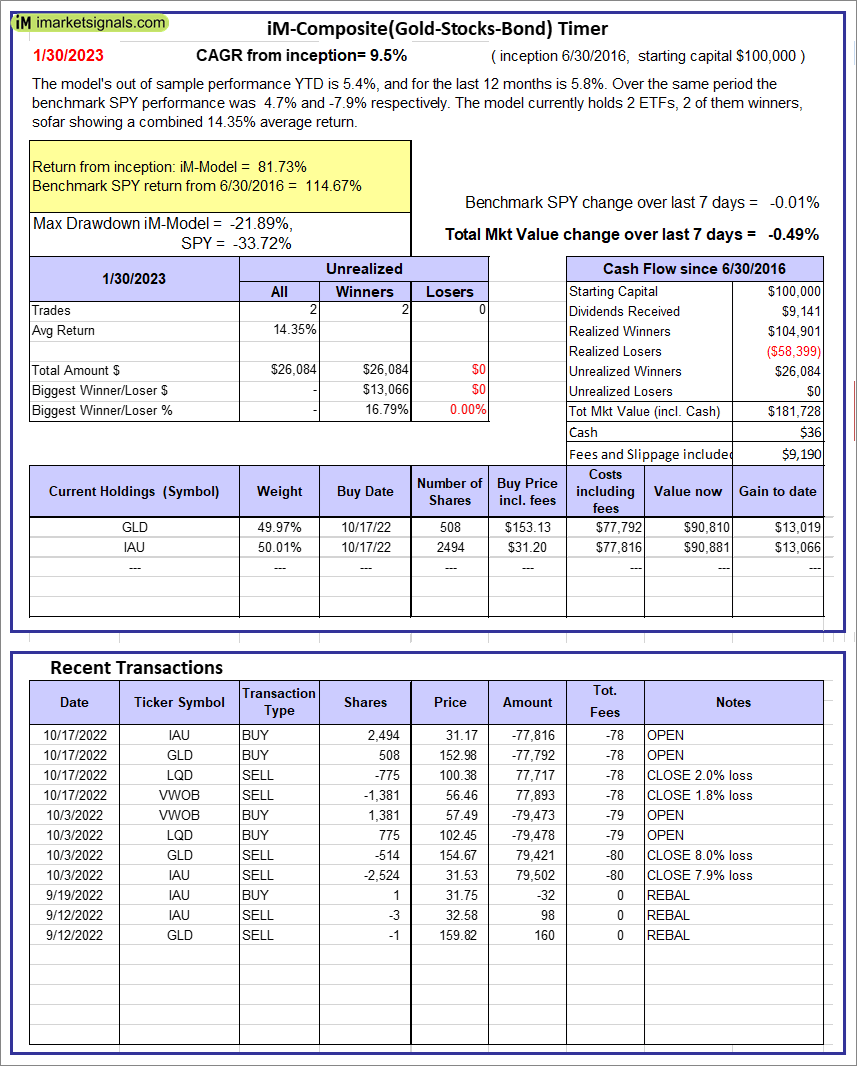 |
iM-Composite(Gold-Stocks-Bond) Timer: The model’s out of sample performance YTD is 5.4%, and for the last 12 months is 5.8%. Over the same period the benchmark SPY performance was 4.7% and -7.9% respectively. Over the previous week the market value of the iM-Composite(Gold-Stocks-Bond) Timer gained -0.49% at a time when SPY gained -0.01%. A starting capital of $100,000 at inception on 6/30/2016 would have grown to $181,728 which includes $36 cash and excludes $9,190 spent on fees and slippage. |
iM-Best Reports – 1/30/2023
Posted in pmp SPY-SH
Leave a Reply
You must be logged in to post a comment.