
  |
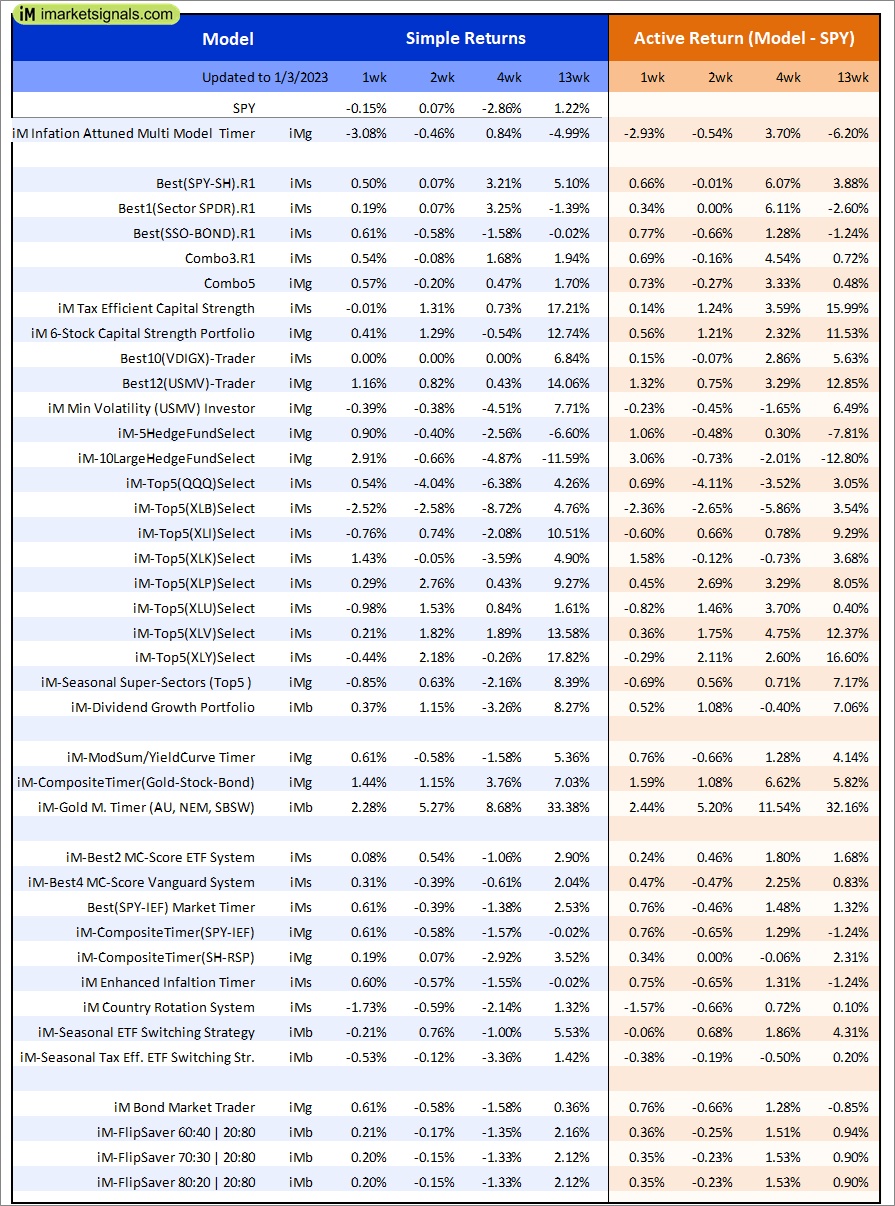
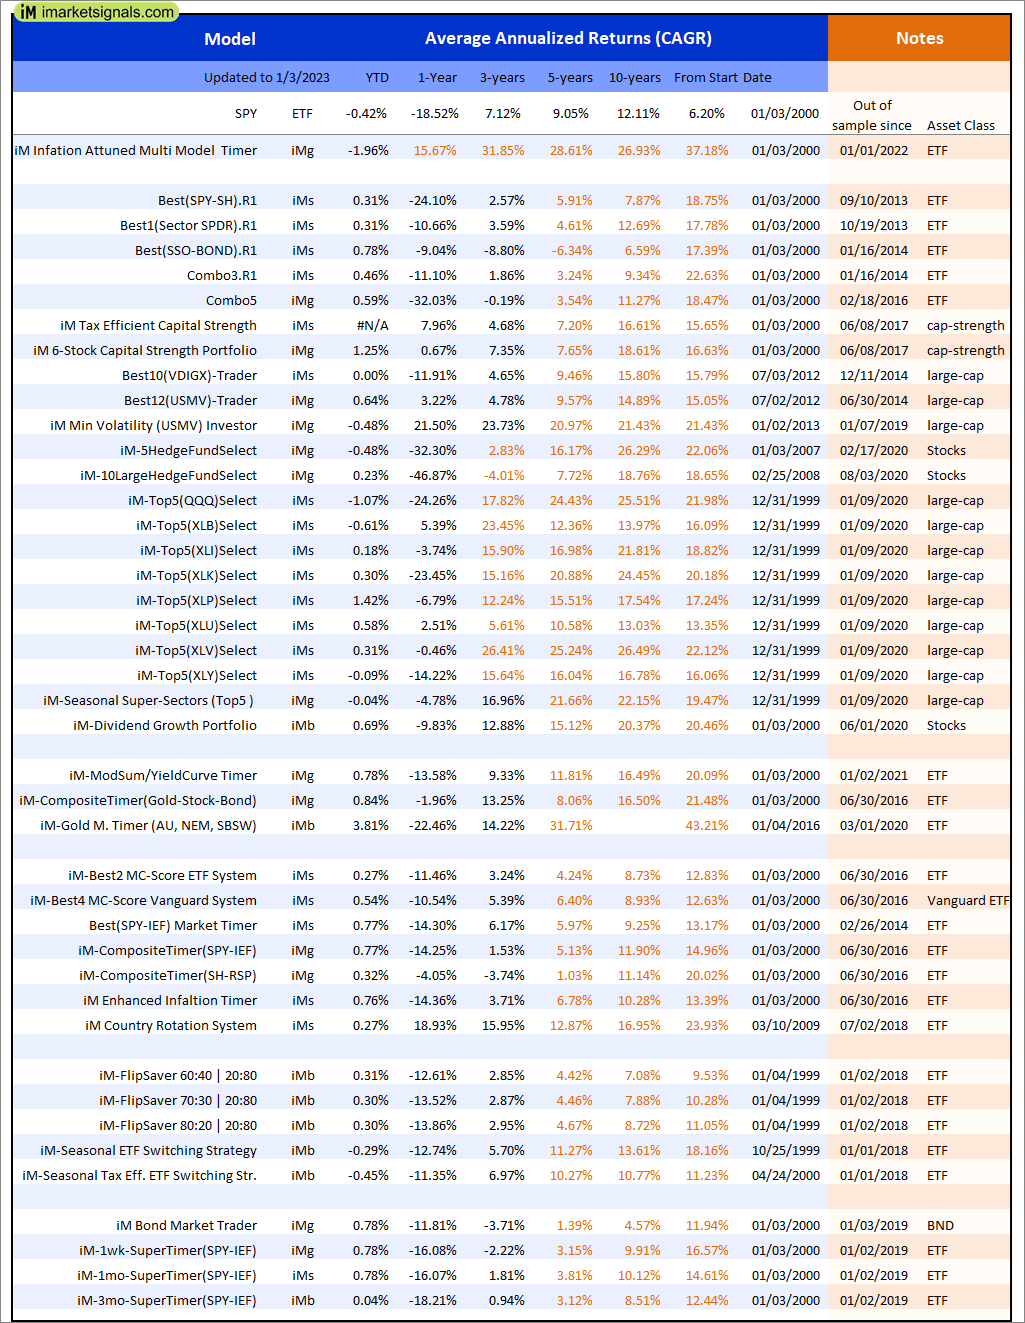
Out of sample performance summary of our models for the past 1, 2, 4 and 13 week periods. The active active return indicates how the models over- or underperformed the benchmark ETF SPY. Also the YTD, and the 1-, 3-, 5- and 10-year annualized returns are shown in the second table |
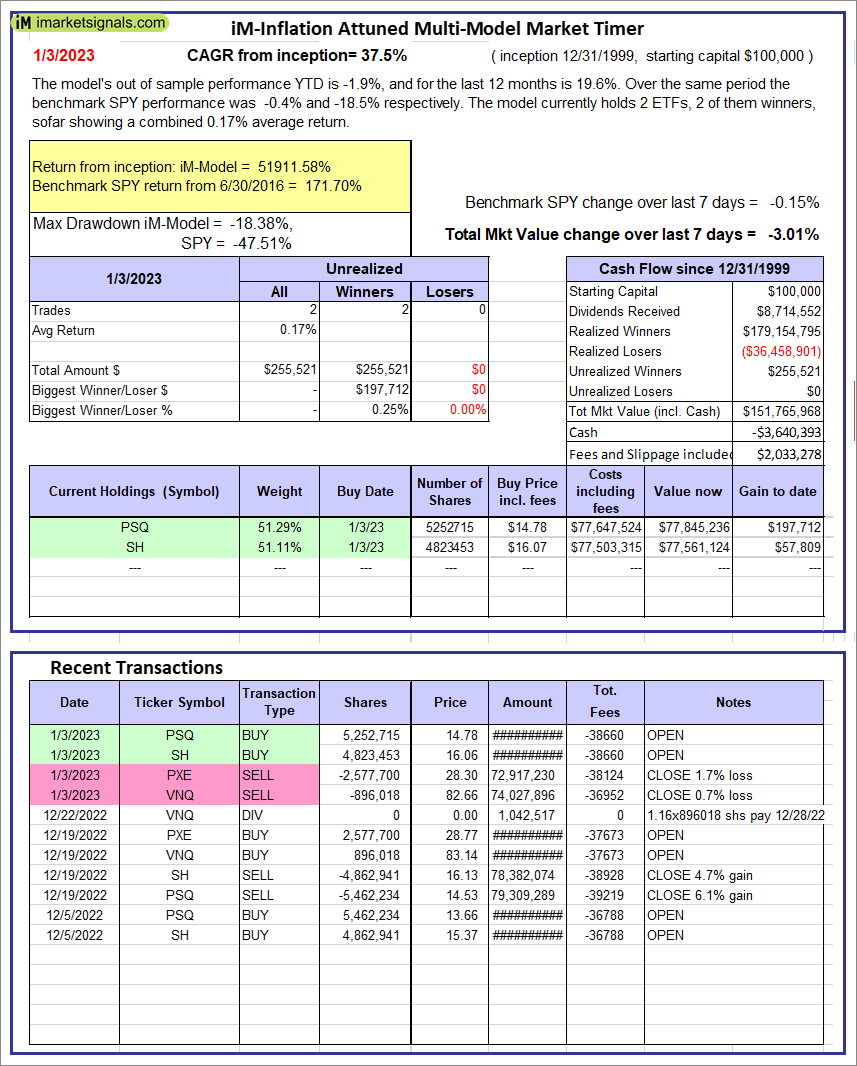 |
iM-Inflation Attuned Multi-Model Market Timer: The model’s out of sample performance YTD is -1.9%, and for the last 12 months is 19.6%. Over the same period the benchmark SPY performance was -0.4% and -18.5% respectively. Over the previous week the market value of the iM-Inflation Attuned Multi-Model Market Timer gained -3.01% at a time when SPY gained -0.15%. A starting capital of $100,000 at inception on 3/24/2017 would have grown to $151,765,968 which includes -$3,640,393 cash and excludes $2,033,278 spent on fees and slippage. |
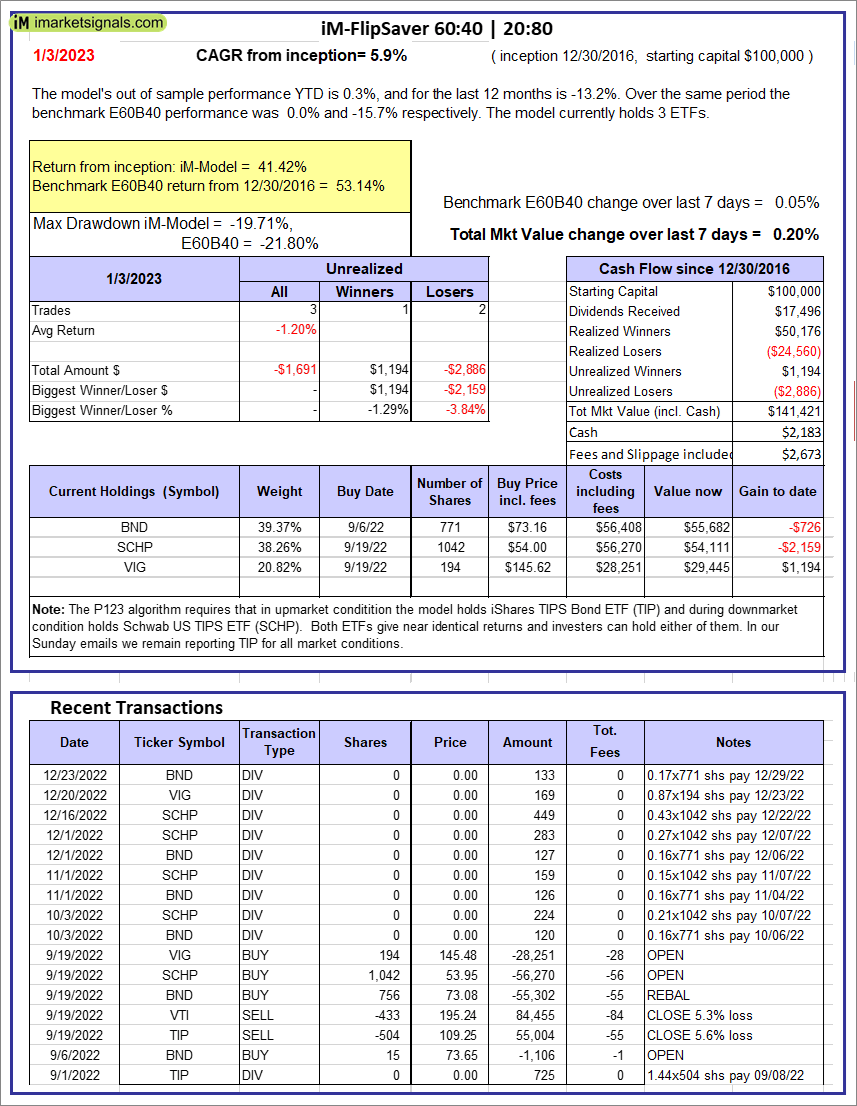 |
iM-FlipSaver 60:40 | 20:80 – 2017: The model’s out of sample performance YTD is 0.3%, and for the last 12 months is -13.2%. Over the same period the benchmark E60B40 performance was 0.0% and -15.7% respectively. Over the previous week the market value of iM-FlipSaver 80:20 | 20:80 gained 0.20% at a time when SPY gained 0.05%. A starting capital of $100,000 at inception on 7/16/2015 would have grown to $141,421 which includes $2,183 cash and excludes $2,673 spent on fees and slippage. |
 |
iM-FlipSaver 70:30 | 20:80 – 2017: The model’s out of sample performance YTD is 0.3%, and for the last 12 months is -13.5%. Over the same period the benchmark E60B40 performance was 0.0% and -15.7% respectively. Over the previous week the market value of iM-FlipSaver 70:30 | 20:80 gained 0.20% at a time when SPY gained 0.05%. A starting capital of $100,000 at inception on 7/15/2015 would have grown to $145,427 which includes $2,335 cash and excludes $2,831 spent on fees and slippage. |
 |
iM-FlipSaver 80:20 | 20:80 – 2017: The model’s out of sample performance YTD is 0.3%, and for the last 12 months is -13.9%. Over the same period the benchmark E60B40 performance was 0.0% and -15.7% respectively. Over the previous week the market value of iM-FlipSaver 80:20 | 20:80 gained 0.20% at a time when SPY gained 0.05%. A starting capital of $100,000 at inception on 1/2/2017 would have grown to $149,274 which includes $2,525 cash and excludes $2,982 spent on fees and slippage. |
  |
iM-5HedgeFundSelect: Since inception, on 1/5/2016, the model gained 270.56% while the benchmark SPY gained 111.86% over the same period. Over the previous week the market value of iM-5HedgeFundSelect gained 0.90% at a time when SPY gained -0.15%. A starting capital of $25,000 at inception on 1/5/2016 would have grown to $92,640 which includes $2,056 cash and excludes $1,835 spent on fees and slippage. |
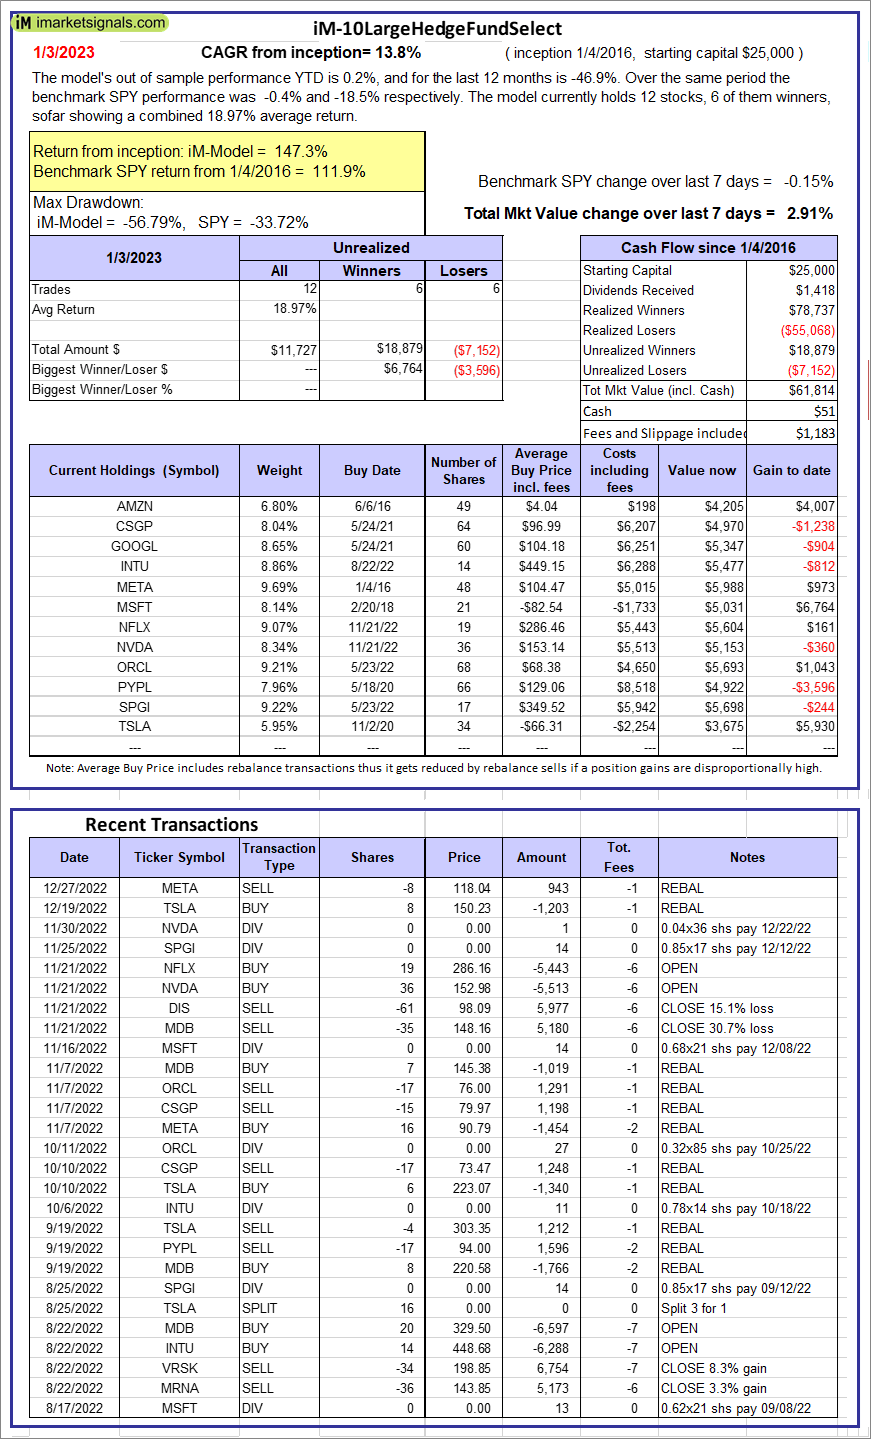 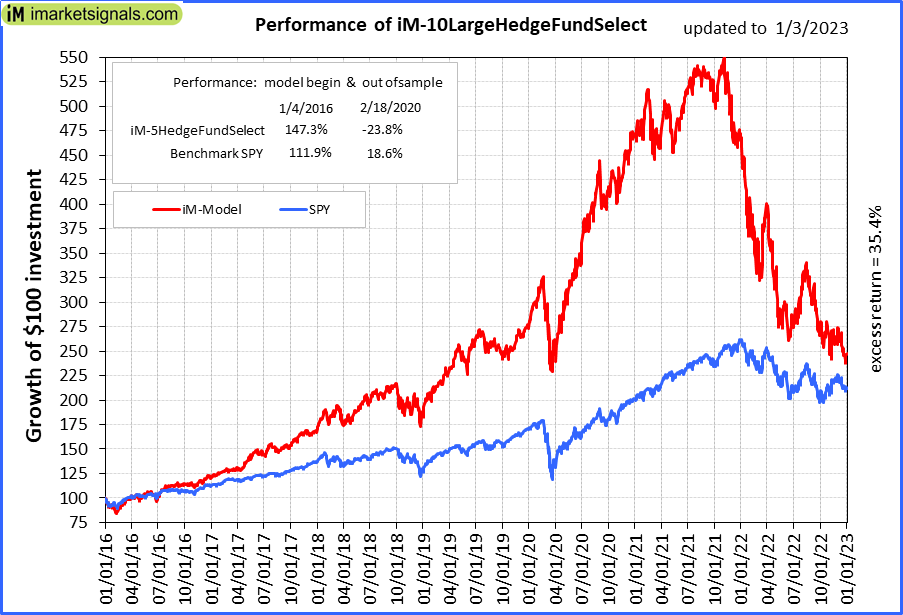 |
iM-10LargeHedgeFundSelect: Since inception, on 1/5/2016, the model gained 147.26% while the benchmark SPY gained 111.86% over the same period. Over the previous week the market value of iM-10LargeHedgeFundSelect gained 2.91% at a time when SPY gained -0.15%. A starting capital of $25,000 at inception on 1/5/2016 would have grown to $61,814 which includes $51 cash and excludes $1,183 spent on fees and slippage. |
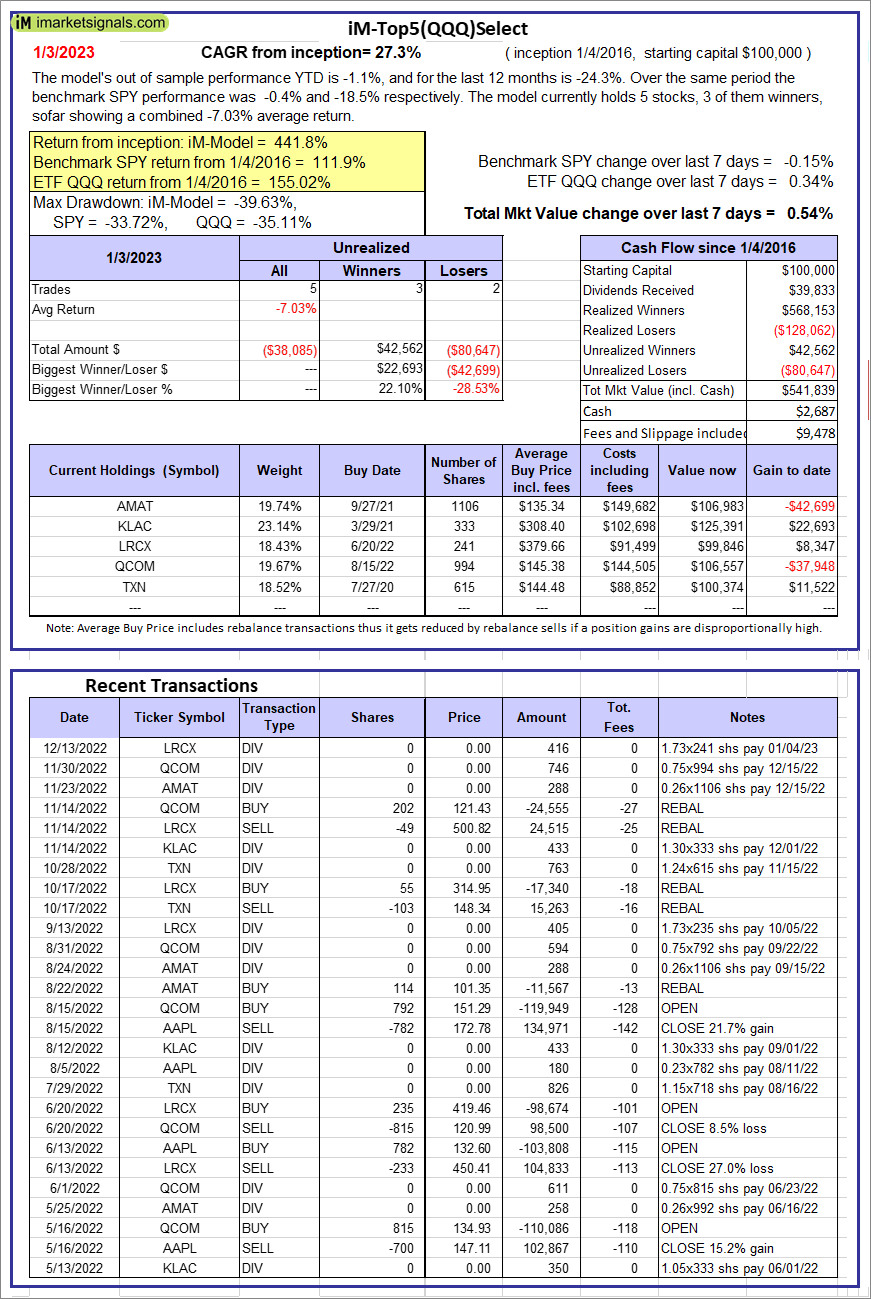 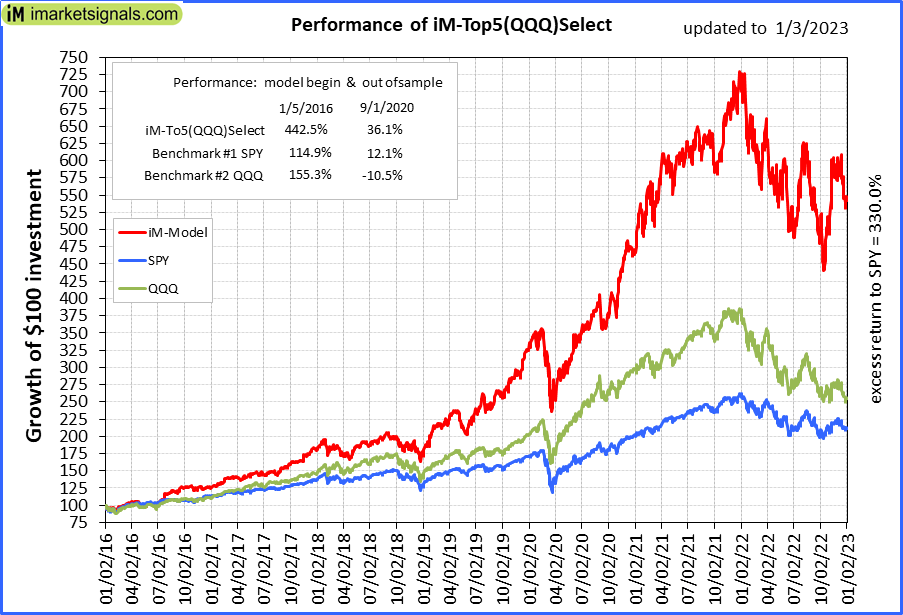 |
iM-Top5(QQQ)Select: Since inception, on 1/5/2016, the model gained 441.84% while the benchmark SPY gained 111.86% over the same period. Over the previous week the market value of iM-Top5(QQQ)Select gained 0.54% at a time when SPY gained -0.15%. A starting capital of $100,000 at inception on 1/5/2016 would have grown to $541,839 which includes $2,687 cash and excludes $9,478 spent on fees and slippage. |
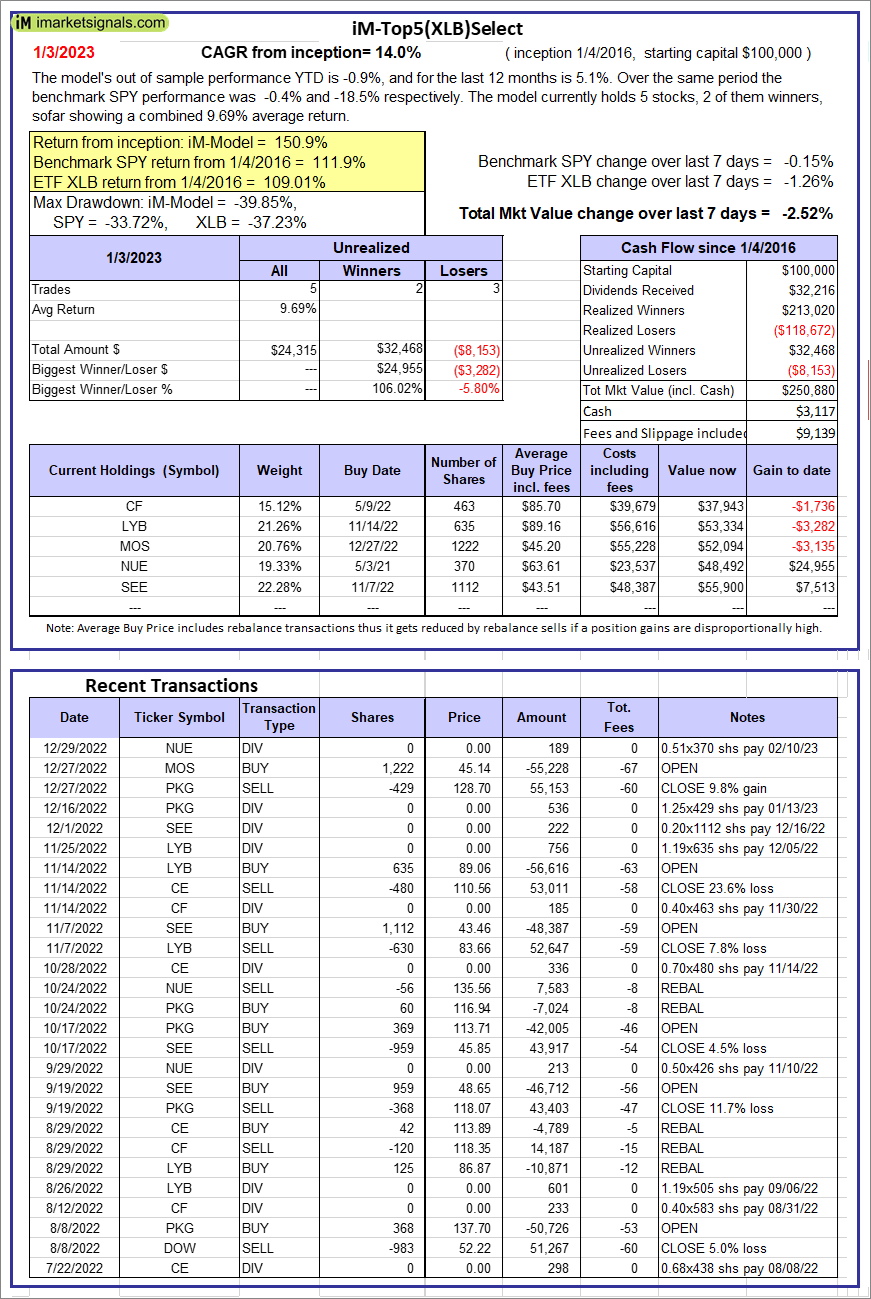 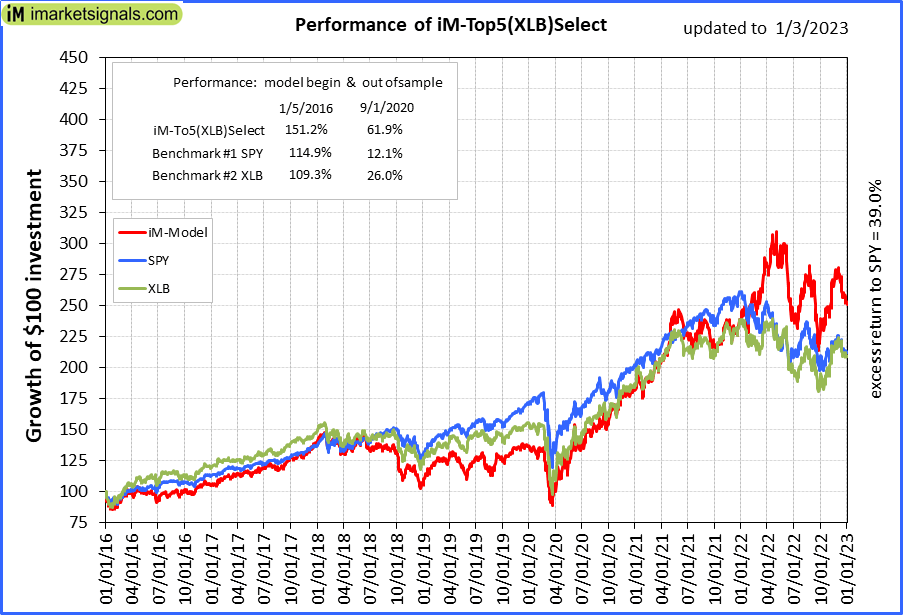 |
iM-Top5(XLB)Select: Since inception, on 1/5/2016, the model gained 150.88% while the benchmark SPY gained 111.86% over the same period. Over the previous week the market value of iM-Top5(XLB)Select gained -2.52% at a time when SPY gained -0.15%. A starting capital of $100,000 at inception on 1/5/2016 would have grown to $250,880 which includes $3,117 cash and excludes $9,139 spent on fees and slippage. |
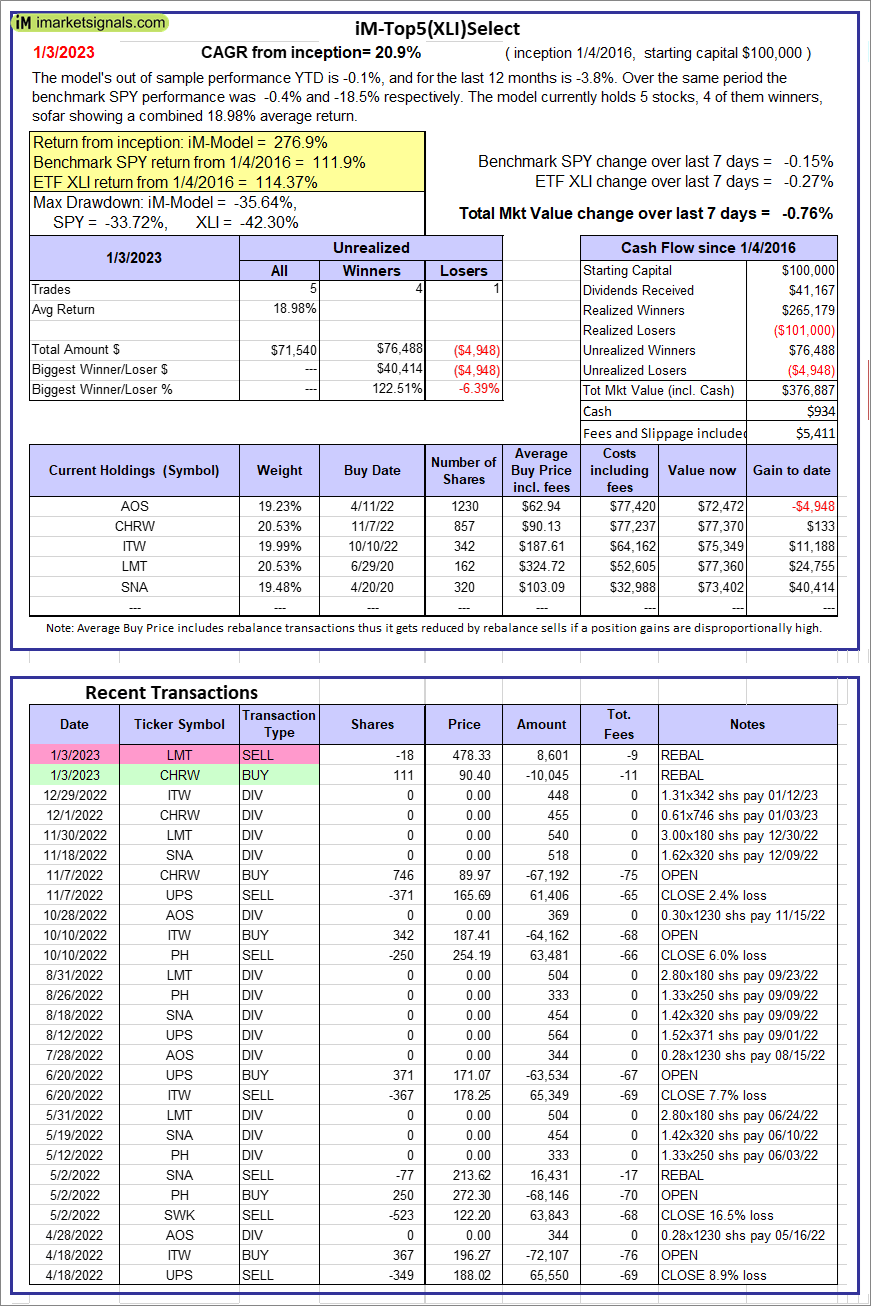  |
iM-Top5(XLI)Select: Since inception, on 1/5/2016, the model gained 276.89% while the benchmark SPY gained 111.86% over the same period. Over the previous week the market value of iM-Top5(XLI)Select gained -0.76% at a time when SPY gained -0.15%. A starting capital of $100,000 at inception on 1/5/2016 would have grown to $376,887 which includes $934 cash and excludes $5,411 spent on fees and slippage. |
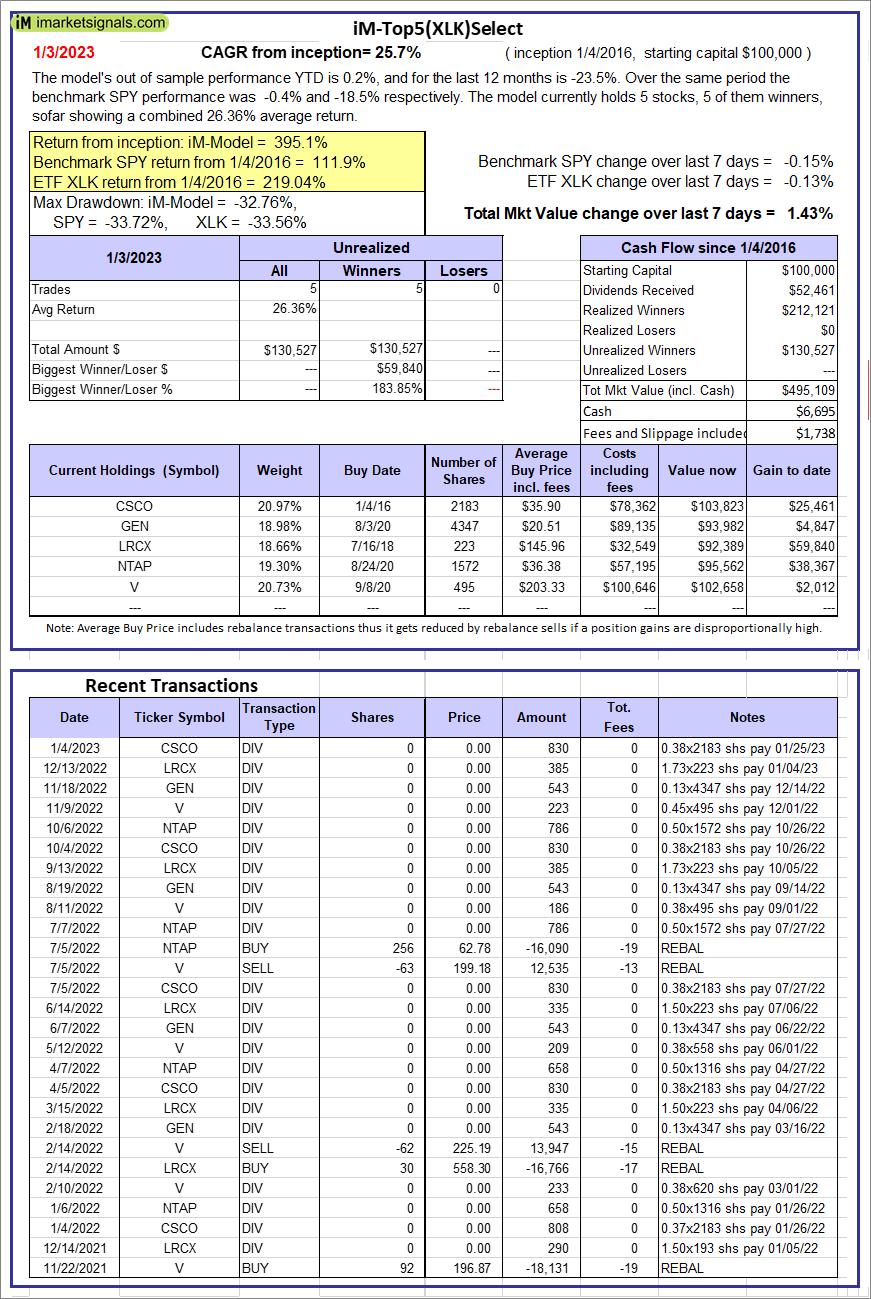 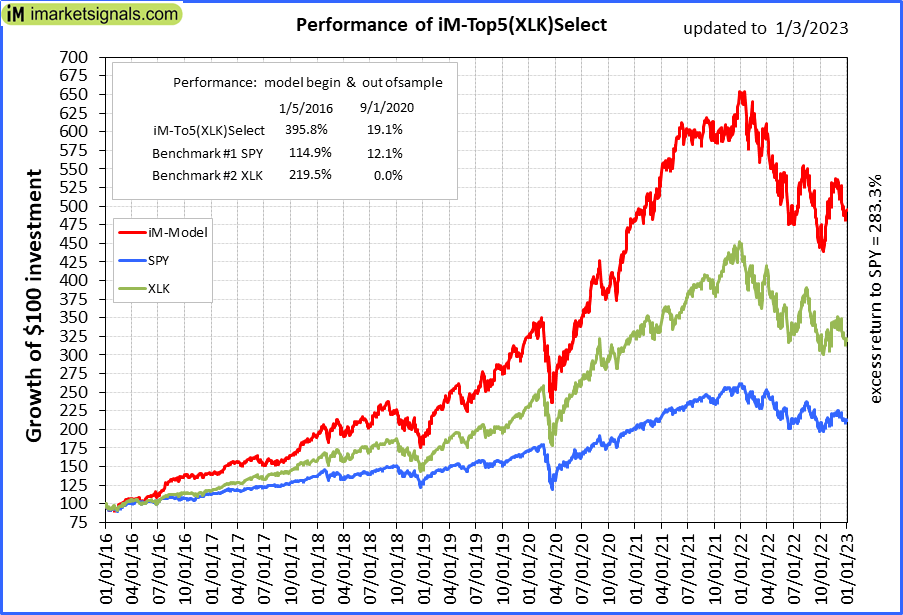 |
iM-Top5(XLK)Select: Since inception, on 1/5/2016, the model gained 395.11% while the benchmark SPY gained 111.86% over the same period. Over the previous week the market value of iM-Top5(XLK)Select gained 1.43% at a time when SPY gained -0.15%. A starting capital of $100,000 at inception on 1/5/2016 would have grown to $495,109 which includes $6,695 cash and excludes $1,738 spent on fees and slippage. |
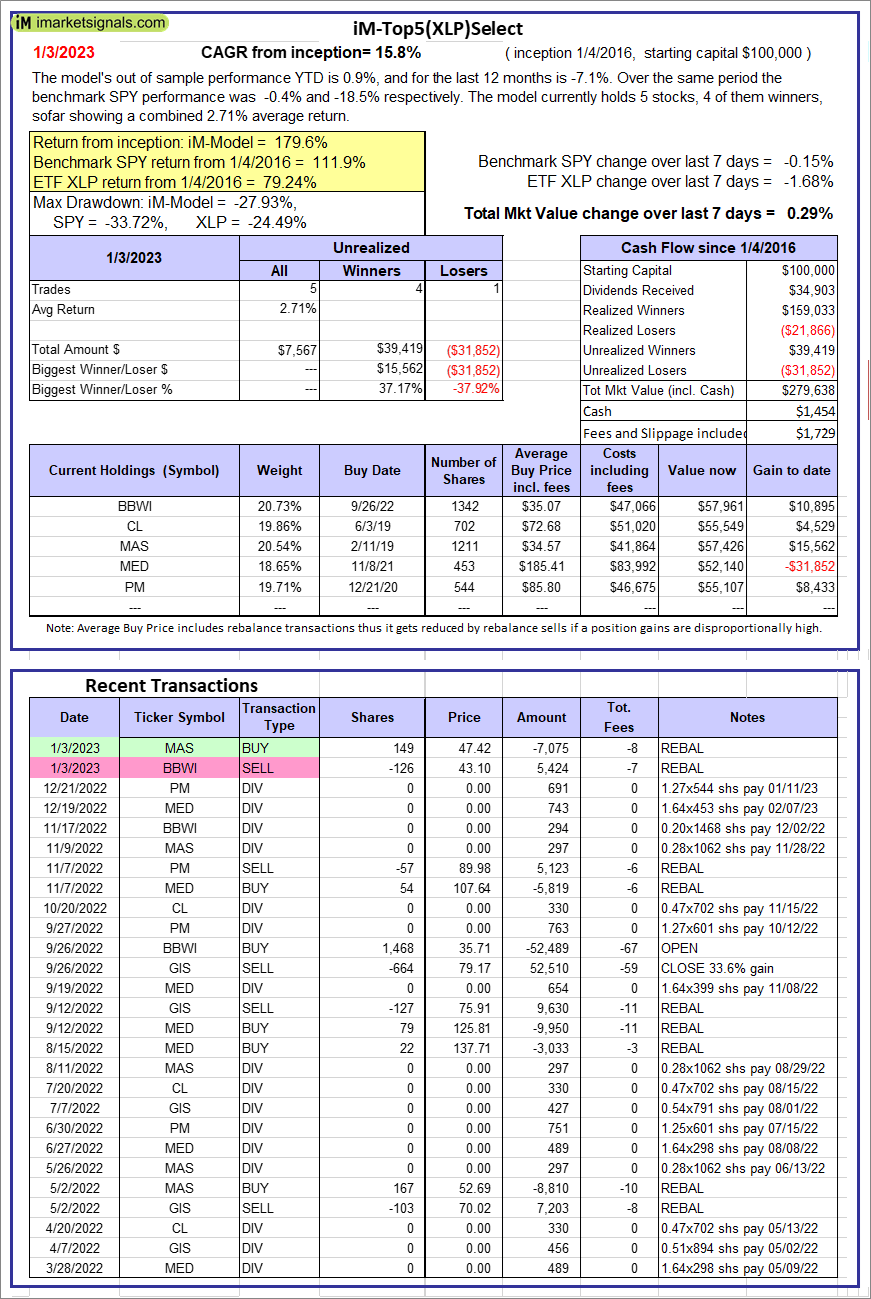 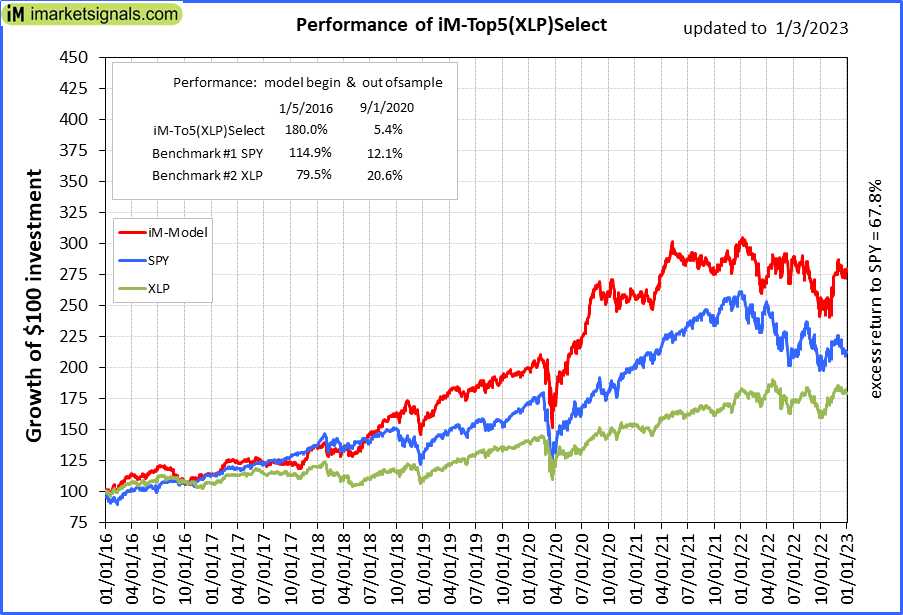 |
iM-Top5(XLP)Select: Since inception, on 1/5/2016, the model gained 179.64% while the benchmark SPY gained 111.86% over the same period. Over the previous week the market value of iM-Top5(XLP)Select gained 0.29% at a time when SPY gained -0.15%. A starting capital of $100,000 at inception on 1/5/2016 would have grown to $279,638 which includes $1,454 cash and excludes $1,729 spent on fees and slippage. |
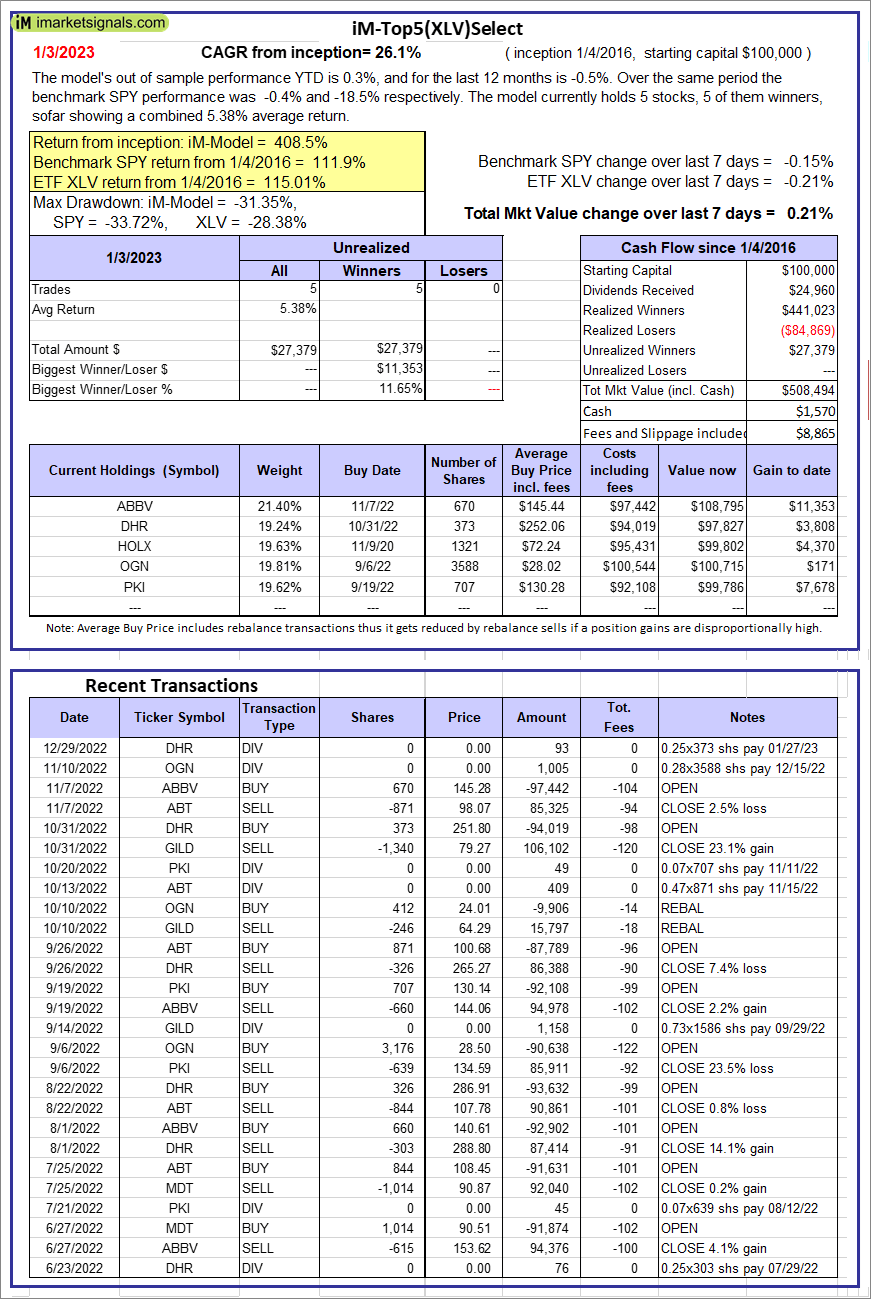 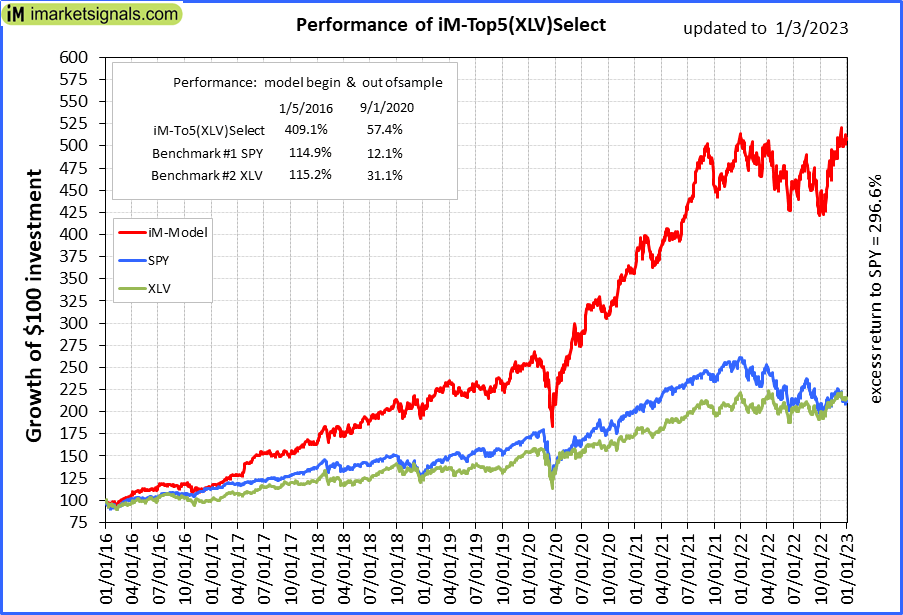 |
iM-Top5(XLV)Select: Since inception, on 1/5/2016, the model gained 408.49% while the benchmark SPY gained 111.86% over the same period. Over the previous week the market value of iM-Top5(XLV)Select gained 0.21% at a time when SPY gained -0.15%. A starting capital of $100,000 at inception on 1/5/2016 would have grown to $508,494 which includes $1,570 cash and excludes $8,865 spent on fees and slippage. |
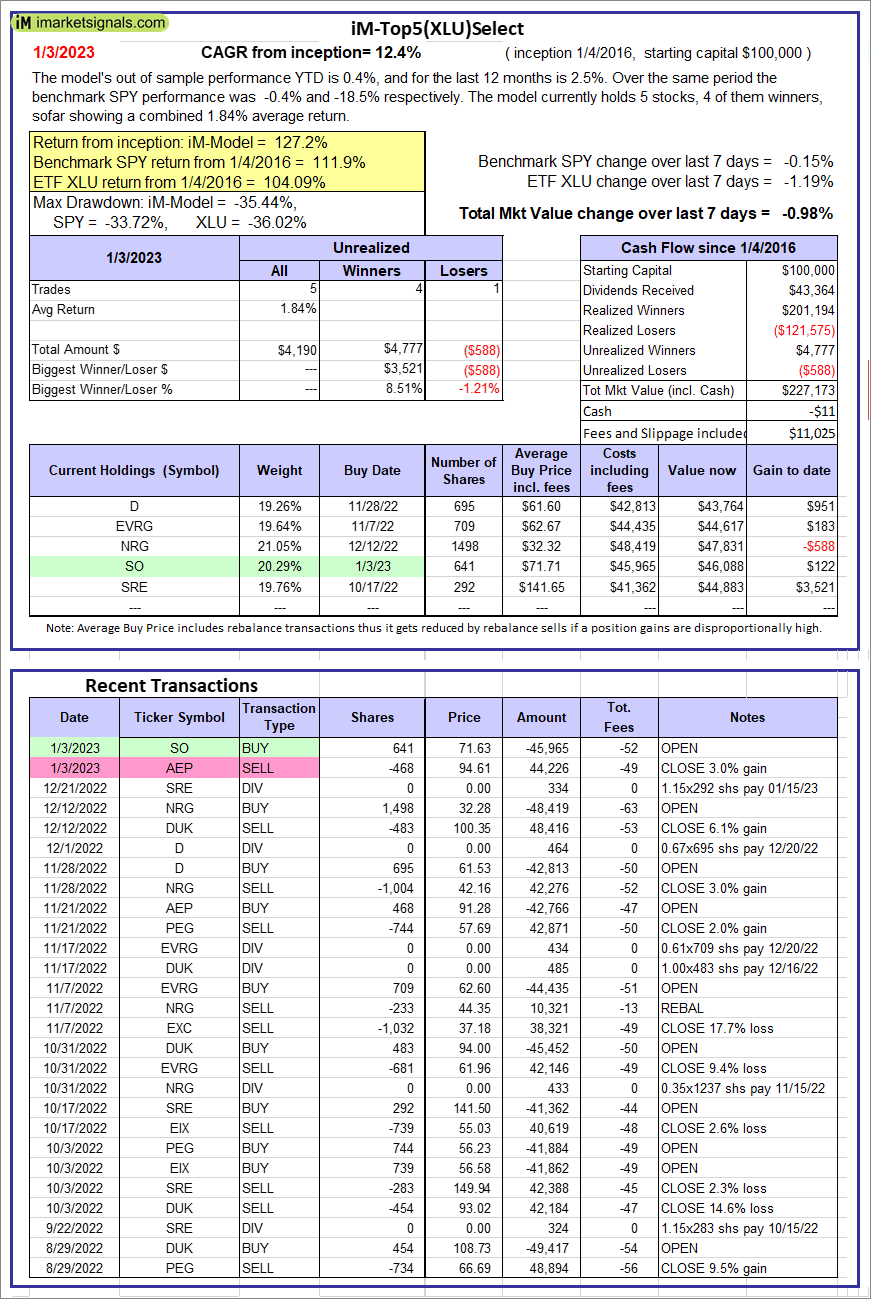 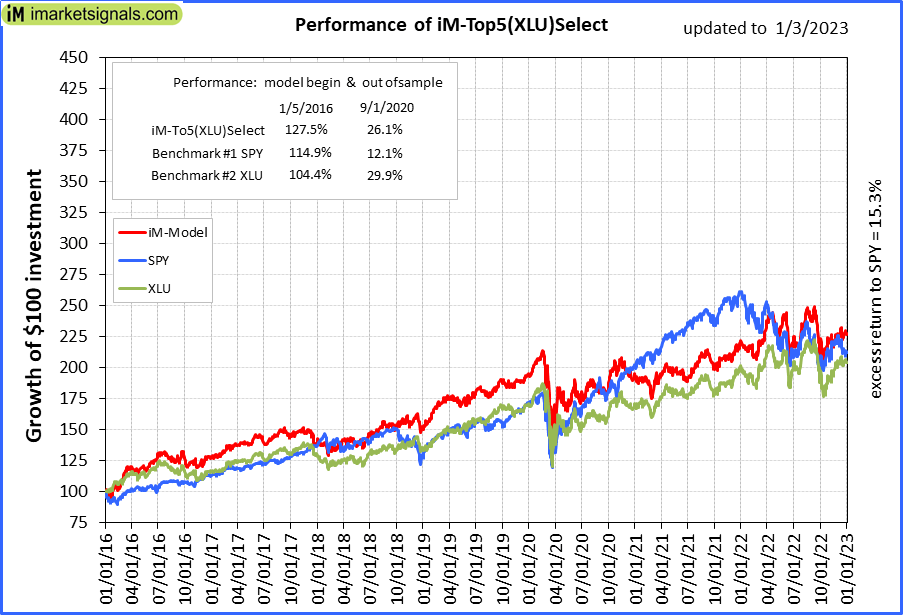 |
iM-Top5(XLU)Select: Since inception, on 1/5/2016, the model gained 127.17% while the benchmark SPY gained 111.86% over the same period. Over the previous week the market value of iM-Top5(XLU)Select gained -0.98% at a time when SPY gained -0.15%. A starting capital of $100,000 at inception on 1/5/2016 would have grown to $227,173 which includes -$11 cash and excludes $11,025 spent on fees and slippage. |
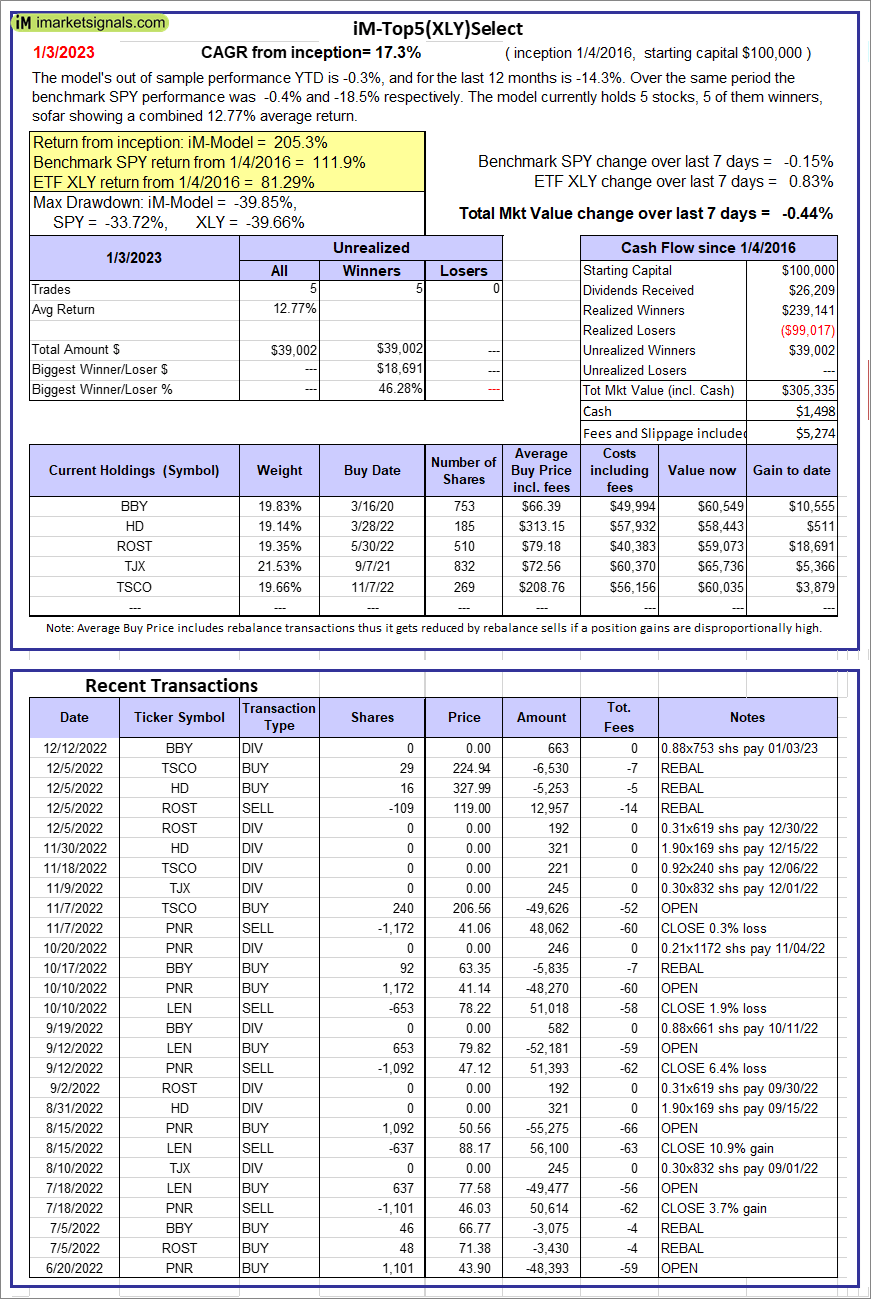 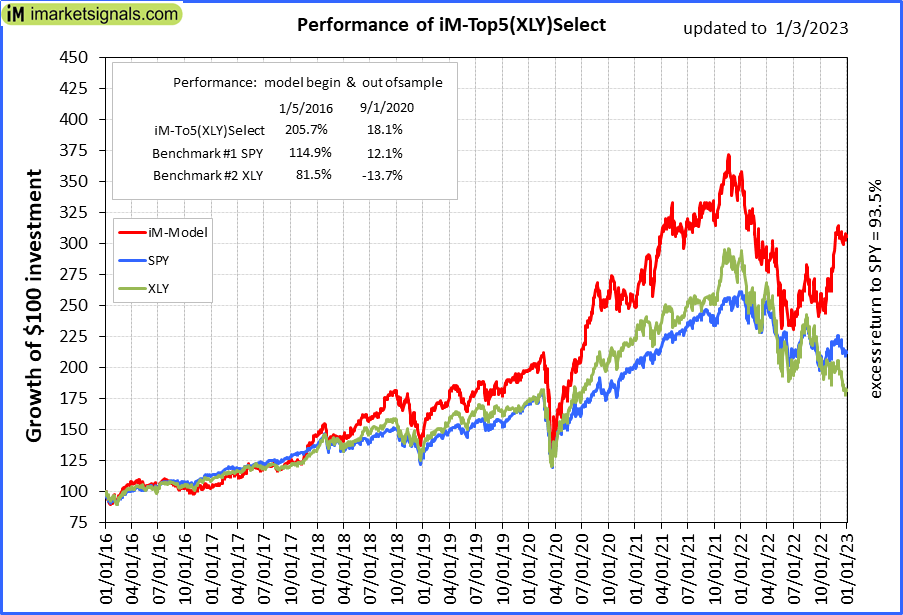 |
iM-Top5(XLY)Select: Since inception, on 1/5/2016, the model gained 205.34% while the benchmark SPY gained 111.86% over the same period. Over the previous week the market value of iM-Top5(XLY)Select gained -0.44% at a time when SPY gained -0.15%. A starting capital of $100,000 at inception on 1/5/2016 would have grown to $305,335 which includes $1,498 cash and excludes $5,274 spent on fees and slippage. |
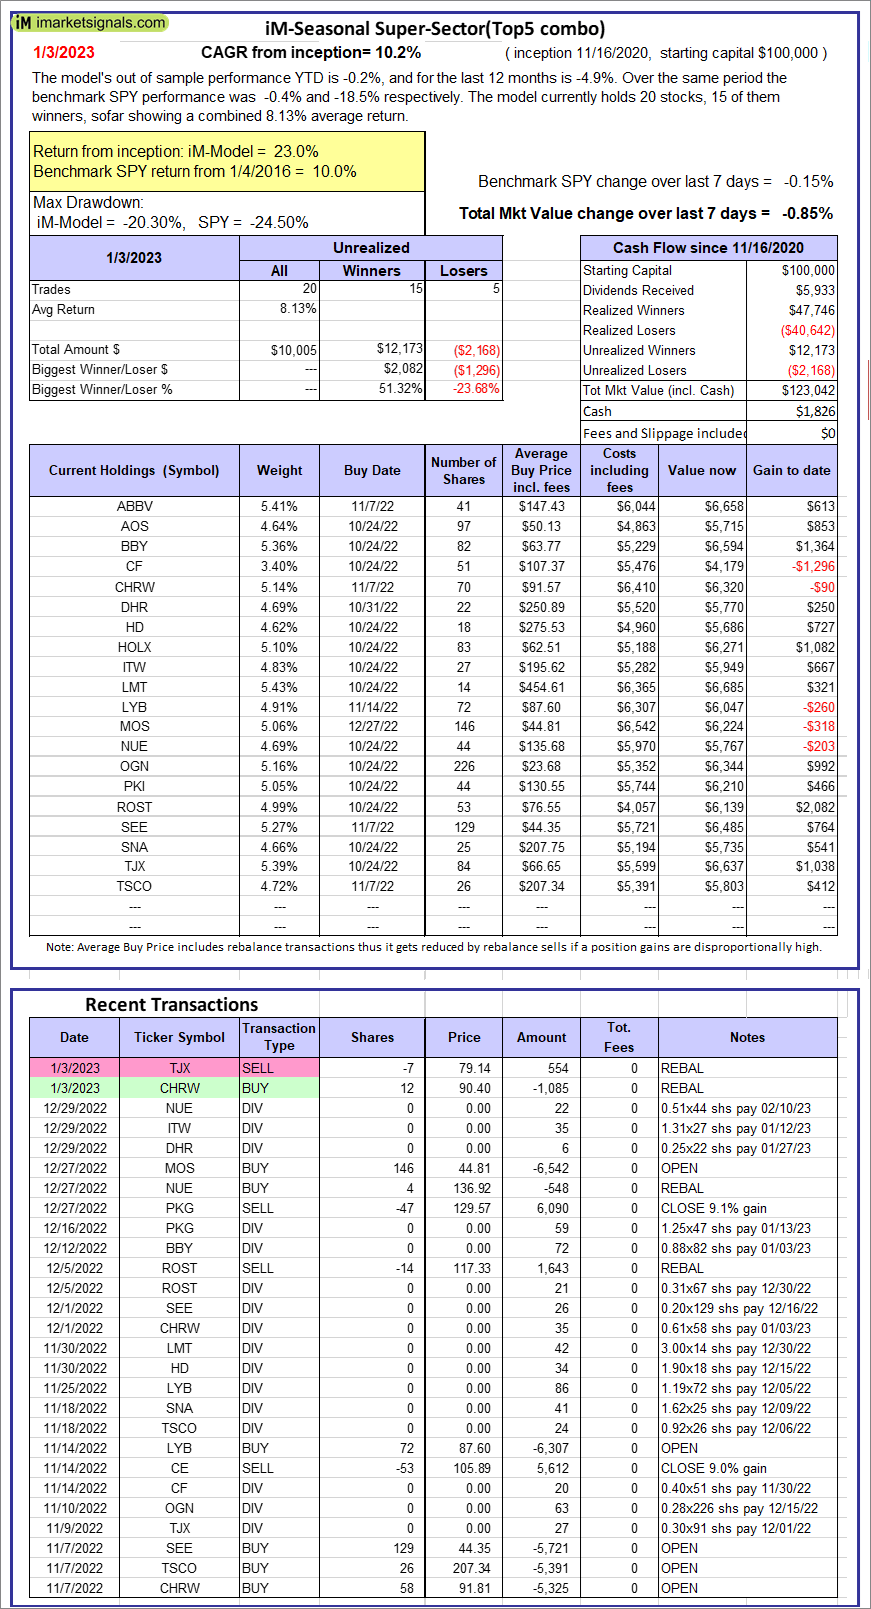 |
iM-Seasonal Super-Sectors (Top5 combo) : Since inception, on 11/17/2020, the model gained 23.04% while the benchmark SPY gained 9.98% over the same period. Over the previous week the market value of iM-Seasonal Super-Sectors (Top5 combo) gained -0.85% at a time when SPY gained -0.15%. A starting capital of $100,000 at inception on 11/17/2020 would have grown to $123,042 which includes $1,826 cash and excludes $00 spent on fees and slippage. |
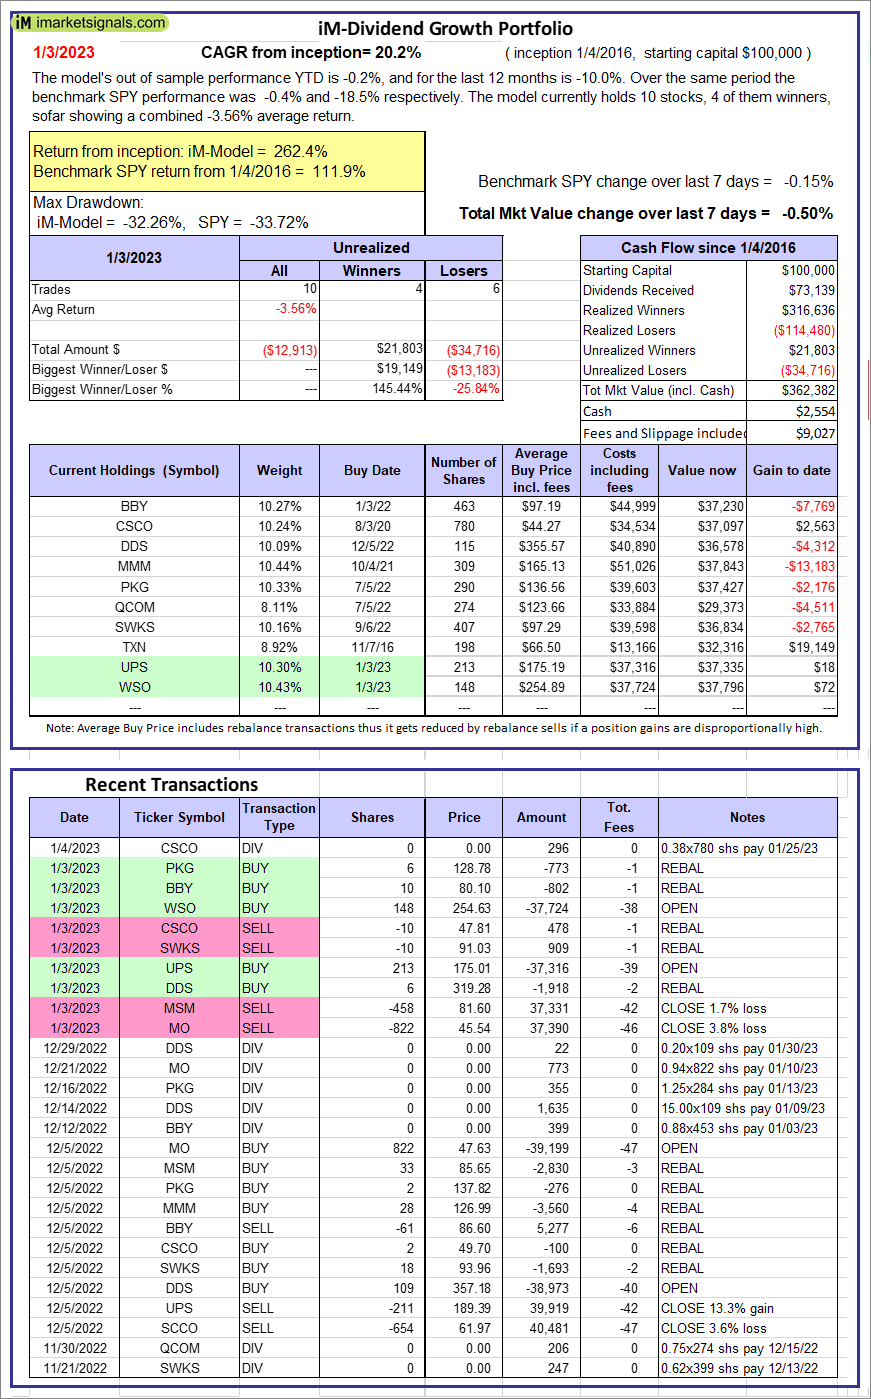 |
iM-Dividend Growth Portfolio: The model’s out of sample performance YTD is -0.2%, and for the last 12 months is -10.0%. Over the same period the benchmark SPY performance was -0.4% and -18.5% respectively. Over the previous week the market value of the iM-Dividend Growth Portfolio gained -0.50% at a time when SPY gained -0.15%. A starting capital of $100,000 at inception on 6/30/2016 would have grown to $362,382 which includes $2,554 cash and excludes $9,027 spent on fees and slippage. |
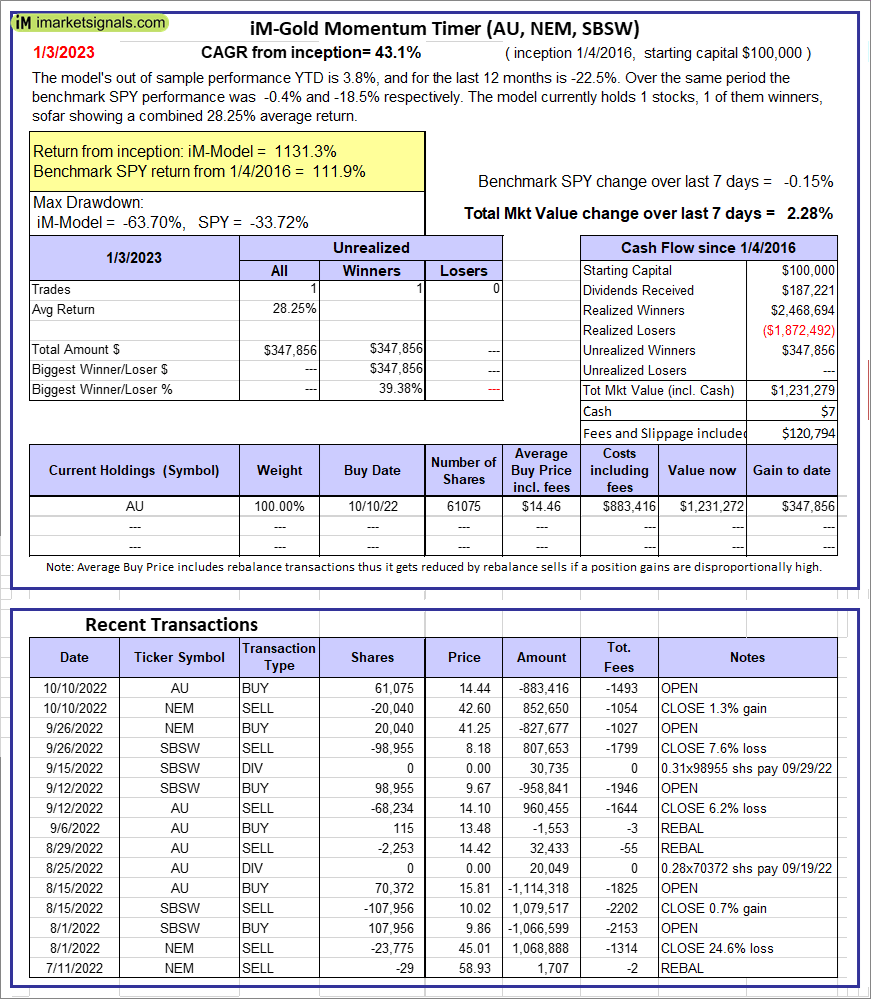 |
iM-Gold Momentum Timer (AU, NEM, SBSW): The model’s out of sample performance YTD is 3.8%, and for the last 12 months is -22.5%. Over the same period the benchmark SPY performance was -0.4% and -18.5% respectively. Over the previous week the market value of iM-Gold Momentum Timer (AU, NEM, SBSW) gained 2.28% at a time when SPY gained -0.15%. A starting capital of $100,000 at inception on 6/30/2016 would have grown to $07 which includes $120,794 cash and excludes Gain to date spent on fees and slippage. |
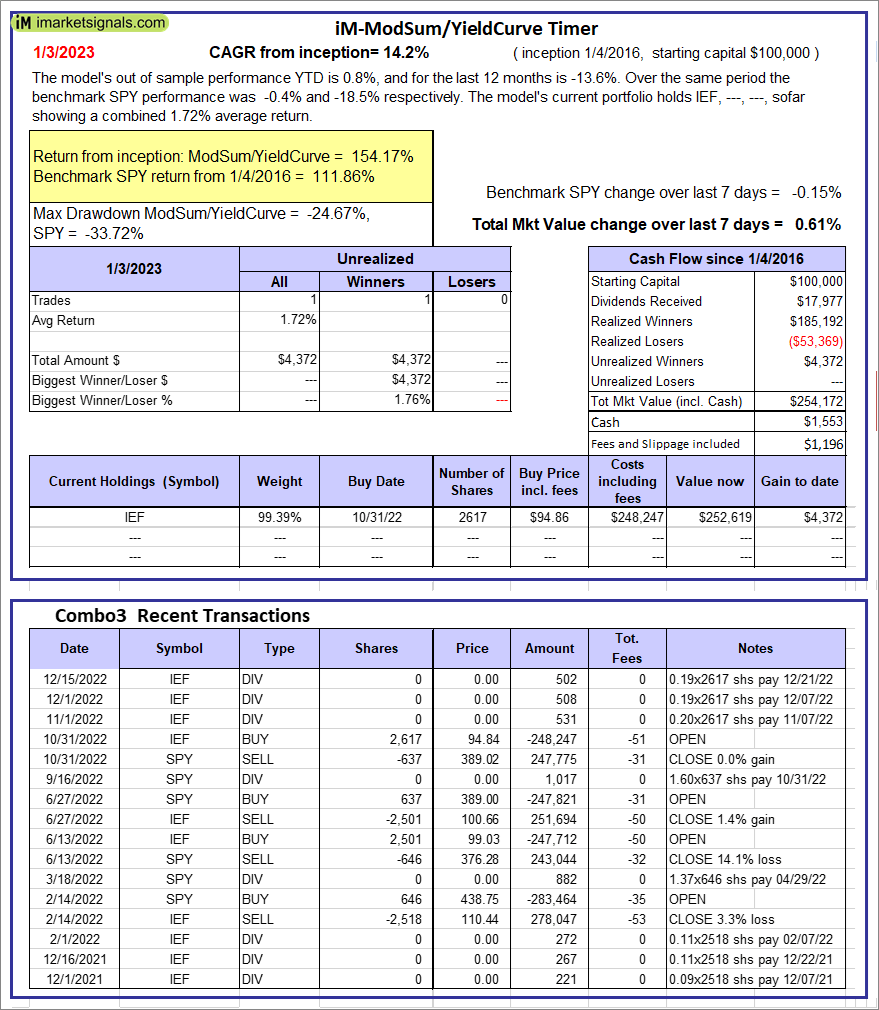 |
iM-ModSum/YieldCurve Timer: The model’s out of sample performance YTD is 0.8%, and for the last 12 months is -13.6%. Over the same period the benchmark SPY performance was -0.4% and -18.5% respectively. Over the previous week the market value of iM-PortSum/YieldCurve Timer gained 0.61% at a time when SPY gained -0.15%. A starting capital of $100,000 at inception on 1/1/2016 would have grown to $254,172 which includes $1,553 cash and excludes $1,196 spent on fees and slippage. |
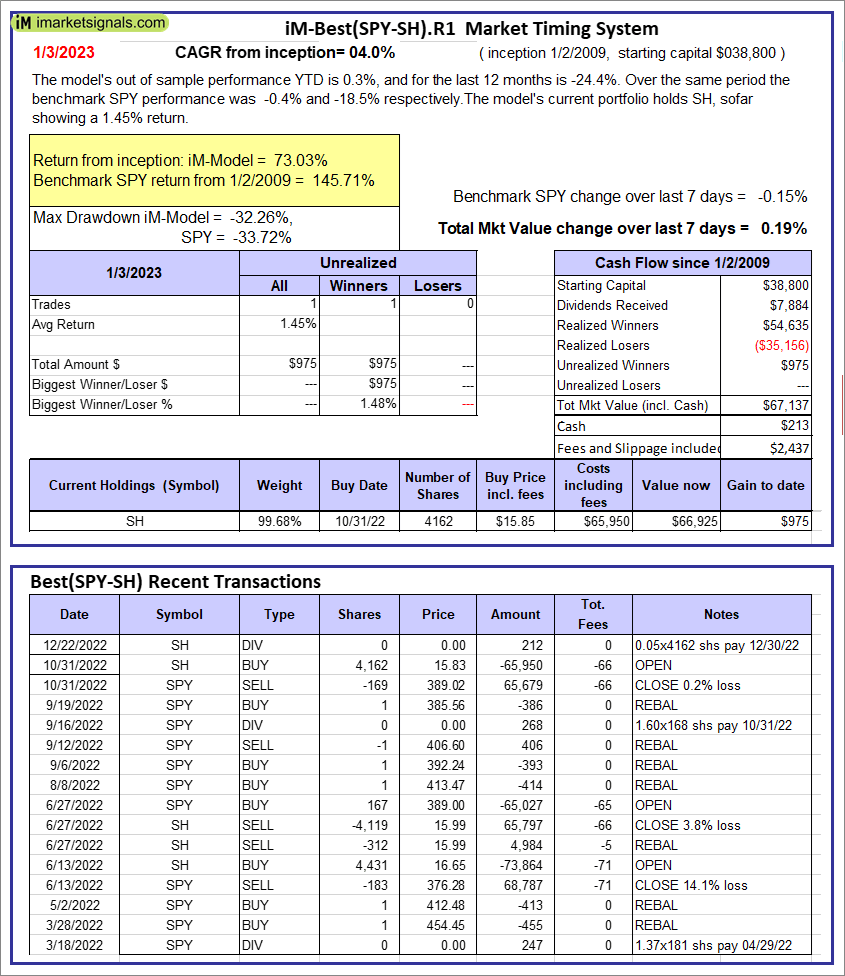 |
iM-Best(SPY-SH).R1: The model’s out of sample performance YTD is 0.3%, and for the last 12 months is -24.4%. Over the same period the benchmark SPY performance was -0.4% and -18.5% respectively. Over the previous week the market value of Best(SPY-SH) gained 0.19% at a time when SPY gained -0.15%. A starting capital of $100,000 at inception on 1/2/2009 would have grown to $67,137 which includes $213 cash and excludes $2,437 spent on fees and slippage. |
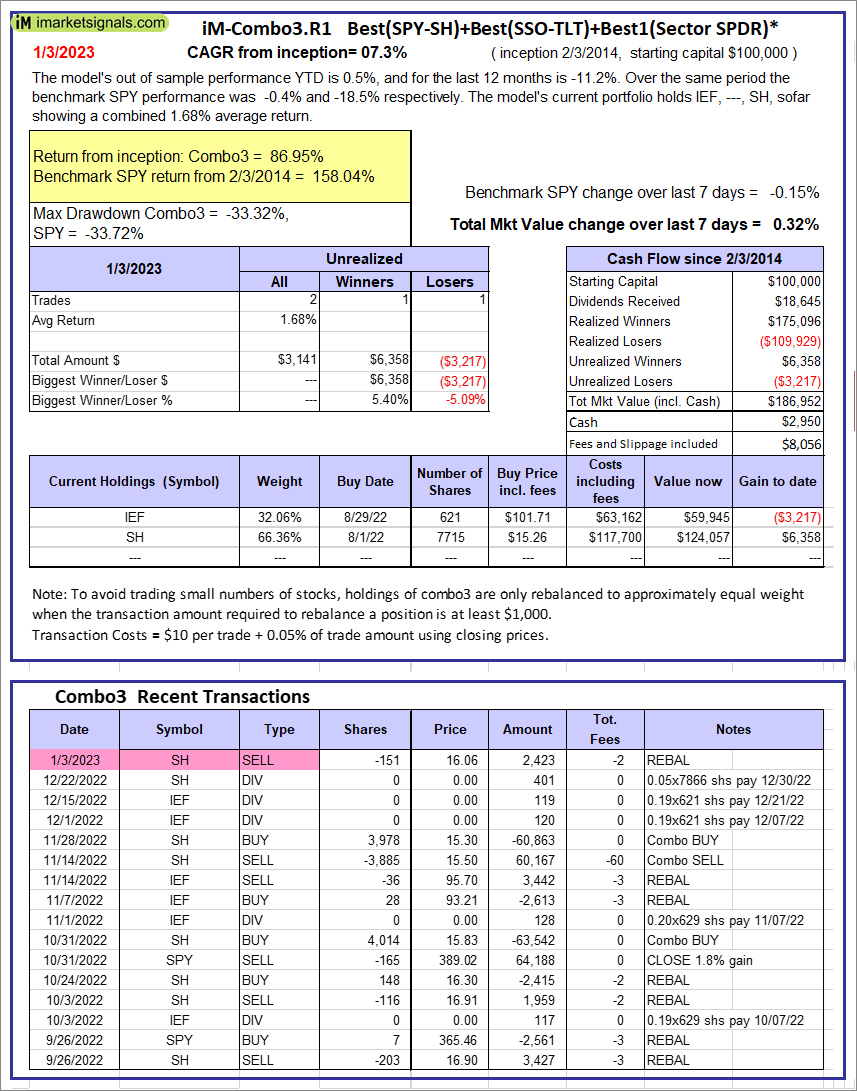 |
iM-Combo3.R1: The model’s out of sample performance YTD is 0.5%, and for the last 12 months is -11.2%. Over the same period the benchmark SPY performance was -0.4% and -18.5% respectively. Over the previous week the market value of iM-Combo3.R1 gained 0.32% at a time when SPY gained -0.15%. A starting capital of $100,000 at inception on 2/3/2014 would have grown to $186,952 which includes $2,950 cash and excludes $8,056 spent on fees and slippage. |
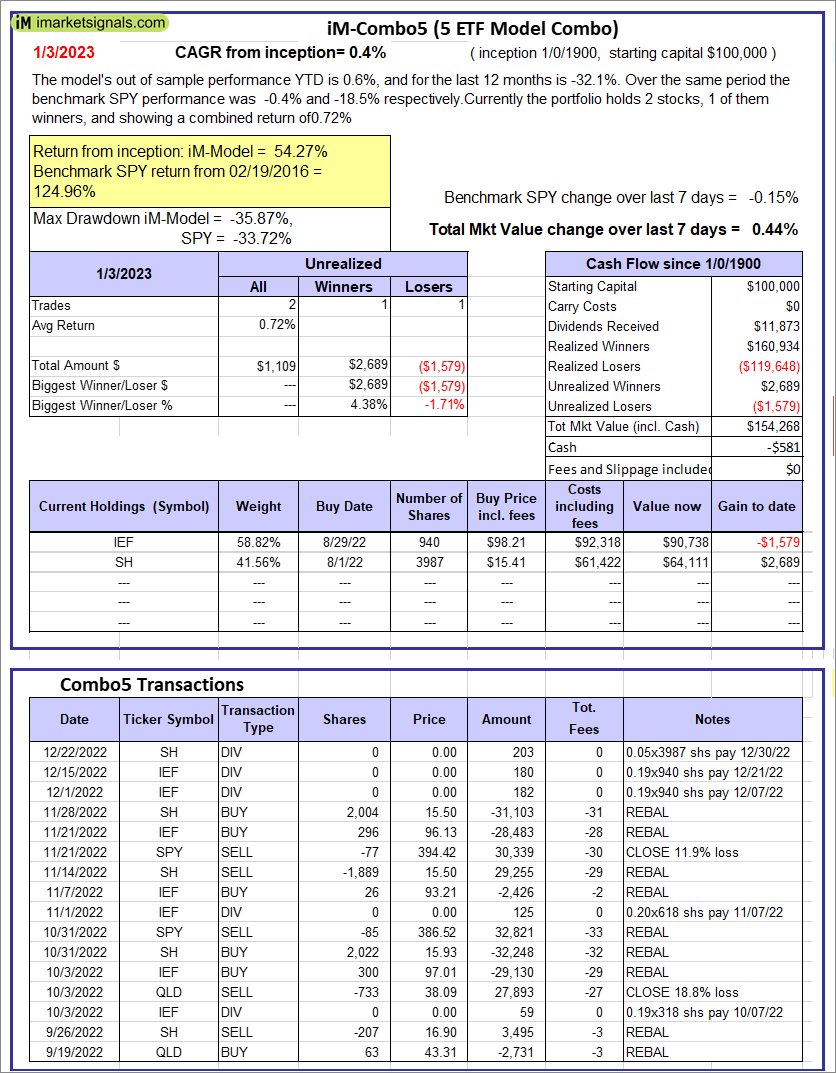 |
iM-Combo5: The model’s out of sample performance YTD is 0.6%, and for the last 12 months is -32.1%. Over the same period the benchmark SPY performance was -0.4% and -18.5% respectively. Over the previous week the market value of iM-Combo5 gained 0.44% at a time when SPY gained -0.15%. A starting capital of $100,000 at inception on 2/22/2016 would have grown to $154,268 which includes -$581 cash and excludes $0 spent on fees and slippage. |
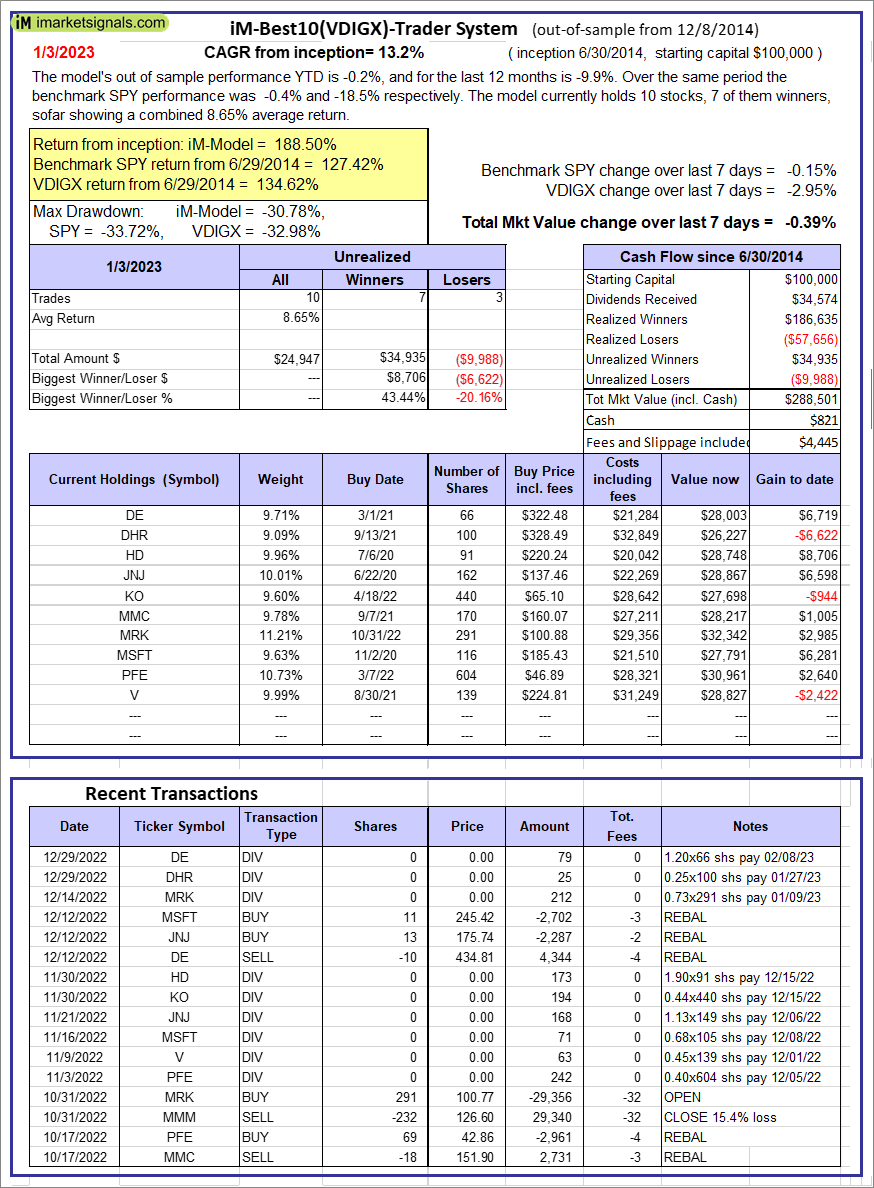 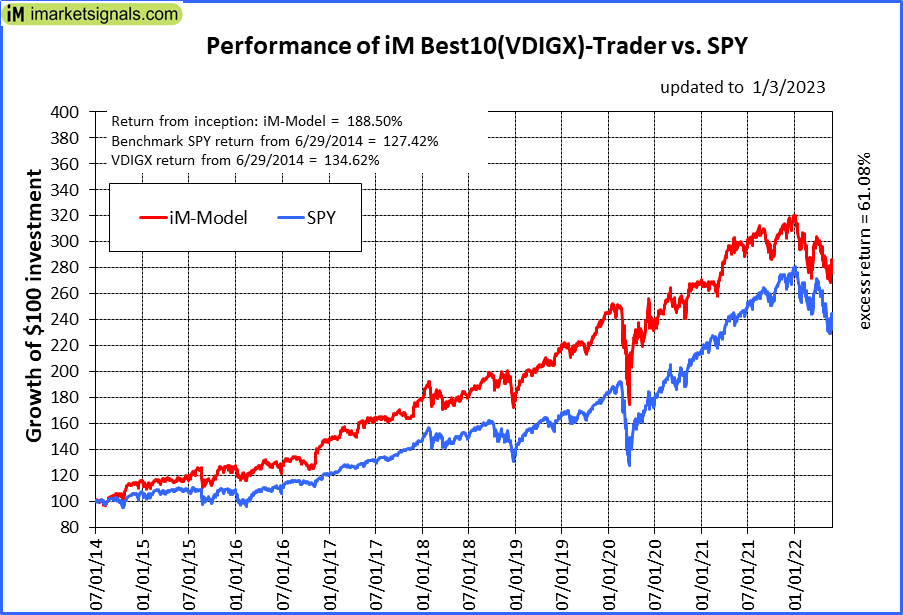 |
iM-Best10(VDIGX)-Trader: The model’s out of sample performance YTD is -0.2%, and for the last 12 months is -9.9%. Over the same period the benchmark SPY performance was -0.4% and -18.5% respectively. Since inception, on 7/1/2014, the model gained 188.50% while the benchmark SPY gained 127.42% and VDIGX gained 134.62% over the same period. Over the previous week the market value of iM-Best10(VDIGX) gained -0.39% at a time when SPY gained -0.15%. A starting capital of $100,000 at inception on 7/1/2014 would have grown to $288,501 which includes $821 cash and excludes $4,445 spent on fees and slippage. |
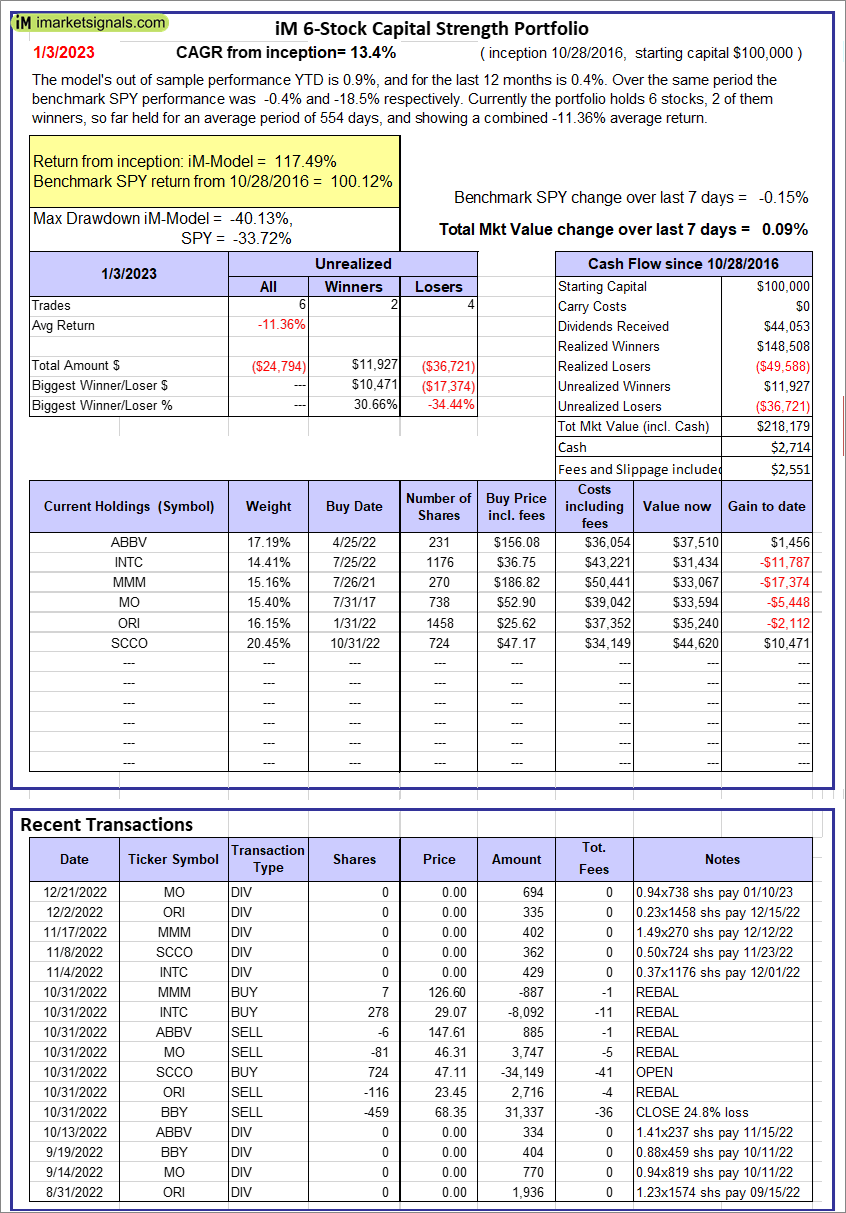 |
iM 6-Stock Capital Strength Portfolio: The model’s out of sample performance YTD is 0.9%, and for the last 12 months is 0.4%. Over the same period the benchmark SPY performance was -0.4% and -18.5% respectively. Over the previous week the market value of the iM 6-Stock Capital Strength Portfolio gained 0.09% at a time when SPY gained -0.15%. A starting capital of $100,000 at inception on 10/28/2016 would have grown to $218,179 which includes $2,714 cash and excludes $2,551 spent on fees and slippage. |
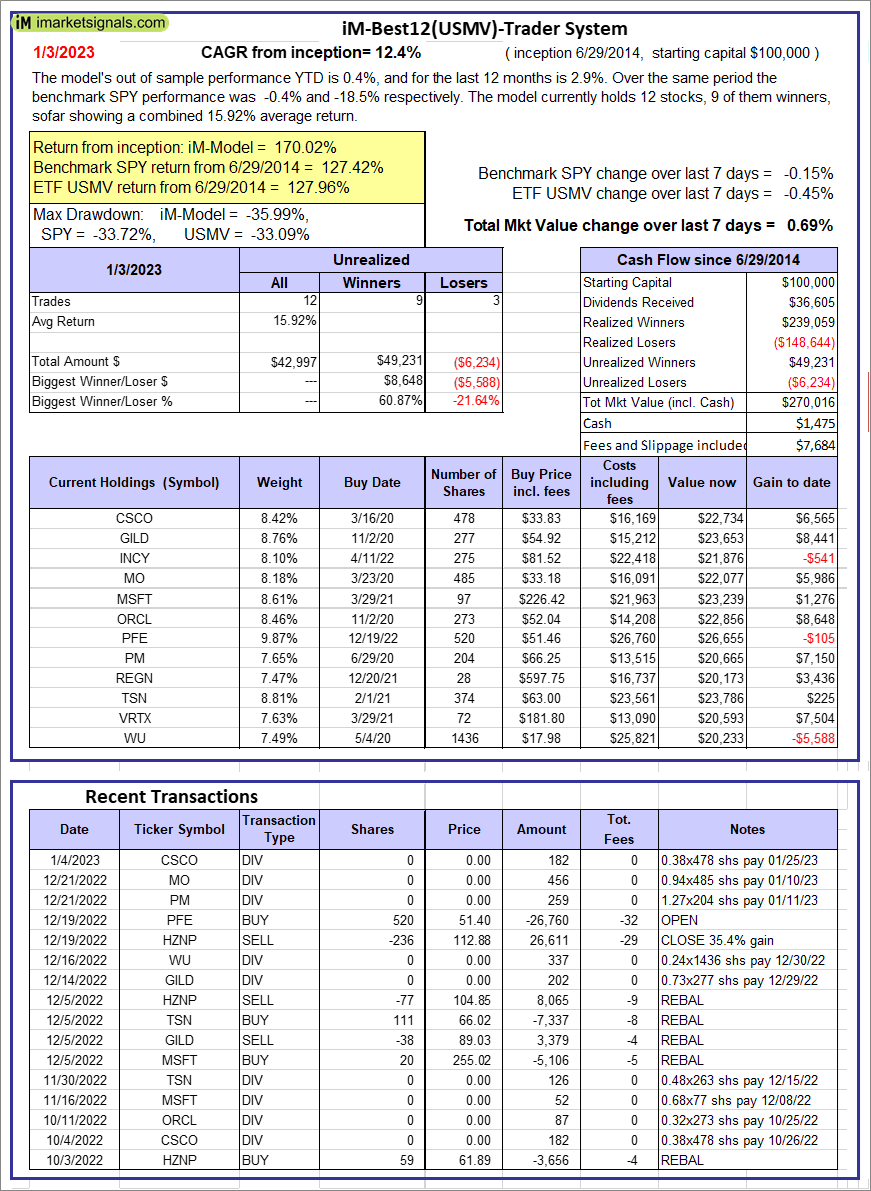 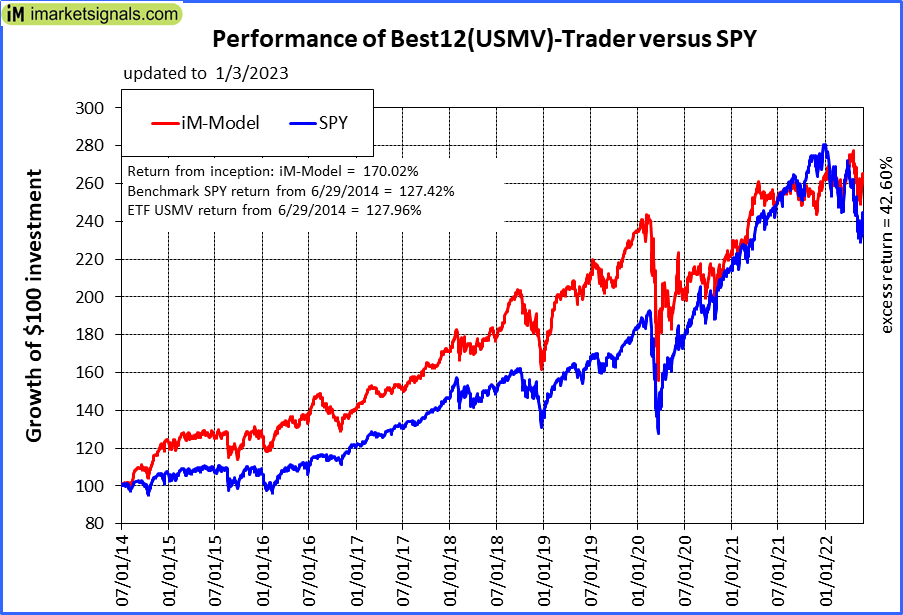 |
iM-Best12(USMV)-Trader: The model’s out of sample performance YTD is 0.4%, and for the last 12 months is 2.9%. Over the same period the benchmark SPY performance was -0.4% and -18.5% respectively. Since inception, on 6/30/2014, the model gained 170.02% while the benchmark SPY gained 127.42% and the ETF USMV gained 127.96% over the same period. Over the previous week the market value of iM-Best12(USMV)-Trader gained 0.69% at a time when SPY gained -0.15%. A starting capital of $100,000 at inception on 6/30/2014 would have grown to $270,016 which includes $1,475 cash and excludes $7,684 spent on fees and slippage. |
 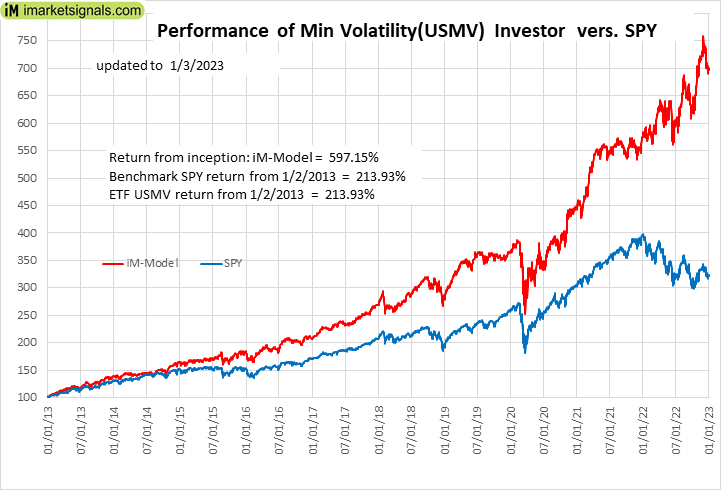 |
iM-Min Volatility(USMV) Investor (Tax Efficient): The model’s out of sample performance YTD is -0.5%, and for the last 12 months is 21.4%. Over the same period the benchmark SPY performance was -0.4% and -18.5% respectively. Since inception, on 1/3/2013, the model gained 597.15% while the benchmark SPY gained 213.93% and the ETF USMV gained 213.93% over the same period. Over the previous week the market value of iM-Best12(USMV)Q1 gained -0.39% at a time when SPY gained -0.15%. A starting capital of $100,000 at inception on 1/3/2013 would have grown to $697,146 which includes $3,201 cash and excludes $6,959 spent on fees and slippage. |
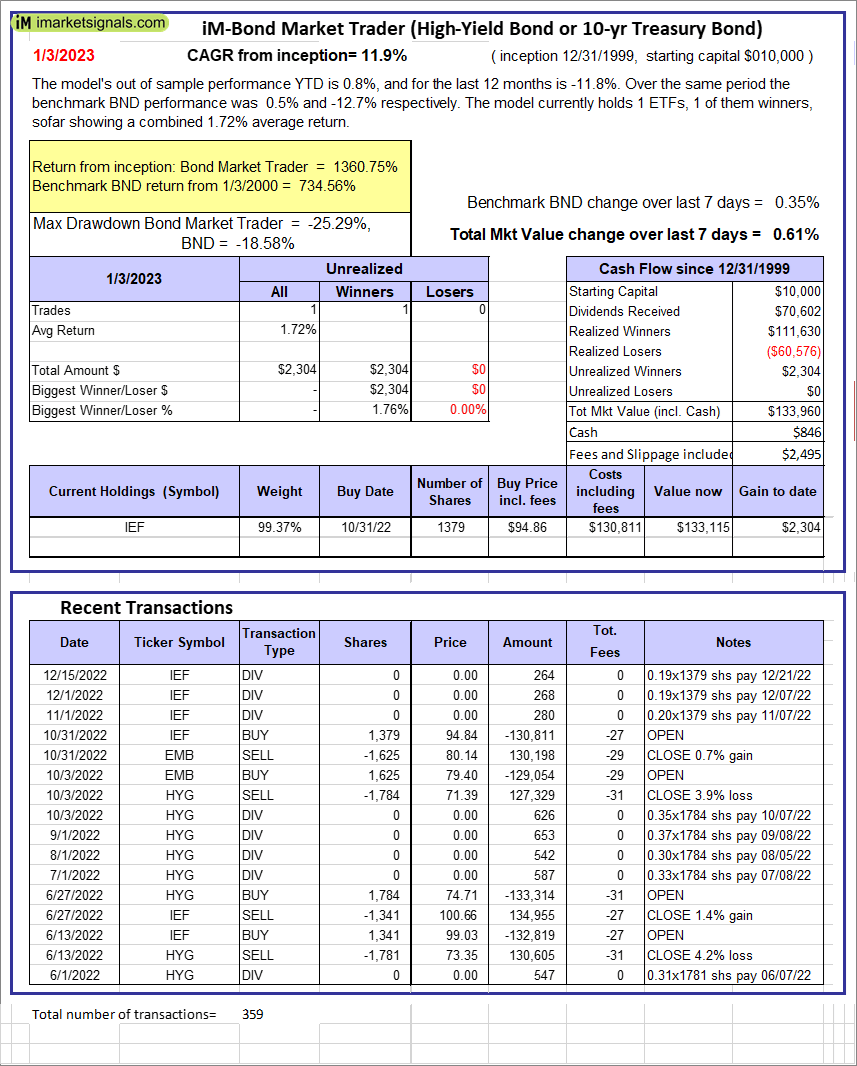 |
iM-Bond Market Trader (High-Yield Bond or 10-yr Treasury Bond): The model’s out of sample performance YTD is 0.8%, and for the last 12 months is -11.8%. Over the same period the benchmark BND performance was 0.5% and -12.7% respectively. Over the previous week the market value of the iM-Bond Market Trader (High-Yield Bond or 10-yr Treasury Bond) gained 0.61% at a time when BND gained 0.35%. A starting capital of $10,000 at inception on 1/3/2000 would have grown to $133,960 which includes $846 cash and excludes $2,495 spent on fees and slippage. |
|
|
iM-ModSum/YieldCurve Timer: The model’s out of sample performance YTD is 0.8%, and for the last 12 months is -13.6%. Over the same period the benchmark SPY performance was -0.4% and -18.5% respectively. Over the previous week the market value of iM-PortSum/YieldCurve Timer gained 0.61% at a time when SPY gained -0.15%. A starting capital of $100,000 at inception on 1/1/2016 would have grown to $254,172 which includes $1,553 cash and excludes $1,196 spent on fees and slippage. |
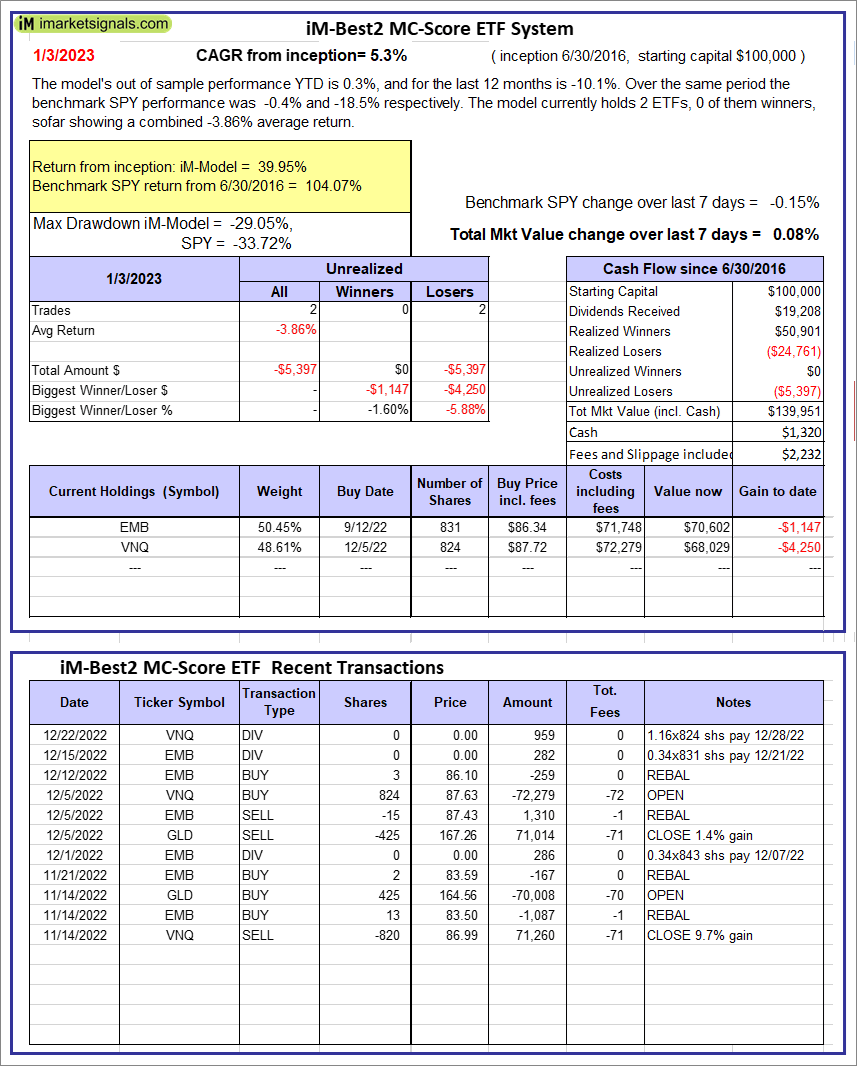 |
iM-Best2 MC-Score ETF System: The model’s out of sample performance YTD is 0.3%, and for the last 12 months is -10.1%. Over the same period the benchmark SPY performance was -0.4% and -18.5% respectively. Over the previous week the market value of the iM-Best2 MC-Score ETF System gained 0.08% at a time when SPY gained -0.15%. A starting capital of $100,000 at inception on 6/30/2016 would have grown to $139,951 which includes $1,320 cash and excludes $2,232 spent on fees and slippage. |
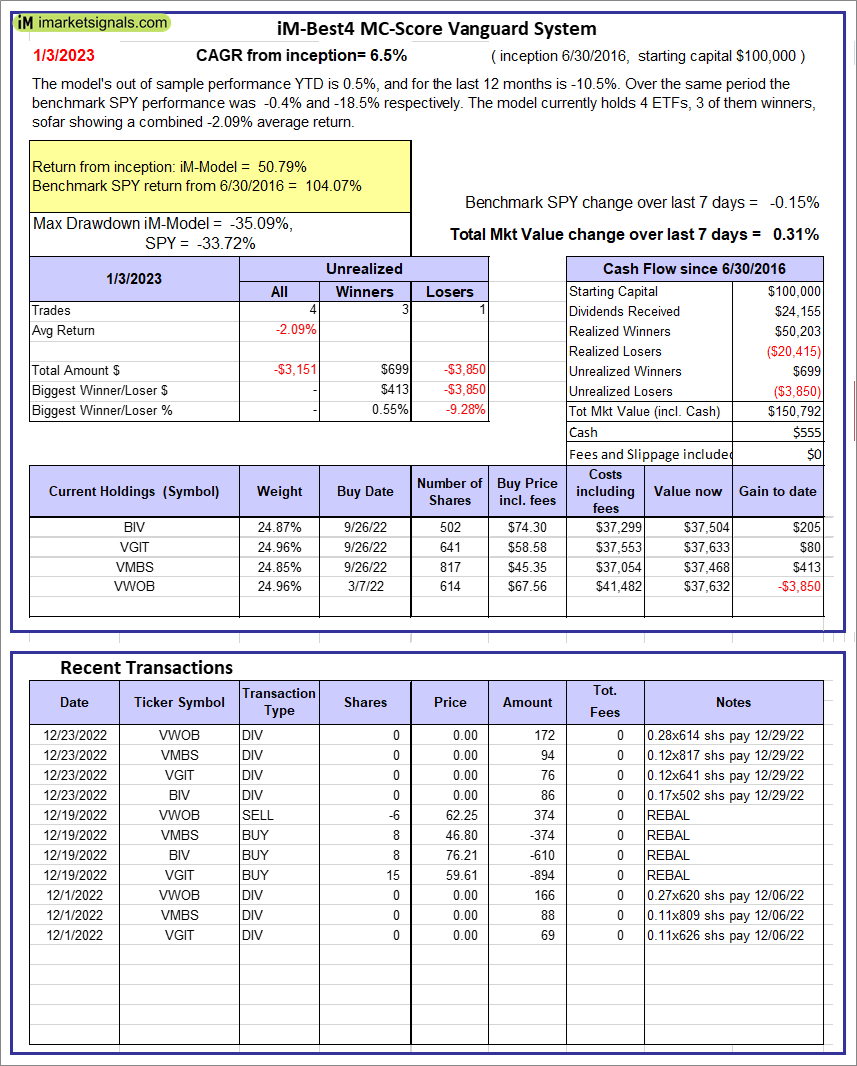 |
iM-Best4 MC-Score Vanguard System: The model’s out of sample performance YTD is 0.5%, and for the last 12 months is -10.5%. Over the same period the benchmark SPY performance was -0.4% and -18.5% respectively. Over the previous week the market value of the iM-Best4 MC-Score Vanguard System gained 0.31% at a time when SPY gained -0.15%. A starting capital of $100,000 at inception on 6/30/2016 would have grown to $150,792 which includes $555 cash and excludes $00 spent on fees and slippage. |
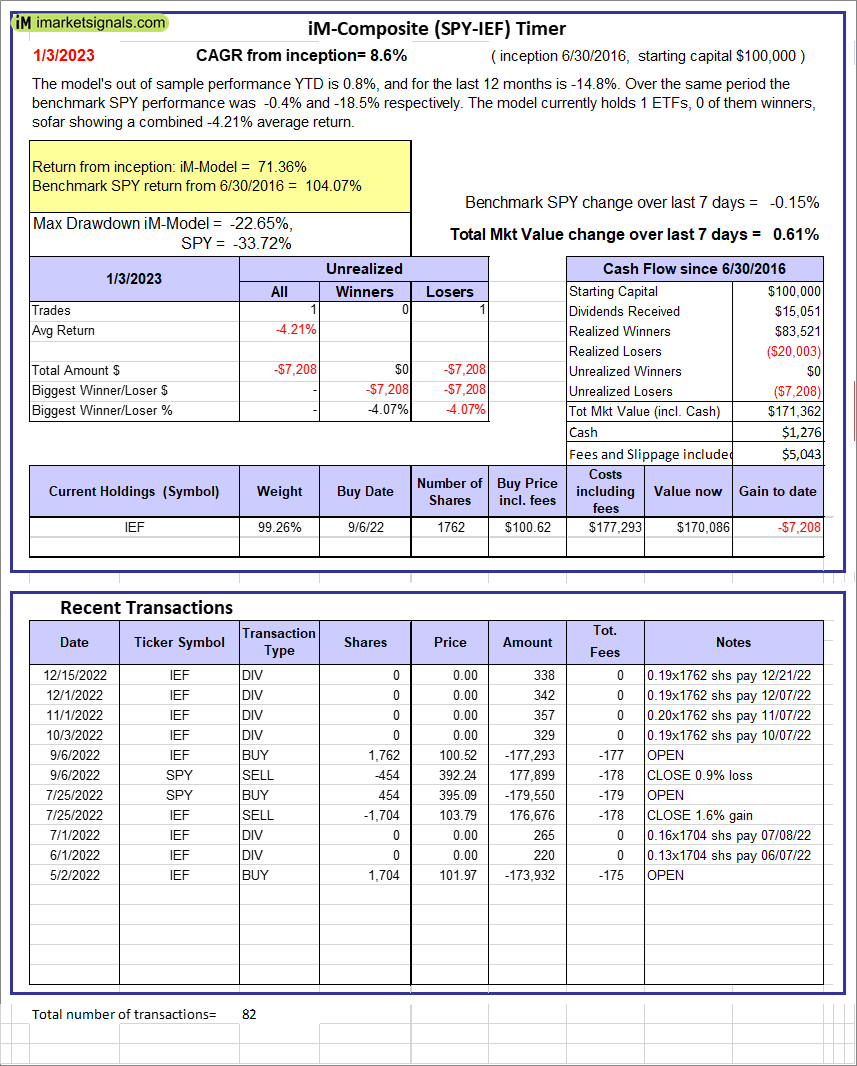 |
iM-Composite (SPY-IEF) Timer: The model’s out of sample performance YTD is 0.8%, and for the last 12 months is -14.8%. Over the same period the benchmark SPY performance was -0.4% and -18.5% respectively. Over the previous week the market value of the iM-Composite (SPY-IEF) Timer gained 0.61% at a time when SPY gained -0.15%. A starting capital of $100,000 at inception on 6/30/2016 would have grown to $171,362 which includes $1,276 cash and excludes $5,043 spent on fees and slippage. |
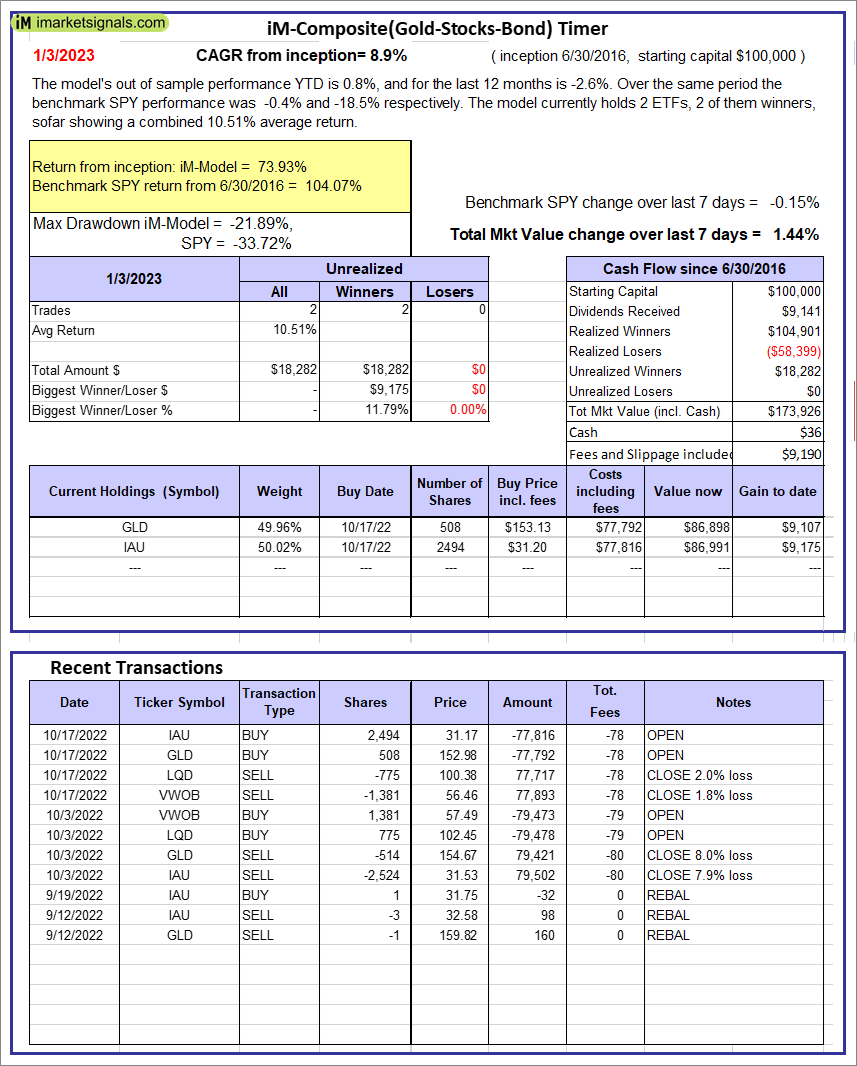 |
iM-Composite(Gold-Stocks-Bond) Timer: The model’s out of sample performance YTD is 0.8%, and for the last 12 months is -2.6%. Over the same period the benchmark SPY performance was -0.4% and -18.5% respectively. Over the previous week the market value of the iM-Composite(Gold-Stocks-Bond) Timer gained 1.44% at a time when SPY gained -0.15%. A starting capital of $100,000 at inception on 6/30/2016 would have grown to $173,926 which includes $36 cash and excludes $9,190 spent on fees and slippage. |
iM-Best Reports – 1/3/2022
Posted in pmp SPY-SH
Leave a Reply
You must be logged in to post a comment.