
  |
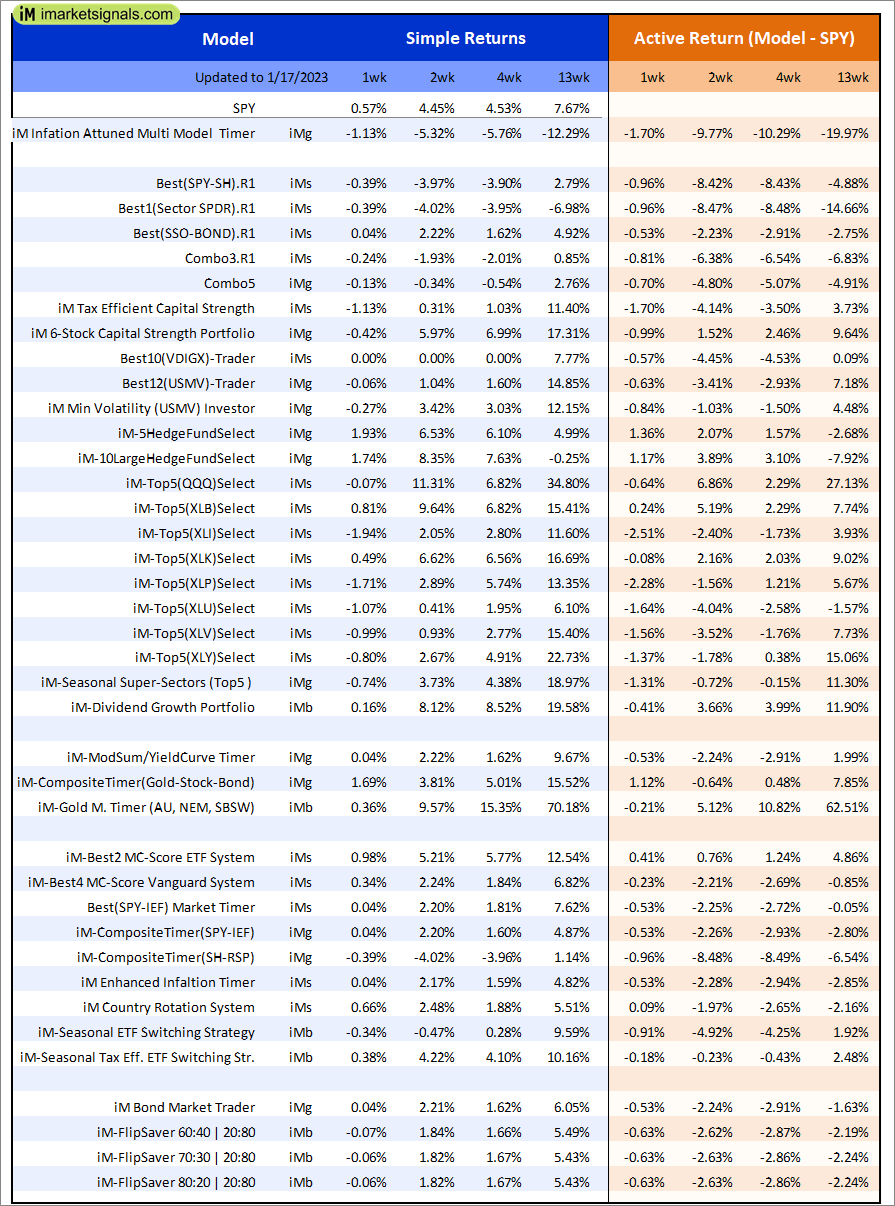
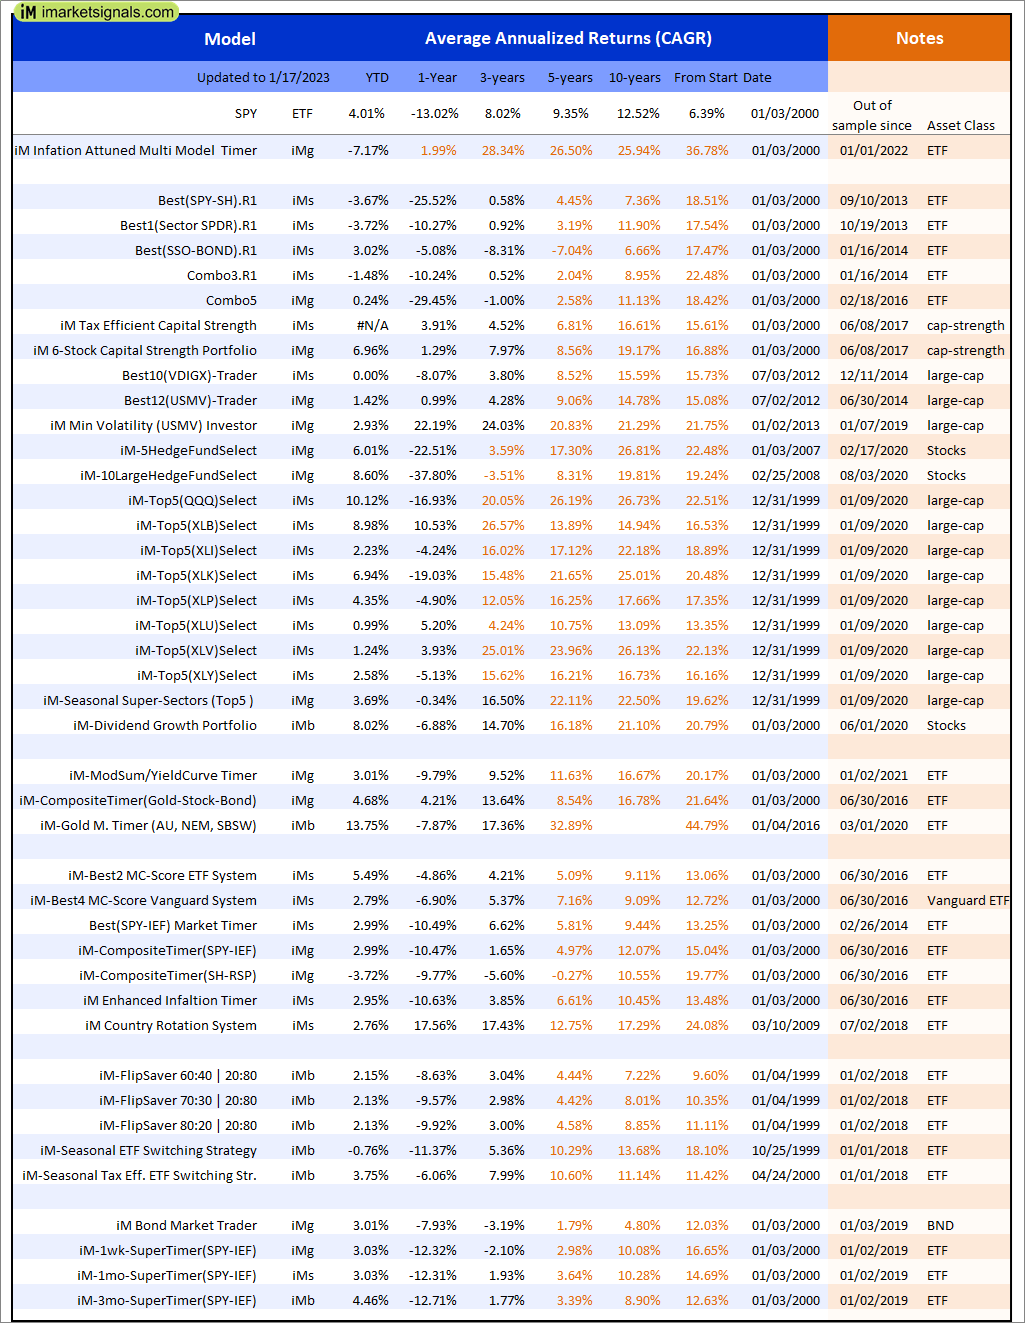
Out of sample performance summary of our models for the past 1, 2, 4 and 13 week periods. The active active return indicates how the models over- or underperformed the benchmark ETF SPY. Also the YTD, and the 1-, 3-, 5- and 10-year annualized returns are shown in the second table |
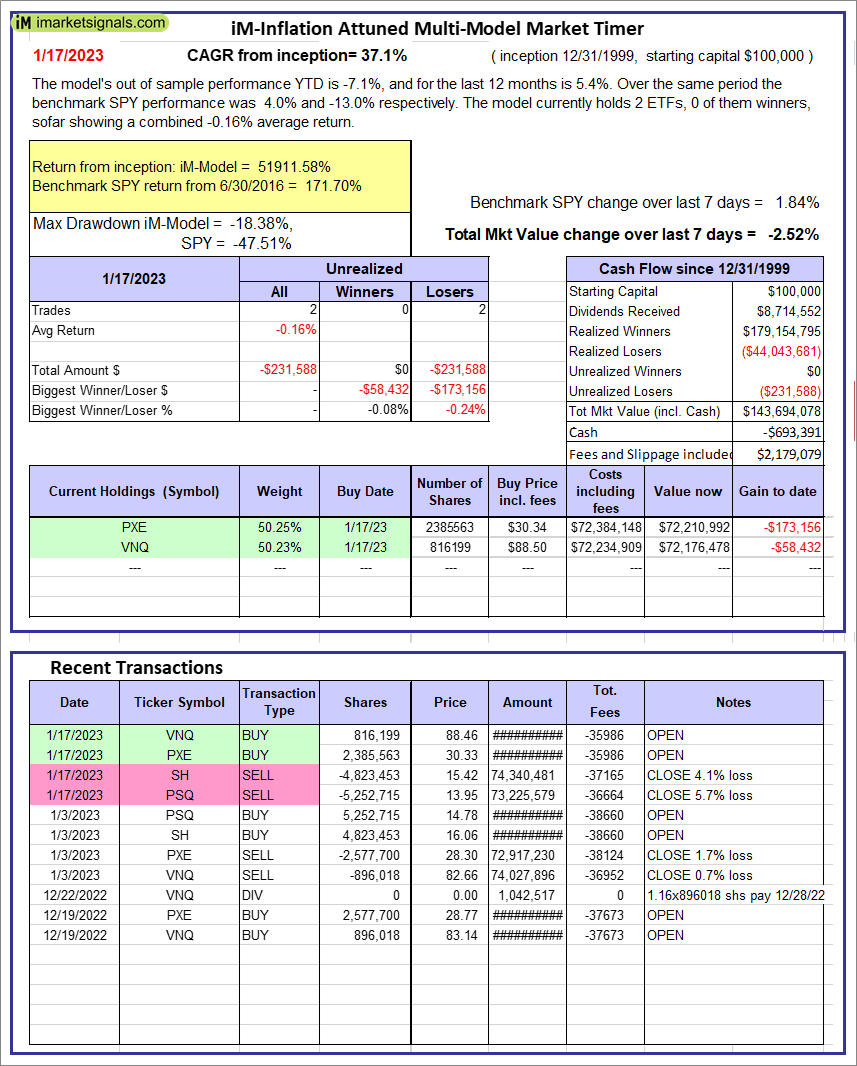 |
iM-Inflation Attuned Multi-Model Market Timer: The model’s out of sample performance YTD is -7.1%, and for the last 12 months is 5.4%. Over the same period the benchmark SPY performance was 4.0% and -13.0% respectively. Over the previous week the market value of the iM-Inflation Attuned Multi-Model Market Timer gained -2.52% at a time when SPY gained 1.84%. A starting capital of $100,000 at inception on 3/24/2017 would have grown to $143,694,078 which includes -$693,391 cash and excludes $2,179,079 spent on fees and slippage. |
 |
iM-FlipSaver 60:40 | 20:80 – 2017: The model’s out of sample performance YTD is 2.1%, and for the last 12 months is -9.2%. Over the same period the benchmark E60B40 performance was 3.5% and -10.9% respectively. Over the previous week the market value of iM-FlipSaver 80:20 | 20:80 gained 0.51% at a time when SPY gained 1.44%. A starting capital of $100,000 at inception on 7/16/2015 would have grown to $144,000 which includes $2,183 cash and excludes $2,673 spent on fees and slippage. |
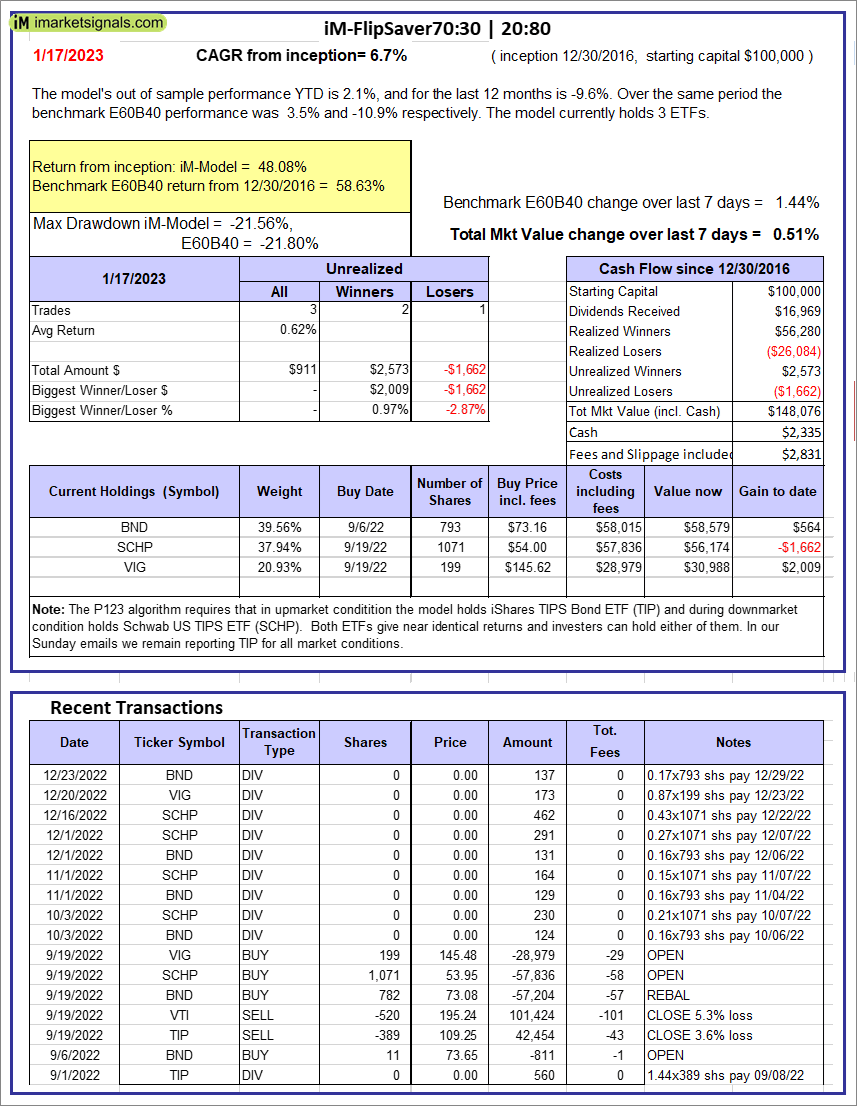 |
iM-FlipSaver 70:30 | 20:80 – 2017: The model’s out of sample performance YTD is 2.1%, and for the last 12 months is -9.6%. Over the same period the benchmark E60B40 performance was 3.5% and -10.9% respectively. Over the previous week the market value of iM-FlipSaver 70:30 | 20:80 gained 0.51% at a time when SPY gained 1.44%. A starting capital of $100,000 at inception on 7/15/2015 would have grown to $148,076 which includes $2,335 cash and excludes $2,831 spent on fees and slippage. |
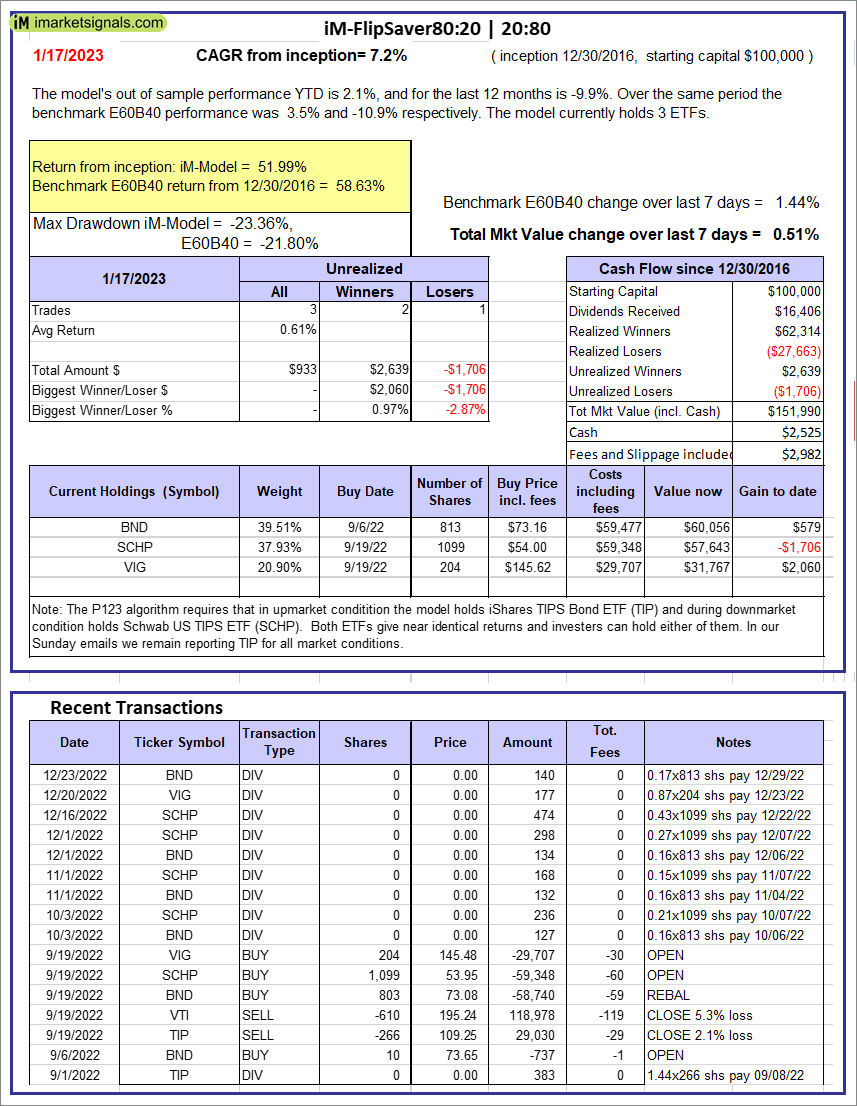 |
iM-FlipSaver 80:20 | 20:80 – 2017: The model’s out of sample performance YTD is 2.1%, and for the last 12 months is -9.9%. Over the same period the benchmark E60B40 performance was 3.5% and -10.9% respectively. Over the previous week the market value of iM-FlipSaver 80:20 | 20:80 gained 0.51% at a time when SPY gained 1.44%. A starting capital of $100,000 at inception on 1/2/2017 would have grown to $151,990 which includes $2,525 cash and excludes $2,982 spent on fees and slippage. |
 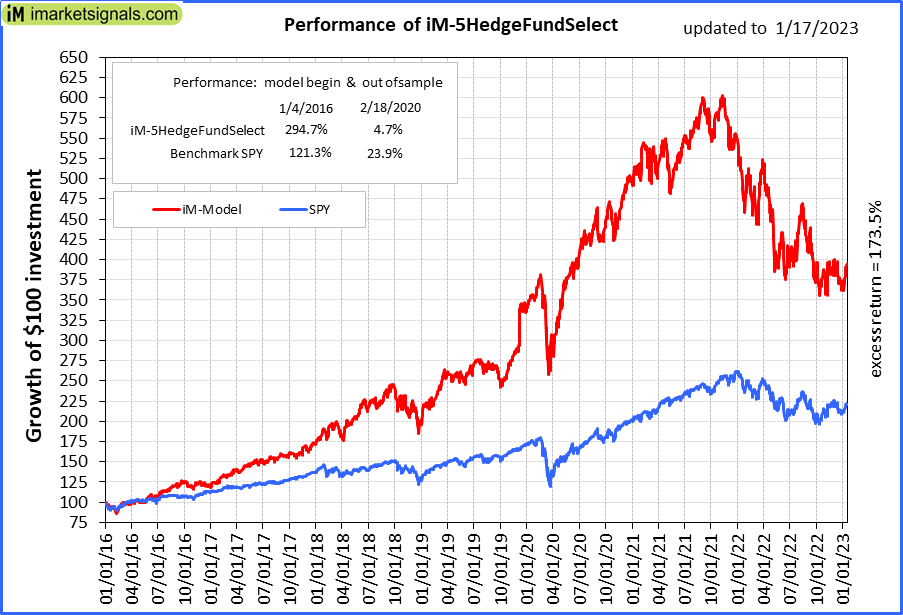 |
iM-5HedgeFundSelect: Since inception, on 1/5/2016, the model gained 294.74% while the benchmark SPY gained 121.29% over the same period. Over the previous week the market value of iM-5HedgeFundSelect gained 4.18% at a time when SPY gained 1.84%. A starting capital of $25,000 at inception on 1/5/2016 would have grown to $98,685 which includes $2,066 cash and excludes $1,835 spent on fees and slippage. |
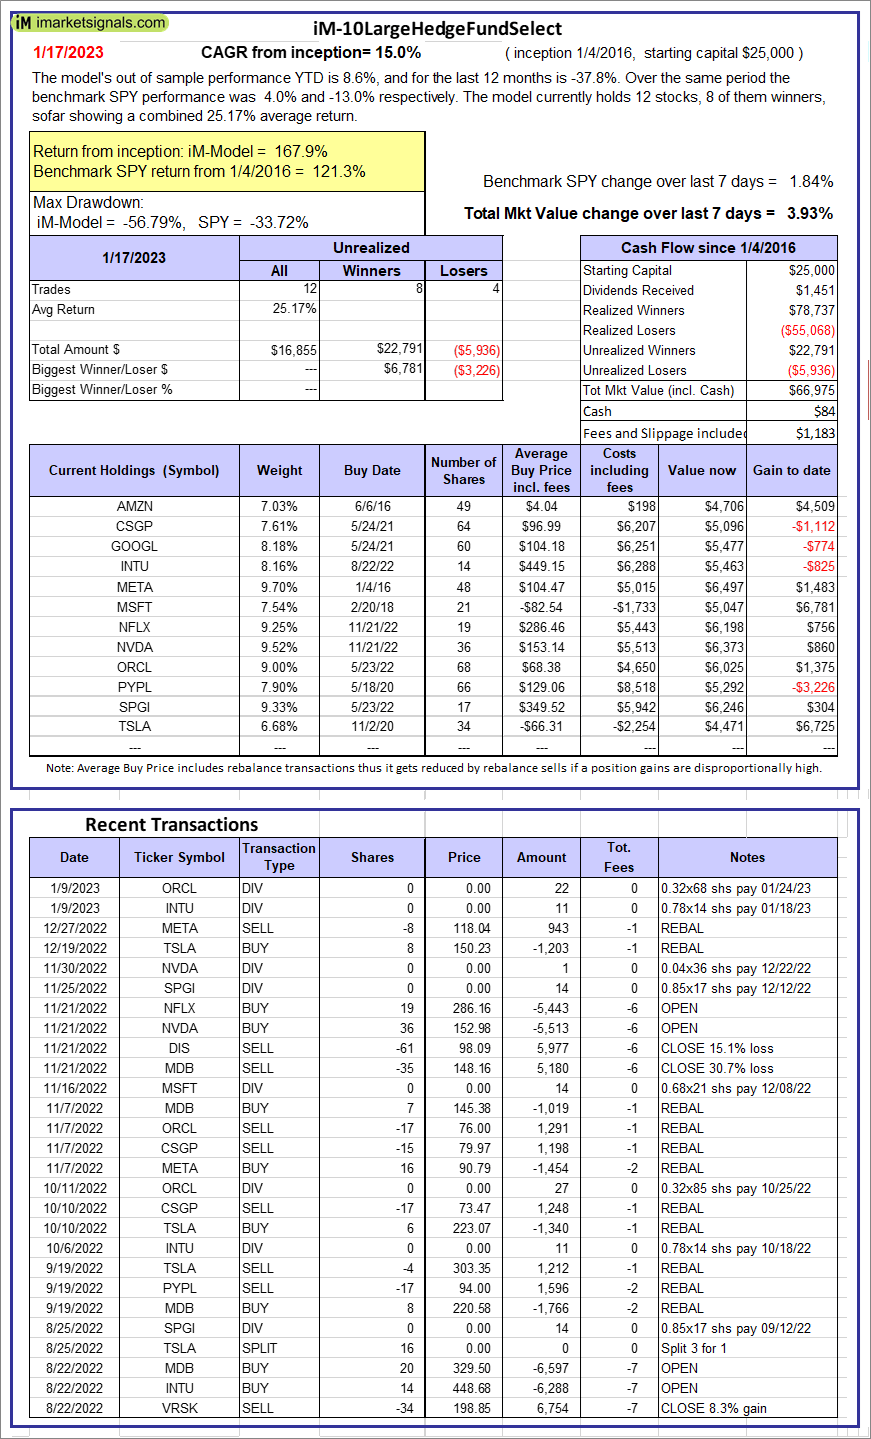 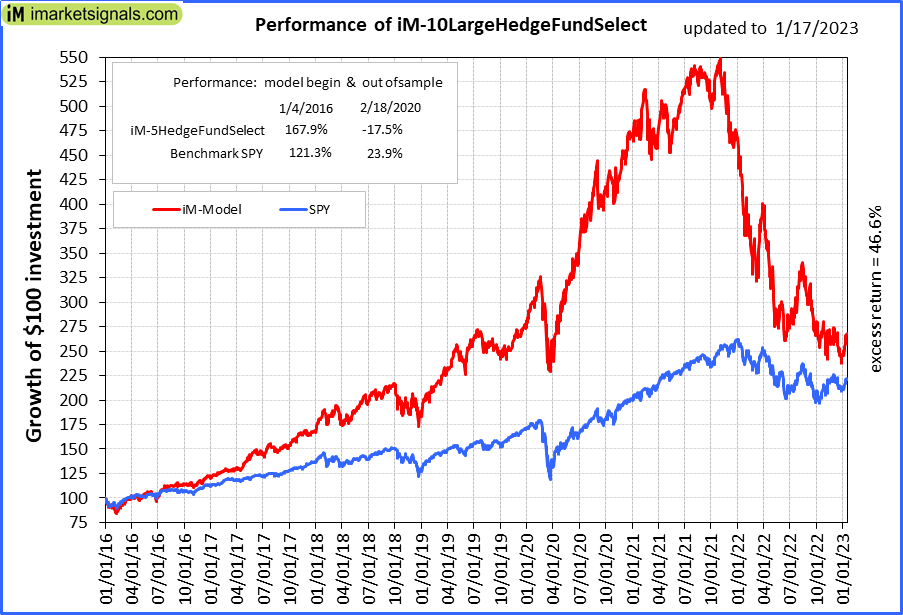 |
iM-10LargeHedgeFundSelect: Since inception, on 1/5/2016, the model gained 167.90% while the benchmark SPY gained 121.29% over the same period. Over the previous week the market value of iM-10LargeHedgeFundSelect gained 3.93% at a time when SPY gained 1.84%. A starting capital of $25,000 at inception on 1/5/2016 would have grown to $66,975 which includes $84 cash and excludes $1,183 spent on fees and slippage. |
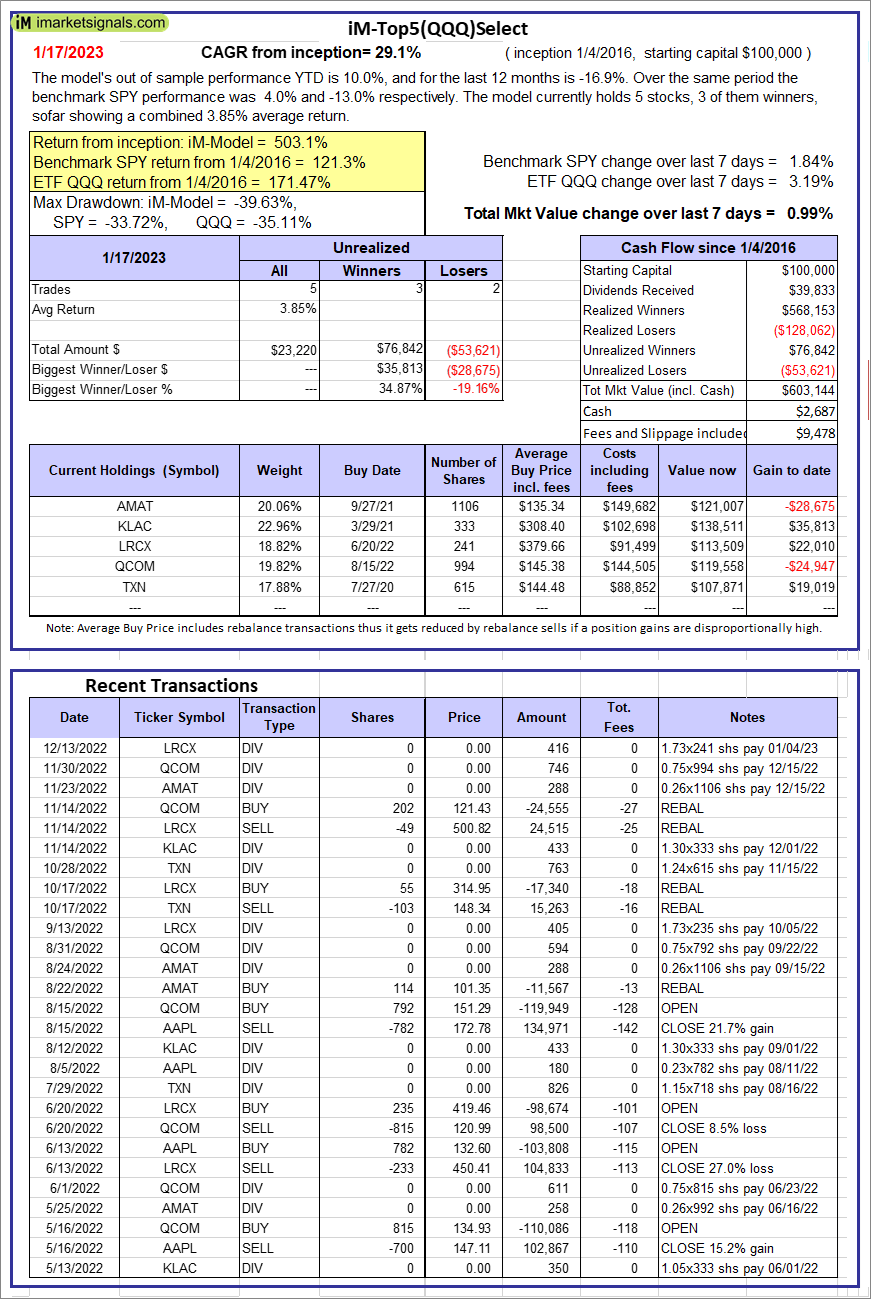  |
iM-Top5(QQQ)Select: Since inception, on 1/5/2016, the model gained 503.14% while the benchmark SPY gained 121.29% over the same period. Over the previous week the market value of iM-Top5(QQQ)Select gained 0.99% at a time when SPY gained 1.84%. A starting capital of $100,000 at inception on 1/5/2016 would have grown to $603,144 which includes $2,687 cash and excludes $9,478 spent on fees and slippage. |
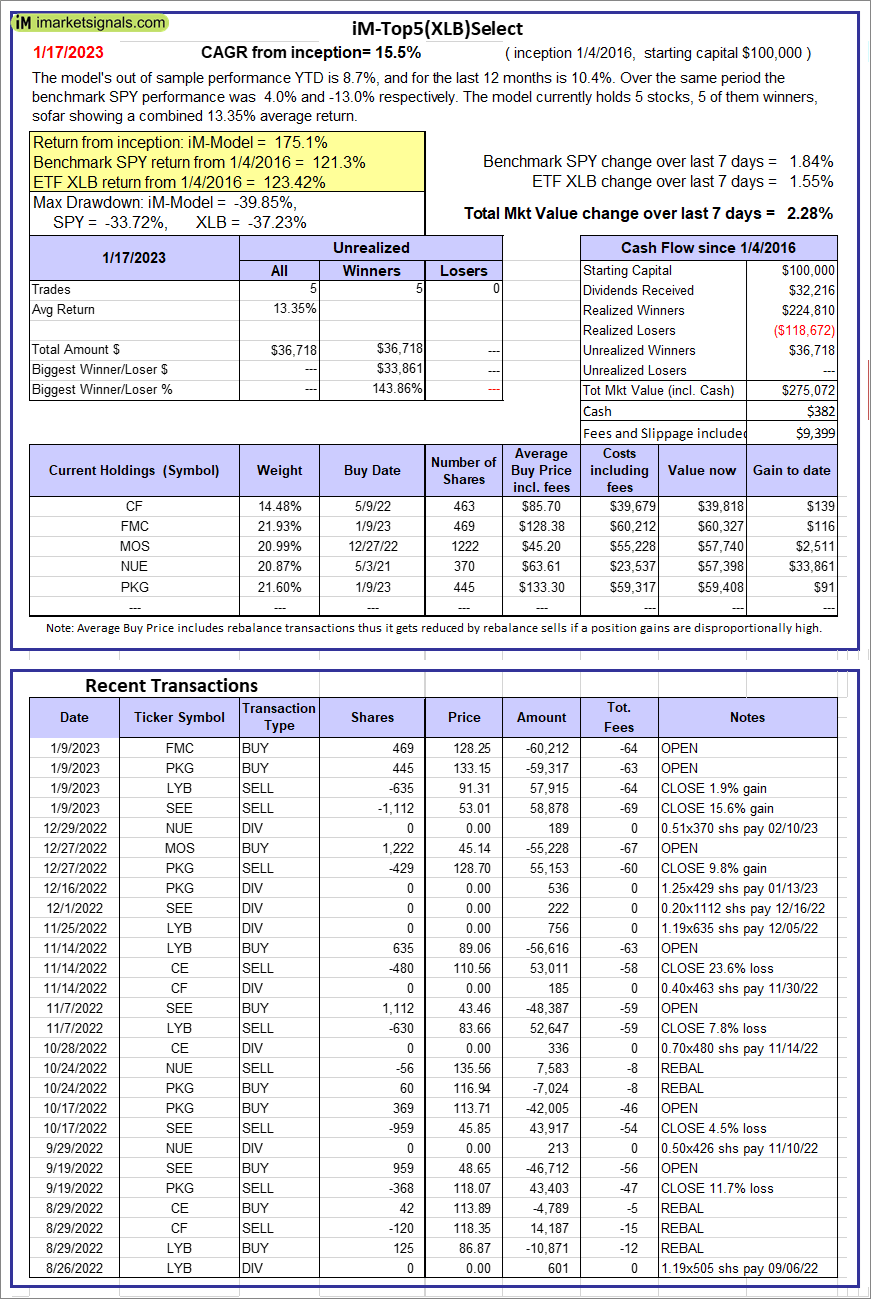 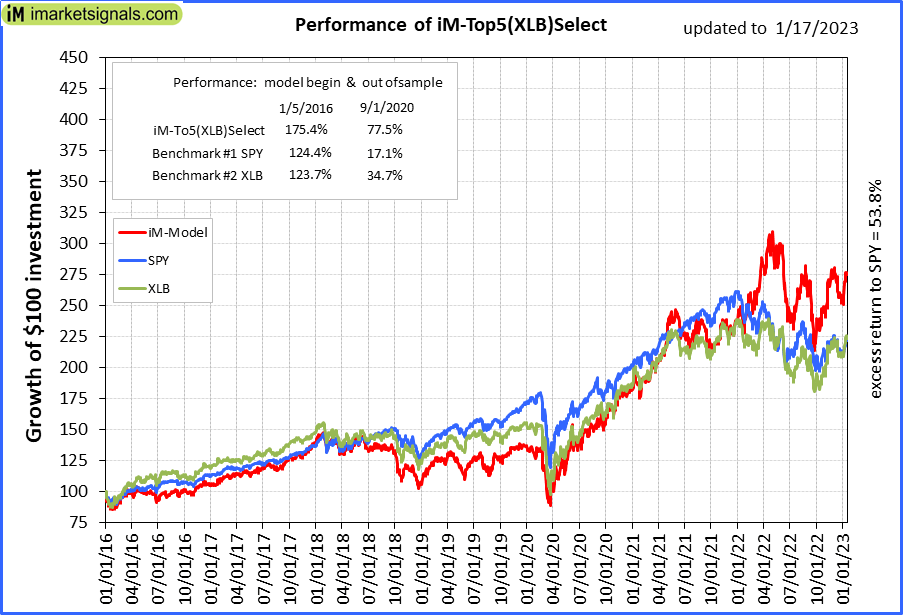 |
iM-Top5(XLB)Select: Since inception, on 1/5/2016, the model gained 175.07% while the benchmark SPY gained 121.29% over the same period. Over the previous week the market value of iM-Top5(XLB)Select gained 2.28% at a time when SPY gained 1.84%. A starting capital of $100,000 at inception on 1/5/2016 would have grown to $275,072 which includes $382 cash and excludes $9,399 spent on fees and slippage. |
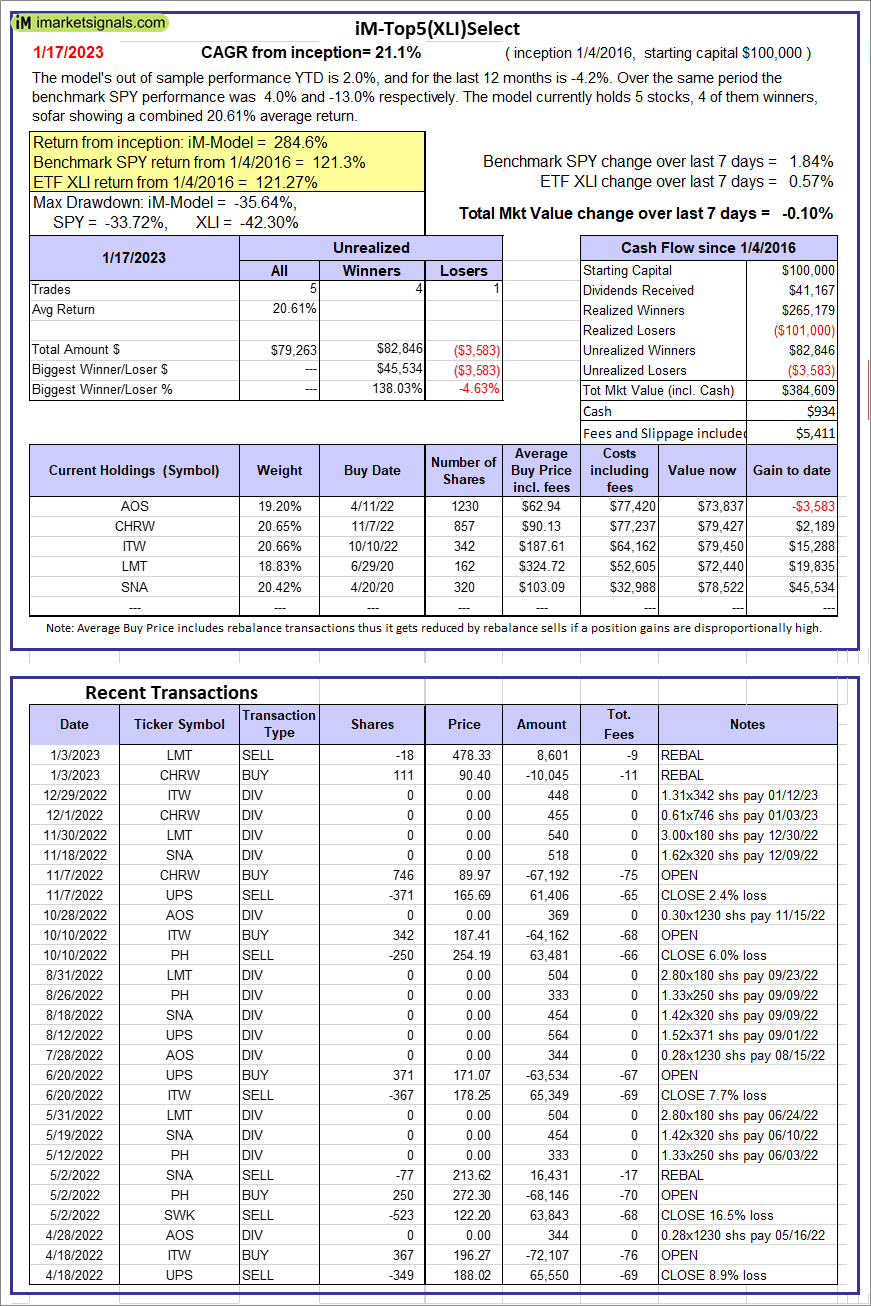 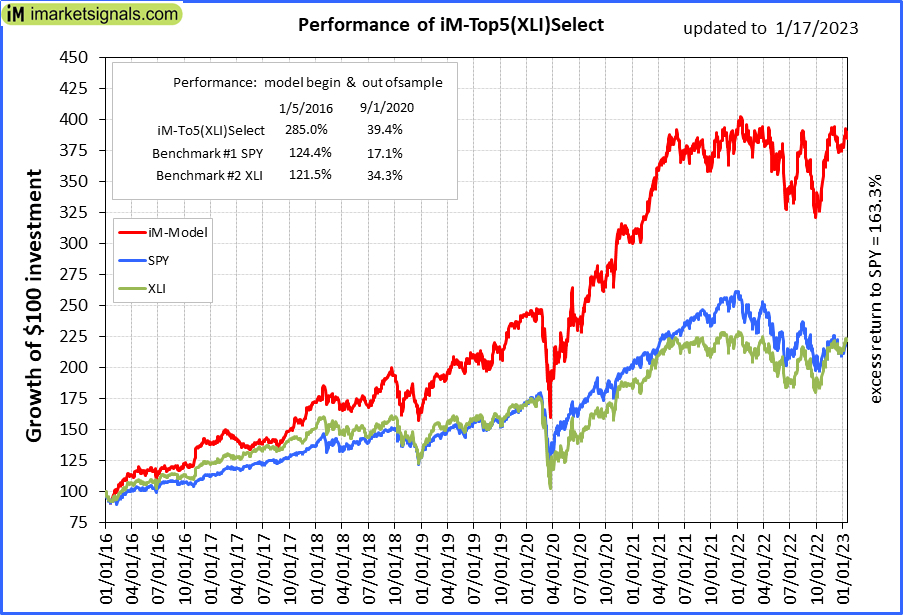 |
iM-Top5(XLI)Select: Since inception, on 1/5/2016, the model gained 284.61% while the benchmark SPY gained 121.29% over the same period. Over the previous week the market value of iM-Top5(XLI)Select gained -0.10% at a time when SPY gained 1.84%. A starting capital of $100,000 at inception on 1/5/2016 would have grown to $384,609 which includes $934 cash and excludes $5,411 spent on fees and slippage. |
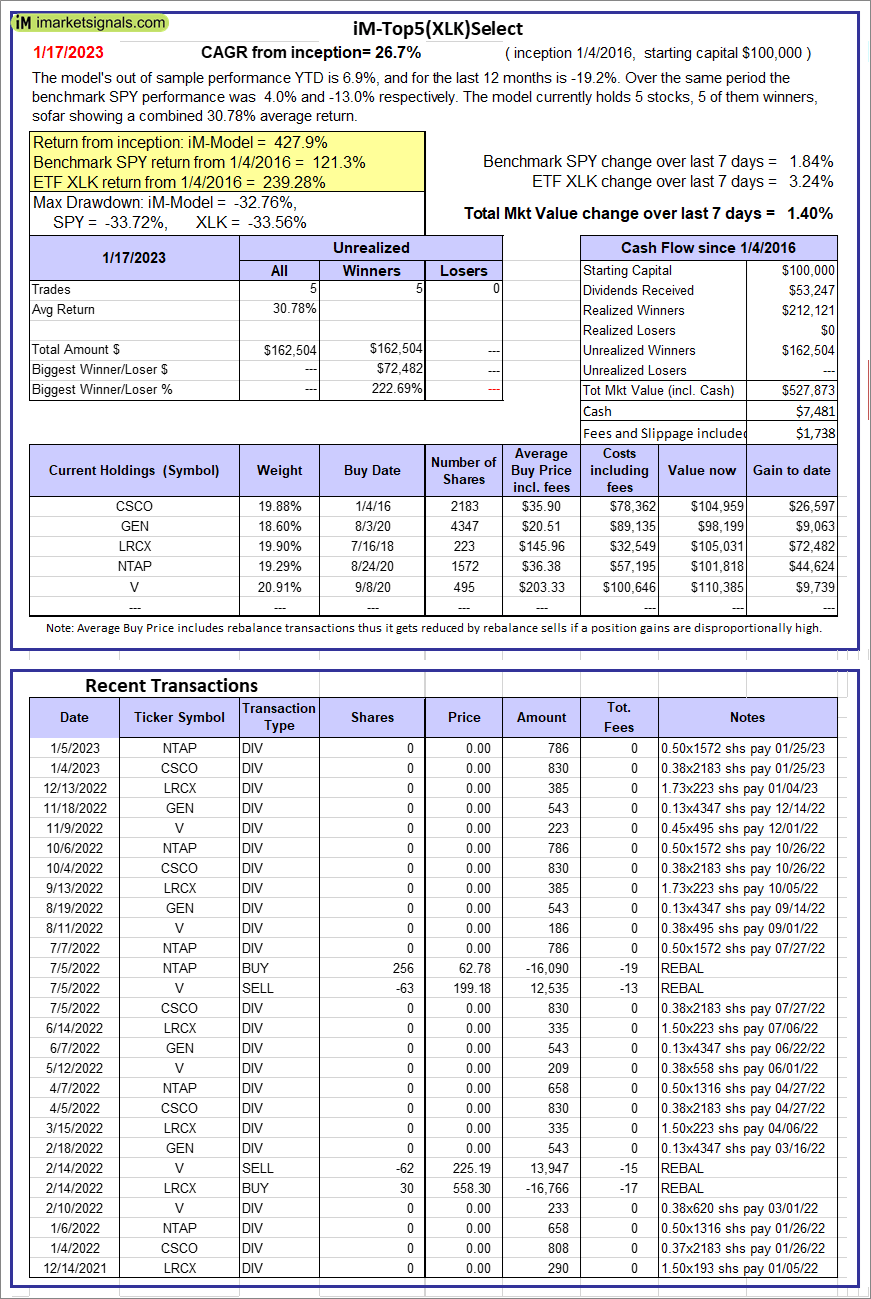 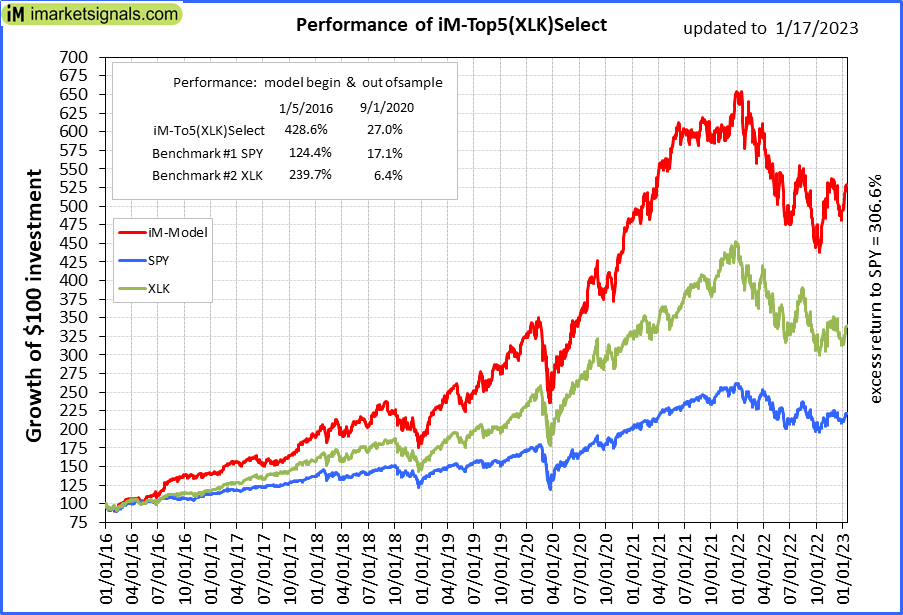 |
iM-Top5(XLK)Select: Since inception, on 1/5/2016, the model gained 427.87% while the benchmark SPY gained 121.29% over the same period. Over the previous week the market value of iM-Top5(XLK)Select gained 1.40% at a time when SPY gained 1.84%. A starting capital of $100,000 at inception on 1/5/2016 would have grown to $527,873 which includes $7,481 cash and excludes $1,738 spent on fees and slippage. |
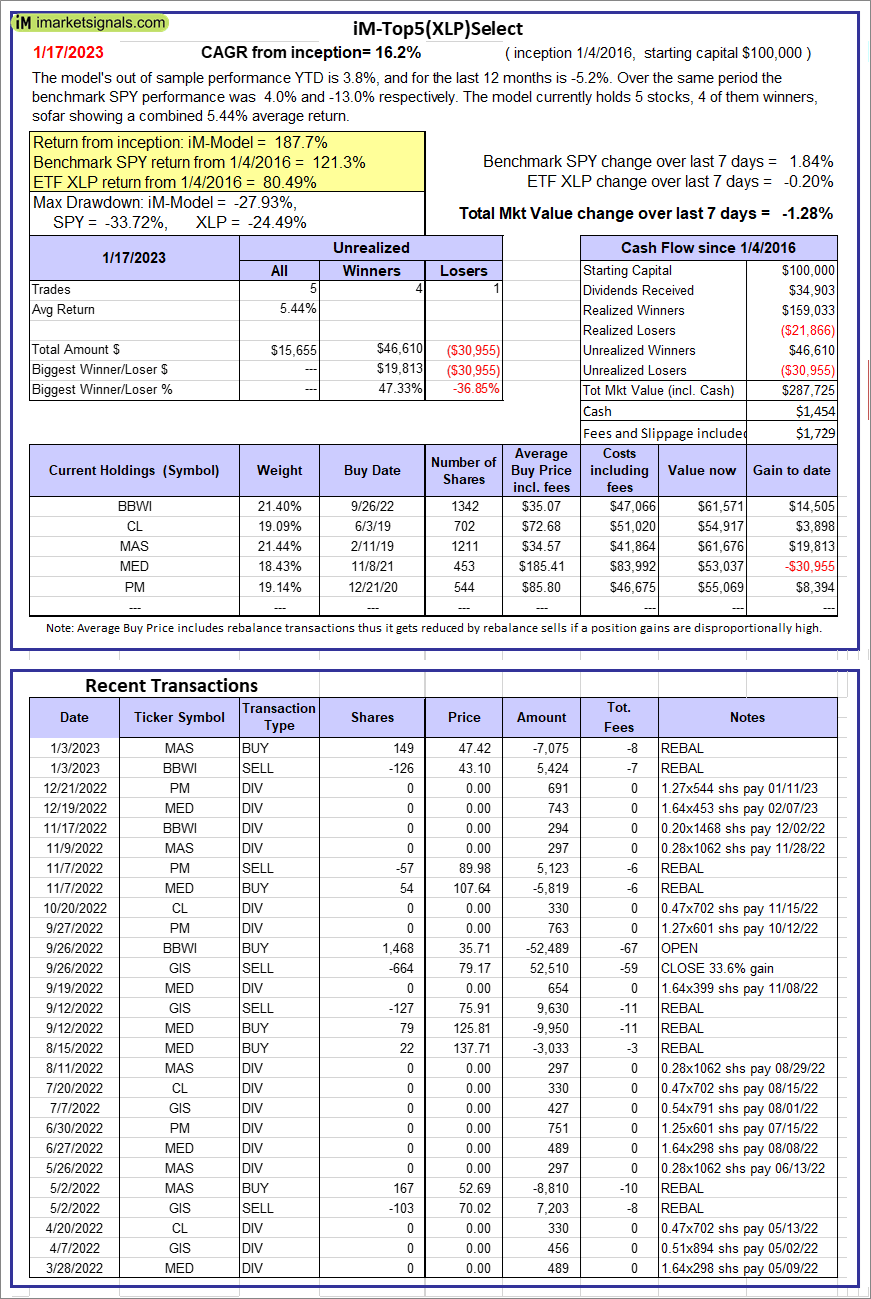 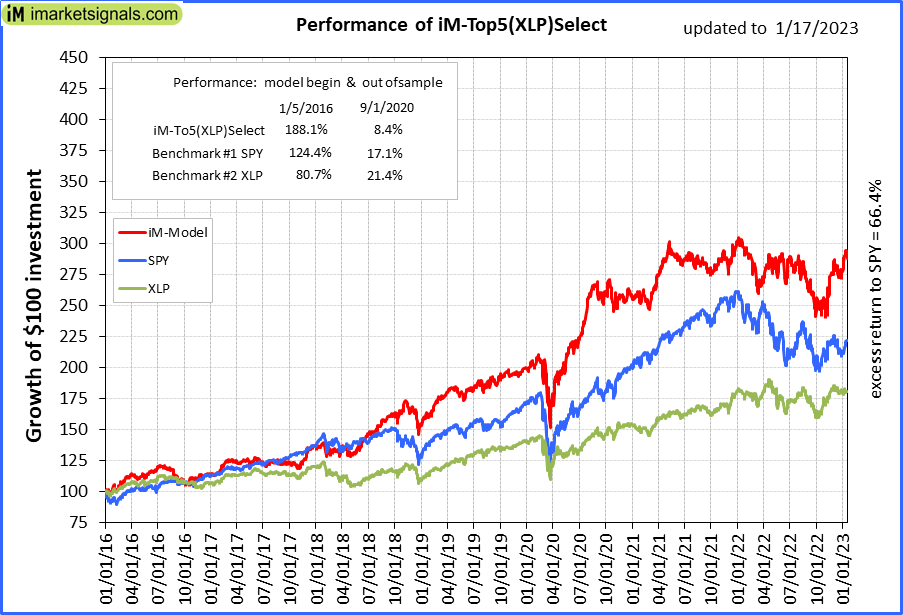 |
iM-Top5(XLP)Select: Since inception, on 1/5/2016, the model gained 187.73% while the benchmark SPY gained 121.29% over the same period. Over the previous week the market value of iM-Top5(XLP)Select gained -1.28% at a time when SPY gained 1.84%. A starting capital of $100,000 at inception on 1/5/2016 would have grown to $287,725 which includes $1,454 cash and excludes $1,729 spent on fees and slippage. |
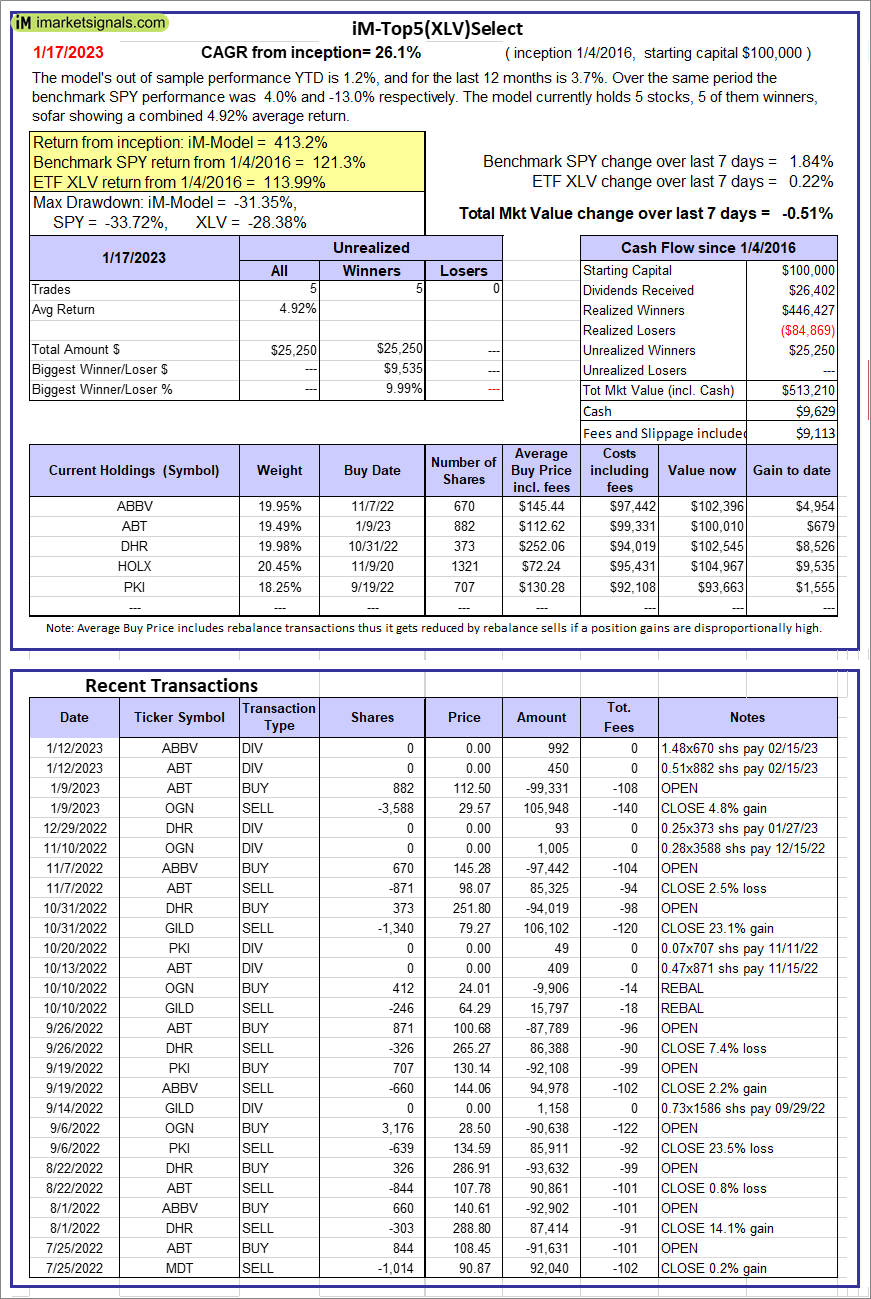 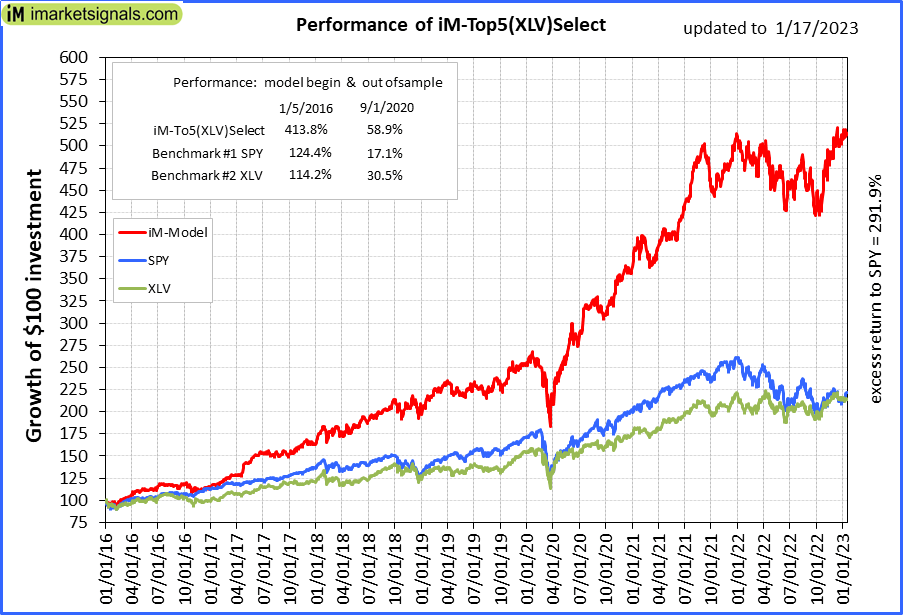 |
iM-Top5(XLV)Select: Since inception, on 1/5/2016, the model gained 413.21% while the benchmark SPY gained 121.29% over the same period. Over the previous week the market value of iM-Top5(XLV)Select gained -0.51% at a time when SPY gained 1.84%. A starting capital of $100,000 at inception on 1/5/2016 would have grown to $513,210 which includes $9,629 cash and excludes $9,113 spent on fees and slippage. |
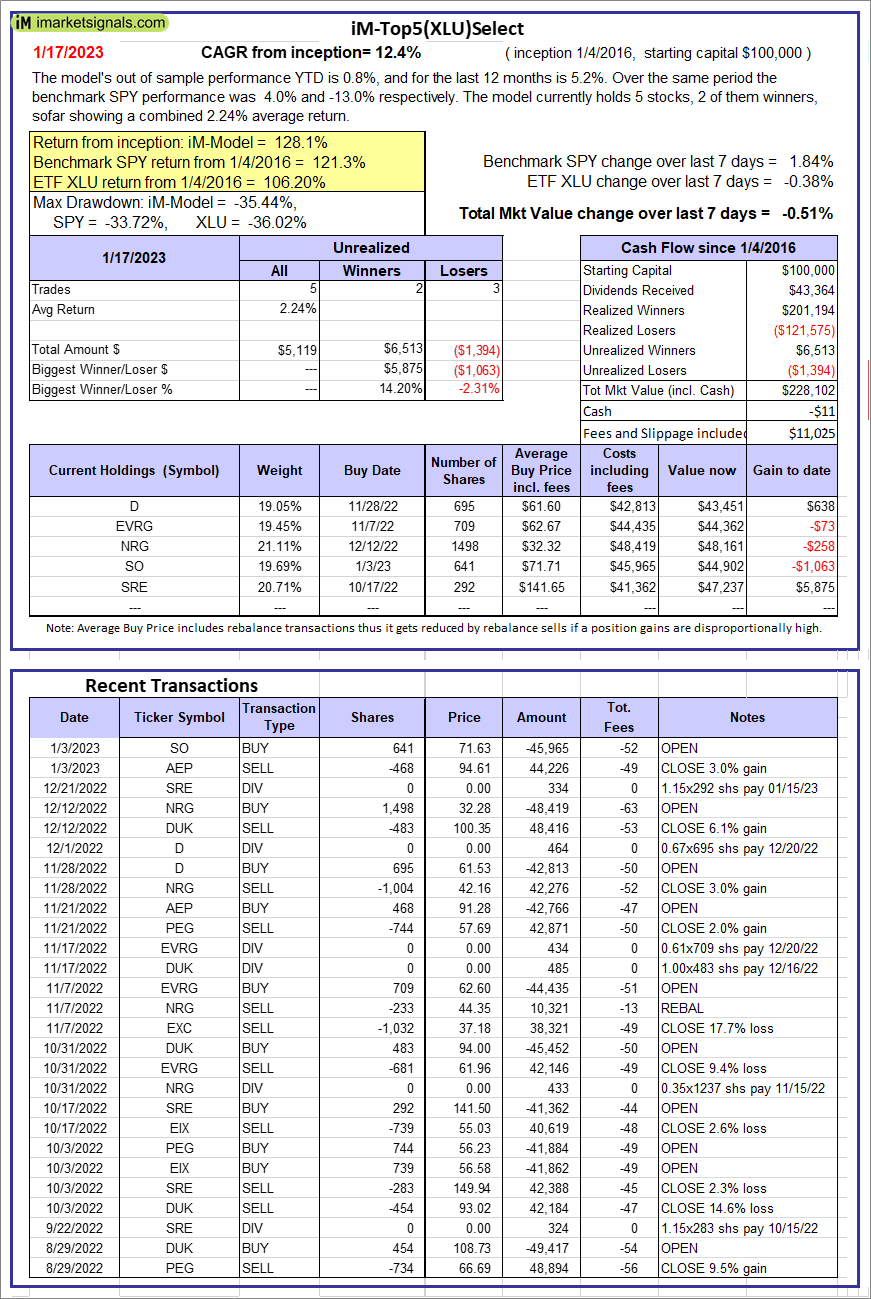  |
iM-Top5(XLU)Select: Since inception, on 1/5/2016, the model gained 128.10% while the benchmark SPY gained 121.29% over the same period. Over the previous week the market value of iM-Top5(XLU)Select gained -0.51% at a time when SPY gained 1.84%. A starting capital of $100,000 at inception on 1/5/2016 would have grown to $228,102 which includes -$11 cash and excludes $11,025 spent on fees and slippage. |
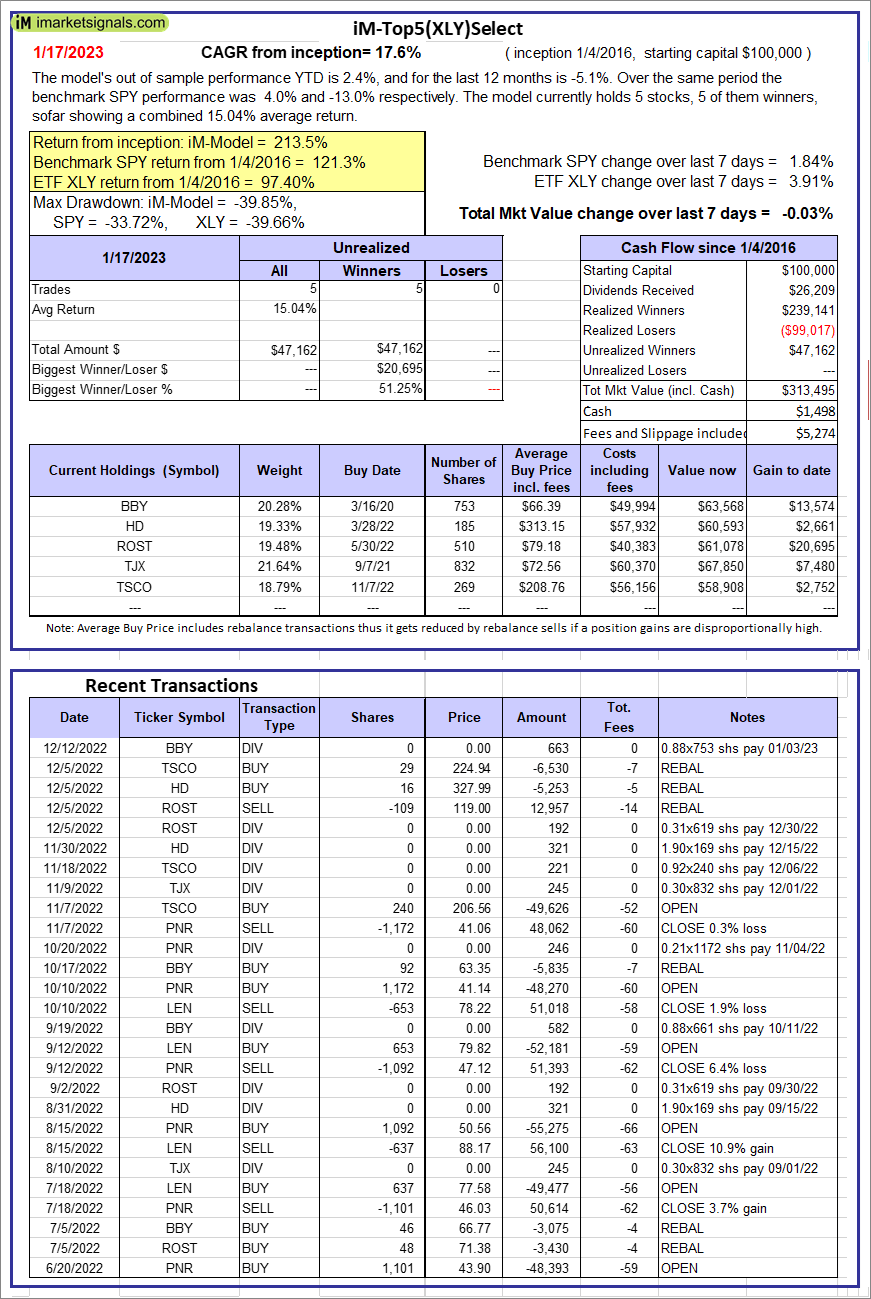 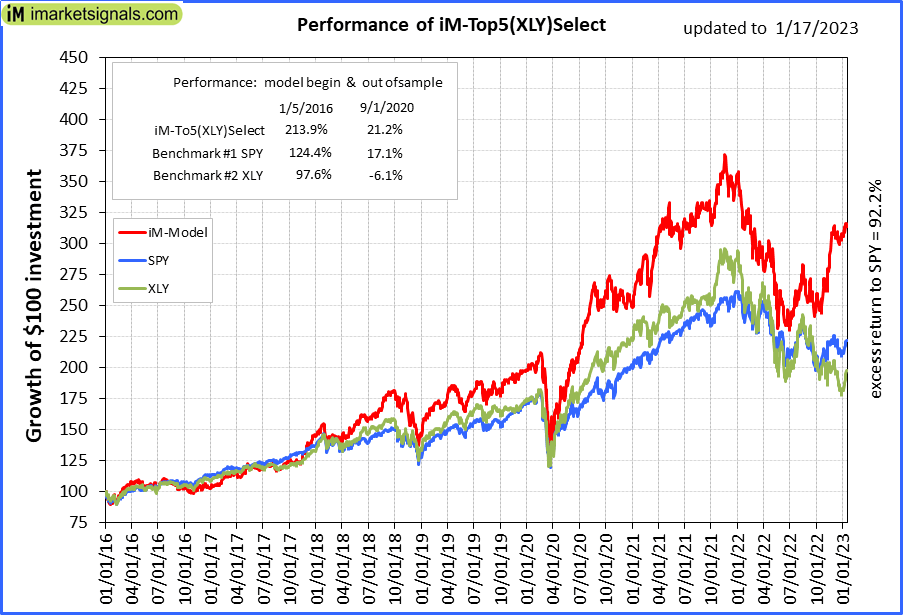 |
iM-Top5(XLY)Select: Since inception, on 1/5/2016, the model gained 213.49% while the benchmark SPY gained 121.29% over the same period. Over the previous week the market value of iM-Top5(XLY)Select gained -0.03% at a time when SPY gained 1.84%. A starting capital of $100,000 at inception on 1/5/2016 would have grown to $313,495 which includes $1,498 cash and excludes $5,274 spent on fees and slippage. |
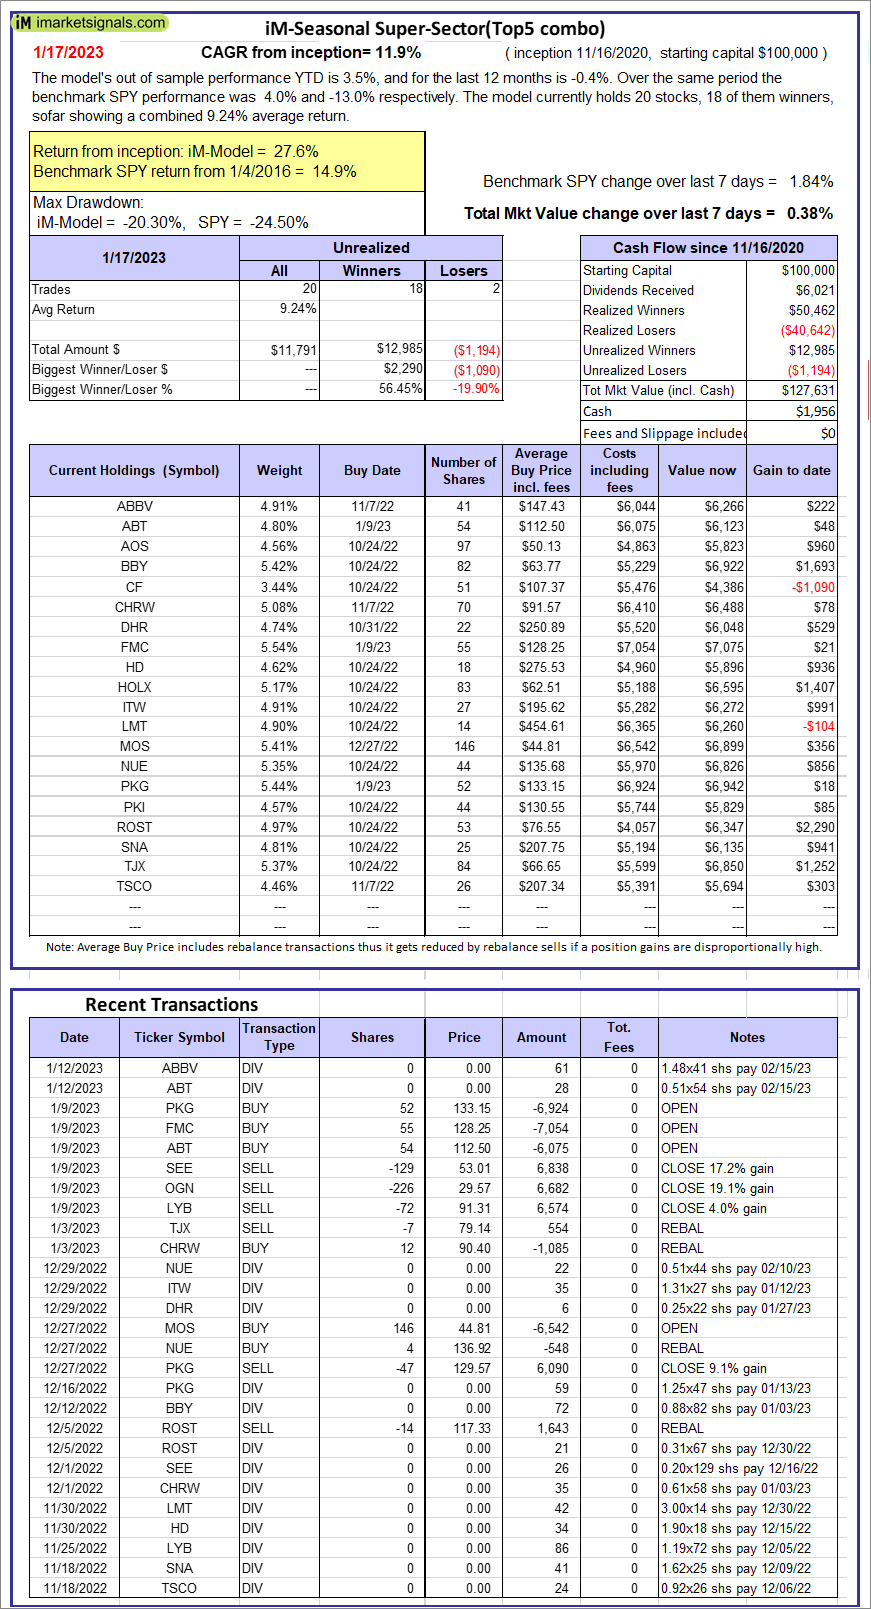 |
iM-Seasonal Super-Sectors (Top5 combo) : Since inception, on 11/17/2020, the model gained 27.63% while the benchmark SPY gained 14.87% over the same period. Over the previous week the market value of iM-Seasonal Super-Sectors (Top5 combo) gained 0.38% at a time when SPY gained 1.84%. A starting capital of $100,000 at inception on 11/17/2020 would have grown to $127,631 which includes $1,956 cash and excludes $00 spent on fees and slippage. |
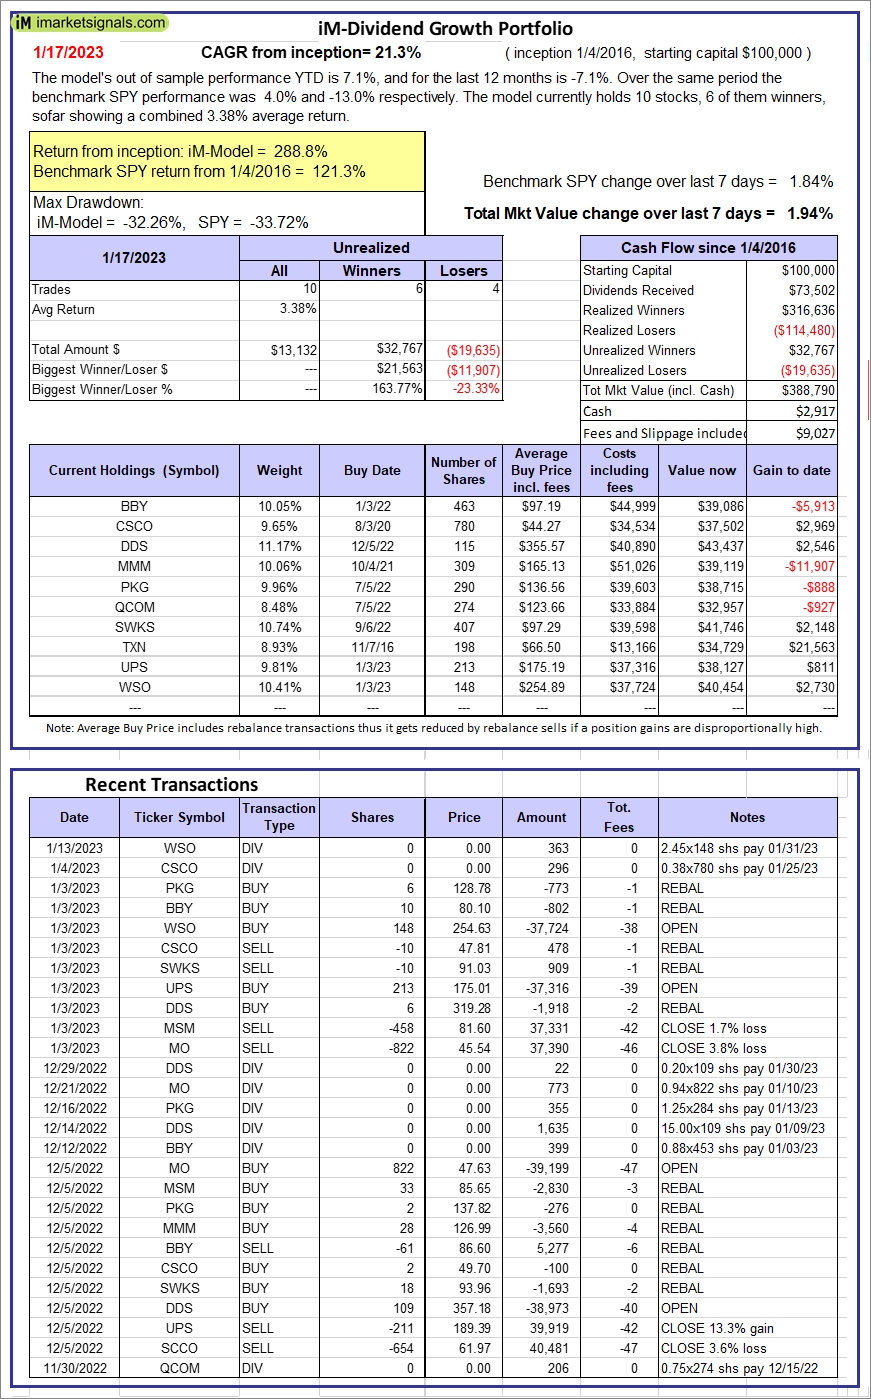 |
iM-Dividend Growth Portfolio: The model’s out of sample performance YTD is 7.1%, and for the last 12 months is -7.1%. Over the same period the benchmark SPY performance was 4.0% and -13.0% respectively. Over the previous week the market value of the iM-Dividend Growth Portfolio gained 1.94% at a time when SPY gained 1.84%. A starting capital of $100,000 at inception on 6/30/2016 would have grown to $388,790 which includes $2,917 cash and excludes $9,027 spent on fees and slippage. |
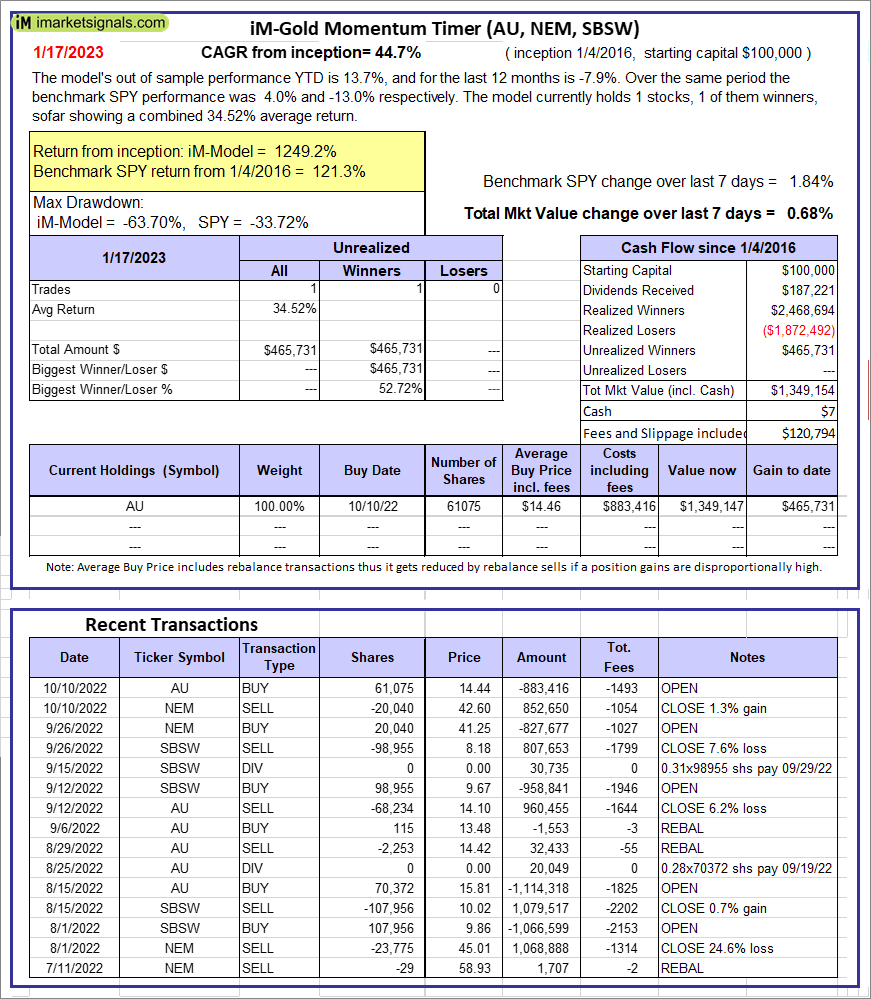 |
iM-Gold Momentum Timer (AU, NEM, SBSW): The model’s out of sample performance YTD is 13.7%, and for the last 12 months is -7.9%. Over the same period the benchmark SPY performance was 4.0% and -13.0% respectively. Over the previous week the market value of iM-Gold Momentum Timer (AU, NEM, SBSW) gained 0.68% at a time when SPY gained 1.84%. A starting capital of $100,000 at inception on 6/30/2016 would have grown to $07 which includes $120,794 cash and excludes Gain to date spent on fees and slippage. |
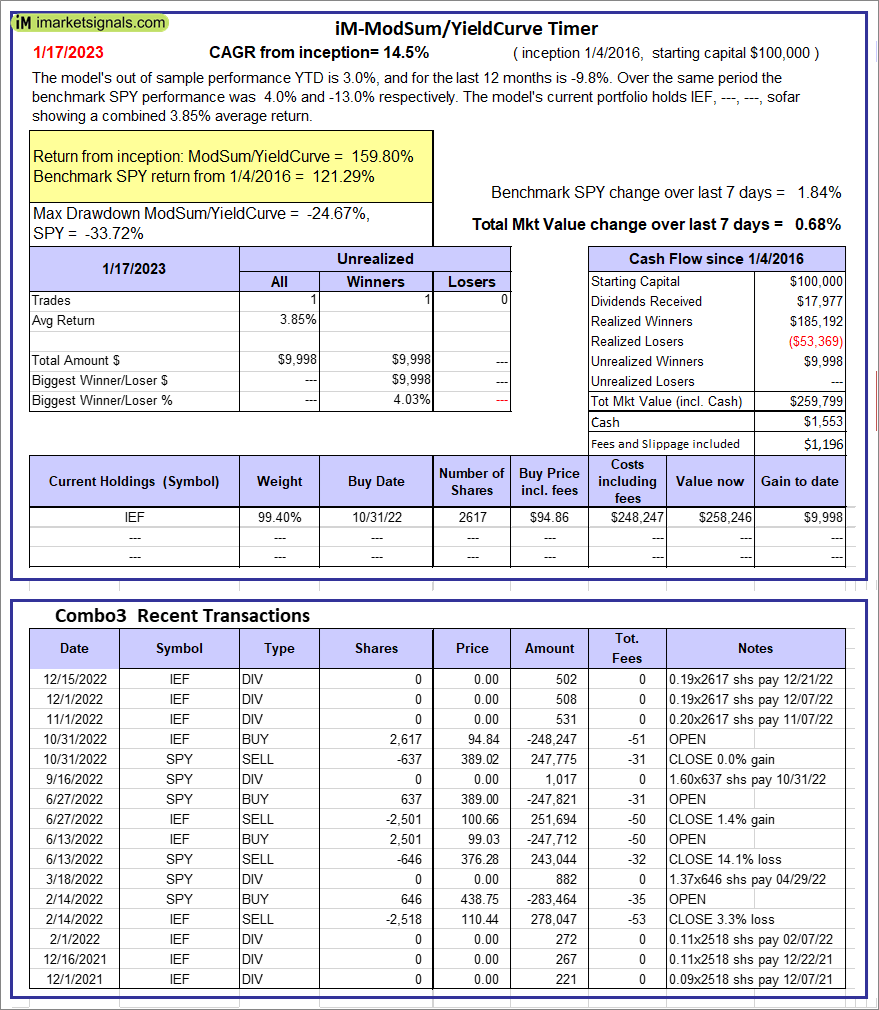 |
iM-ModSum/YieldCurve Timer: The model’s out of sample performance YTD is 3.0%, and for the last 12 months is -9.8%. Over the same period the benchmark SPY performance was 4.0% and -13.0% respectively. Over the previous week the market value of iM-PortSum/YieldCurve Timer gained 0.68% at a time when SPY gained 1.84%. A starting capital of $100,000 at inception on 1/1/2016 would have grown to $259,799 which includes $1,553 cash and excludes $1,196 spent on fees and slippage. |
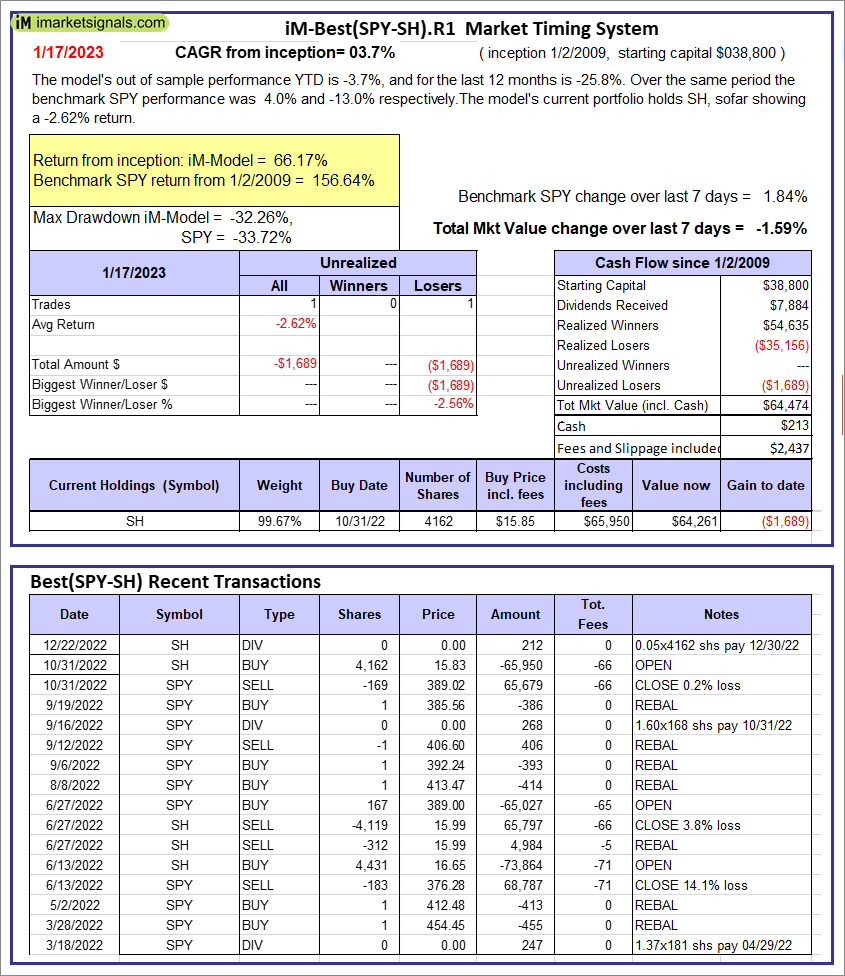 |
iM-Best(SPY-SH).R1: The model’s out of sample performance YTD is -3.7%, and for the last 12 months is -25.8%. Over the same period the benchmark SPY performance was 4.0% and -13.0% respectively. Over the previous week the market value of Best(SPY-SH) gained -1.59% at a time when SPY gained 1.84%. A starting capital of $100,000 at inception on 1/2/2009 would have grown to $64,474 which includes $213 cash and excludes $2,437 spent on fees and slippage. |
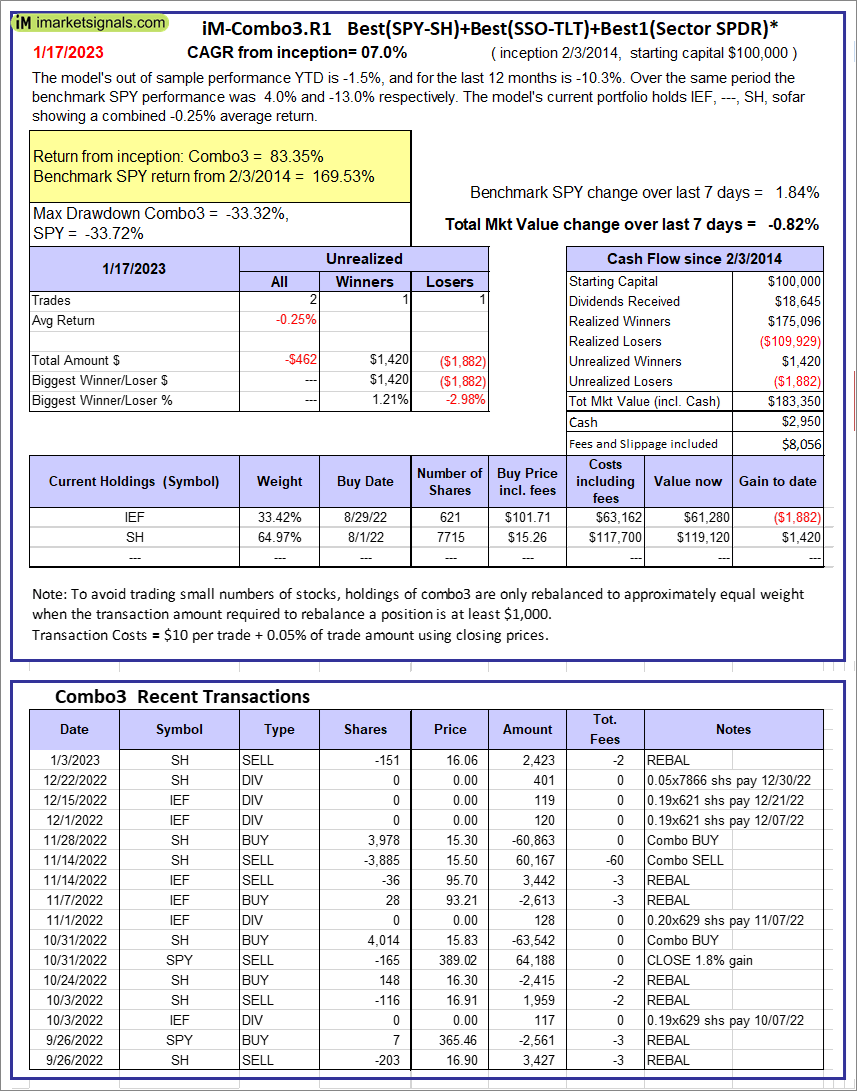 |
iM-Combo3.R1: The model’s out of sample performance YTD is -1.5%, and for the last 12 months is -10.3%. Over the same period the benchmark SPY performance was 4.0% and -13.0% respectively. Over the previous week the market value of iM-Combo3.R1 gained -0.82% at a time when SPY gained 1.84%. A starting capital of $100,000 at inception on 2/3/2014 would have grown to $183,350 which includes $2,950 cash and excludes $8,056 spent on fees and slippage. |
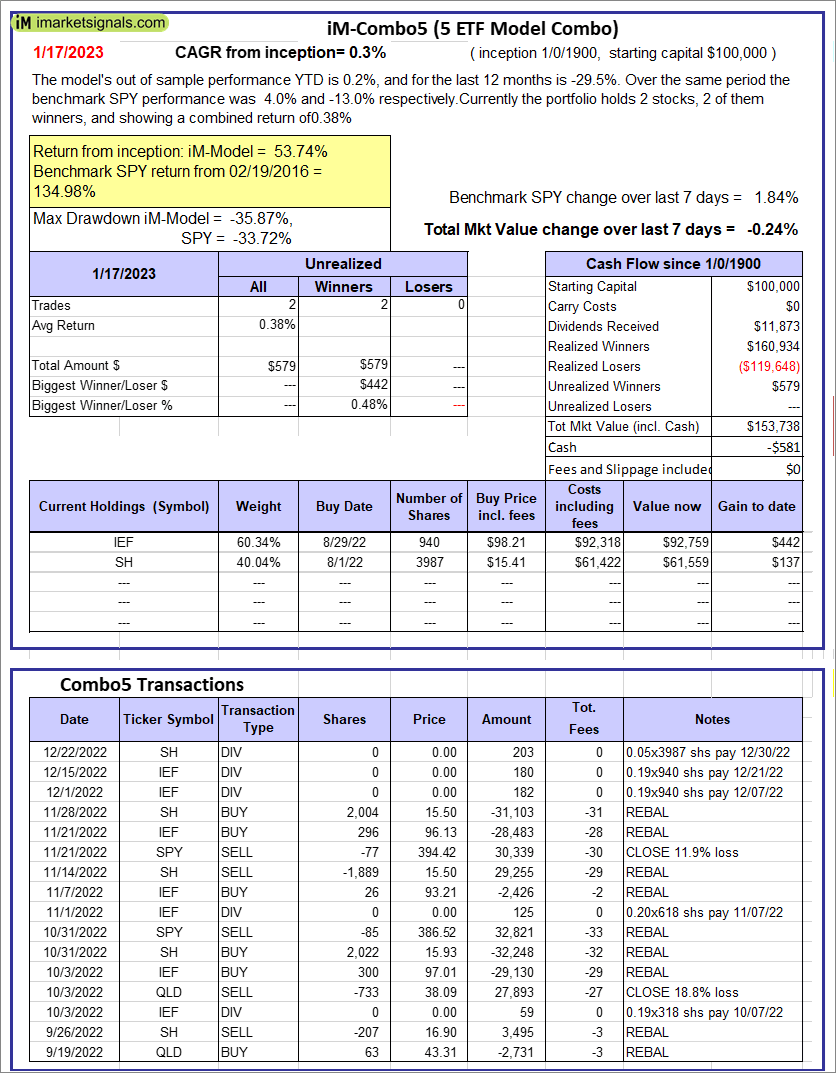 |
iM-Combo5: The model’s out of sample performance YTD is 0.2%, and for the last 12 months is -29.5%. Over the same period the benchmark SPY performance was 4.0% and -13.0% respectively. Over the previous week the market value of iM-Combo5 gained -0.24% at a time when SPY gained 1.84%. A starting capital of $100,000 at inception on 2/22/2016 would have grown to $153,738 which includes -$581 cash and excludes $0 spent on fees and slippage. |
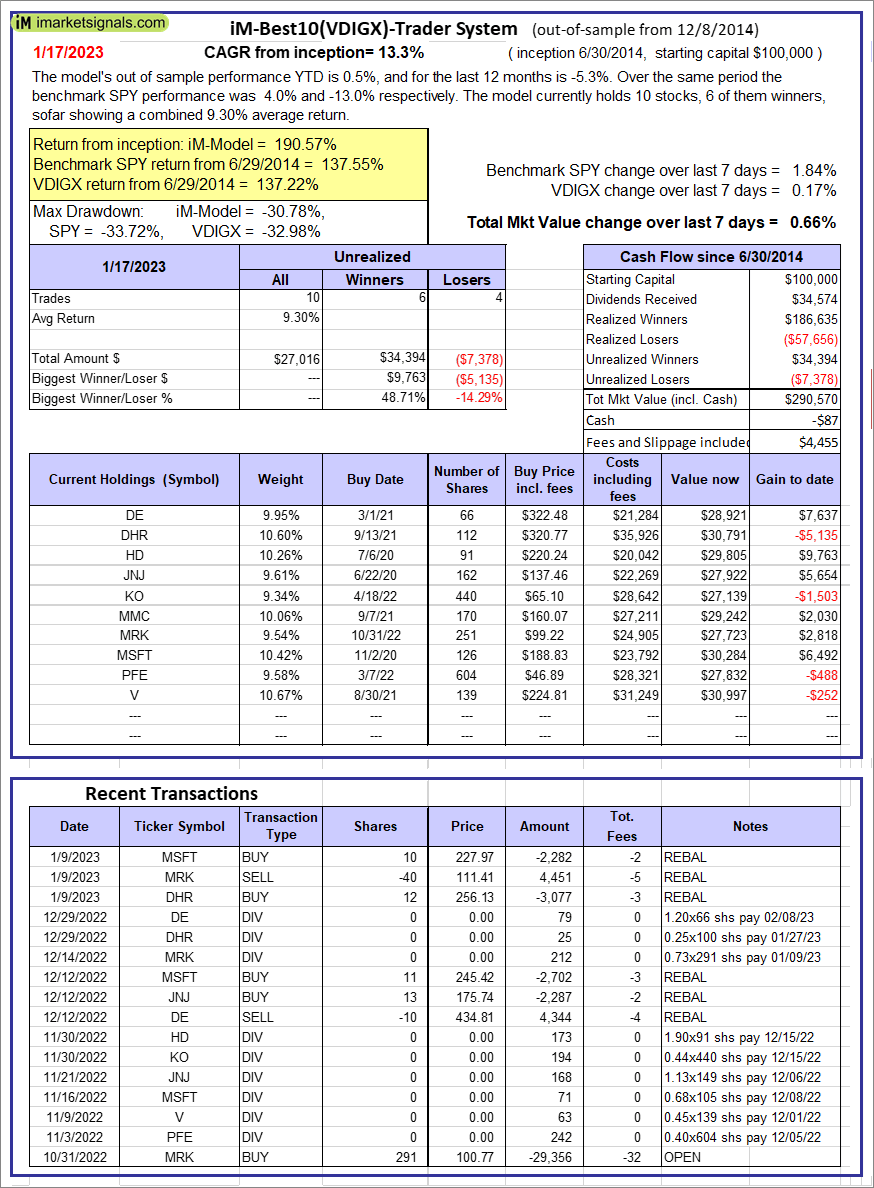  |
iM-Best10(VDIGX)-Trader: The model’s out of sample performance YTD is 0.5%, and for the last 12 months is -5.3%. Over the same period the benchmark SPY performance was 4.0% and -13.0% respectively. Since inception, on 7/1/2014, the model gained 190.57% while the benchmark SPY gained 137.55% and VDIGX gained 137.22% over the same period. Over the previous week the market value of iM-Best10(VDIGX) gained 0.66% at a time when SPY gained 1.84%. A starting capital of $100,000 at inception on 7/1/2014 would have grown to $290,570 which includes -$87 cash and excludes $4,455 spent on fees and slippage. |
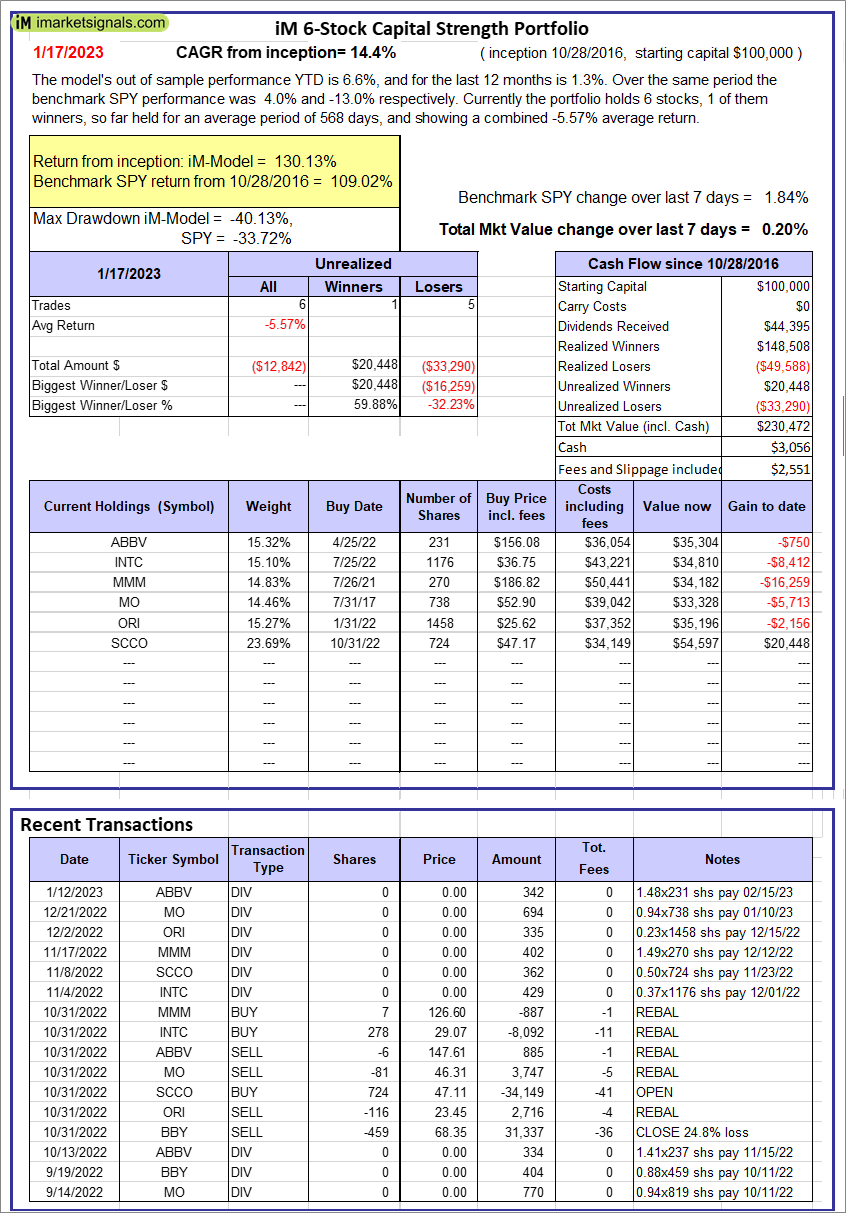 |
iM 6-Stock Capital Strength Portfolio: The model’s out of sample performance YTD is 6.6%, and for the last 12 months is 1.3%. Over the same period the benchmark SPY performance was 4.0% and -13.0% respectively. Over the previous week the market value of the iM 6-Stock Capital Strength Portfolio gained 0.20% at a time when SPY gained 1.84%. A starting capital of $100,000 at inception on 10/28/2016 would have grown to $230,472 which includes $3,056 cash and excludes $2,551 spent on fees and slippage. |
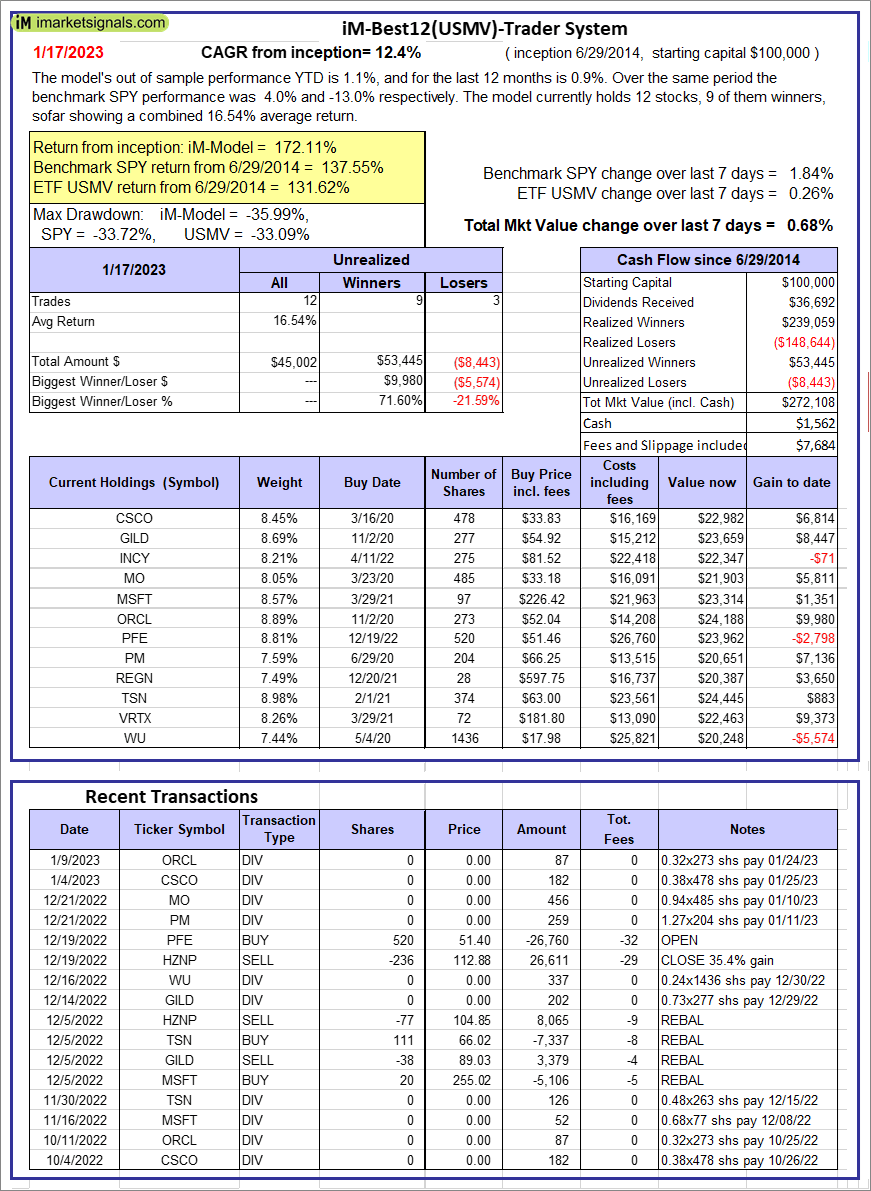 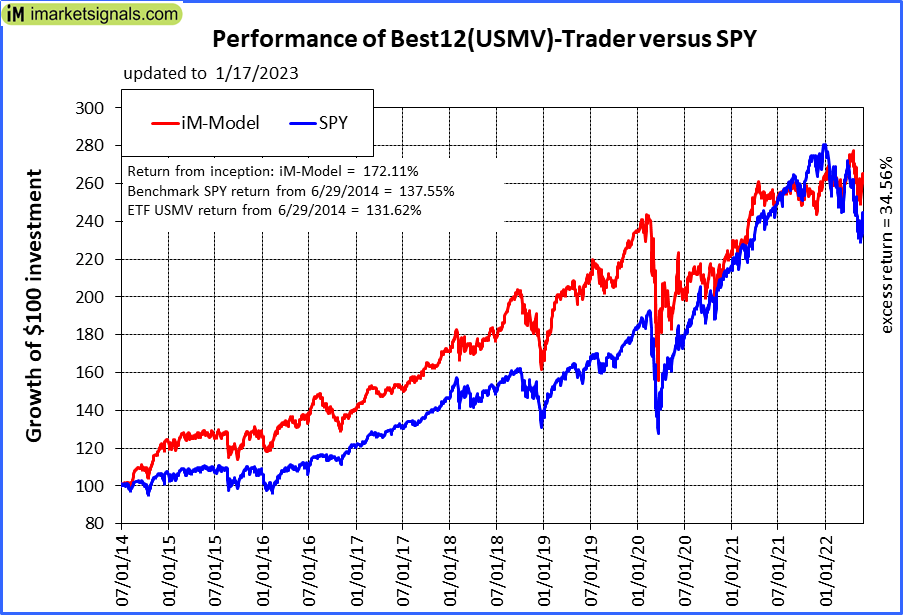 |
iM-Best12(USMV)-Trader: The model’s out of sample performance YTD is 1.1%, and for the last 12 months is 0.9%. Over the same period the benchmark SPY performance was 4.0% and -13.0% respectively. Since inception, on 6/30/2014, the model gained 172.11% while the benchmark SPY gained 137.55% and the ETF USMV gained 131.62% over the same period. Over the previous week the market value of iM-Best12(USMV)-Trader gained 0.68% at a time when SPY gained 1.84%. A starting capital of $100,000 at inception on 6/30/2014 would have grown to $272,108 which includes $1,562 cash and excludes $7,684 spent on fees and slippage. |
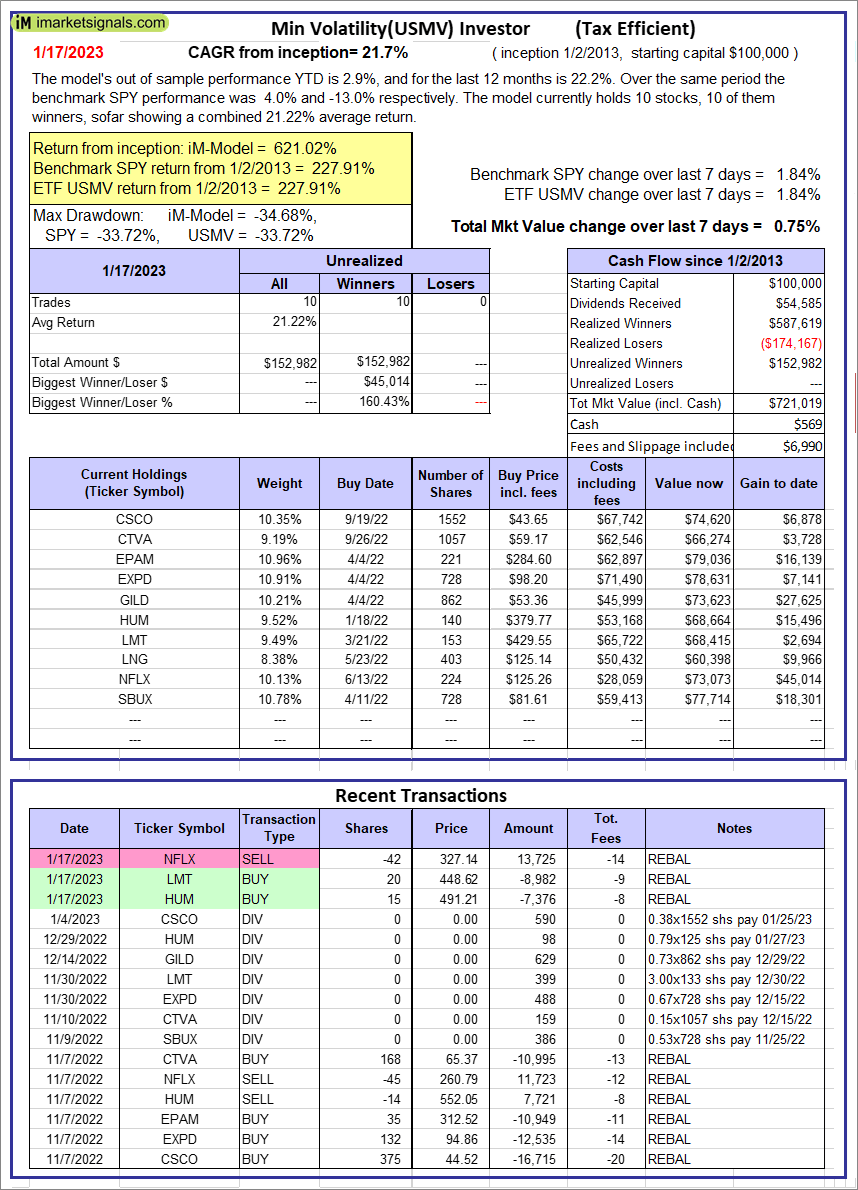  |
iM-Min Volatility(USMV) Investor (Tax Efficient): The model’s out of sample performance YTD is 2.9%, and for the last 12 months is 22.2%. Over the same period the benchmark SPY performance was 4.0% and -13.0% respectively. Since inception, on 1/3/2013, the model gained 621.02% while the benchmark SPY gained 227.91% and the ETF USMV gained 227.91% over the same period. Over the previous week the market value of iM-Best12(USMV)Q1 gained 0.75% at a time when SPY gained 1.84%. A starting capital of $100,000 at inception on 1/3/2013 would have grown to $721,019 which includes $569 cash and excludes $6,990 spent on fees and slippage. |
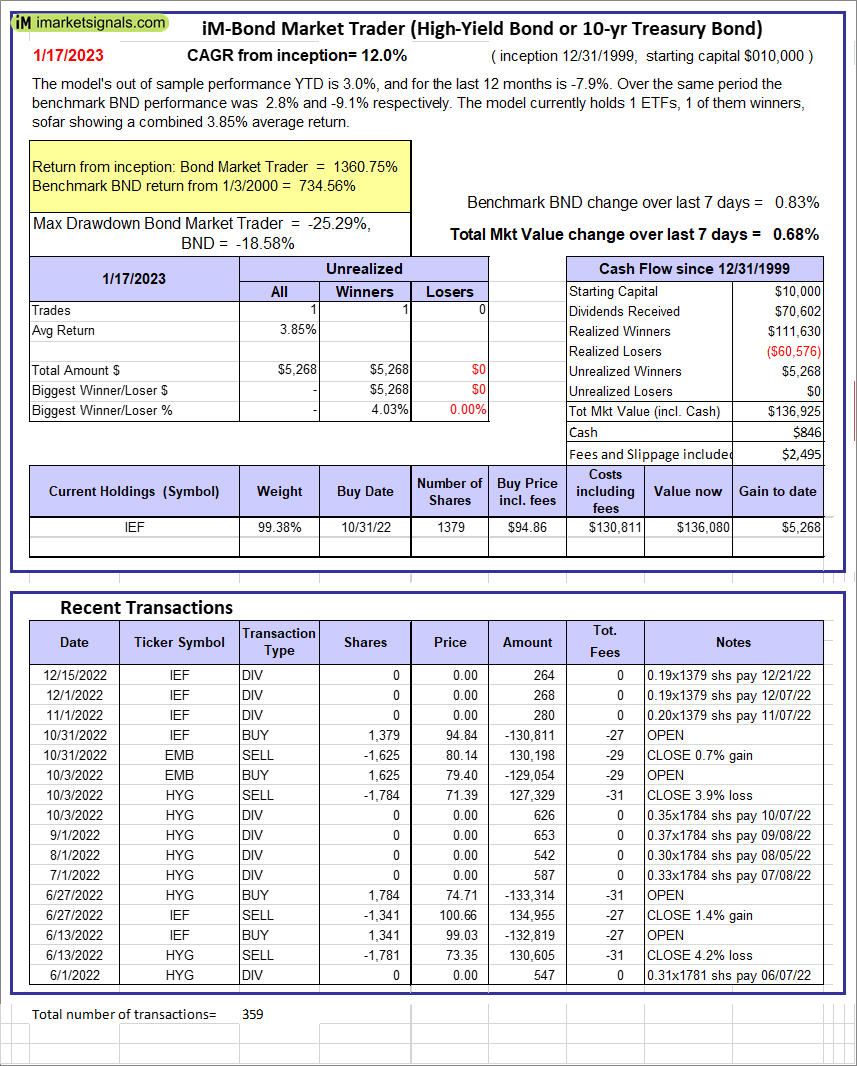 |
iM-Bond Market Trader (High-Yield Bond or 10-yr Treasury Bond): The model’s out of sample performance YTD is 3.0%, and for the last 12 months is -7.9%. Over the same period the benchmark BND performance was 2.8% and -9.1% respectively. Over the previous week the market value of the iM-Bond Market Trader (High-Yield Bond or 10-yr Treasury Bond) gained 0.68% at a time when BND gained 0.83%. A starting capital of $10,000 at inception on 1/3/2000 would have grown to $136,925 which includes $846 cash and excludes $2,495 spent on fees and slippage. |
|
|
iM-ModSum/YieldCurve Timer: The model’s out of sample performance YTD is 3.0%, and for the last 12 months is -9.8%. Over the same period the benchmark SPY performance was 4.0% and -13.0% respectively. Over the previous week the market value of iM-PortSum/YieldCurve Timer gained 0.68% at a time when SPY gained 1.84%. A starting capital of $100,000 at inception on 1/1/2016 would have grown to $259,799 which includes $1,553 cash and excludes $1,196 spent on fees and slippage. |
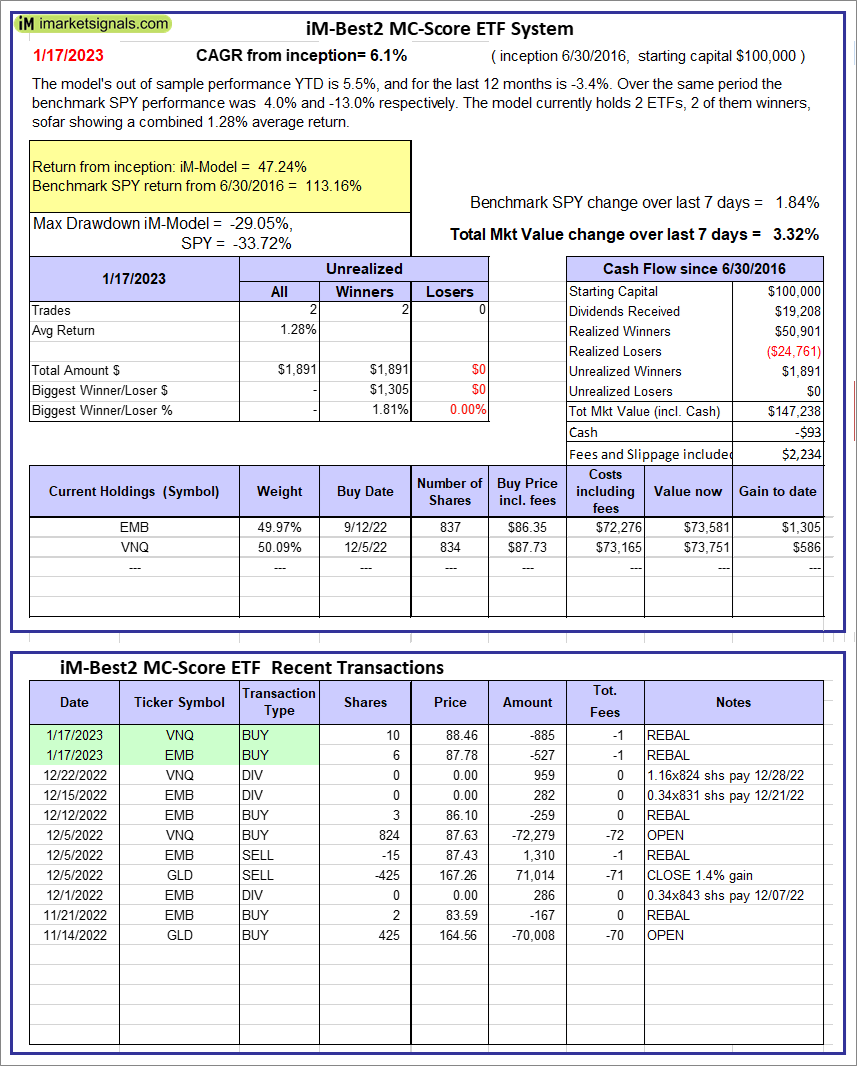 |
iM-Best2 MC-Score ETF System: The model’s out of sample performance YTD is 5.5%, and for the last 12 months is -3.4%. Over the same period the benchmark SPY performance was 4.0% and -13.0% respectively. Over the previous week the market value of the iM-Best2 MC-Score ETF System gained 3.32% at a time when SPY gained 1.84%. A starting capital of $100,000 at inception on 6/30/2016 would have grown to $147,238 which includes -$93 cash and excludes $2,234 spent on fees and slippage. |
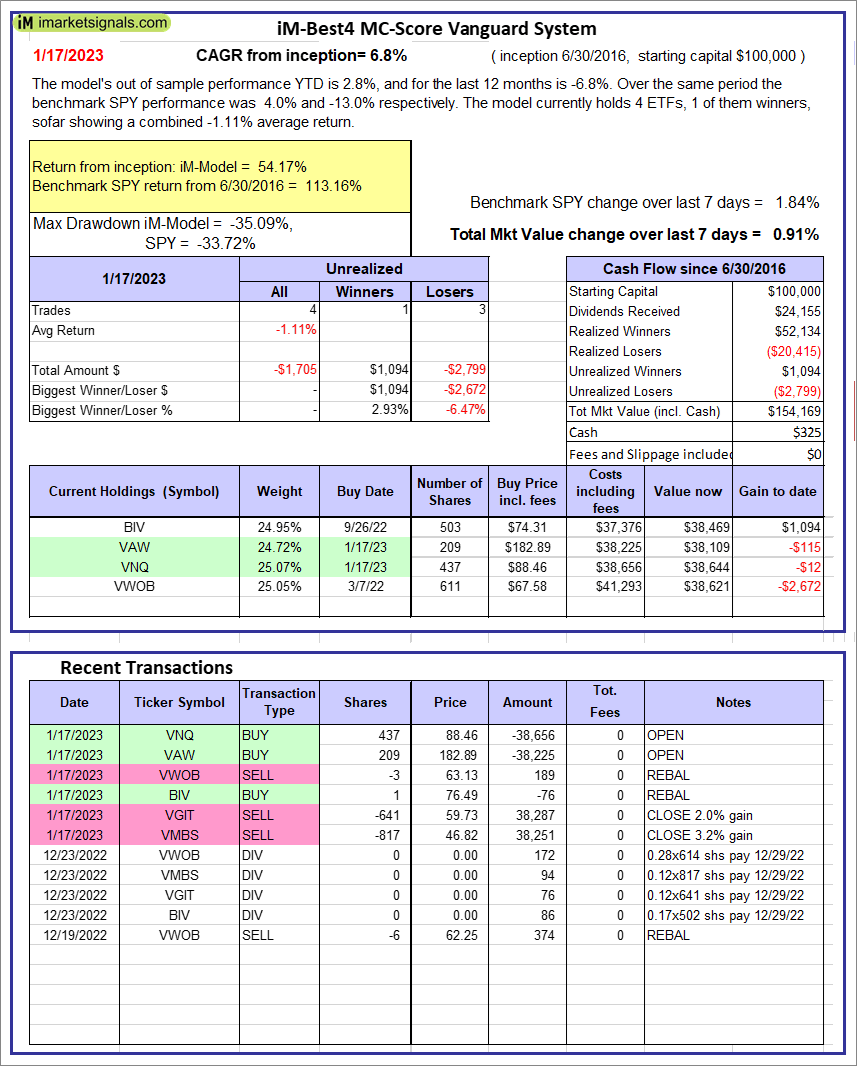 |
iM-Best4 MC-Score Vanguard System: The model’s out of sample performance YTD is 2.8%, and for the last 12 months is -6.8%. Over the same period the benchmark SPY performance was 4.0% and -13.0% respectively. Over the previous week the market value of the iM-Best4 MC-Score Vanguard System gained 0.91% at a time when SPY gained 1.84%. A starting capital of $100,000 at inception on 6/30/2016 would have grown to $154,169 which includes $325 cash and excludes $00 spent on fees and slippage. |
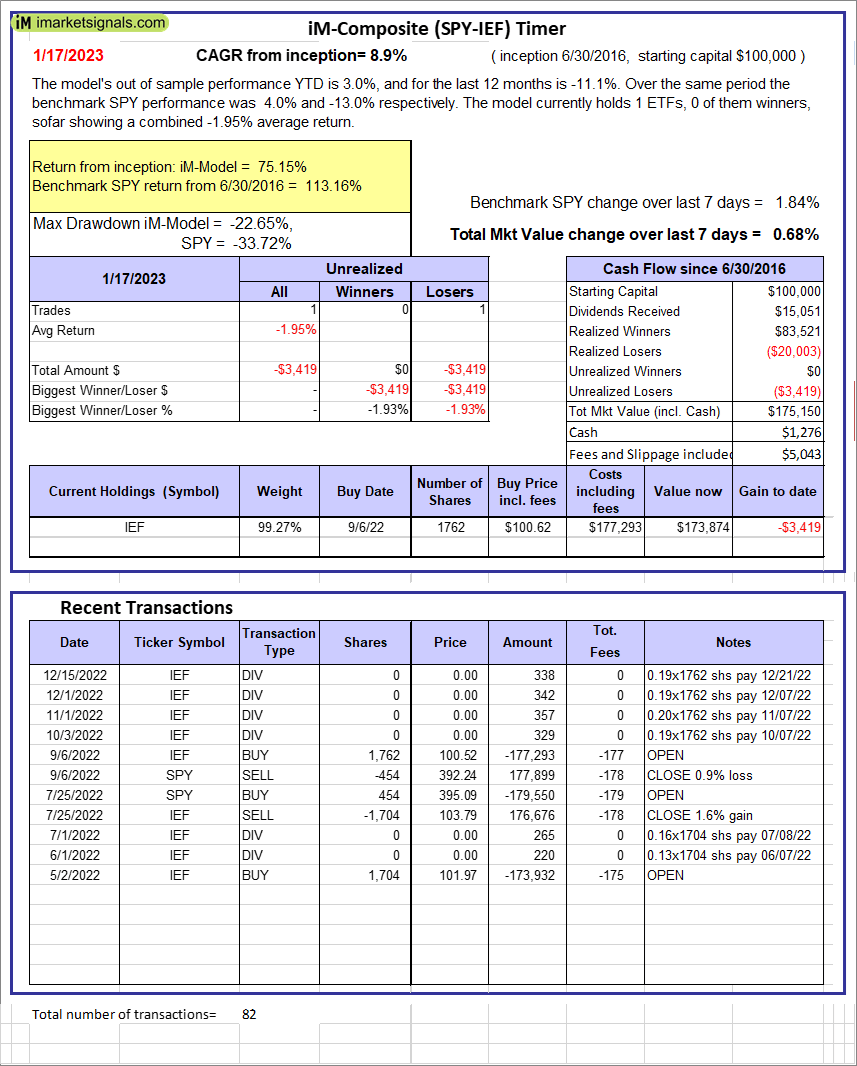 |
iM-Composite (SPY-IEF) Timer: The model’s out of sample performance YTD is 3.0%, and for the last 12 months is -11.1%. Over the same period the benchmark SPY performance was 4.0% and -13.0% respectively. Over the previous week the market value of the iM-Composite (SPY-IEF) Timer gained 0.68% at a time when SPY gained 1.84%. A starting capital of $100,000 at inception on 6/30/2016 would have grown to $175,150 which includes $1,276 cash and excludes $5,043 spent on fees and slippage. |
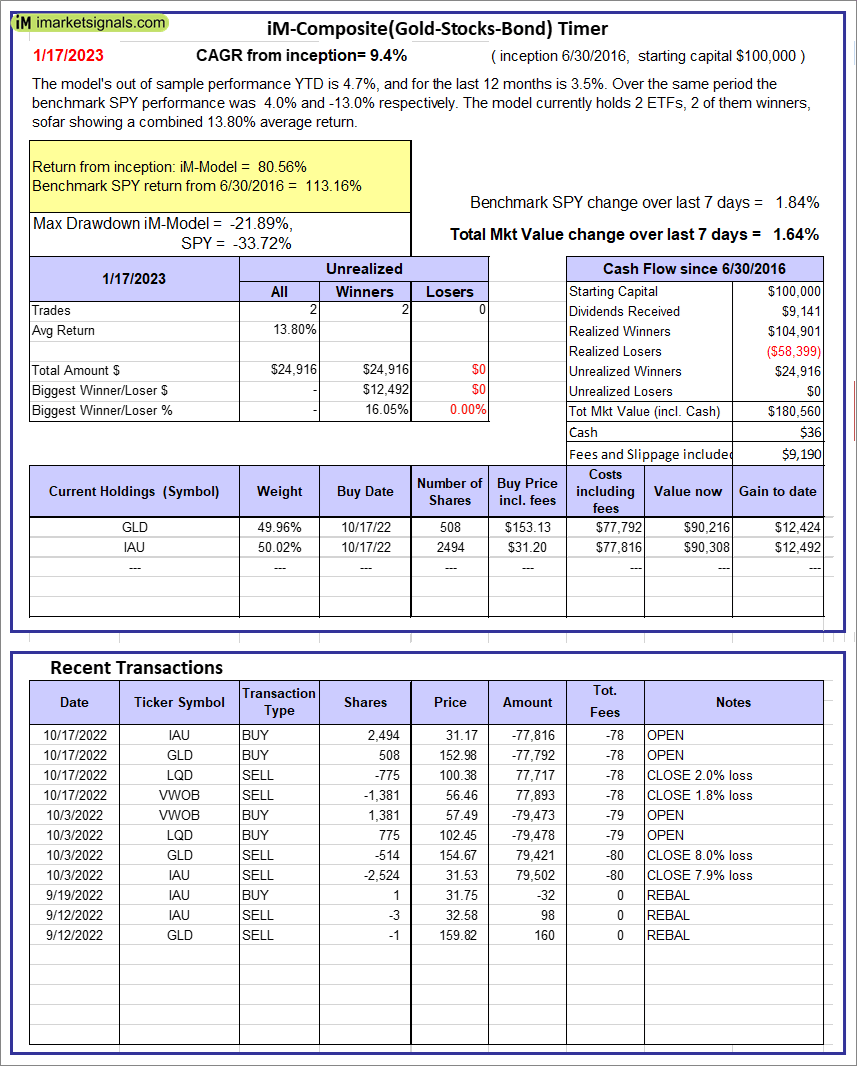 |
iM-Composite(Gold-Stocks-Bond) Timer: The model’s out of sample performance YTD is 4.7%, and for the last 12 months is 3.5%. Over the same period the benchmark SPY performance was 4.0% and -13.0% respectively. Over the previous week the market value of the iM-Composite(Gold-Stocks-Bond) Timer gained 1.64% at a time when SPY gained 1.84%. A starting capital of $100,000 at inception on 6/30/2016 would have grown to $180,560 which includes $36 cash and excludes $9,190 spent on fees and slippage. |
iM-Best Reports – 1/17/2023
Posted in pmp SPY-SH
Leave a Reply
You must be logged in to post a comment.