
  |
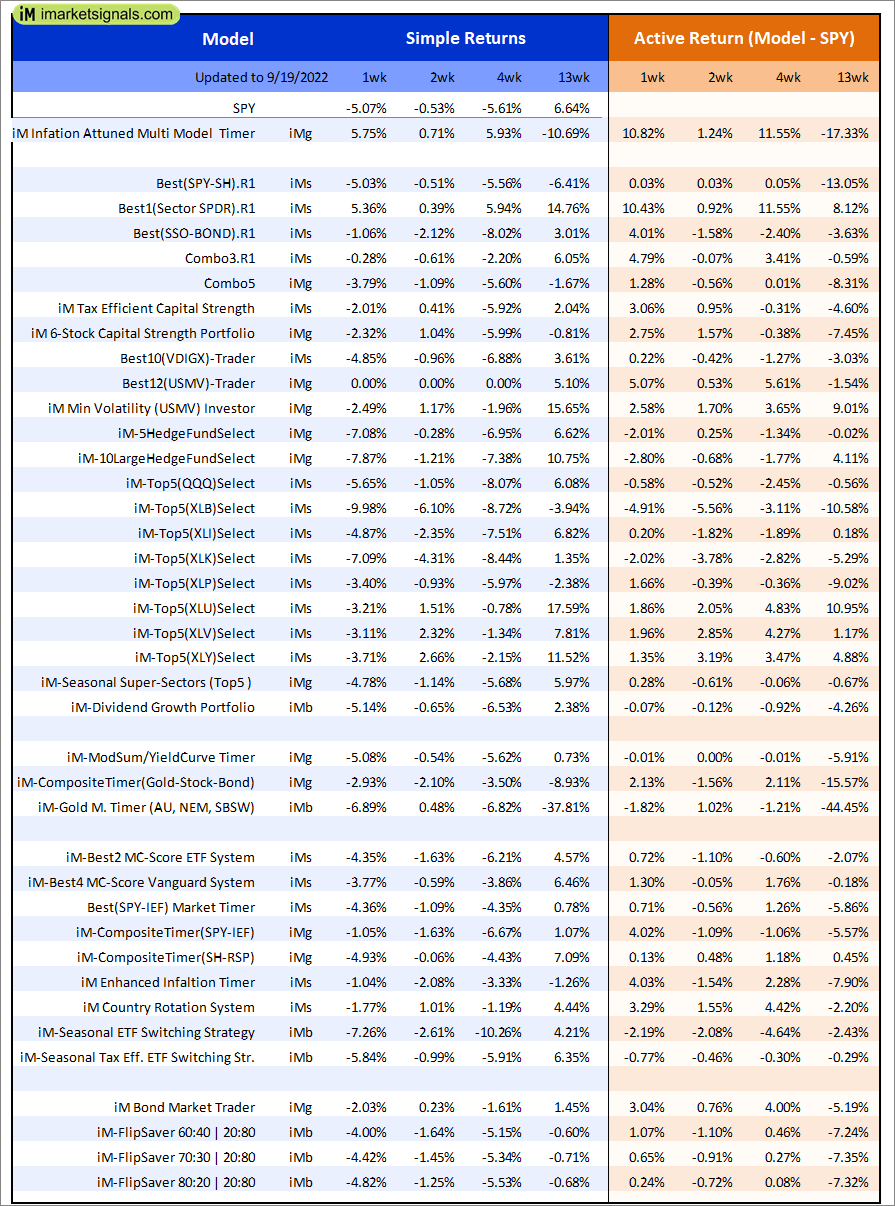
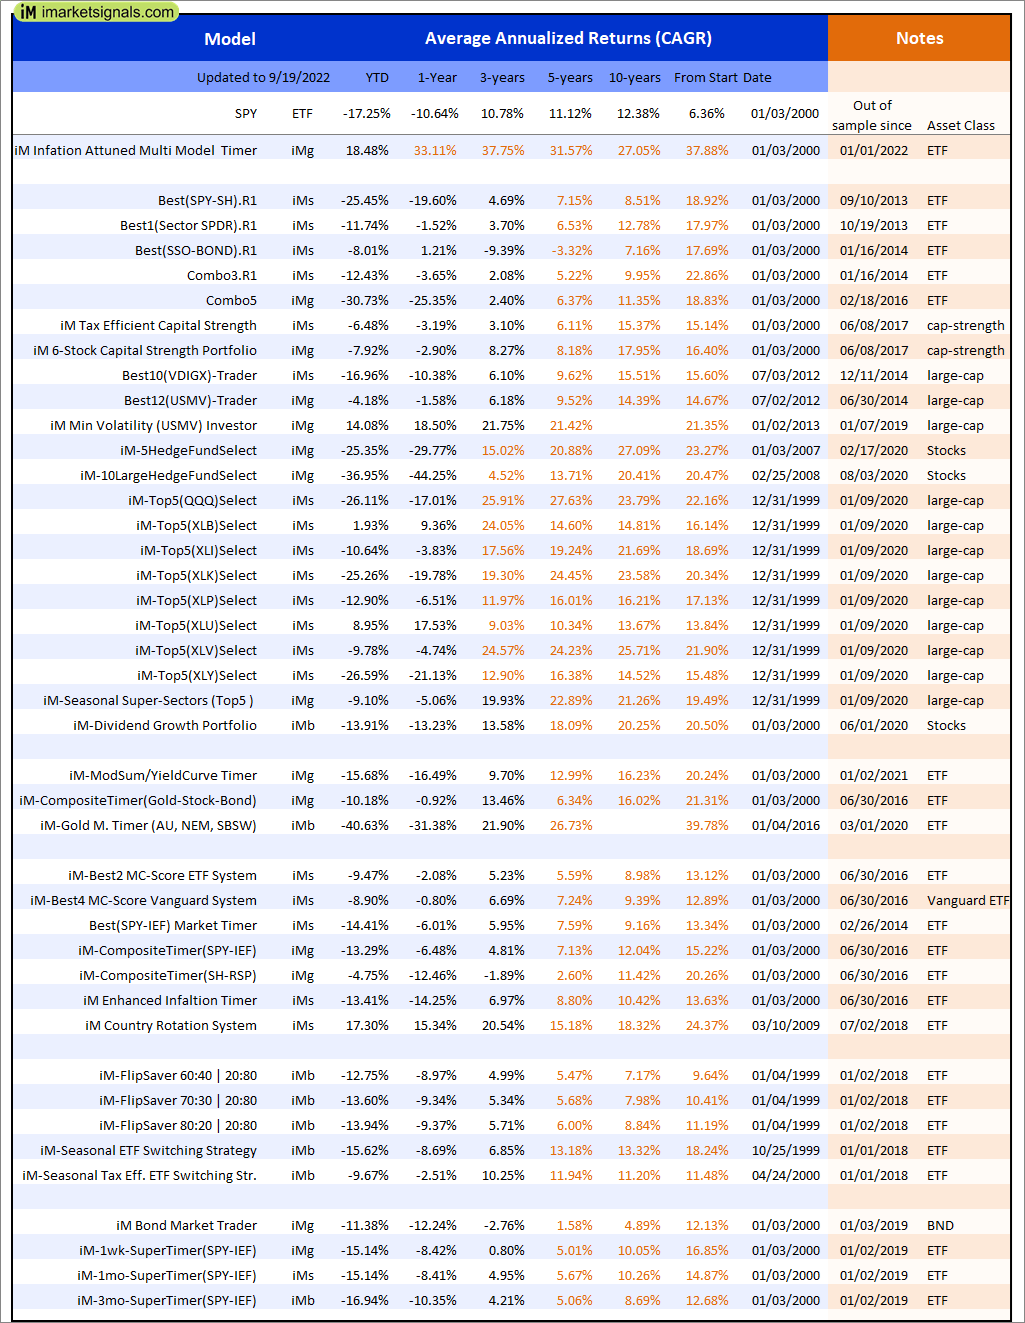
Out of sample performance summary of our models for the past 1, 2, 4 and 13 week periods. The active active return indicates how the models over- or underperformed the benchmark ETF SPY. Also the YTD, and the 1-, 3-, 5- and 10-year annualized returns are shown in the second table |
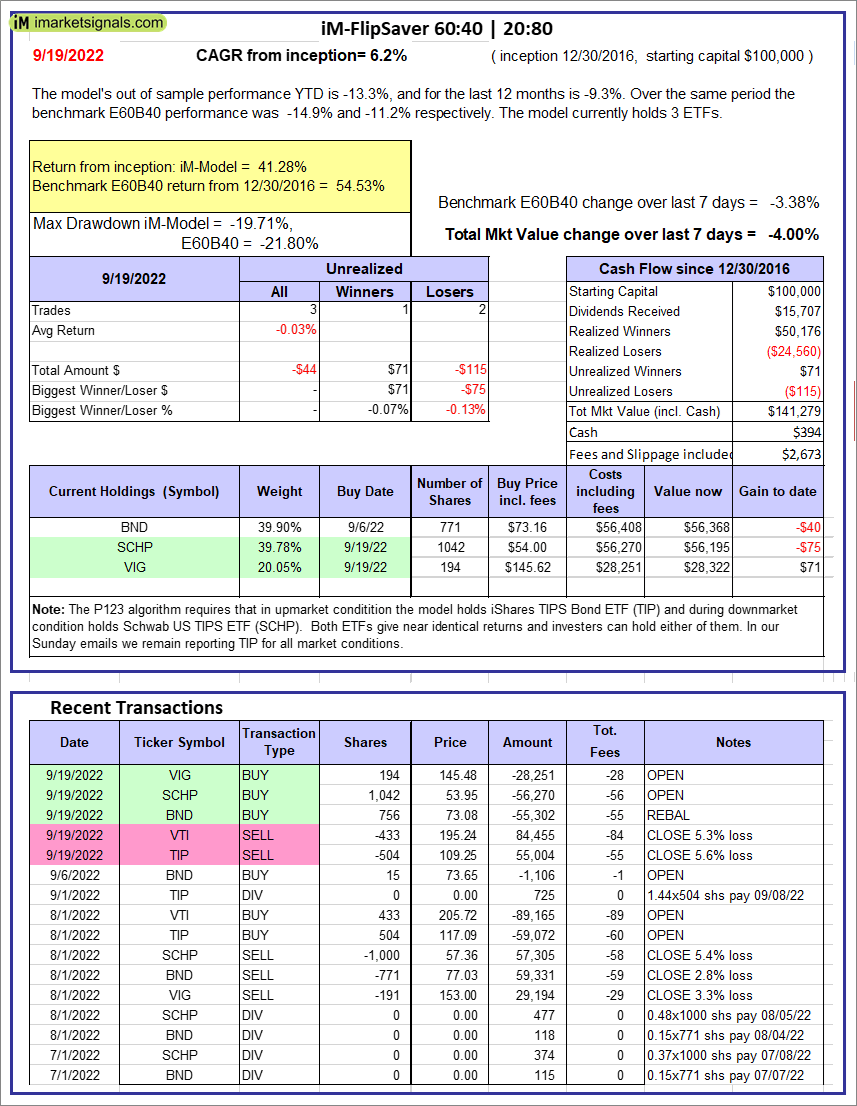 |
iM-FlipSaver 60:40 | 20:80 – 2017: The model’s out of sample performance YTD is -13.3%, and for the last 12 months is -9.3%. Over the same period the benchmark E60B40 performance was -14.9% and -11.2% respectively. Over the previous week the market value of iM-FlipSaver 80:20 | 20:80 gained -4.00% at a time when SPY gained -3.38%. A starting capital of $100,000 at inception on 7/16/2015 would have grown to $141,279 which includes $394 cash and excludes $2,673 spent on fees and slippage. |
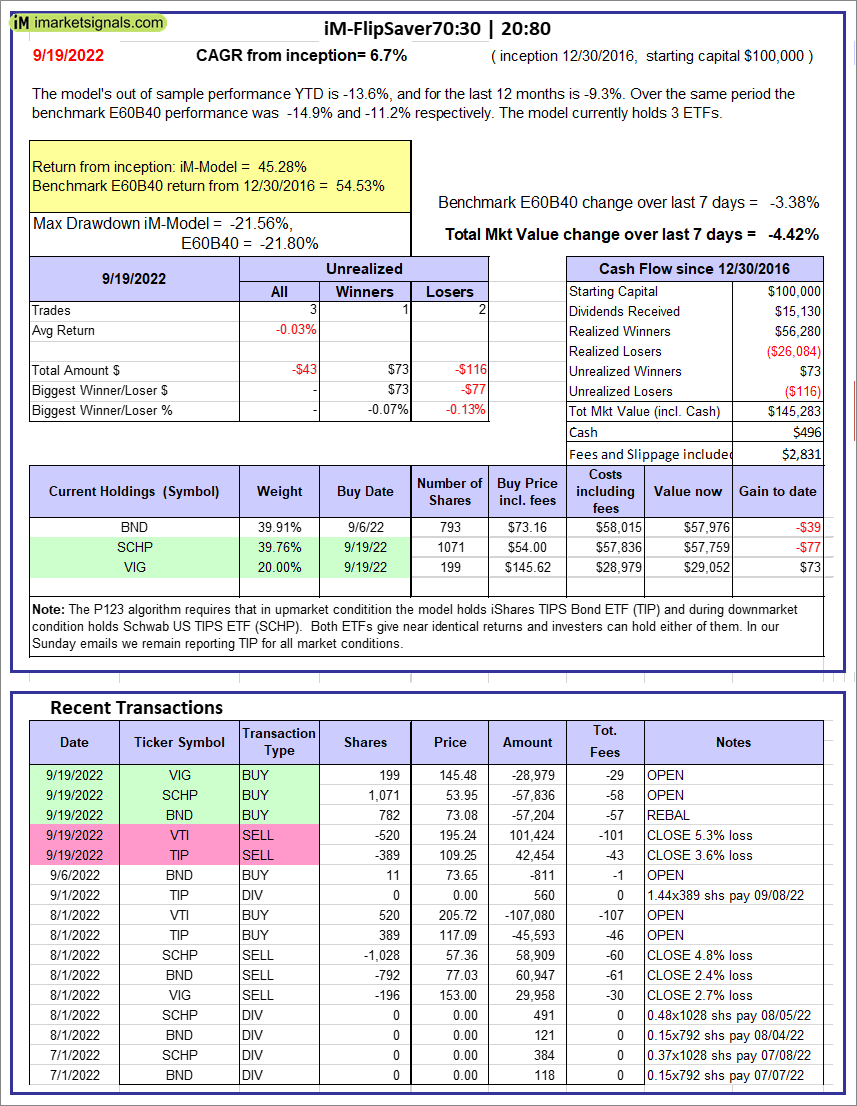 |
iM-FlipSaver 70:30 | 20:80 – 2017: The model’s out of sample performance YTD is -13.6%, and for the last 12 months is -9.3%. Over the same period the benchmark E60B40 performance was -14.9% and -11.2% respectively. Over the previous week the market value of iM-FlipSaver 70:30 | 20:80 gained -4.42% at a time when SPY gained -3.38%. A starting capital of $100,000 at inception on 7/15/2015 would have grown to $145,283 which includes $496 cash and excludes $2,831 spent on fees and slippage. |
 |
iM-FlipSaver 80:20 | 20:80 – 2017: The model’s out of sample performance YTD is -13.9%, and for the last 12 months is -9.4%. Over the same period the benchmark E60B40 performance was -14.9% and -11.2% respectively. Over the previous week the market value of iM-FlipSaver 80:20 | 20:80 gained -4.82% at a time when SPY gained -3.38%. A starting capital of $100,000 at inception on 1/2/2017 would have grown to $149,128 which includes $638 cash and excludes $2,982 spent on fees and slippage. |
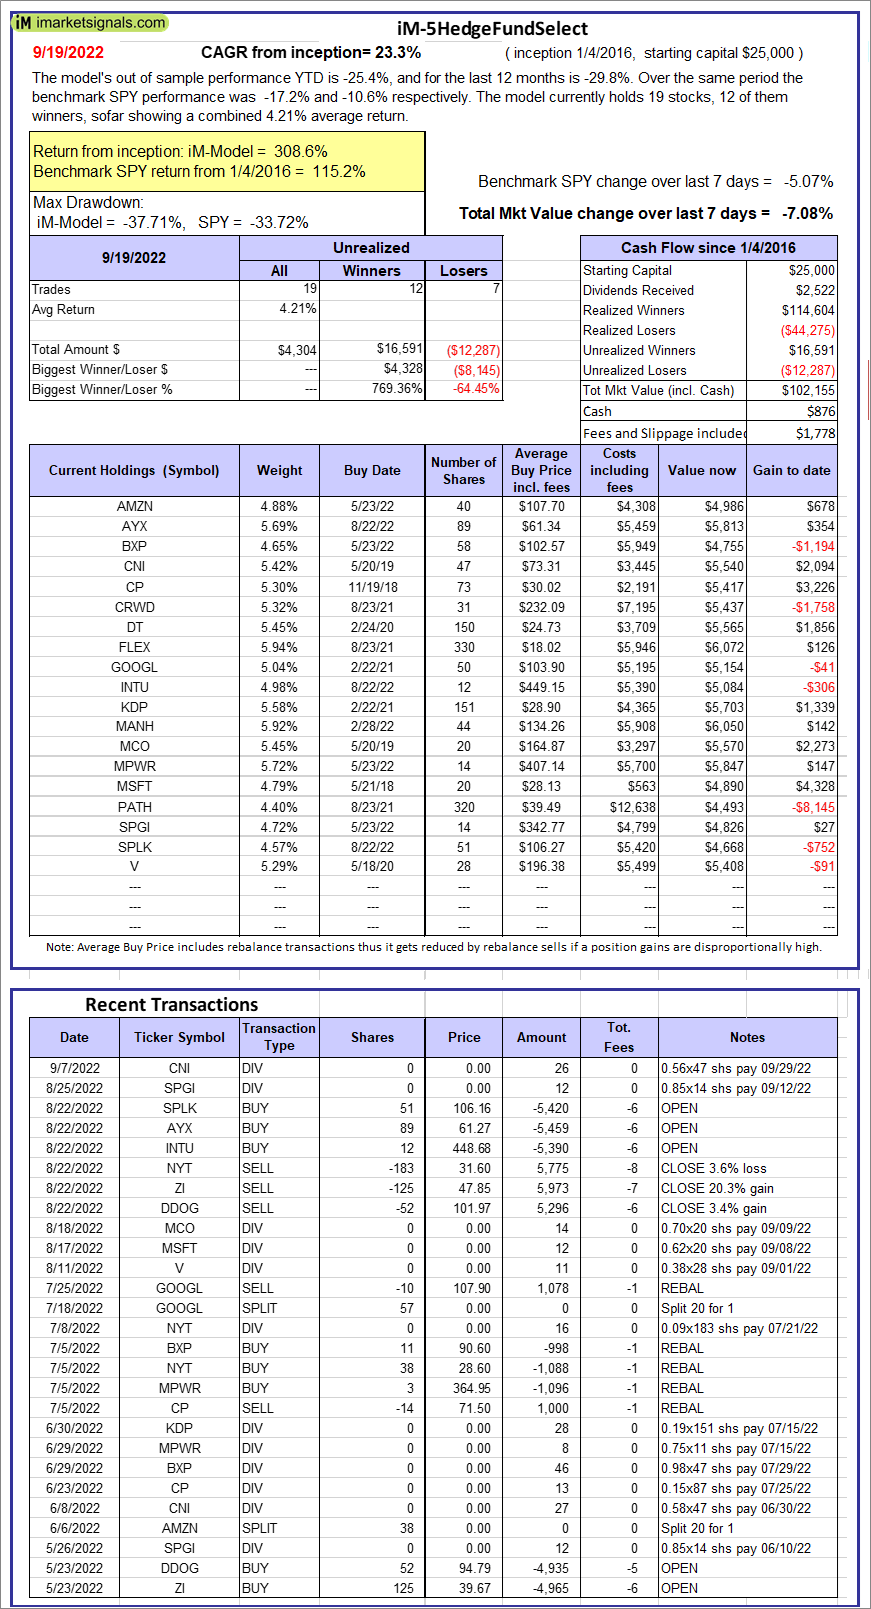 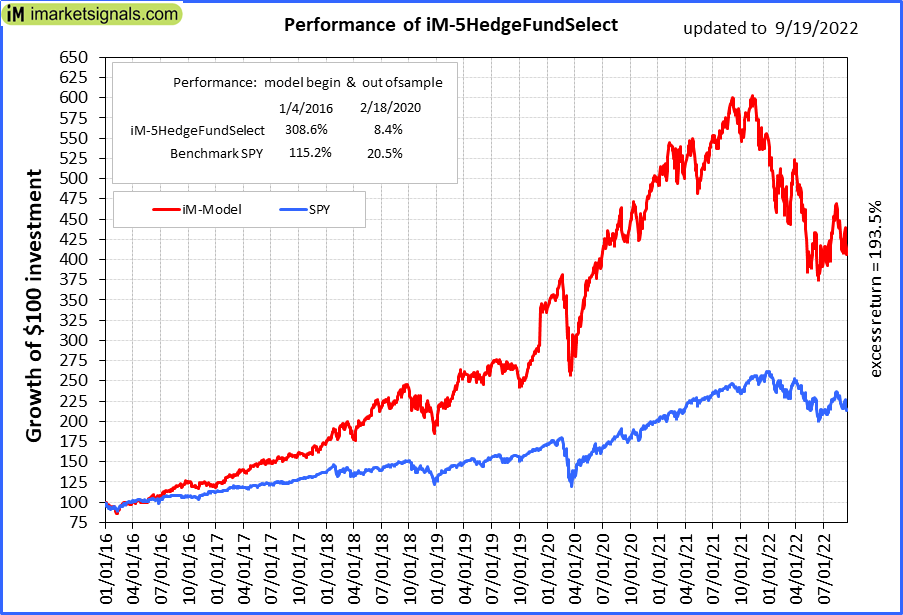 |
iM-5HedgeFundSelect: Since inception, on 1/5/2016, the model gained 308.62% while the benchmark SPY gained 115.17% over the same period. Over the previous week the market value of iM-5HedgeFundSelect gained -7.08% at a time when SPY gained -5.07%. A starting capital of $25,000 at inception on 1/5/2016 would have grown to $102,155 which includes $876 cash and excludes $1,778 spent on fees and slippage. |
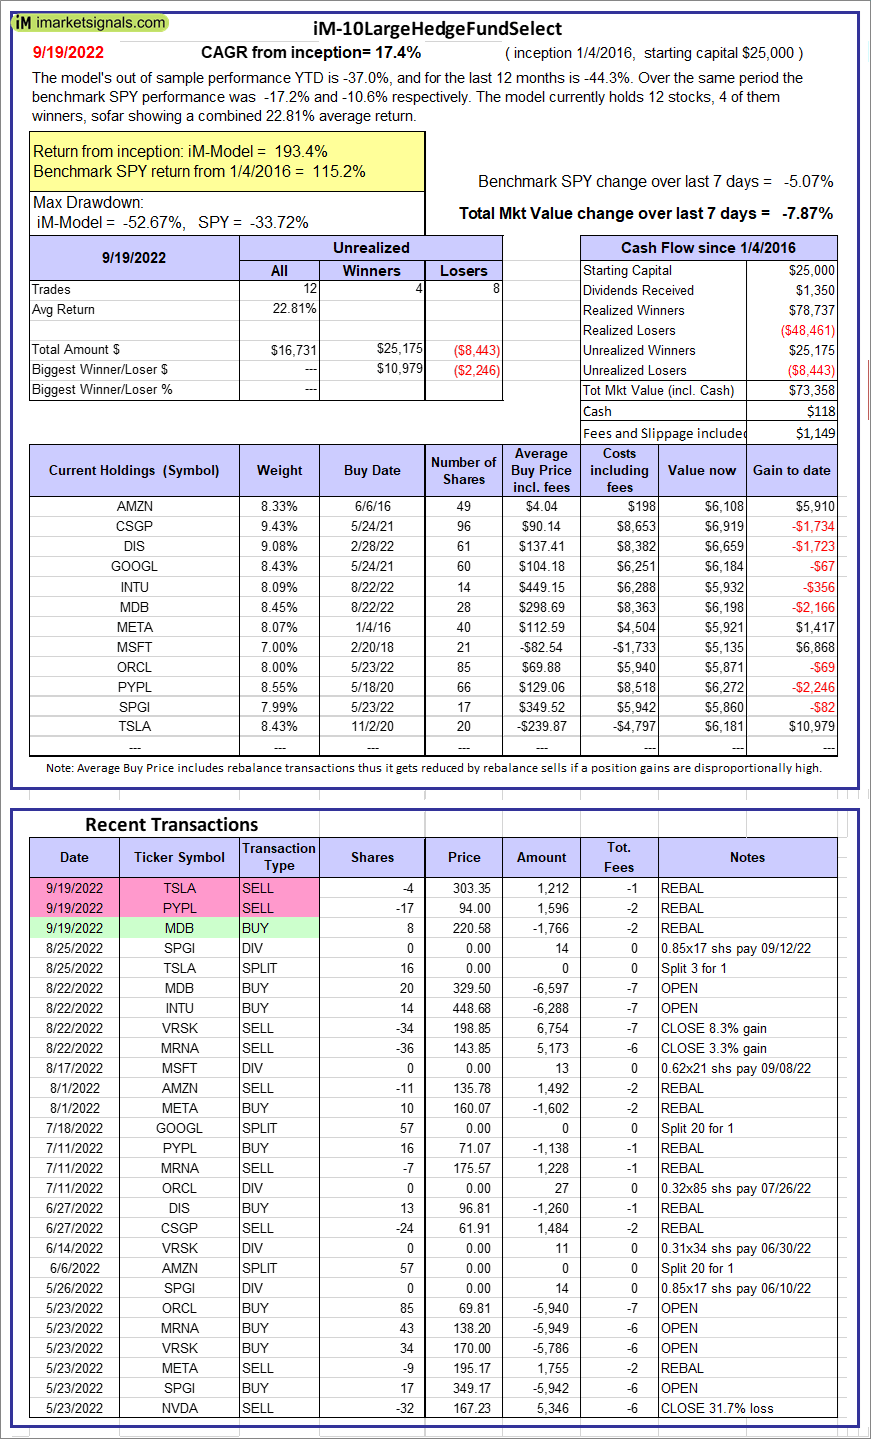 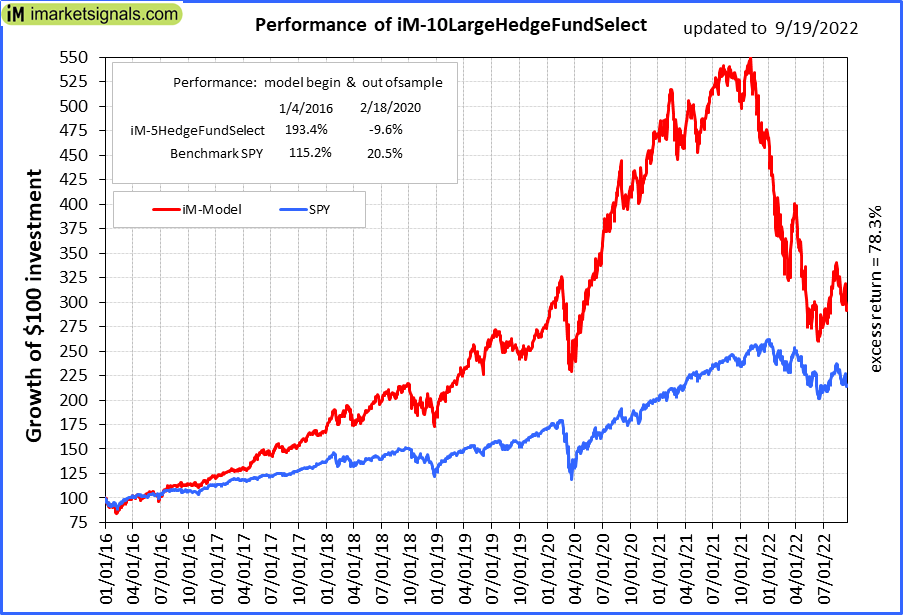 |
iM-10LargeHedgeFundSelect: Since inception, on 1/5/2016, the model gained 193.43% while the benchmark SPY gained 115.17% over the same period. Over the previous week the market value of iM-10LargeHedgeFundSelect gained -7.87% at a time when SPY gained -5.07%. A starting capital of $25,000 at inception on 1/5/2016 would have grown to $73,358 which includes $118 cash and excludes $1,149 spent on fees and slippage. |
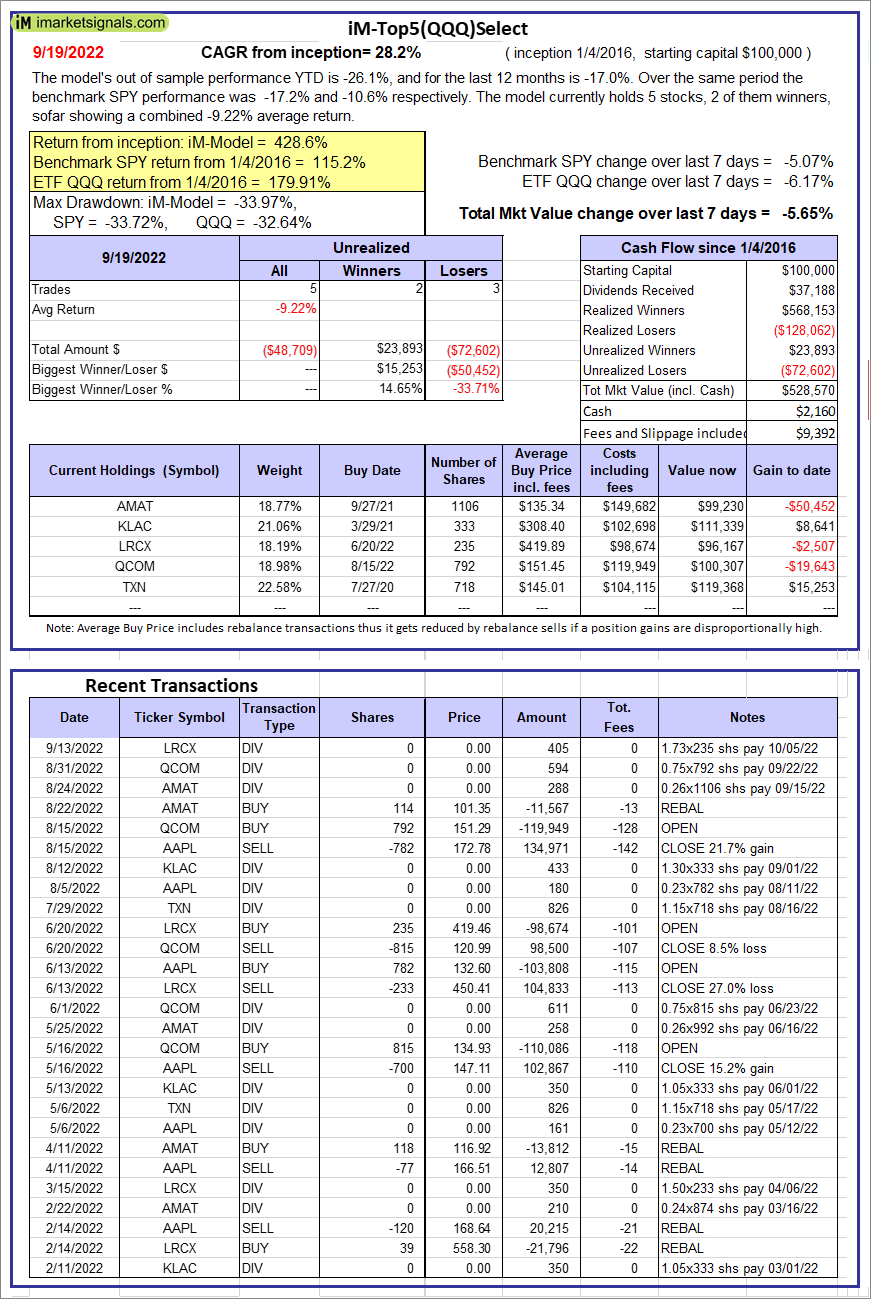 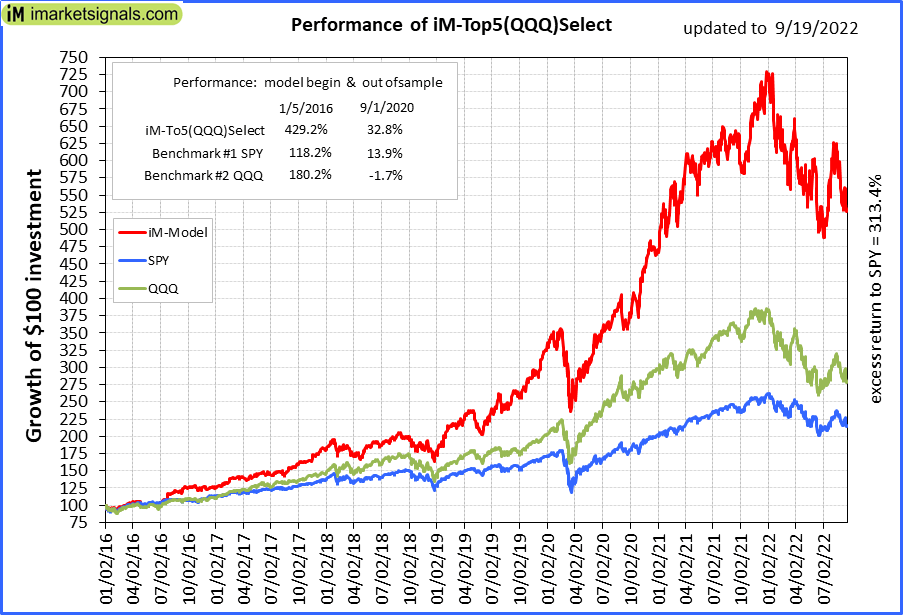 |
iM-Top5(QQQ)Select: Since inception, on 1/5/2016, the model gained 428.57% while the benchmark SPY gained 115.17% over the same period. Over the previous week the market value of iM-Top5(QQQ)Select gained -5.65% at a time when SPY gained -5.07%. A starting capital of $100,000 at inception on 1/5/2016 would have grown to $528,570 which includes $2,160 cash and excludes $9,392 spent on fees and slippage. |
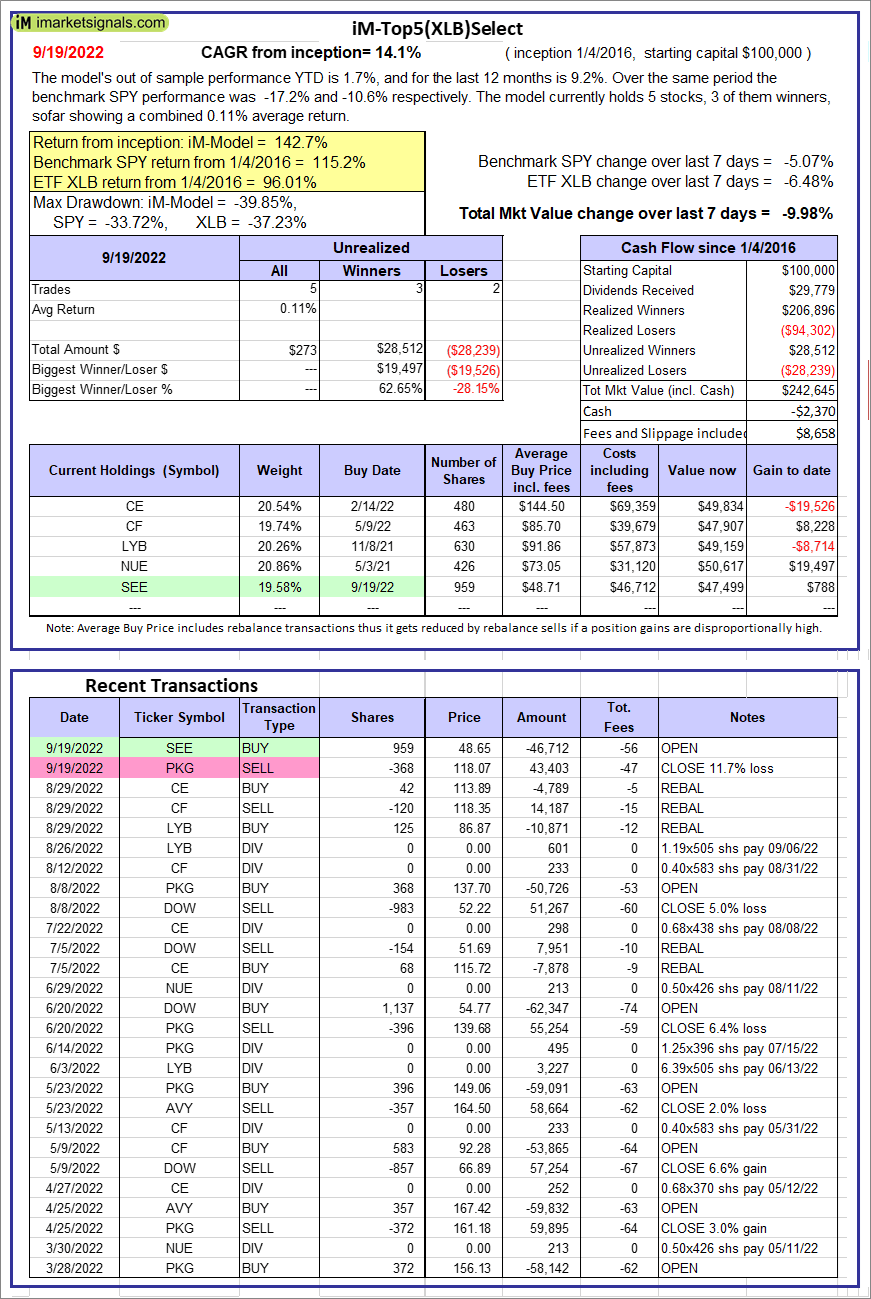 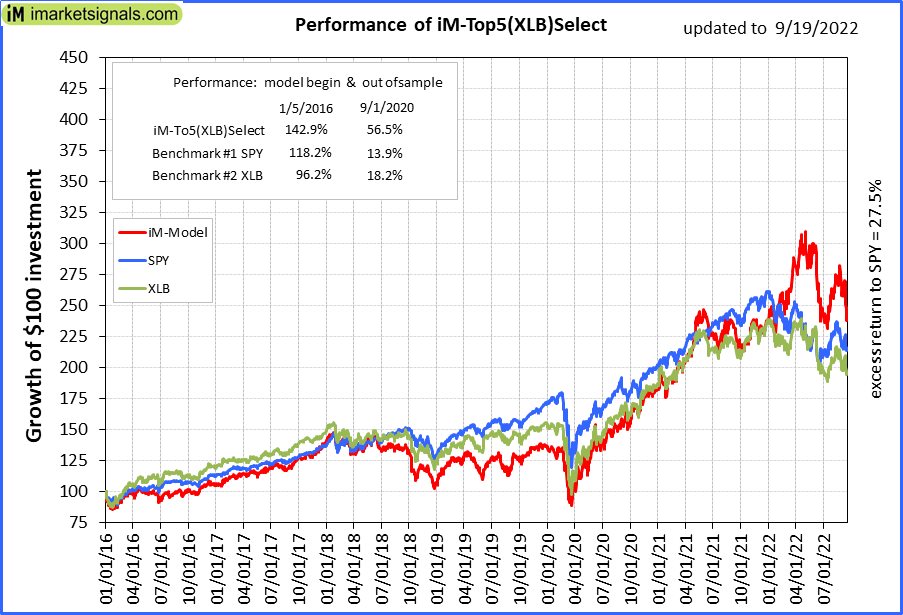 |
iM-Top5(XLB)Select: Since inception, on 1/5/2016, the model gained 142.65% while the benchmark SPY gained 115.17% over the same period. Over the previous week the market value of iM-Top5(XLB)Select gained -9.98% at a time when SPY gained -5.07%. A starting capital of $100,000 at inception on 1/5/2016 would have grown to $242,645 which includes -$2,370 cash and excludes $8,658 spent on fees and slippage. |
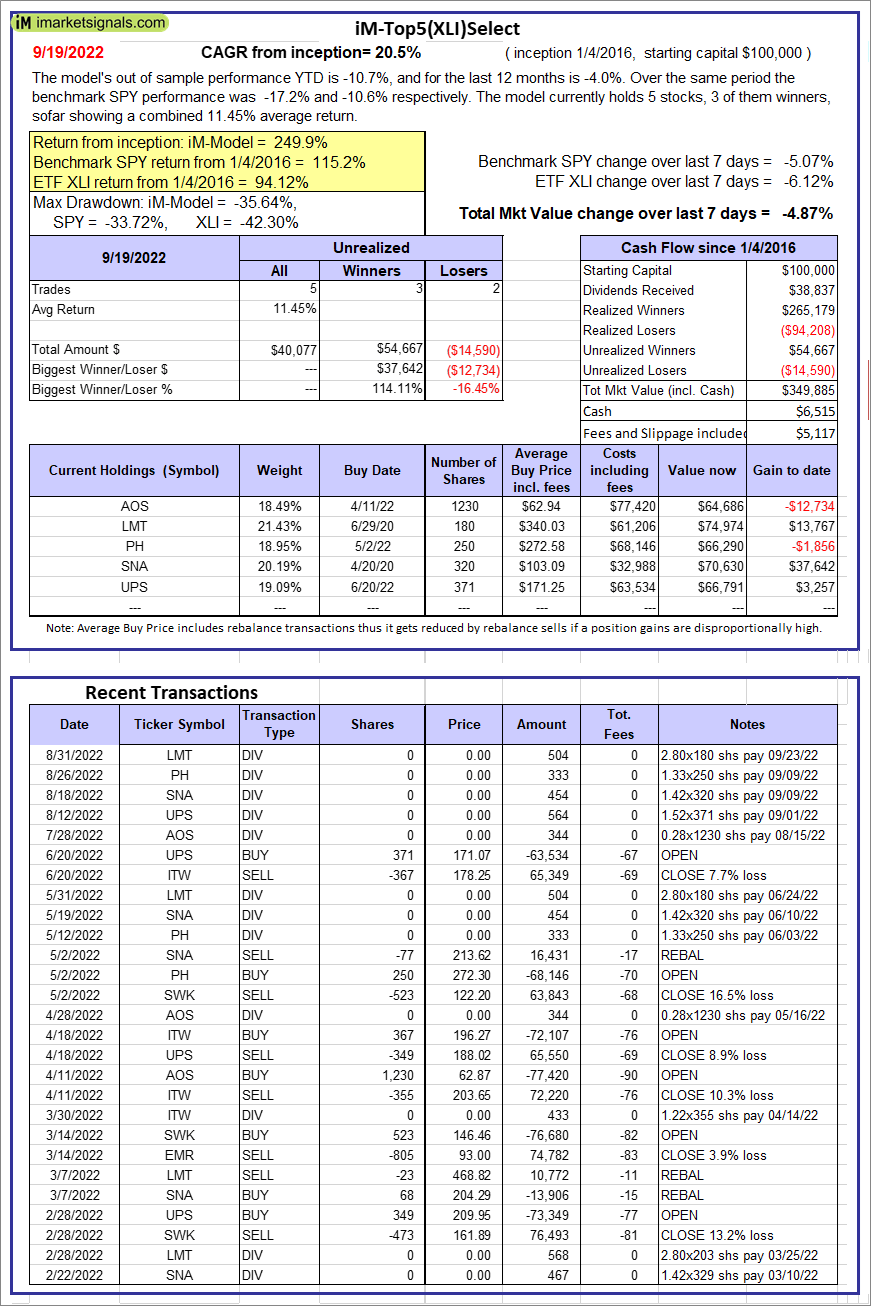 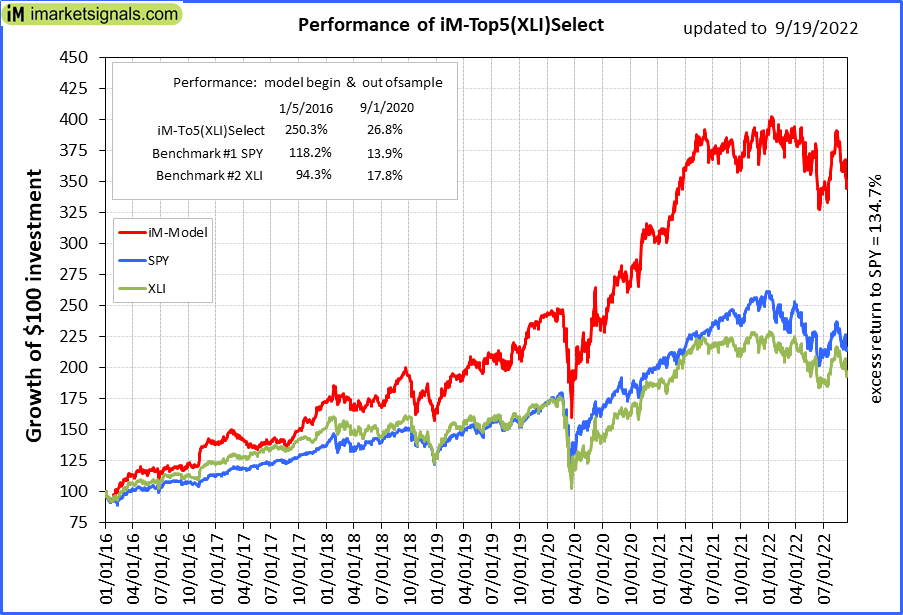 |
iM-Top5(XLI)Select: Since inception, on 1/5/2016, the model gained 249.89% while the benchmark SPY gained 115.17% over the same period. Over the previous week the market value of iM-Top5(XLI)Select gained -4.87% at a time when SPY gained -5.07%. A starting capital of $100,000 at inception on 1/5/2016 would have grown to $349,885 which includes $6,515 cash and excludes $5,117 spent on fees and slippage. |
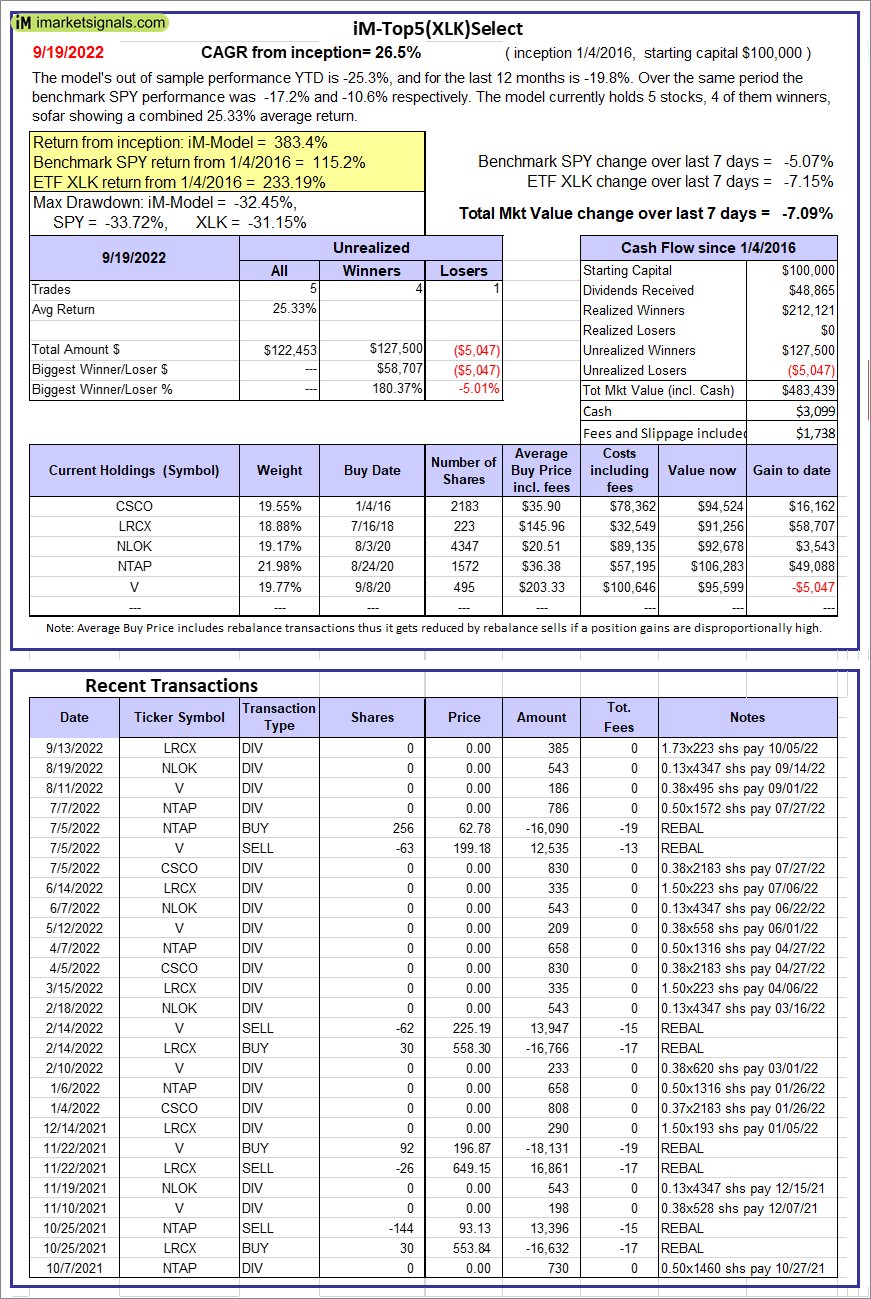 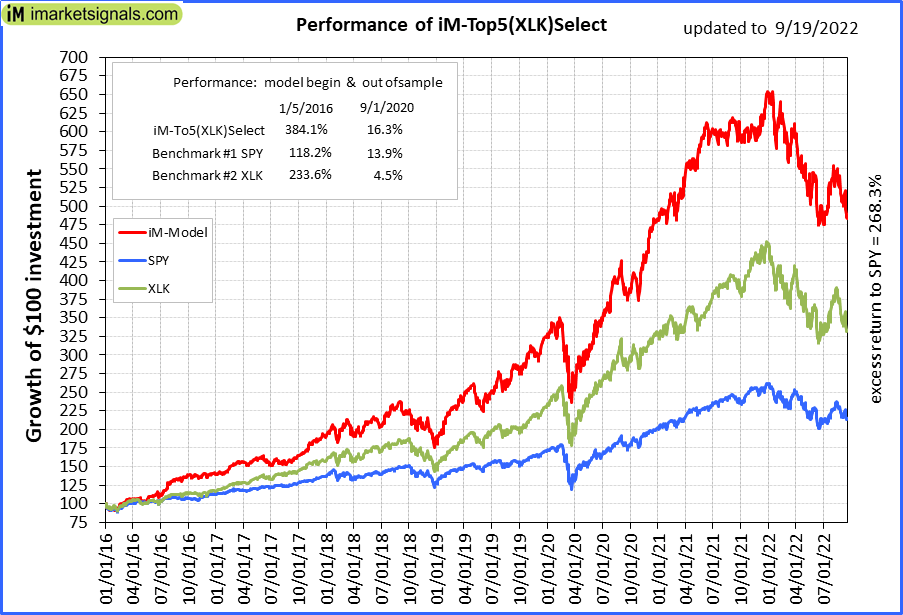 |
iM-Top5(XLK)Select: Since inception, on 1/5/2016, the model gained 383.44% while the benchmark SPY gained 115.17% over the same period. Over the previous week the market value of iM-Top5(XLK)Select gained -7.09% at a time when SPY gained -5.07%. A starting capital of $100,000 at inception on 1/5/2016 would have grown to $483,439 which includes $3,099 cash and excludes $1,738 spent on fees and slippage. |
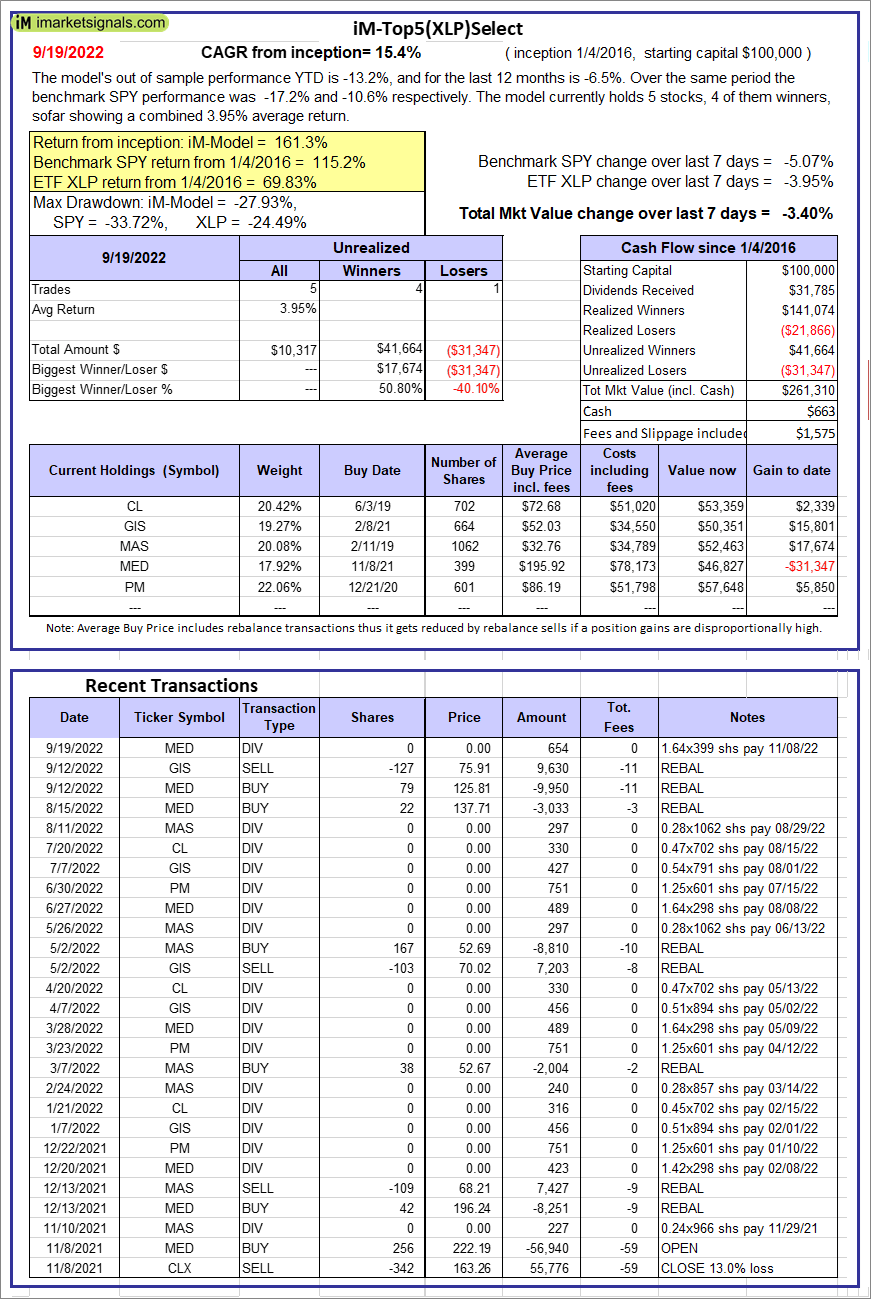 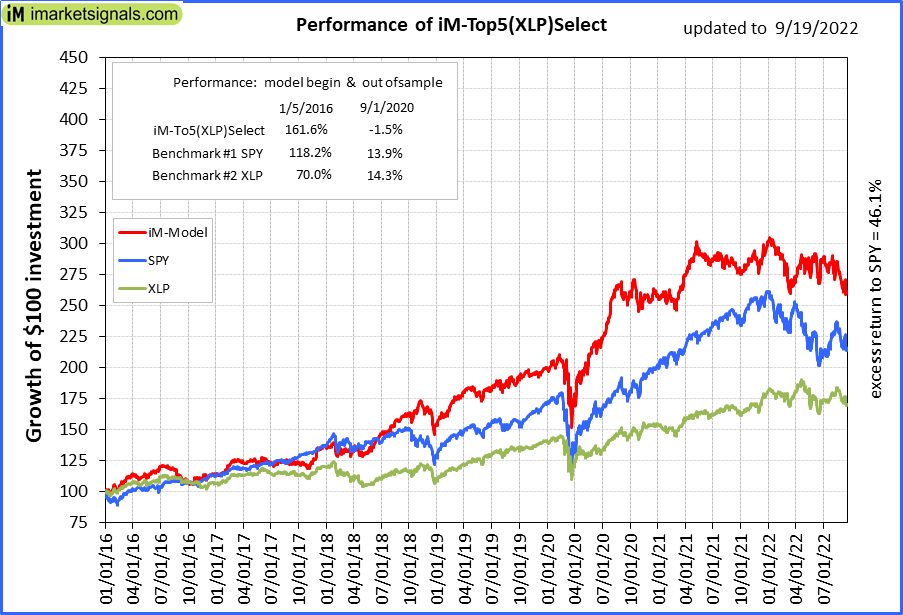 |
iM-Top5(XLP)Select: Since inception, on 1/5/2016, the model gained 161.31% while the benchmark SPY gained 115.17% over the same period. Over the previous week the market value of iM-Top5(XLP)Select gained -3.40% at a time when SPY gained -5.07%. A starting capital of $100,000 at inception on 1/5/2016 would have grown to $261,310 which includes $663 cash and excludes $1,575 spent on fees and slippage. |
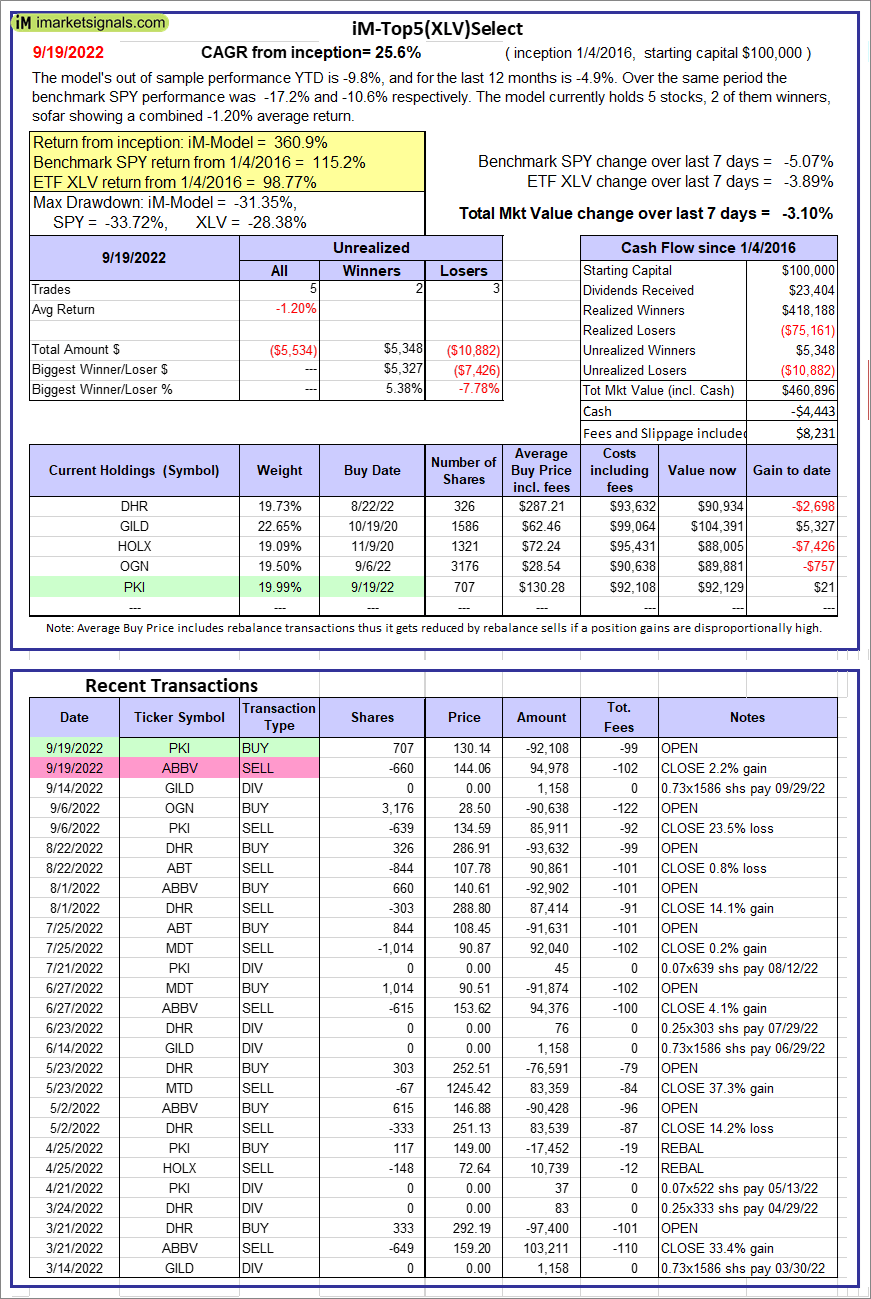 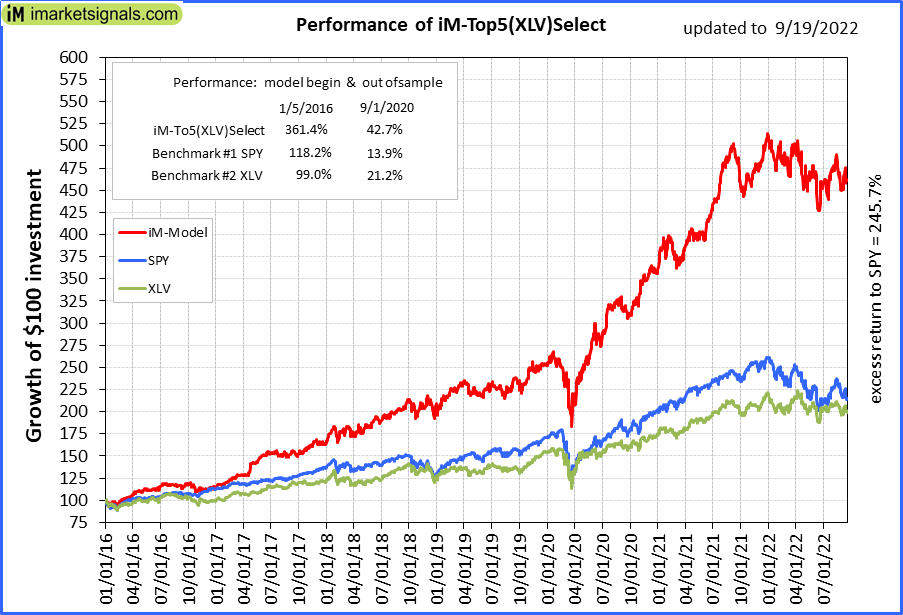 |
iM-Top5(XLV)Select: Since inception, on 1/5/2016, the model gained 360.90% while the benchmark SPY gained 115.17% over the same period. Over the previous week the market value of iM-Top5(XLV)Select gained -3.10% at a time when SPY gained -5.07%. A starting capital of $100,000 at inception on 1/5/2016 would have grown to $460,896 which includes -$4,443 cash and excludes $8,231 spent on fees and slippage. |
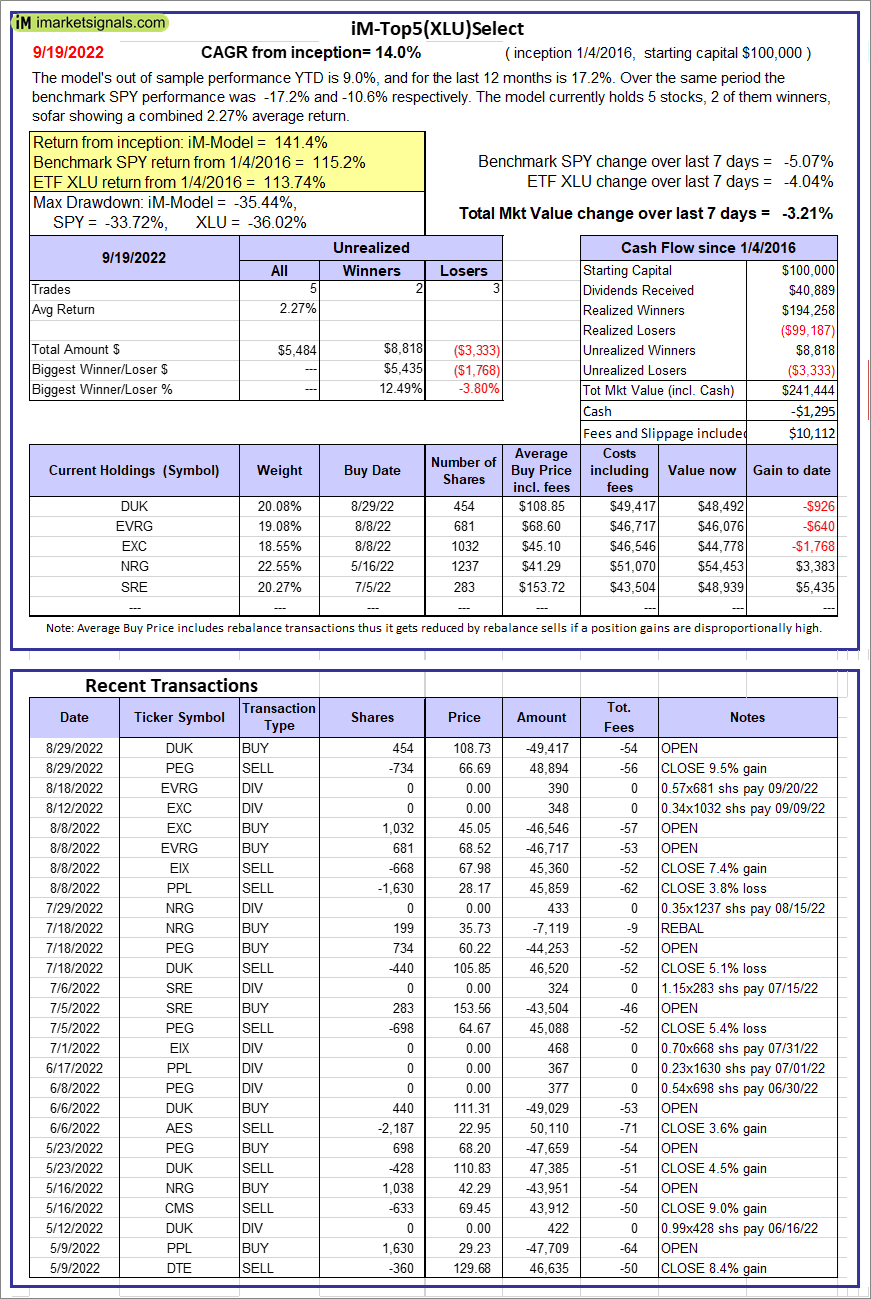 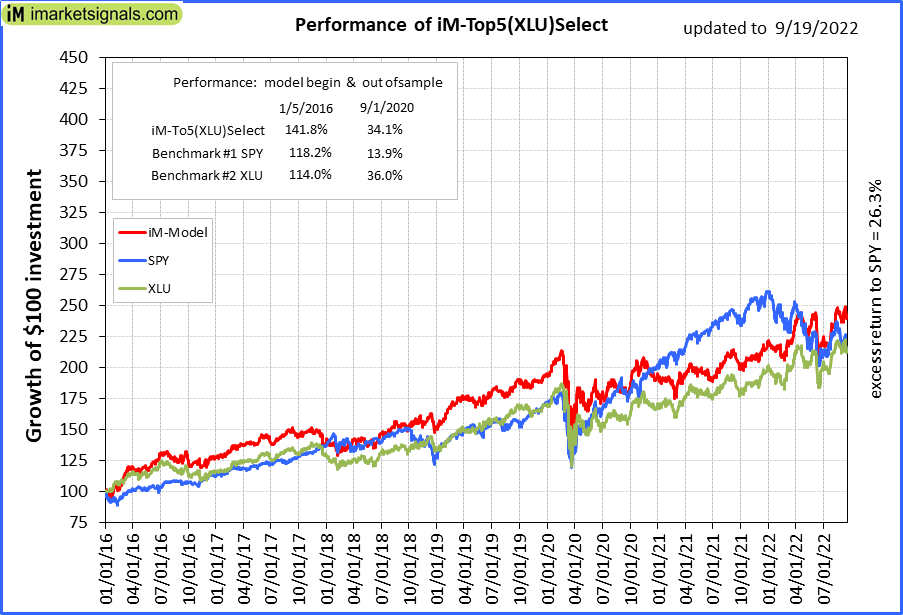 |
iM-Top5(XLU)Select: Since inception, on 1/5/2016, the model gained 141.44% while the benchmark SPY gained 115.17% over the same period. Over the previous week the market value of iM-Top5(XLU)Select gained -3.21% at a time when SPY gained -5.07%. A starting capital of $100,000 at inception on 1/5/2016 would have grown to $241,444 which includes -$1,295 cash and excludes $10,112 spent on fees and slippage. |
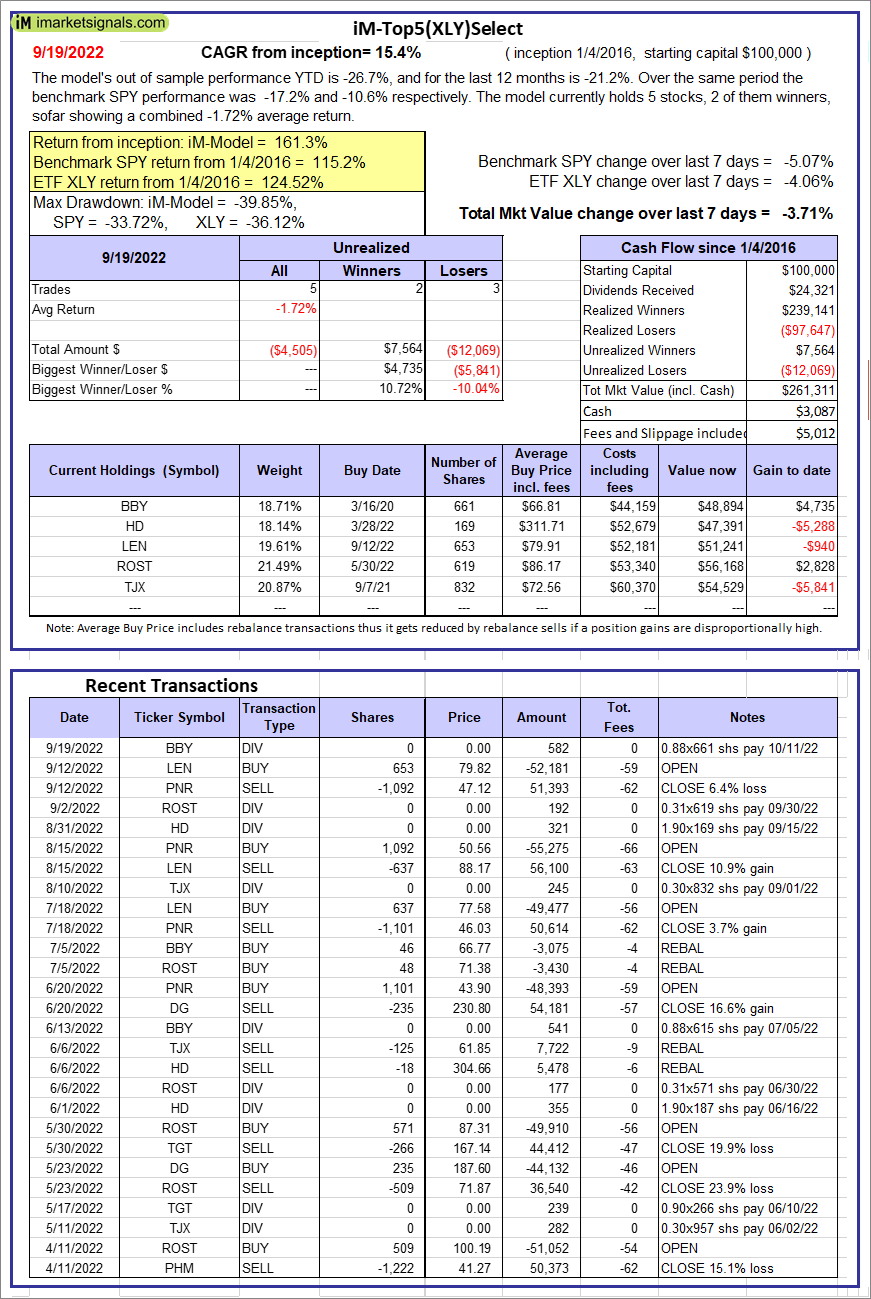  |
iM-Top5(XLY)Select: Since inception, on 1/5/2016, the model gained 161.31% while the benchmark SPY gained 115.17% over the same period. Over the previous week the market value of iM-Top5(XLY)Select gained -3.71% at a time when SPY gained -5.07%. A starting capital of $100,000 at inception on 1/5/2016 would have grown to $261,311 which includes $3,087 cash and excludes $5,012 spent on fees and slippage. |
 |
iM-Seasonal Super-Sectors (Top5 combo) : Since inception, on 11/17/2020, the model gained 17.47% while the benchmark SPY gained 11.70% over the same period. Over the previous week the market value of iM-Seasonal Super-Sectors (Top5 combo) gained -4.78% at a time when SPY gained -5.07%. A starting capital of $100,000 at inception on 11/17/2020 would have grown to $117,468 which includes $2,065 cash and excludes $00 spent on fees and slippage. |
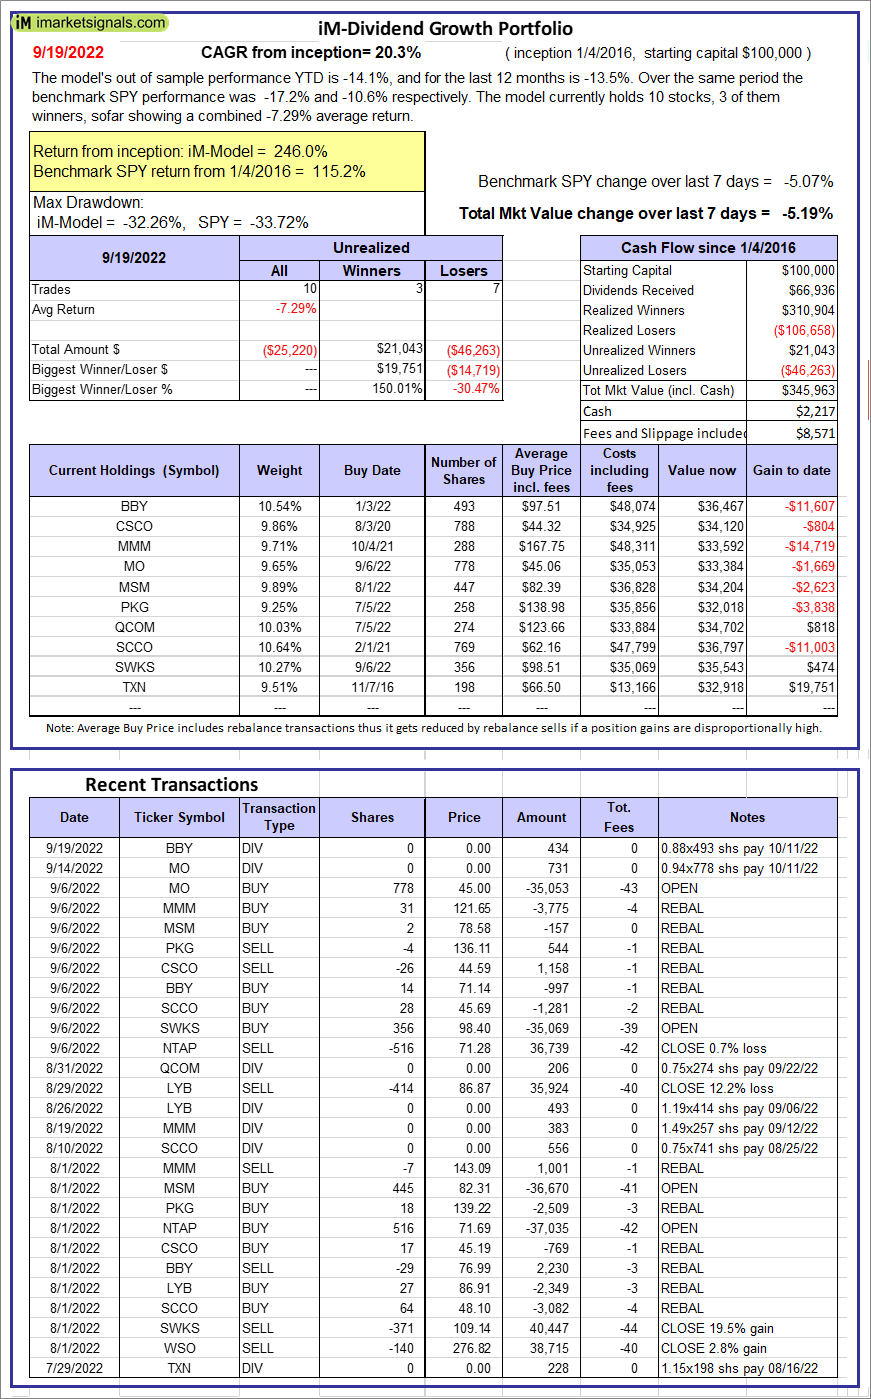 |
iM-Dividend Growth Portfolio: The model’s out of sample performance YTD is -14.1%, and for the last 12 months is -13.5%. Over the same period the benchmark SPY performance was -17.2% and -10.6% respectively. Over the previous week the market value of the iM-Dividend Growth Portfolio gained -5.19% at a time when SPY gained -5.07%. A starting capital of $100,000 at inception on 6/30/2016 would have grown to $345,963 which includes $2,217 cash and excludes $8,571 spent on fees and slippage. |
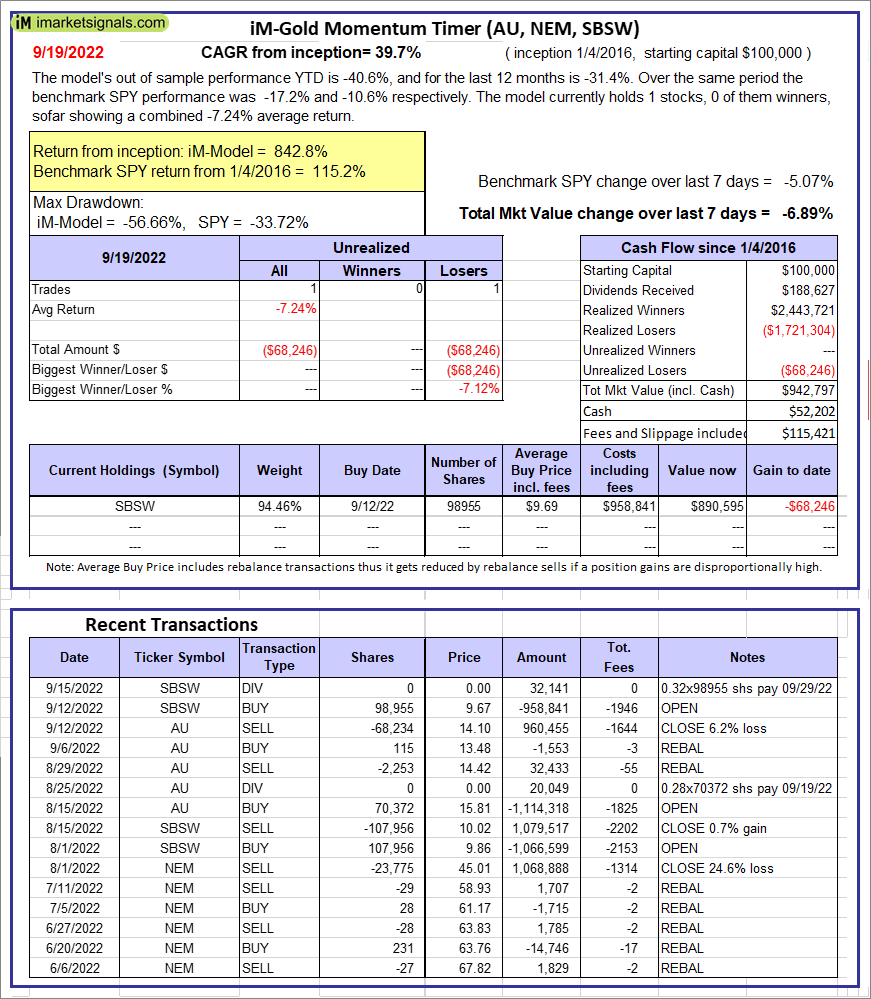 |
iM-Gold Momentum Timer (AU, NEM, SBSW): The model’s out of sample performance YTD is -40.6%, and for the last 12 months is -31.4%. Over the same period the benchmark SPY performance was -17.2% and -10.6% respectively. Over the previous week the market value of iM-Gold Momentum Timer (AU, NEM, SBSW) gained -6.89% at a time when SPY gained -5.07%. A starting capital of $100,000 at inception on 6/30/2016 would have grown to $52,202 which includes $115,421 cash and excludes Gain to date spent on fees and slippage. |
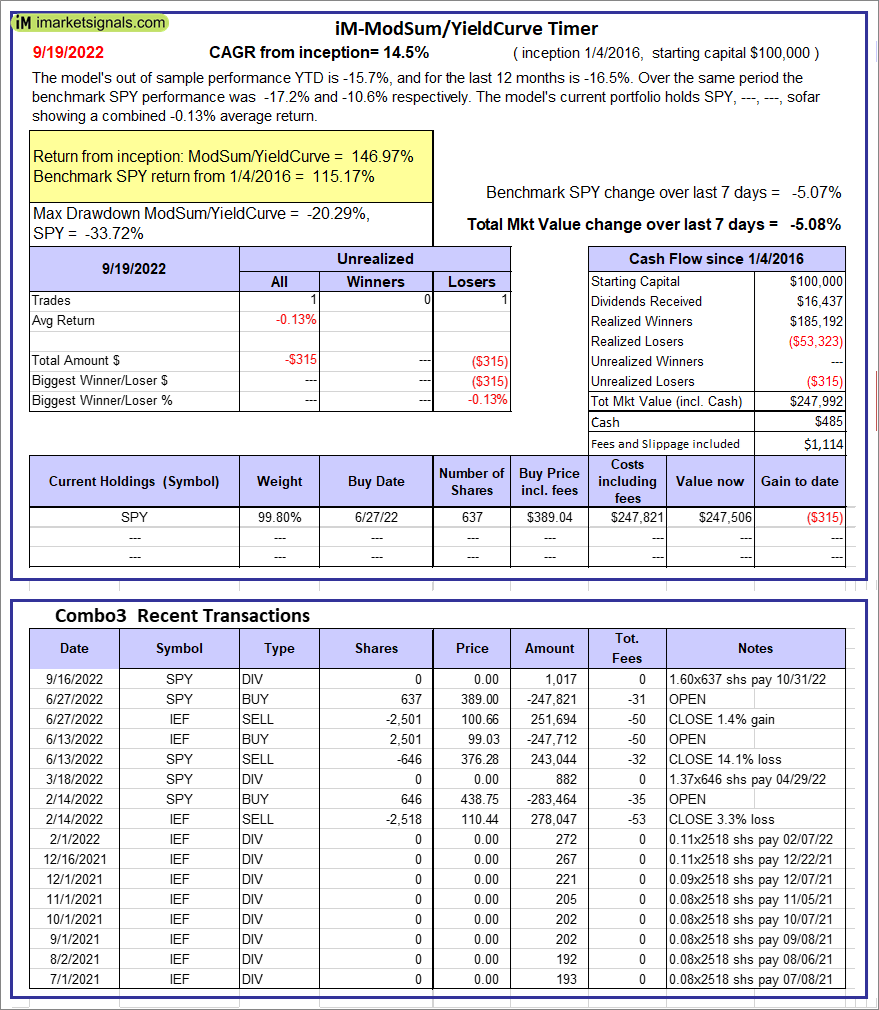 |
iM-ModSum/YieldCurve Timer: The model’s out of sample performance YTD is -15.7%, and for the last 12 months is -16.5%. Over the same period the benchmark SPY performance was -17.2% and -10.6% respectively. Over the previous week the market value of iM-PortSum/YieldCurve Timer gained -5.08% at a time when SPY gained -5.07%. A starting capital of $100,000 at inception on 1/1/2016 would have grown to $247,992 which includes $485 cash and excludes $1,114 spent on fees and slippage. |
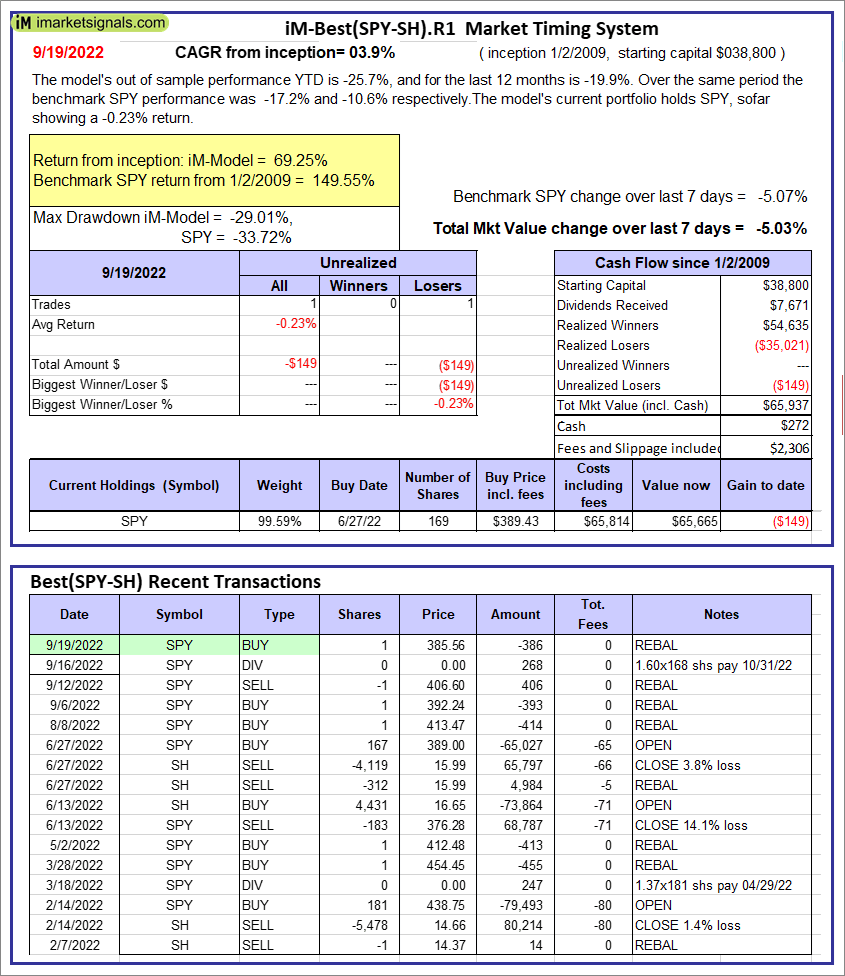 |
iM-Best(SPY-SH).R1: The model’s out of sample performance YTD is -25.7%, and for the last 12 months is -19.9%. Over the same period the benchmark SPY performance was -17.2% and -10.6% respectively. Over the previous week the market value of Best(SPY-SH) gained -5.03% at a time when SPY gained -5.07%. A starting capital of $100,000 at inception on 1/2/2009 would have grown to $65,937 which includes $272 cash and excludes $2,306 spent on fees and slippage. |
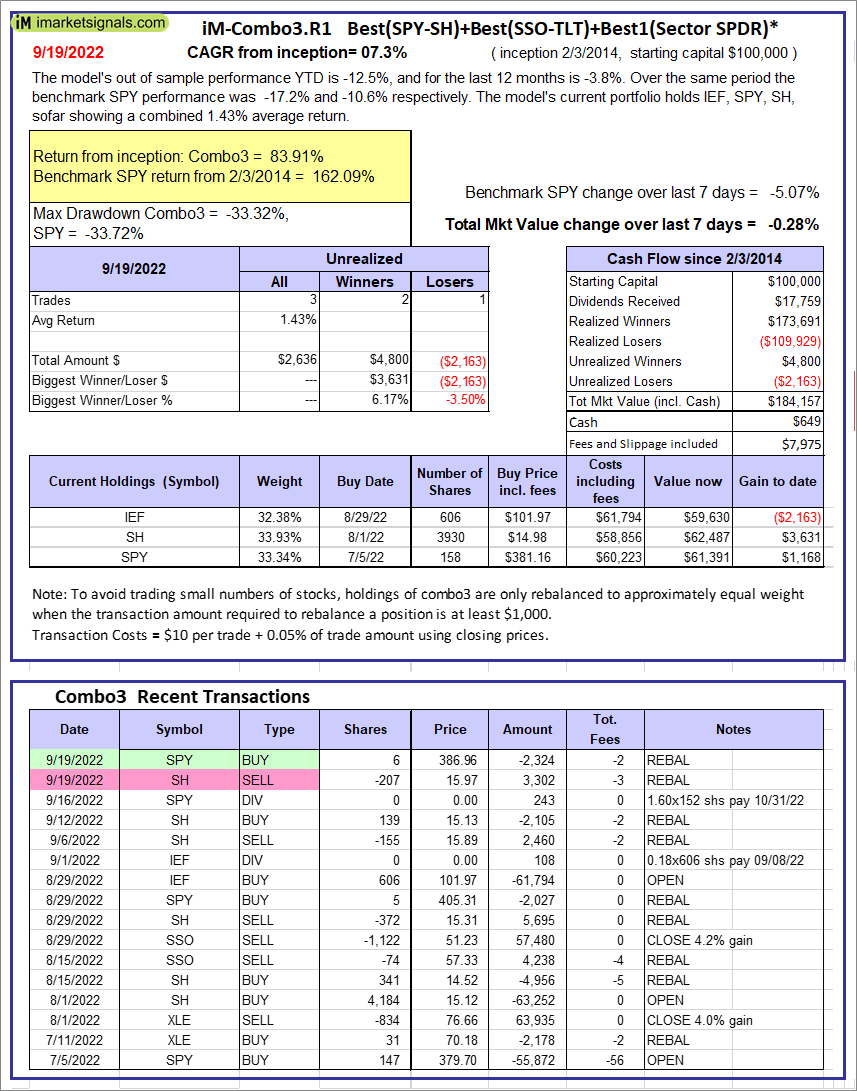 |
iM-Combo3.R1: The model’s out of sample performance YTD is -12.5%, and for the last 12 months is -3.8%. Over the same period the benchmark SPY performance was -17.2% and -10.6% respectively. Over the previous week the market value of iM-Combo3.R1 gained -0.28% at a time when SPY gained -5.07%. A starting capital of $100,000 at inception on 2/3/2014 would have grown to $184,157 which includes $649 cash and excludes $7,975 spent on fees and slippage. |
 |
iM-Combo5: The model’s out of sample performance YTD is -30.8%, and for the last 12 months is -25.4%. Over the same period the benchmark SPY performance was -17.2% and -10.6% respectively. Over the previous week the market value of iM-Combo5 gained -3.79% at a time when SPY gained -5.07%. A starting capital of $100,000 at inception on 2/22/2016 would have grown to $157,214 which includes -$1,746 cash and excludes $0 spent on fees and slippage. |
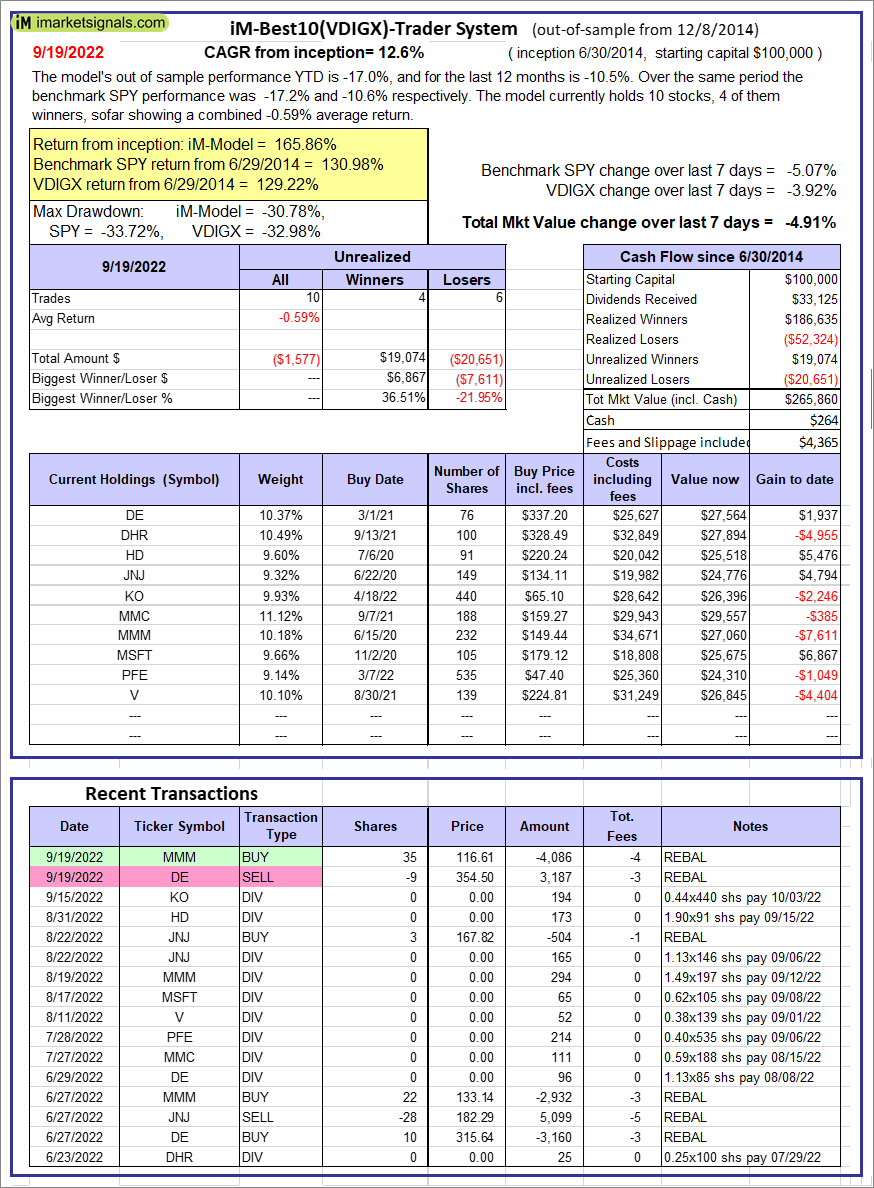 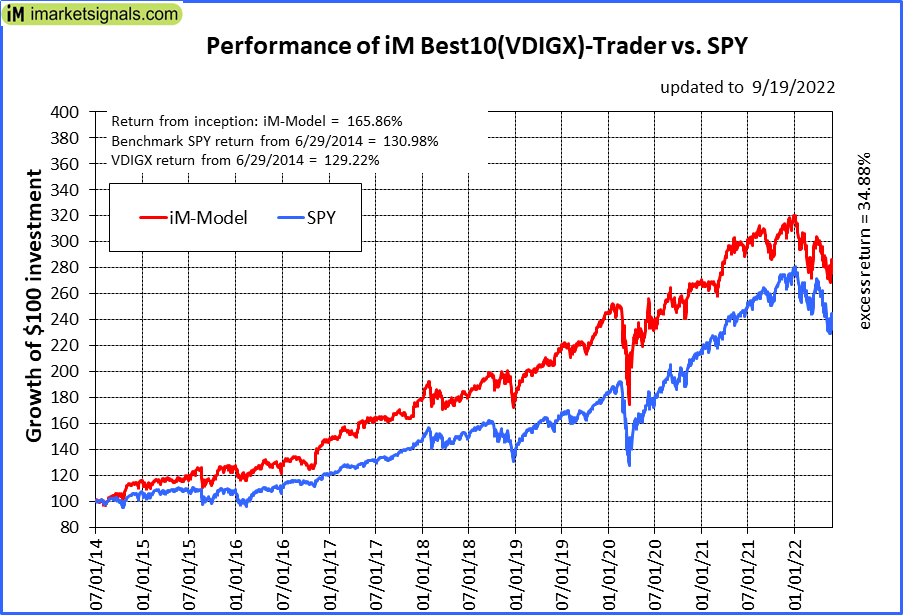 |
iM-Best10(VDIGX)-Trader: The model’s out of sample performance YTD is -17.0%, and for the last 12 months is -10.5%. Over the same period the benchmark SPY performance was -17.2% and -10.6% respectively. Since inception, on 7/1/2014, the model gained 165.86% while the benchmark SPY gained 130.98% and VDIGX gained 129.22% over the same period. Over the previous week the market value of iM-Best10(VDIGX) gained -4.91% at a time when SPY gained -5.07%. A starting capital of $100,000 at inception on 7/1/2014 would have grown to $265,860 which includes $264 cash and excludes $4,365 spent on fees and slippage. |
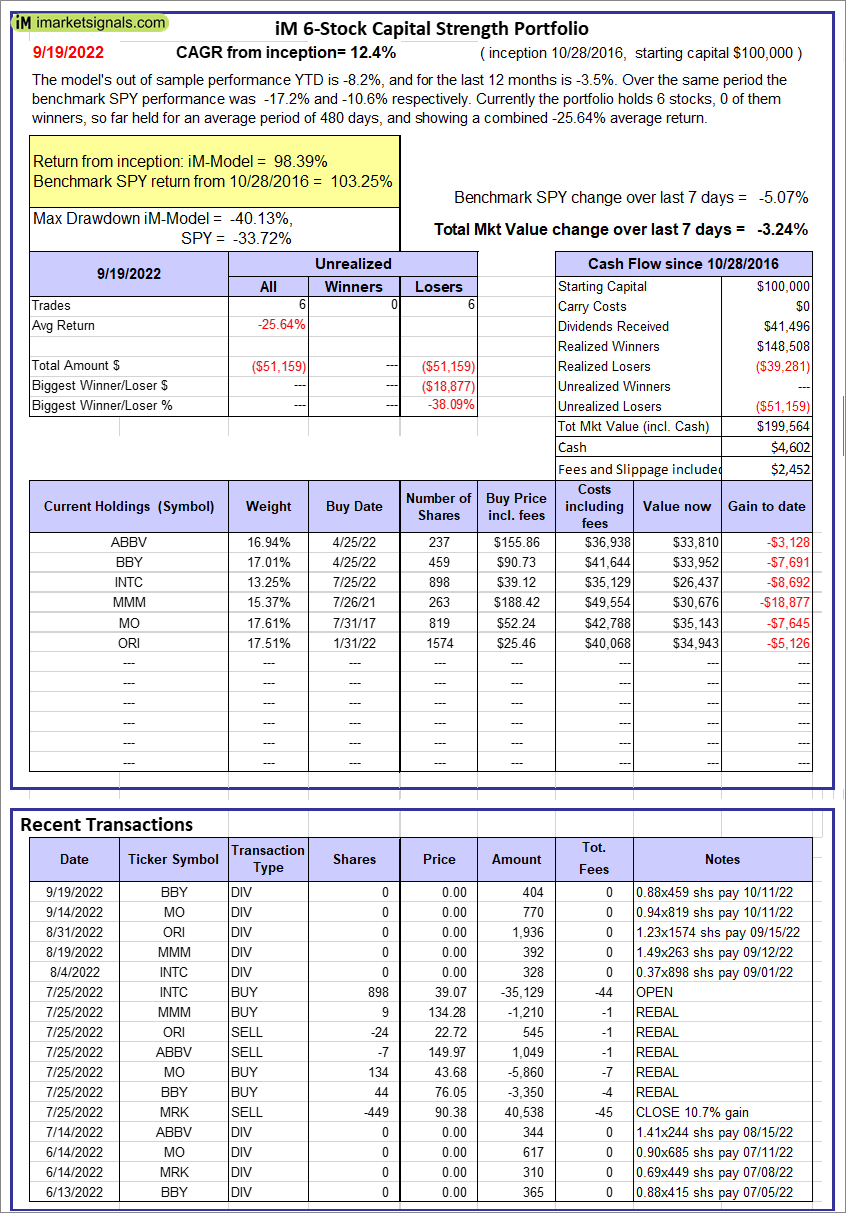 |
iM 6-Stock Capital Strength Portfolio: The model’s out of sample performance YTD is -8.2%, and for the last 12 months is -3.5%. Over the same period the benchmark SPY performance was -17.2% and -10.6% respectively. Over the previous week the market value of the iM 6-Stock Capital Strength Portfolio gained -3.24% at a time when SPY gained -5.07%. A starting capital of $100,000 at inception on 10/28/2016 would have grown to $199,564 which includes $4,602 cash and excludes $2,452 spent on fees and slippage. |
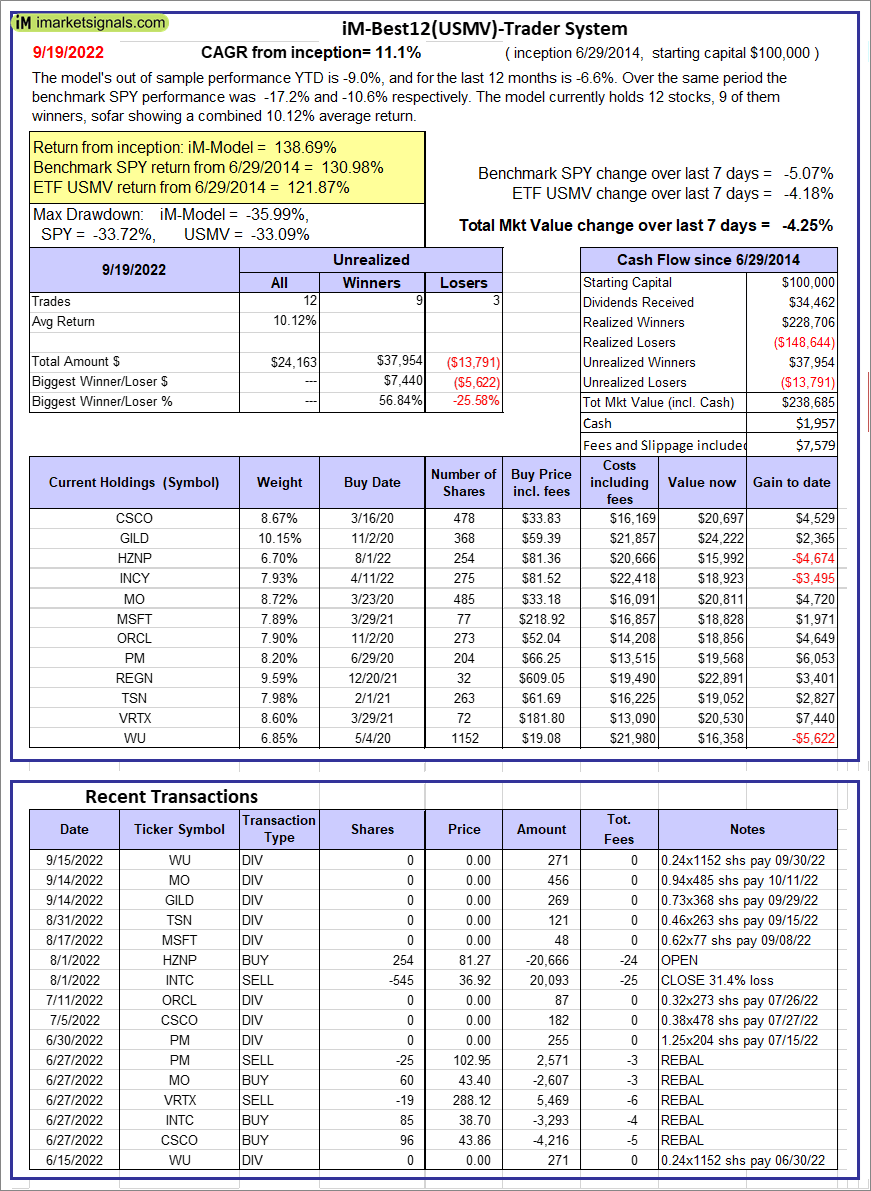 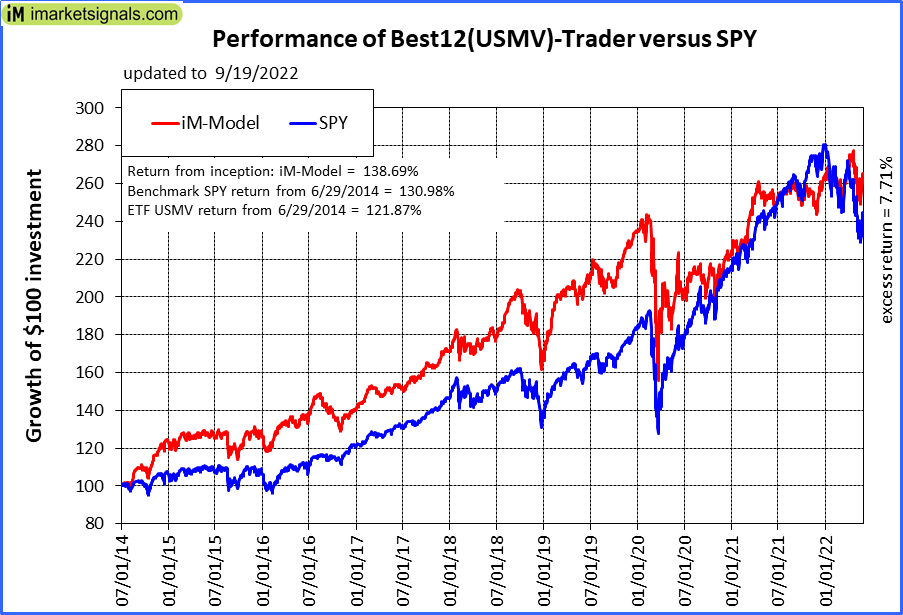 |
iM-Best12(USMV)-Trader: The model’s out of sample performance YTD is -9.0%, and for the last 12 months is -6.6%. Over the same period the benchmark SPY performance was -17.2% and -10.6% respectively. Since inception, on 6/30/2014, the model gained 138.69% while the benchmark SPY gained 130.98% and the ETF USMV gained 121.87% over the same period. Over the previous week the market value of iM-Best12(USMV)-Trader gained -4.25% at a time when SPY gained -5.07%. A starting capital of $100,000 at inception on 6/30/2014 would have grown to $238,685 which includes $1,957 cash and excludes $7,579 spent on fees and slippage. |
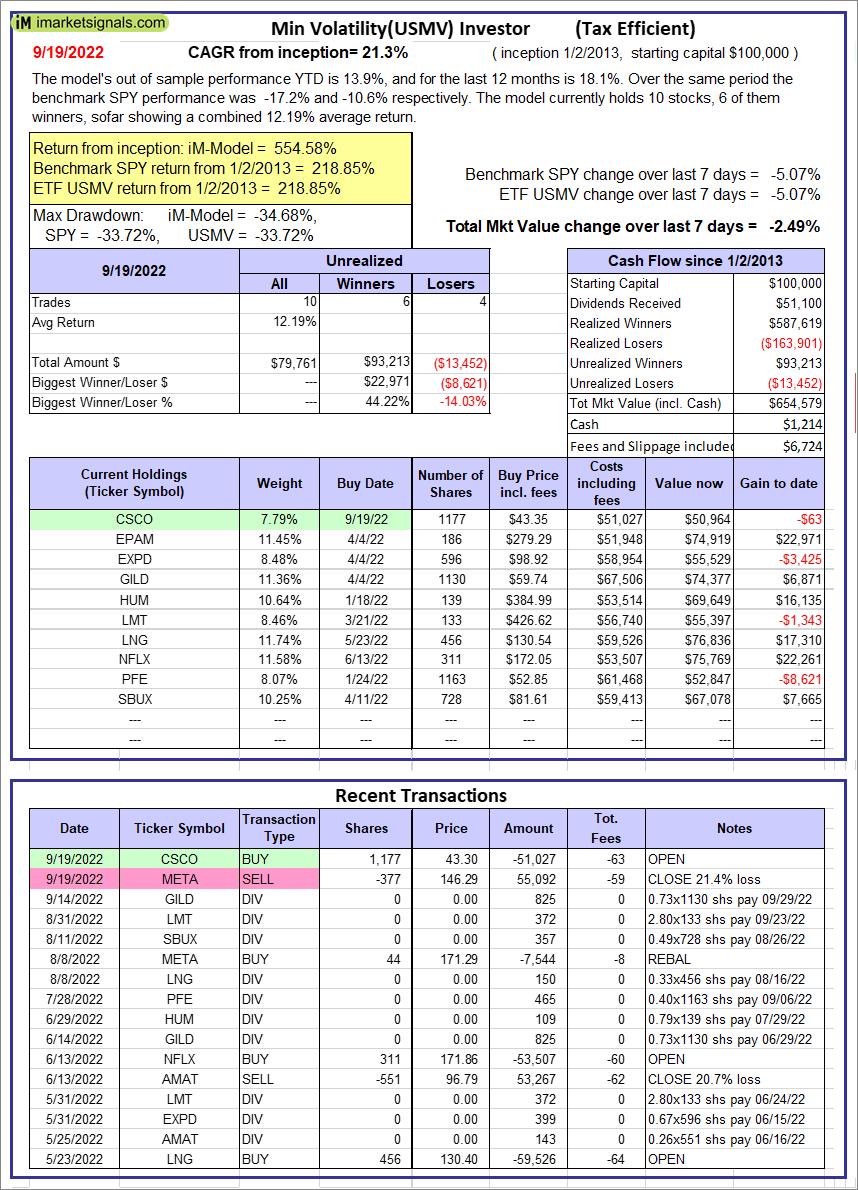 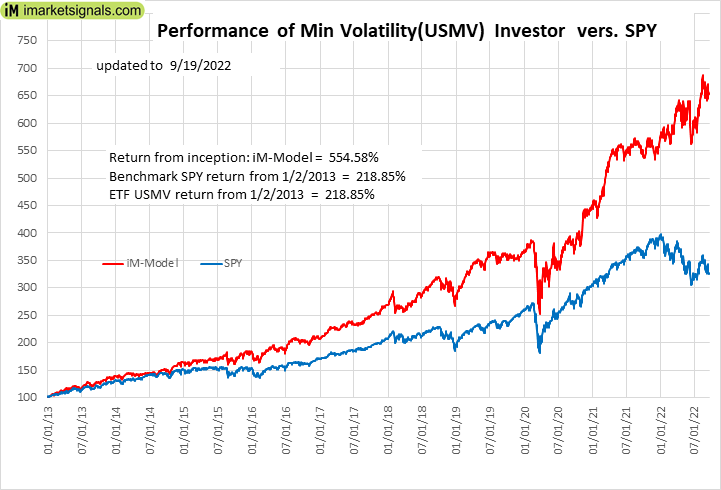 |
iM-Min Volatility(USMV) Investor (Tax Efficient): The model’s out of sample performance YTD is 13.9%, and for the last 12 months is 18.1%. Over the same period the benchmark SPY performance was -17.2% and -10.6% respectively. Since inception, on 1/3/2013, the model gained 554.58% while the benchmark SPY gained 218.85% and the ETF USMV gained 218.85% over the same period. Over the previous week the market value of iM-Best12(USMV)Q1 gained -2.49% at a time when SPY gained -5.07%. A starting capital of $100,000 at inception on 1/3/2013 would have grown to $654,579 which includes $1,214 cash and excludes $6,724 spent on fees and slippage. |
 |
iM-Bond Market Trader (High-Yield Bond or 10-yr Treasury Bond): The model’s out of sample performance YTD is -11.4%, and for the last 12 months is -12.2%. Over the same period the benchmark BND performance was -12.4% and -13.2% respectively. Over the previous week the market value of the iM-Bond Market Trader (High-Yield Bond or 10-yr Treasury Bond) gained -2.03% at a time when BND gained -0.85%. A starting capital of $10,000 at inception on 1/3/2000 would have grown to $134,618 which includes $1,746 cash and excludes $2,379 spent on fees and slippage. |
|
|
iM-ModSum/YieldCurve Timer: The model’s out of sample performance YTD is -15.7%, and for the last 12 months is -16.5%. Over the same period the benchmark SPY performance was -17.2% and -10.6% respectively. Over the previous week the market value of iM-PortSum/YieldCurve Timer gained -5.08% at a time when SPY gained -5.07%. A starting capital of $100,000 at inception on 1/1/2016 would have grown to $247,992 which includes $485 cash and excludes $1,114 spent on fees and slippage. |
 |
iM-Best2 MC-Score ETF System: The model’s out of sample performance YTD is -9.5%, and for the last 12 months is -2.1%. Over the same period the benchmark SPY performance was -17.2% and -10.6% respectively. Over the previous week the market value of the iM-Best2 MC-Score ETF System gained -4.34% at a time when SPY gained -5.07%. A starting capital of $100,000 at inception on 6/30/2016 would have grown to $140,955 which includes $77 cash and excludes $1,686 spent on fees and slippage. |
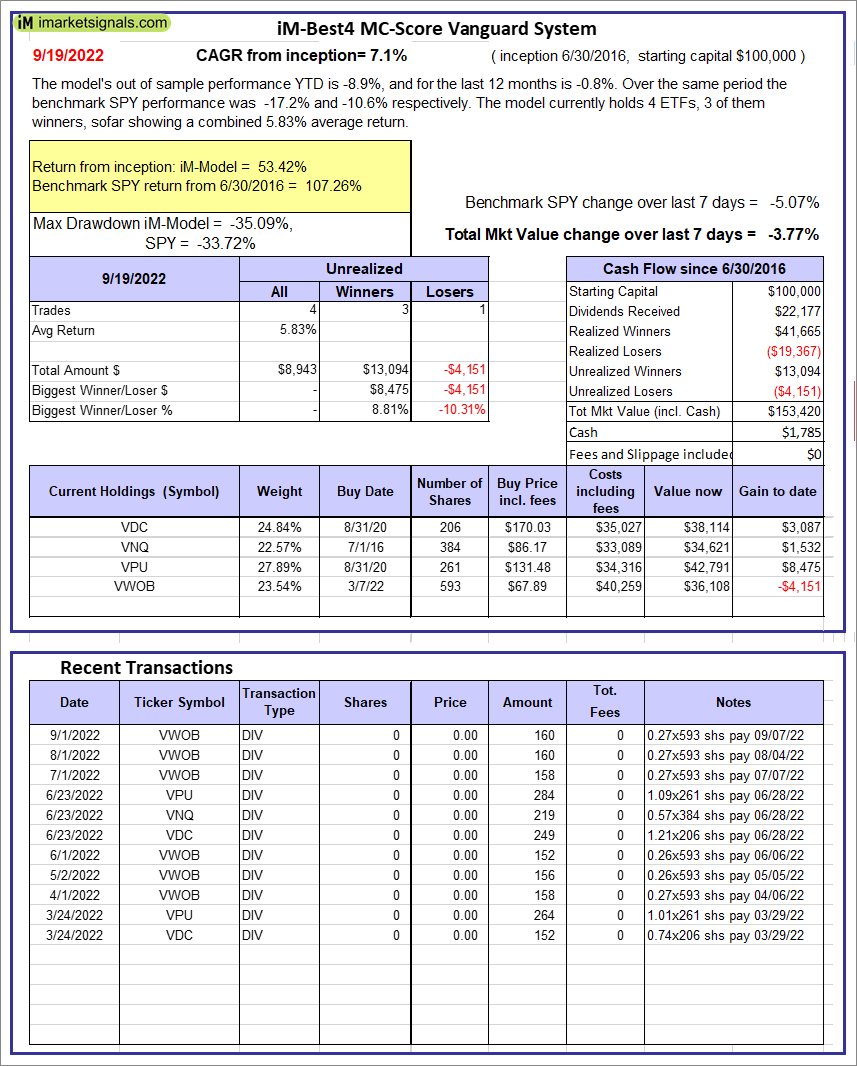 |
iM-Best4 MC-Score Vanguard System: The model’s out of sample performance YTD is -8.9%, and for the last 12 months is -0.8%. Over the same period the benchmark SPY performance was -17.2% and -10.6% respectively. Over the previous week the market value of the iM-Best4 MC-Score Vanguard System gained -3.77% at a time when SPY gained -5.07%. A starting capital of $100,000 at inception on 6/30/2016 would have grown to $153,420 which includes $1,785 cash and excludes $00 spent on fees and slippage. |
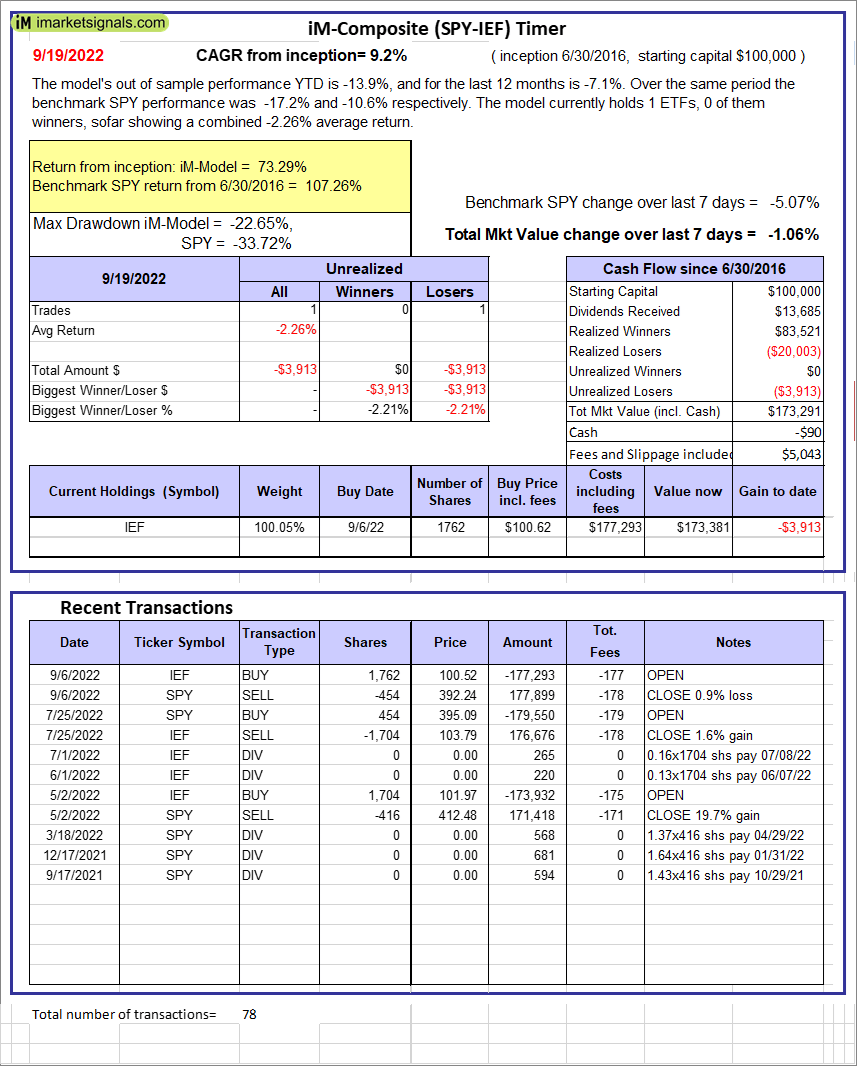 |
iM-Composite (SPY-IEF) Timer: The model’s out of sample performance YTD is -13.9%, and for the last 12 months is -7.1%. Over the same period the benchmark SPY performance was -17.2% and -10.6% respectively. Over the previous week the market value of the iM-Composite (SPY-IEF) Timer gained -1.06% at a time when SPY gained -5.07%. A starting capital of $100,000 at inception on 6/30/2016 would have grown to $173,291 which includes -$90 cash and excludes $5,043 spent on fees and slippage. |
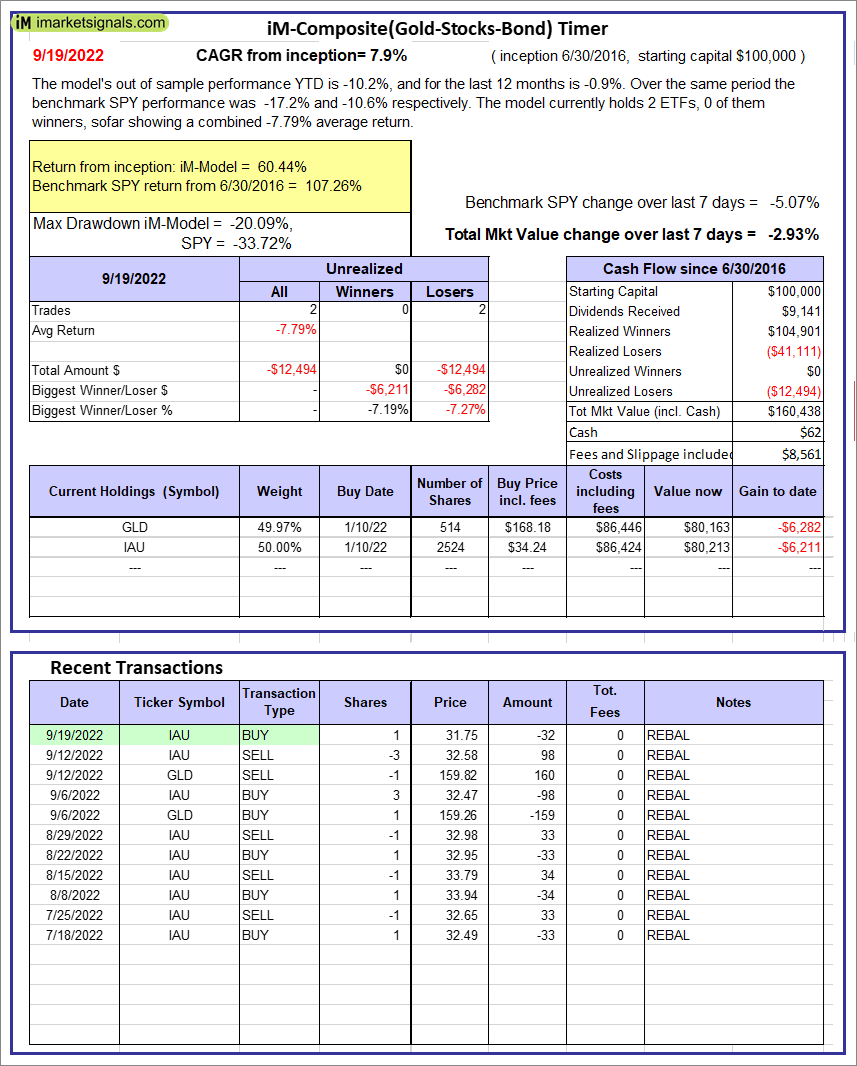 |
iM-Composite(Gold-Stocks-Bond) Timer: The model’s out of sample performance YTD is -10.2%, and for the last 12 months is -0.9%. Over the same period the benchmark SPY performance was -17.2% and -10.6% respectively. Over the previous week the market value of the iM-Composite(Gold-Stocks-Bond) Timer gained -2.93% at a time when SPY gained -5.07%. A starting capital of $100,000 at inception on 6/30/2016 would have grown to $160,438 which includes $62 cash and excludes $8,561 spent on fees and slippage. |
iM-Best Reports – 9/19/2022
Posted in pmp SPY-SH
Leave a Reply
You must be logged in to post a comment.