
  |
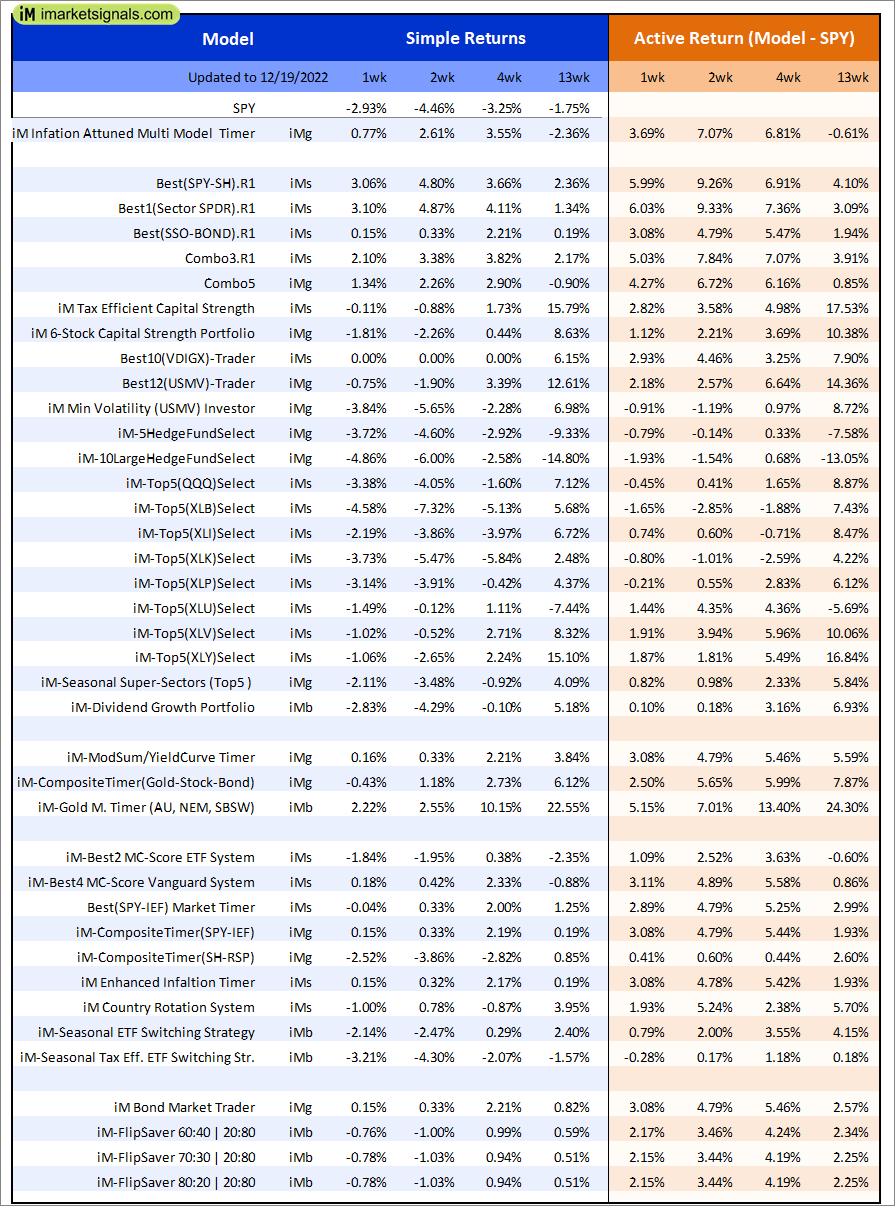
Out of sample performance summary of our models for the past 1, 2, 4 and 13 week periods. The active active return indicates how the models over- or underperformed the benchmark ETF SPY. Also the YTD, and the 1-, 3-, 5- and 10-year annualized returns are shown in the second table |
 |
iM-Inflation Attuned Multi-Model Market Timer: The model’s out of sample performance YTD is 23.3%, and for the last 12 months is 26.0%. Over the same period the benchmark SPY performance was -18.4% and -17.6% respectively. Over the previous week the market value of the iM-Inflation Attuned Multi-Model Market Timer gained 3.09% at a time when SPY gained 0.36%. A starting capital of $100,000 at inception on 3/24/2017 would have grown to $156,469,955 which includes $4,565,320 cash and excludes $1,880,882 spent on fees and slippage. |
 |
iM-FlipSaver 60:40 | 20:80 – 2017: The model’s out of sample performance YTD is -13.3%, and for the last 12 months is -12.7%. Over the same period the benchmark E60B40 performance was -15.7% and -15.3% respectively. Over the previous week the market value of iM-FlipSaver 80:20 | 20:80 gained -0.60% at a time when SPY gained -0.39%. A starting capital of $100,000 at inception on 7/16/2015 would have grown to $141,143 which includes $2,183 cash and excludes $2,673 spent on fees and slippage. |
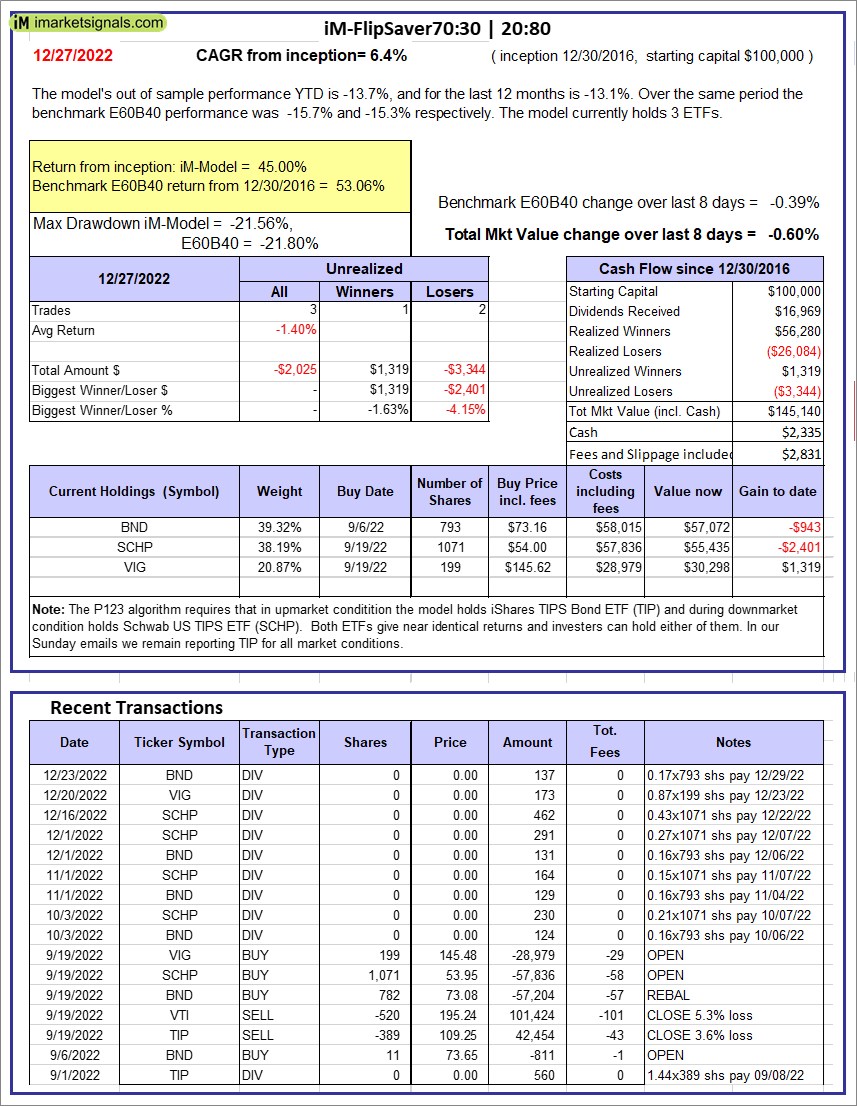 |
iM-FlipSaver 70:30 | 20:80 – 2017: The model’s out of sample performance YTD is -13.7%, and for the last 12 months is -13.1%. Over the same period the benchmark E60B40 performance was -15.7% and -15.3% respectively. Over the previous week the market value of iM-FlipSaver 70:30 | 20:80 gained -0.60% at a time when SPY gained -0.39%. A starting capital of $100,000 at inception on 7/15/2015 would have grown to $145,140 which includes $2,335 cash and excludes $2,831 spent on fees and slippage. |
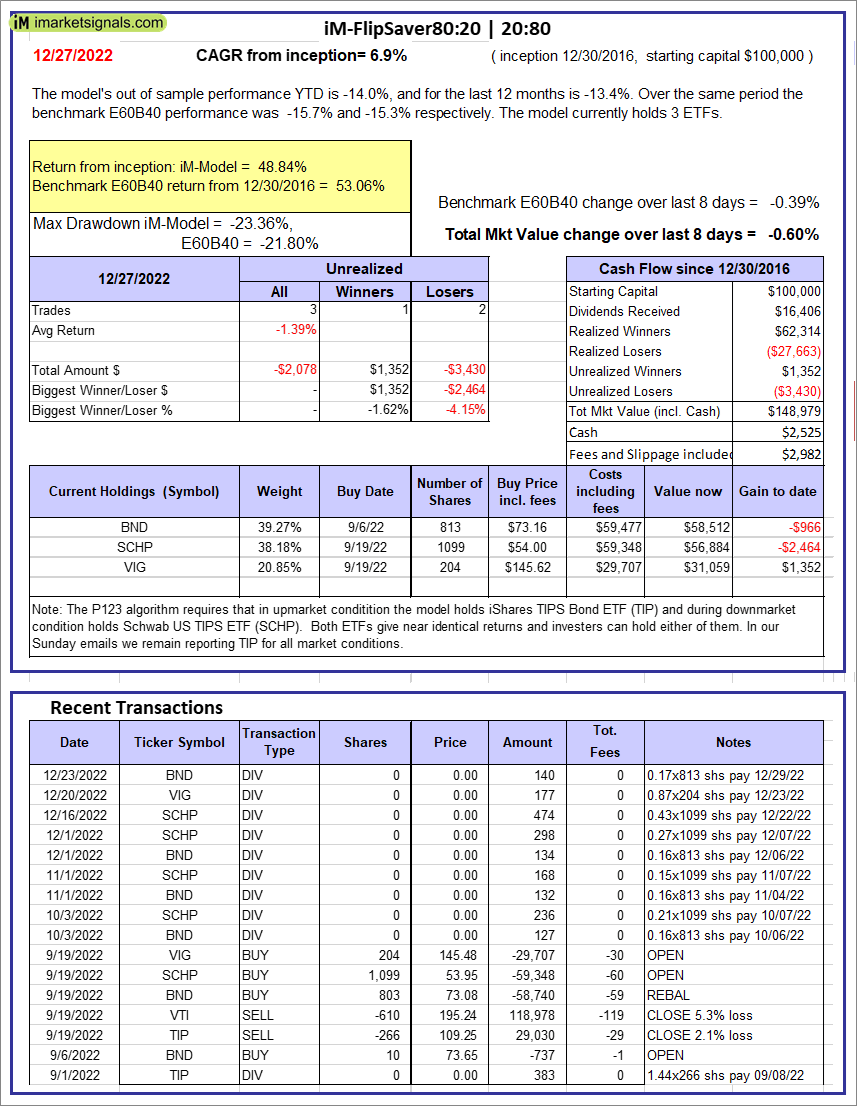 |
iM-FlipSaver 80:20 | 20:80 – 2017: The model’s out of sample performance YTD is -14.0%, and for the last 12 months is -13.4%. Over the same period the benchmark E60B40 performance was -15.7% and -15.3% respectively. Over the previous week the market value of iM-FlipSaver 80:20 | 20:80 gained -0.60% at a time when SPY gained -0.39%. A starting capital of $100,000 at inception on 1/2/2017 would have grown to $148,979 which includes $2,525 cash and excludes $2,982 spent on fees and slippage. |
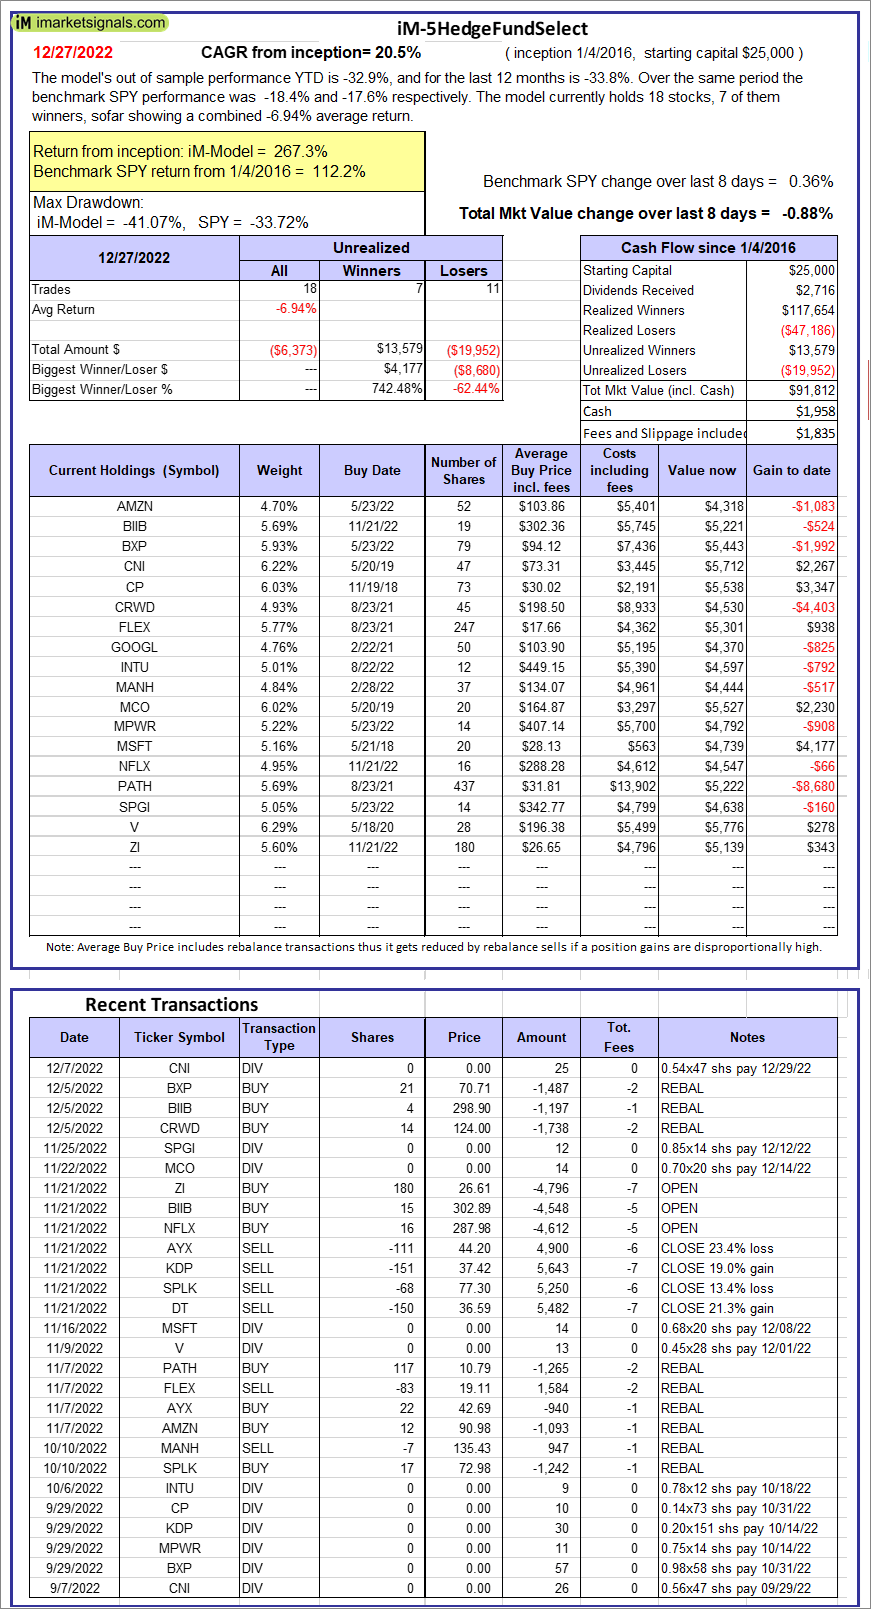  |
iM-5HedgeFundSelect: Since inception, on 1/5/2016, the model gained 267.25% while the benchmark SPY gained 112.18% over the same period. Over the previous week the market value of iM-5HedgeFundSelect gained -0.88% at a time when SPY gained 0.36%. A starting capital of $25,000 at inception on 1/5/2016 would have grown to $91,812 which includes $1,958 cash and excludes $1,835 spent on fees and slippage. |
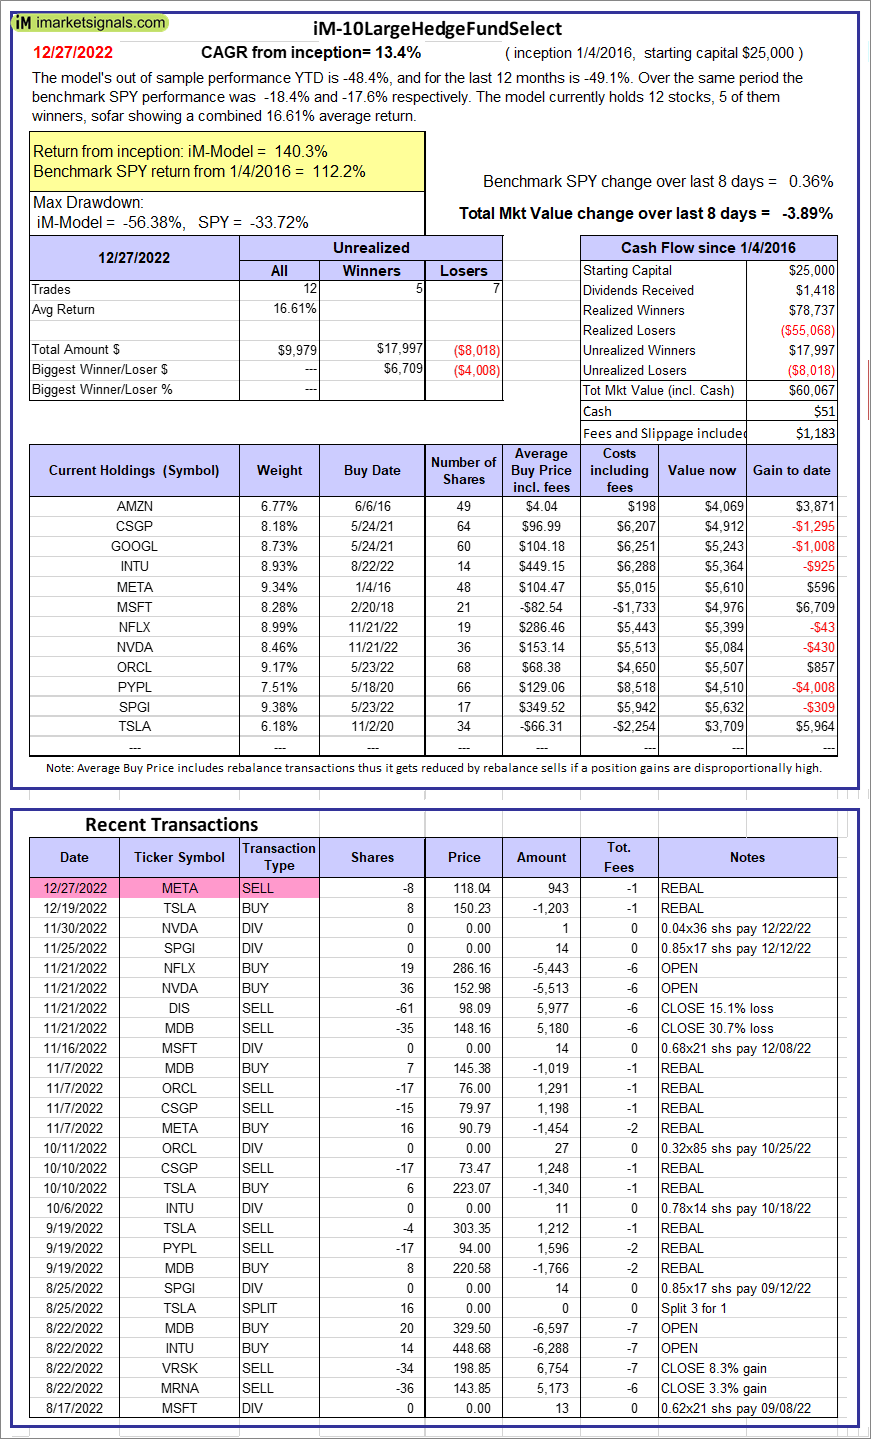 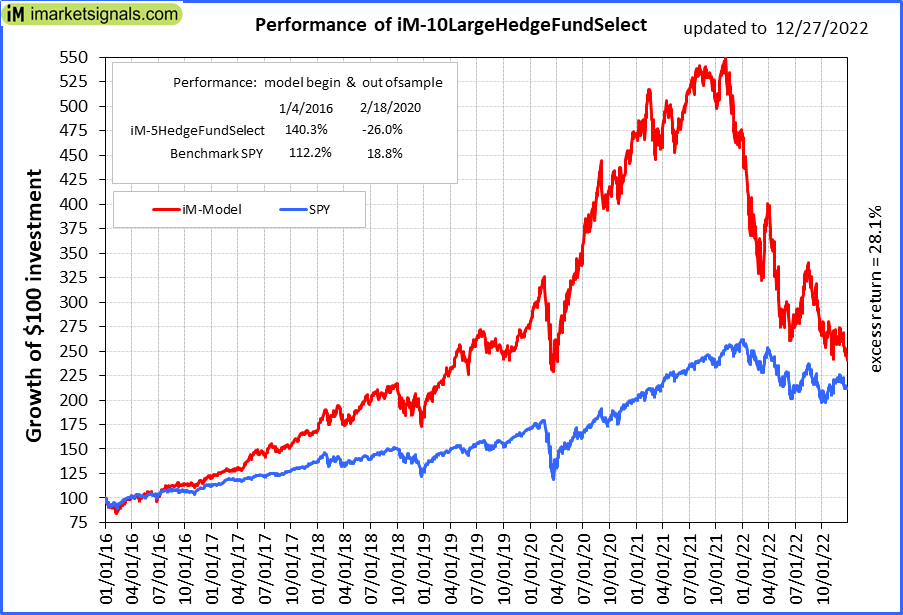 |
iM-10LargeHedgeFundSelect: Since inception, on 1/5/2016, the model gained 140.27% while the benchmark SPY gained 112.18% over the same period. Over the previous week the market value of iM-10LargeHedgeFundSelect gained -3.89% at a time when SPY gained 0.36%. A starting capital of $25,000 at inception on 1/5/2016 would have grown to $60,067 which includes $51 cash and excludes $1,183 spent on fees and slippage. |
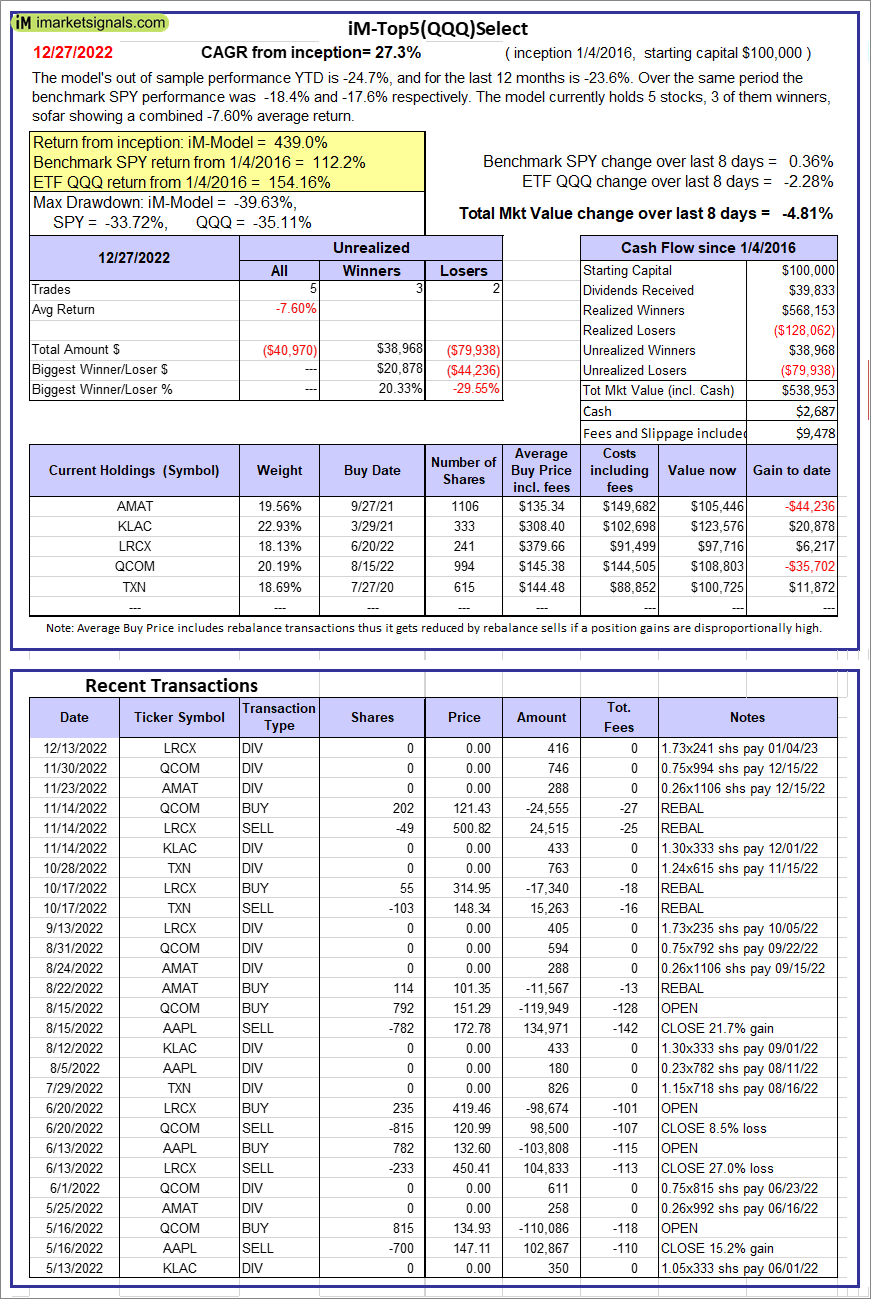  |
iM-Top5(QQQ)Select: Since inception, on 1/5/2016, the model gained 438.95% while the benchmark SPY gained 112.18% over the same period. Over the previous week the market value of iM-Top5(QQQ)Select gained -4.81% at a time when SPY gained 0.36%. A starting capital of $100,000 at inception on 1/5/2016 would have grown to $538,953 which includes $2,687 cash and excludes $9,478 spent on fees and slippage. |
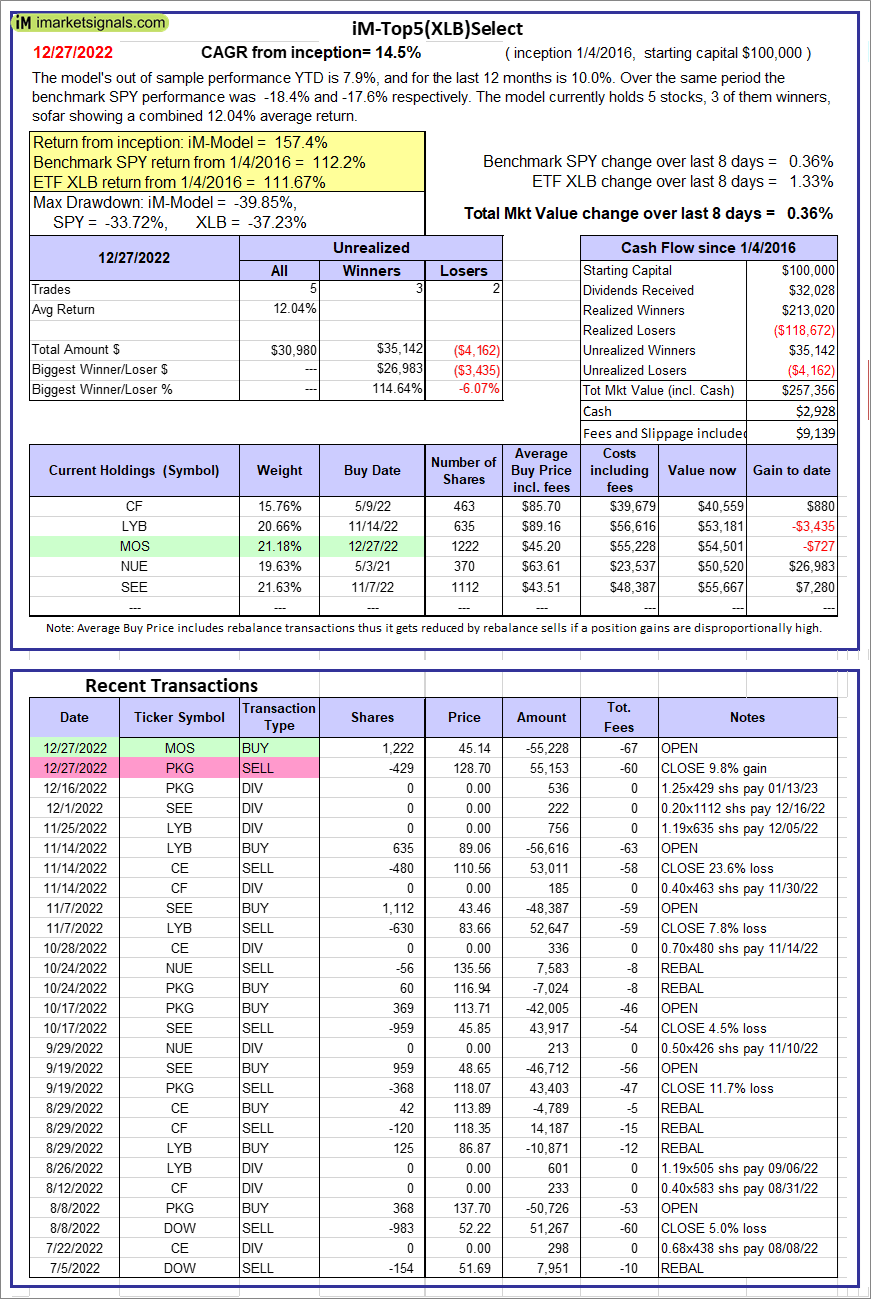 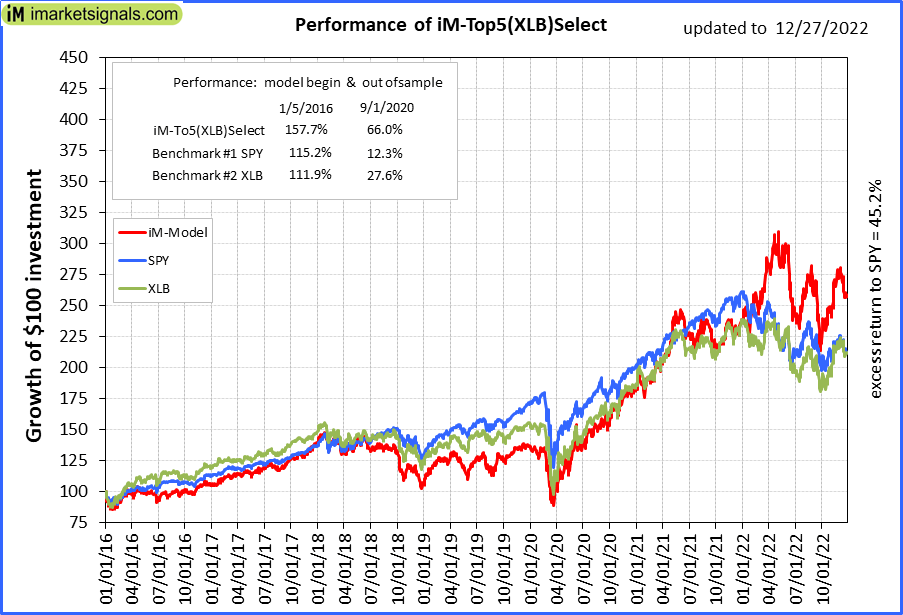 |
iM-Top5(XLB)Select: Since inception, on 1/5/2016, the model gained 157.36% while the benchmark SPY gained 112.18% over the same period. Over the previous week the market value of iM-Top5(XLB)Select gained 0.36% at a time when SPY gained 0.36%. A starting capital of $100,000 at inception on 1/5/2016 would have grown to $257,356 which includes $2,928 cash and excludes $9,139 spent on fees and slippage. |
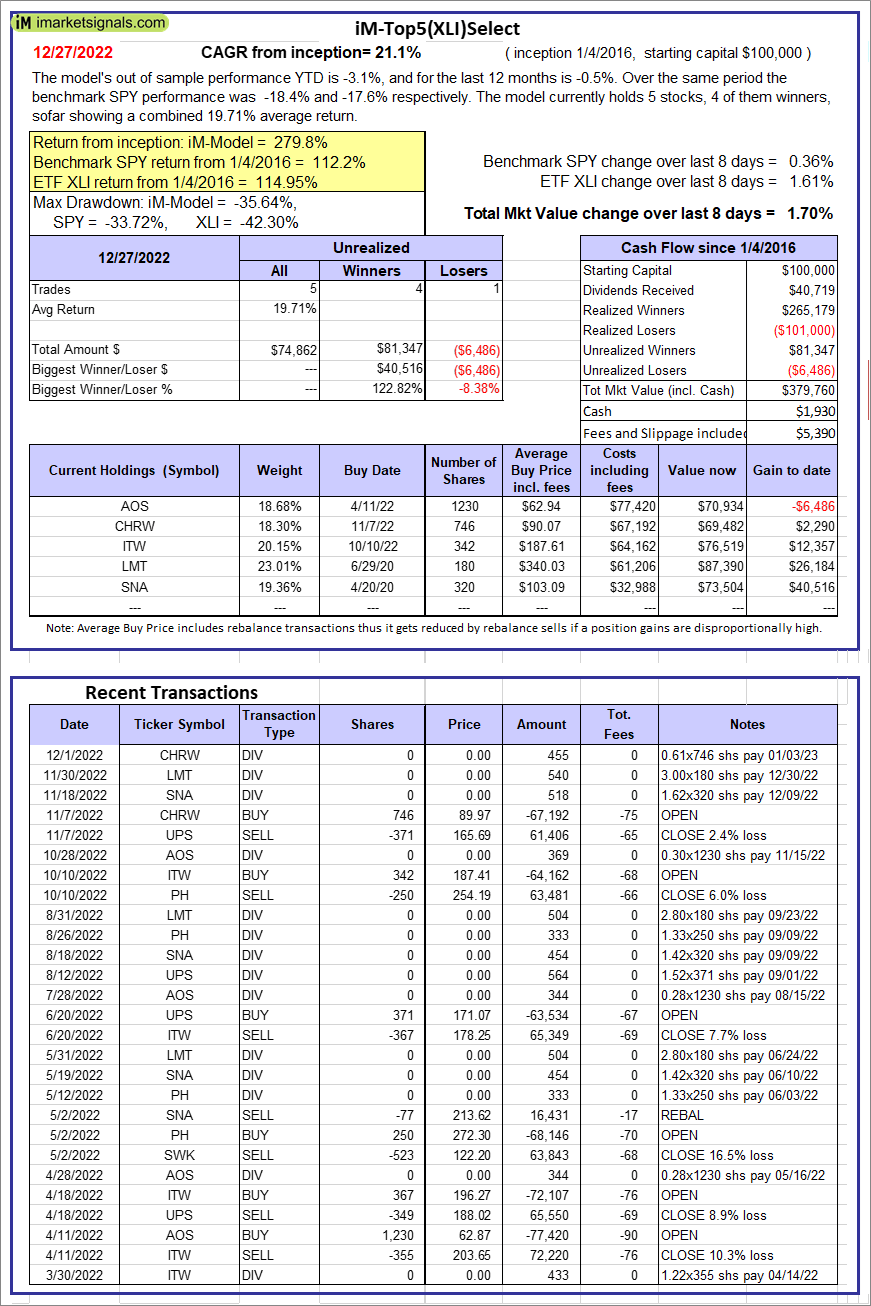  |
iM-Top5(XLI)Select: Since inception, on 1/5/2016, the model gained 279.76% while the benchmark SPY gained 112.18% over the same period. Over the previous week the market value of iM-Top5(XLI)Select gained 1.70% at a time when SPY gained 0.36%. A starting capital of $100,000 at inception on 1/5/2016 would have grown to $379,760 which includes $1,930 cash and excludes $5,390 spent on fees and slippage. |
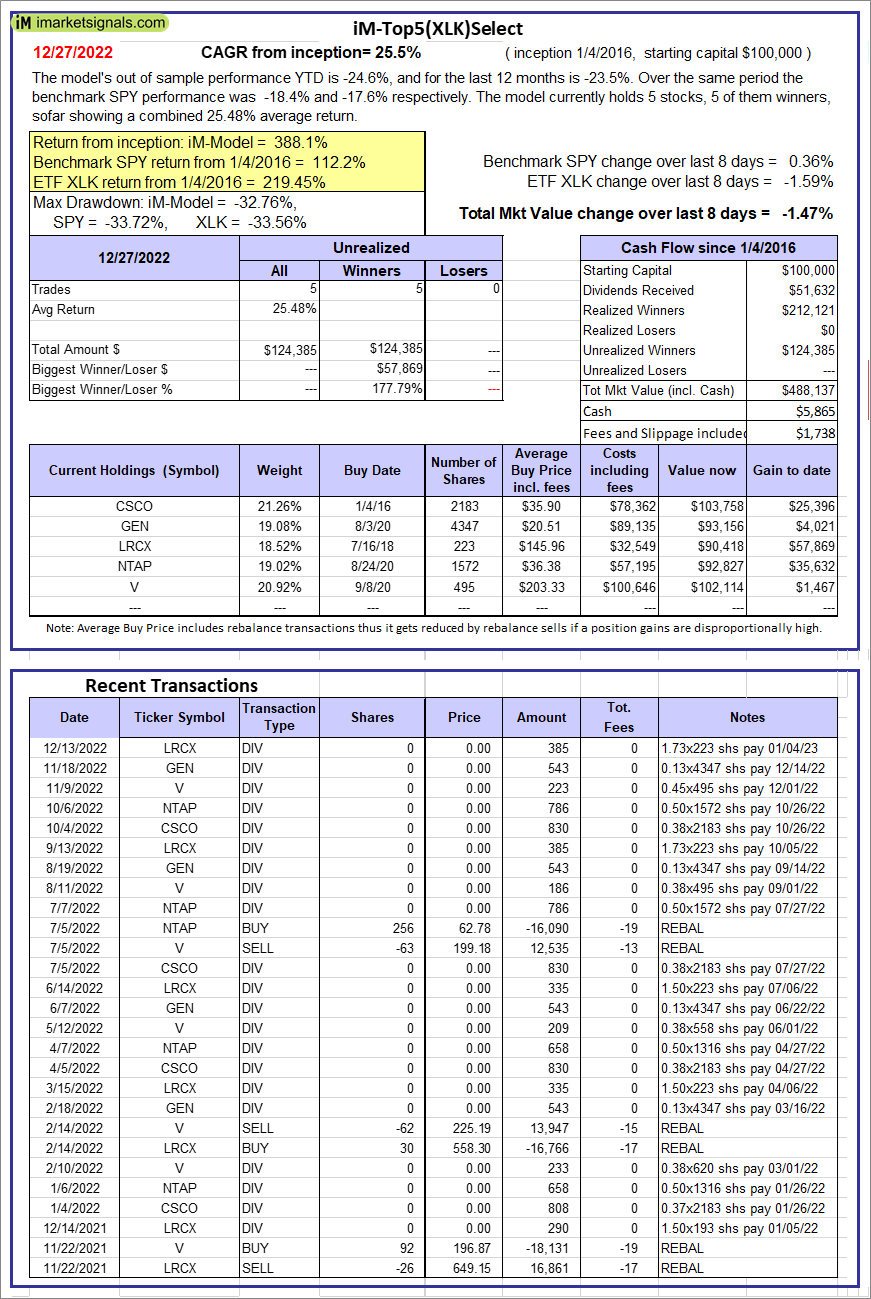 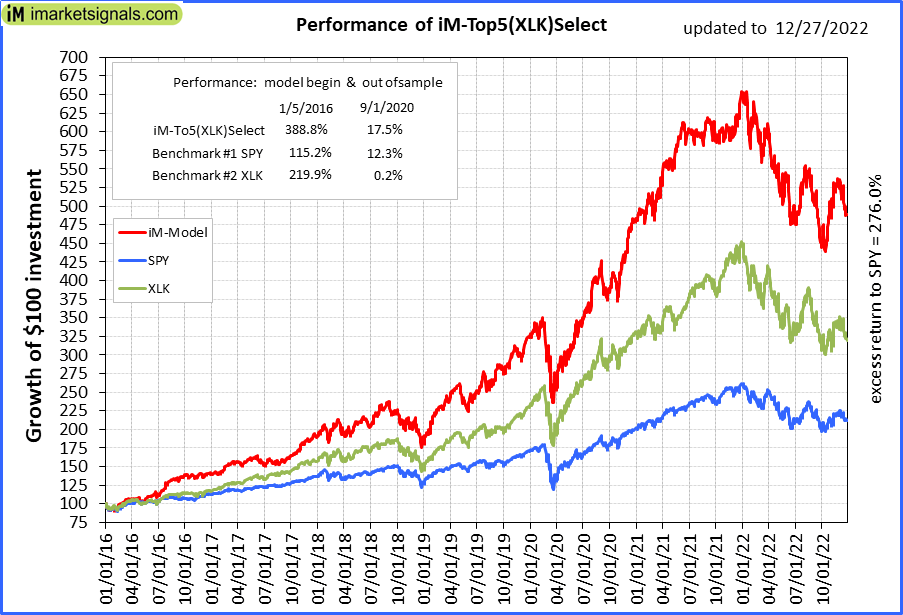 |
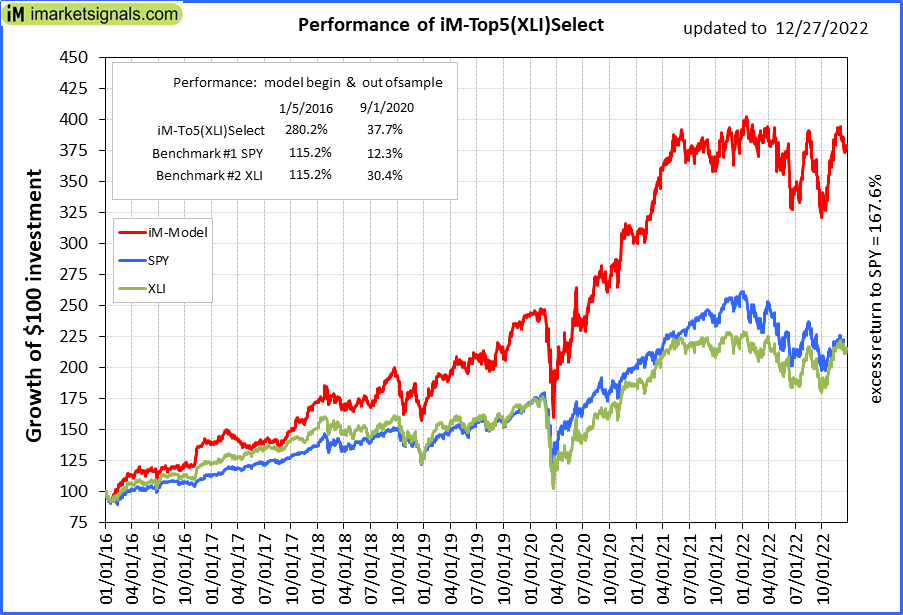
iM-Top5(XLK)Select: Since inception, on 1/5/2016, the model gained 388.14% while the benchmark SPY gained 112.18% over the same period. Over the previous week the market value of iM-Top5(XLK)Select gained -1.47% at a time when SPY gained 0.36%. A starting capital of $100,000 at inception on 1/5/2016 would have grown to $488,137 which includes $5,865 cash and excludes $1,738 spent on fees and slippage. |
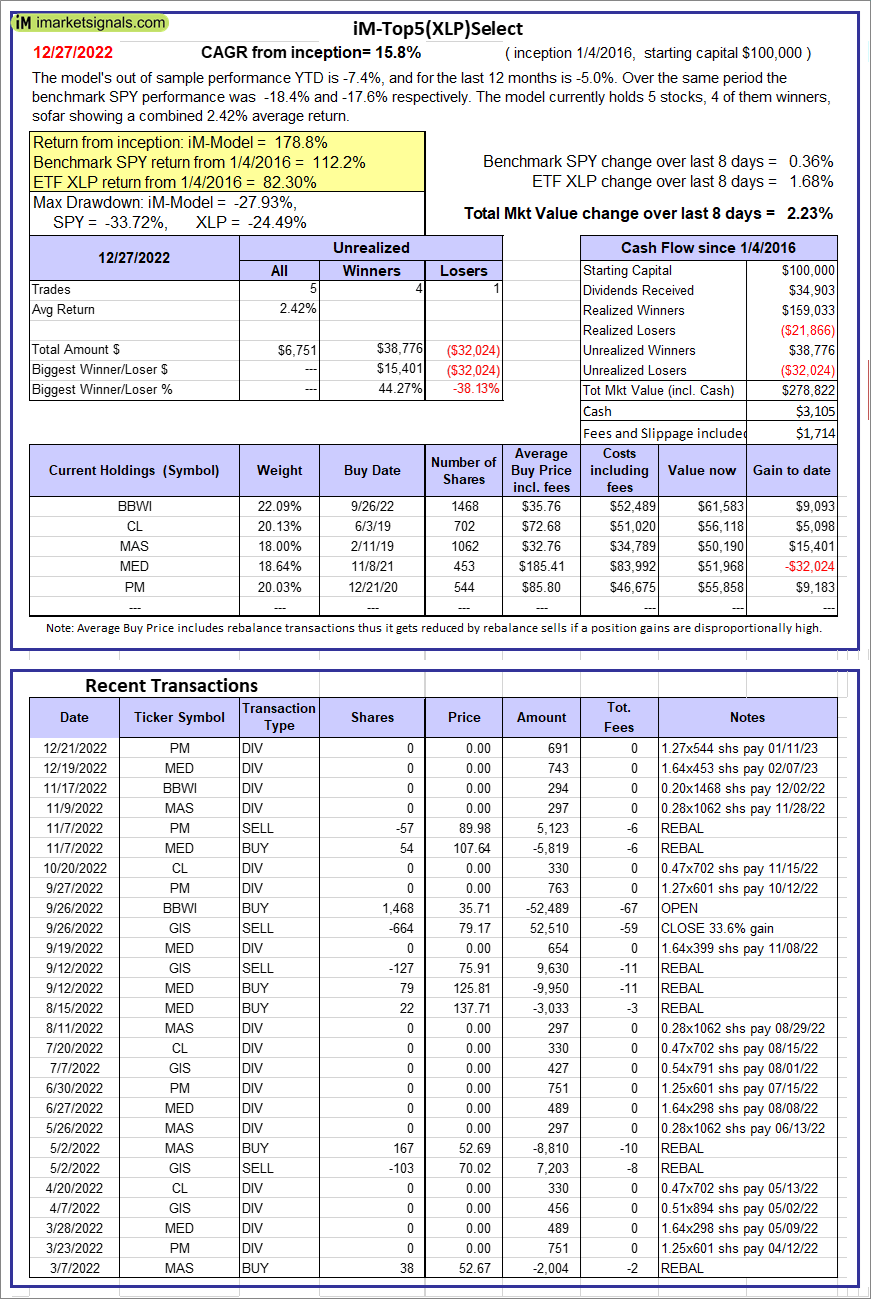 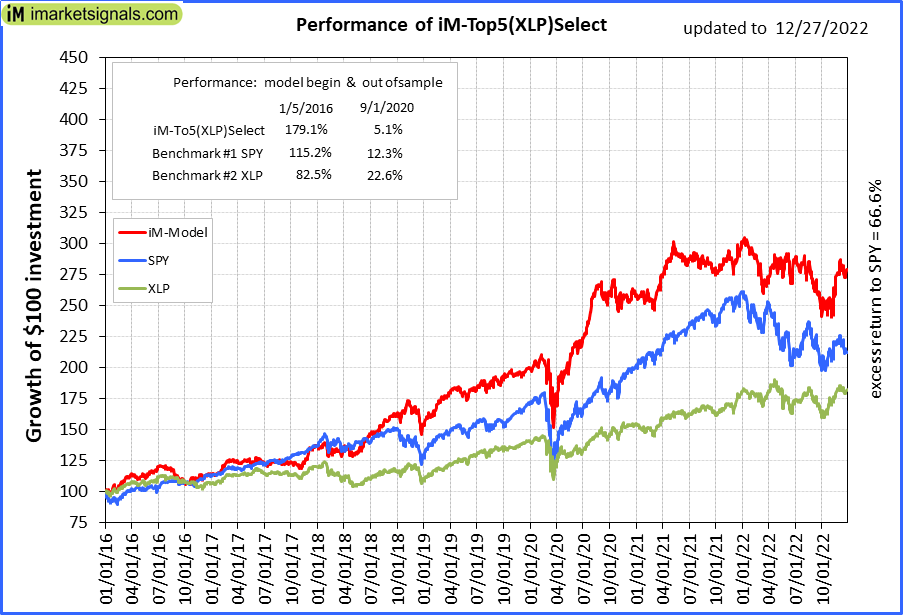 |
iM-Top5(XLP)Select: Since inception, on 1/5/2016, the model gained 178.82% while the benchmark SPY gained 112.18% over the same period. Over the previous week the market value of iM-Top5(XLP)Select gained 2.23% at a time when SPY gained 0.36%. A starting capital of $100,000 at inception on 1/5/2016 would have grown to $278,822 which includes $3,105 cash and excludes $1,714 spent on fees and slippage. |
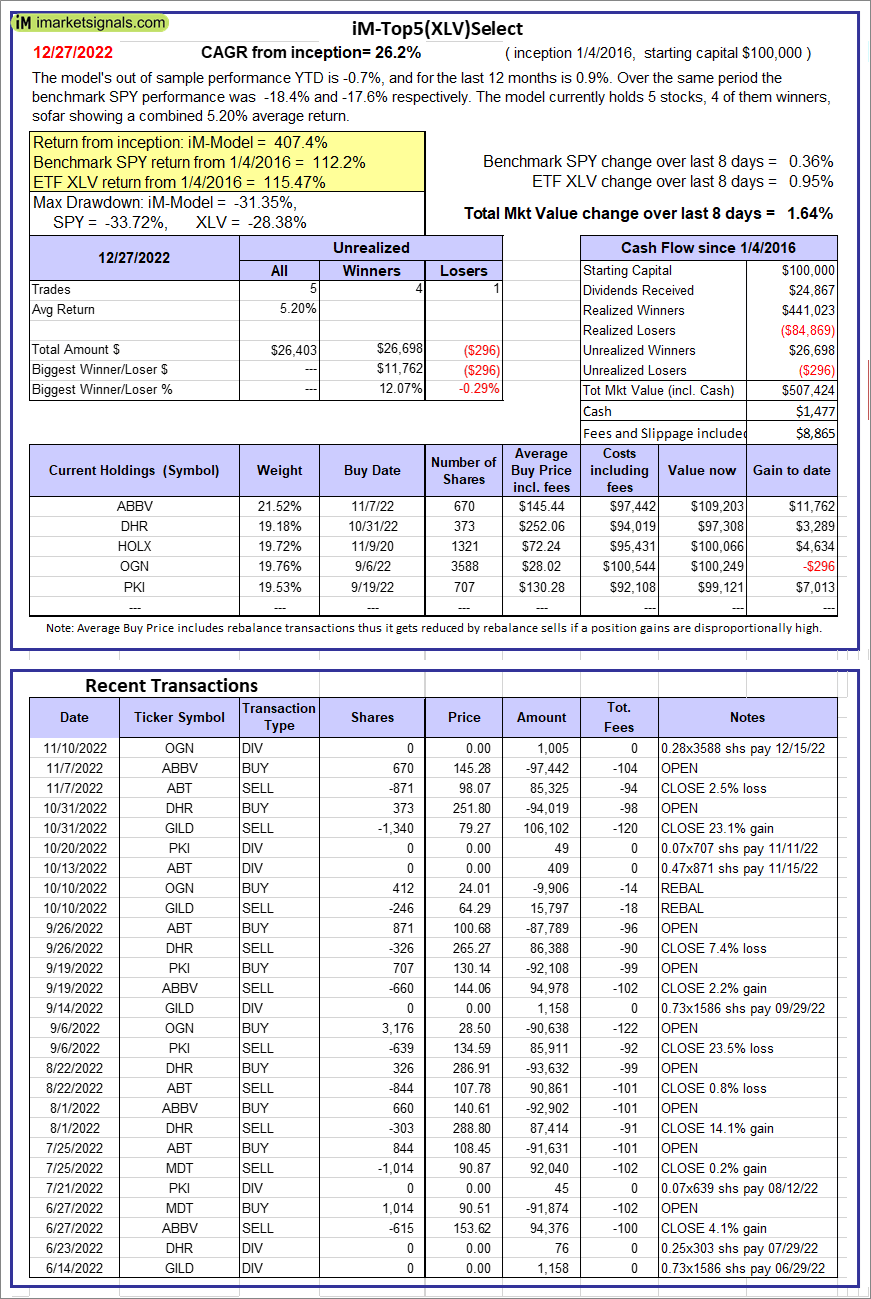 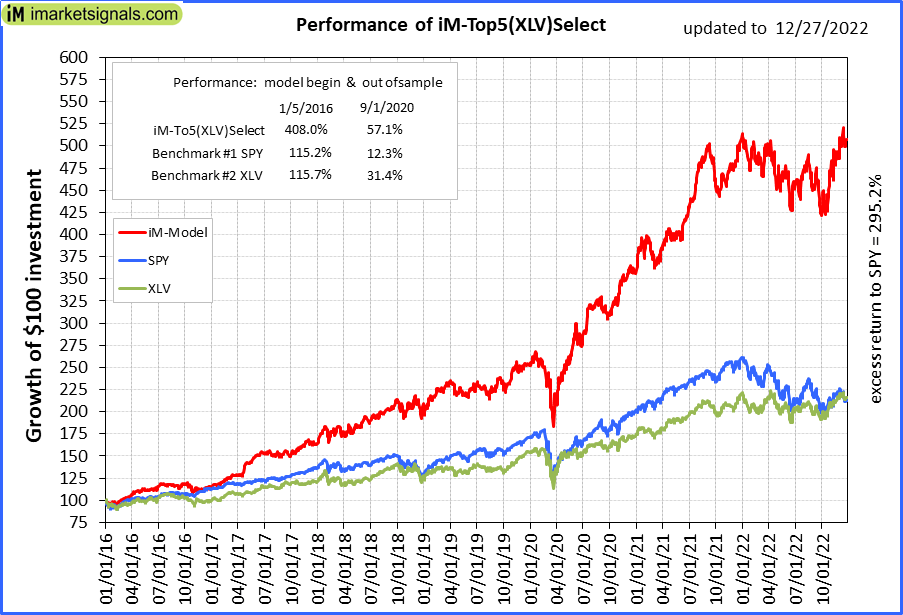 |
iM-Top5(XLV)Select: Since inception, on 1/5/2016, the model gained 407.42% while the benchmark SPY gained 112.18% over the same period. Over the previous week the market value of iM-Top5(XLV)Select gained 1.64% at a time when SPY gained 0.36%. A starting capital of $100,000 at inception on 1/5/2016 would have grown to $507,424 which includes $1,477 cash and excludes $8,865 spent on fees and slippage. |
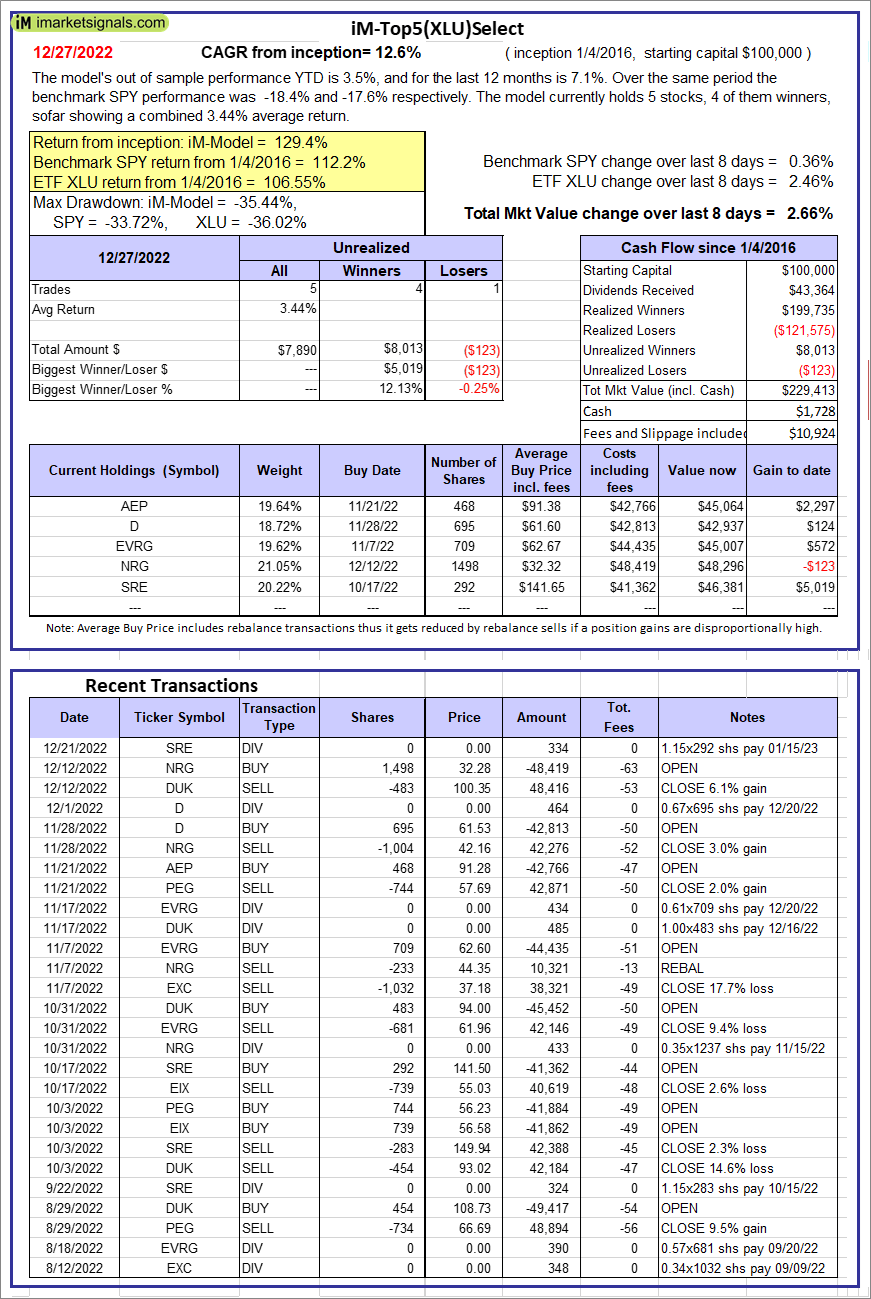 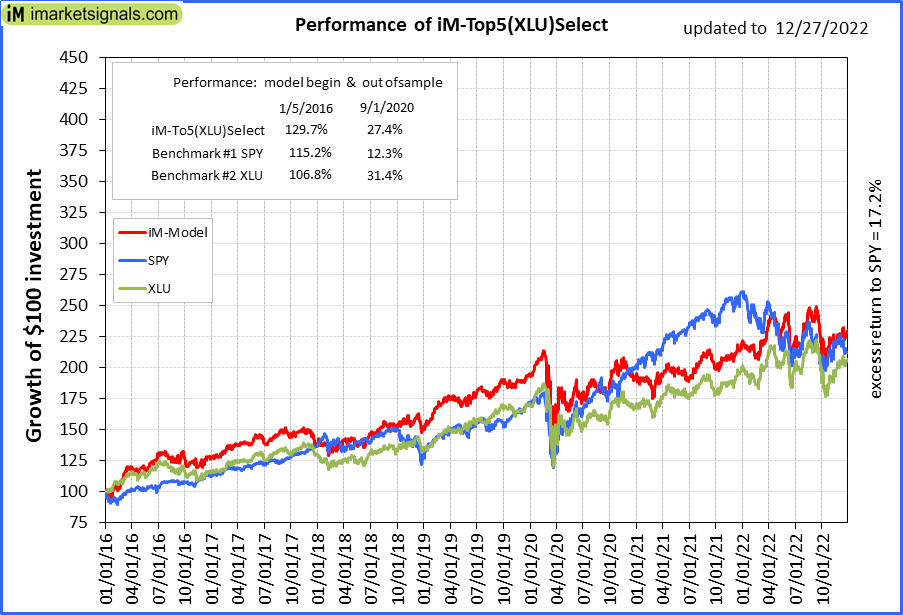 |
iM-Top5(XLU)Select: Since inception, on 1/5/2016, the model gained 129.41% while the benchmark SPY gained 112.18% over the same period. Over the previous week the market value of iM-Top5(XLU)Select gained 2.66% at a time when SPY gained 0.36%. A starting capital of $100,000 at inception on 1/5/2016 would have grown to $229,413 which includes $1,728 cash and excludes $10,924 spent on fees and slippage. |
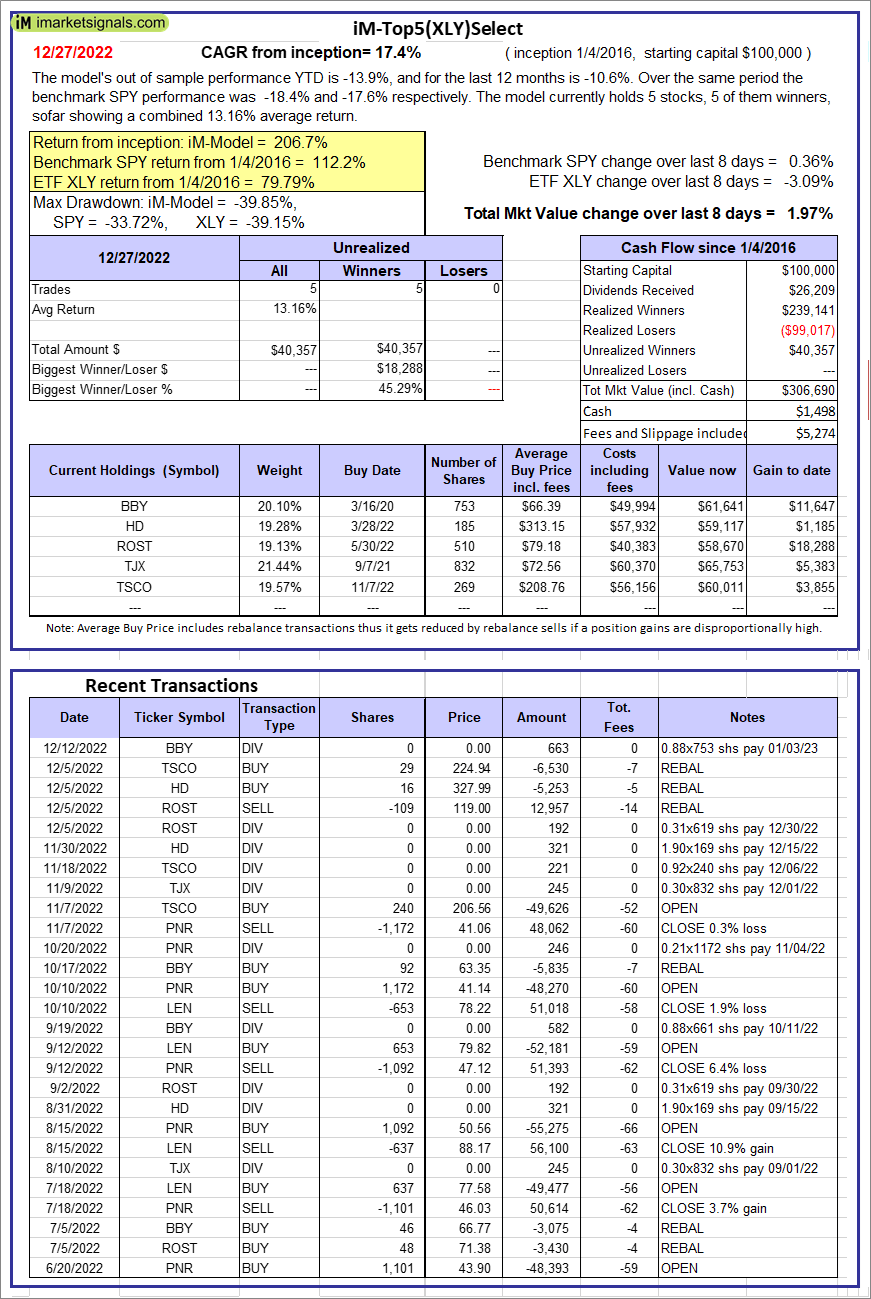  |
iM-Top5(XLY)Select: Since inception, on 1/5/2016, the model gained 206.69% while the benchmark SPY gained 112.18% over the same period. Over the previous week the market value of iM-Top5(XLY)Select gained 1.97% at a time when SPY gained 0.36%. A starting capital of $100,000 at inception on 1/5/2016 would have grown to $306,690 which includes $1,498 cash and excludes $5,274 spent on fees and slippage. |
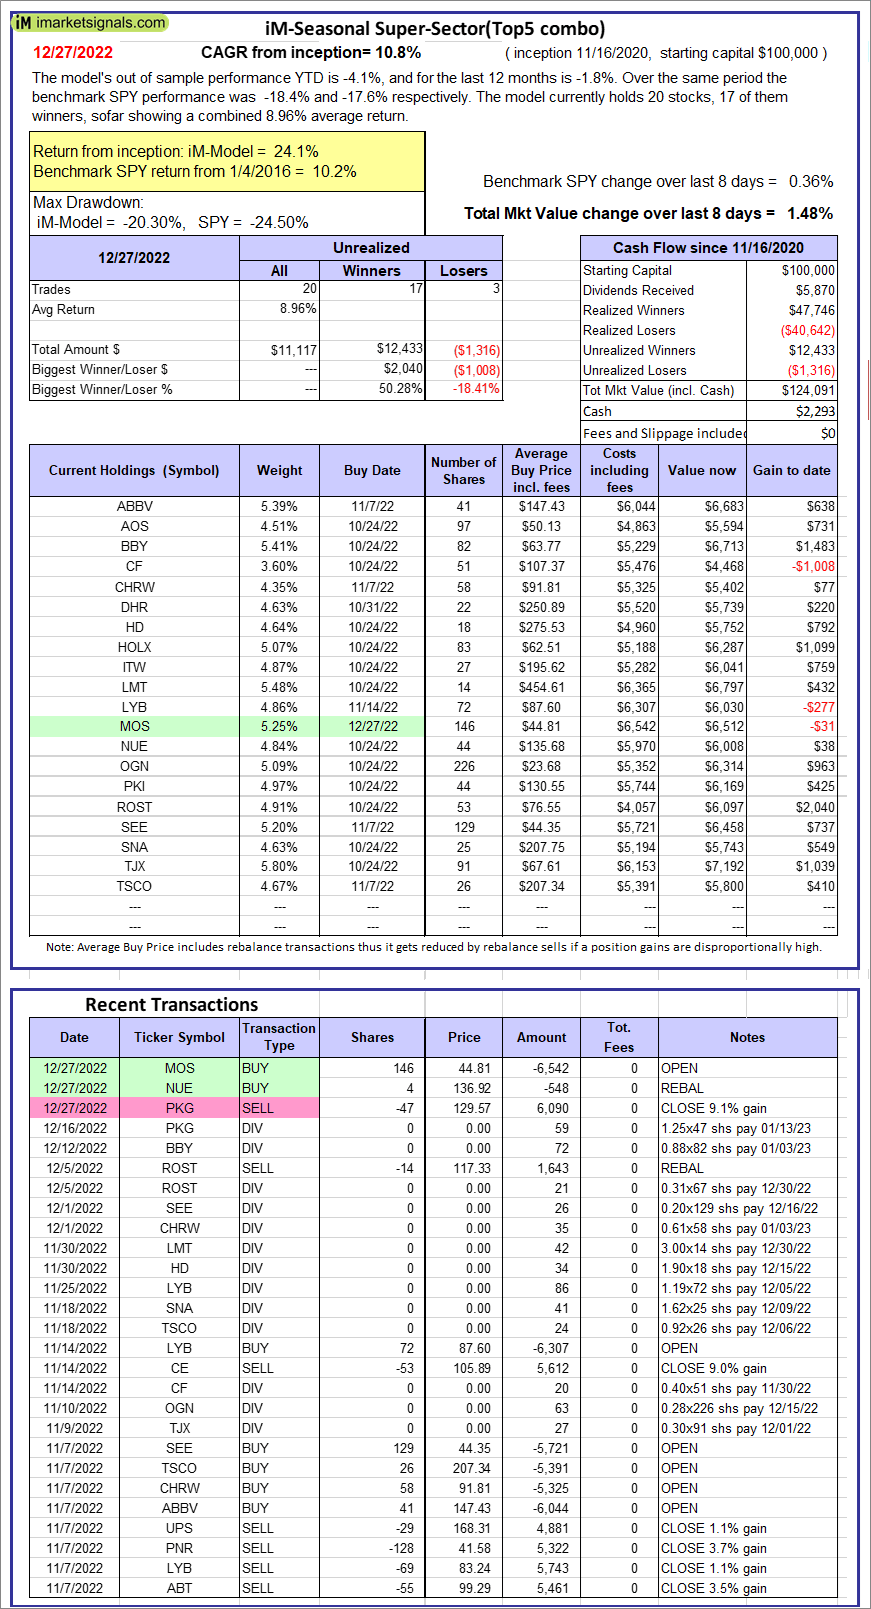 |
iM-Seasonal Super-Sectors (Top5 combo) : Since inception, on 11/17/2020, the model gained 24.09% while the benchmark SPY gained 10.15% over the same period. Over the previous week the market value of iM-Seasonal Super-Sectors (Top5 combo) gained 1.48% at a time when SPY gained 0.36%. A starting capital of $100,000 at inception on 11/17/2020 would have grown to $124,091 which includes $2,293 cash and excludes $00 spent on fees and slippage. |
 |
iM-Dividend Growth Portfolio: The model’s out of sample performance YTD is -9.5%, and for the last 12 months is -7.9%. Over the same period the benchmark SPY performance was -18.4% and -17.6% respectively. Over the previous week the market value of the iM-Dividend Growth Portfolio gained 0.49% at a time when SPY gained 0.36%. A starting capital of $100,000 at inception on 6/30/2016 would have grown to $364,217 which includes $4,661 cash and excludes $8,857 spent on fees and slippage. |
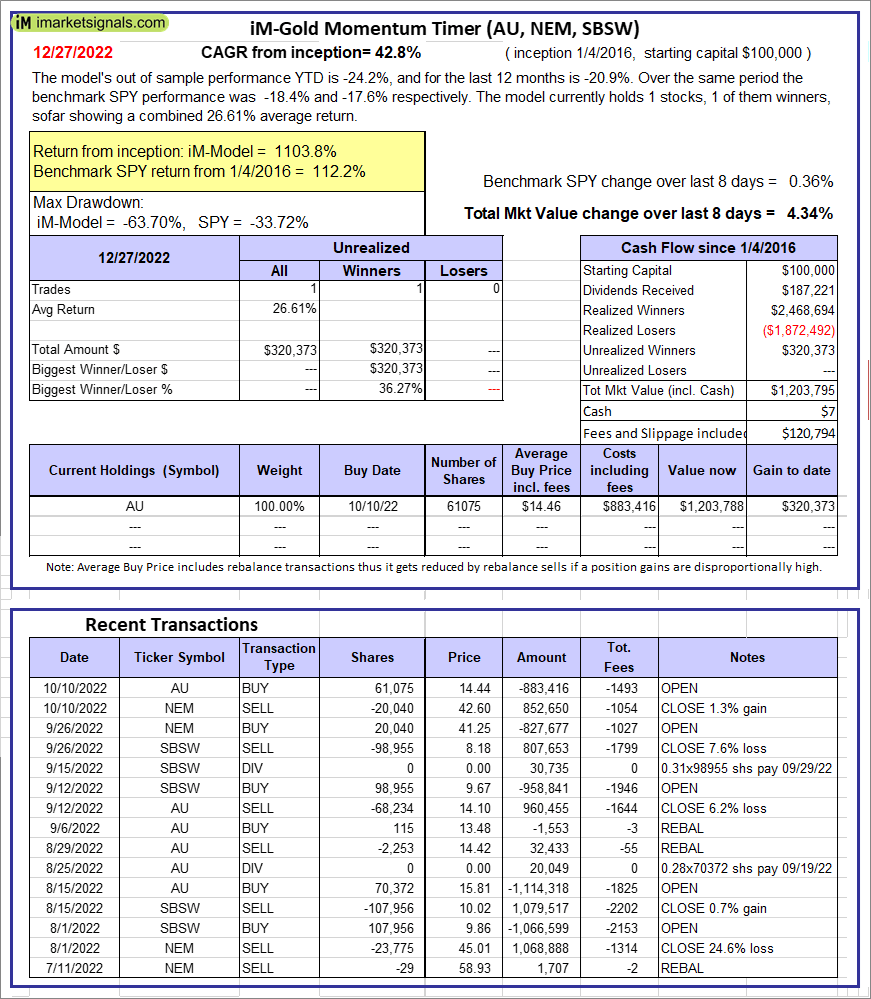 |
iM-Gold Momentum Timer (AU, NEM, SBSW): The model’s out of sample performance YTD is -24.2%, and for the last 12 months is -20.9%. Over the same period the benchmark SPY performance was -18.4% and -17.6% respectively. Over the previous week the market value of iM-Gold Momentum Timer (AU, NEM, SBSW) gained 4.34% at a time when SPY gained 0.36%. A starting capital of $100,000 at inception on 6/30/2016 would have grown to $07 which includes $120,794 cash and excludes Gain to date spent on fees and slippage. |
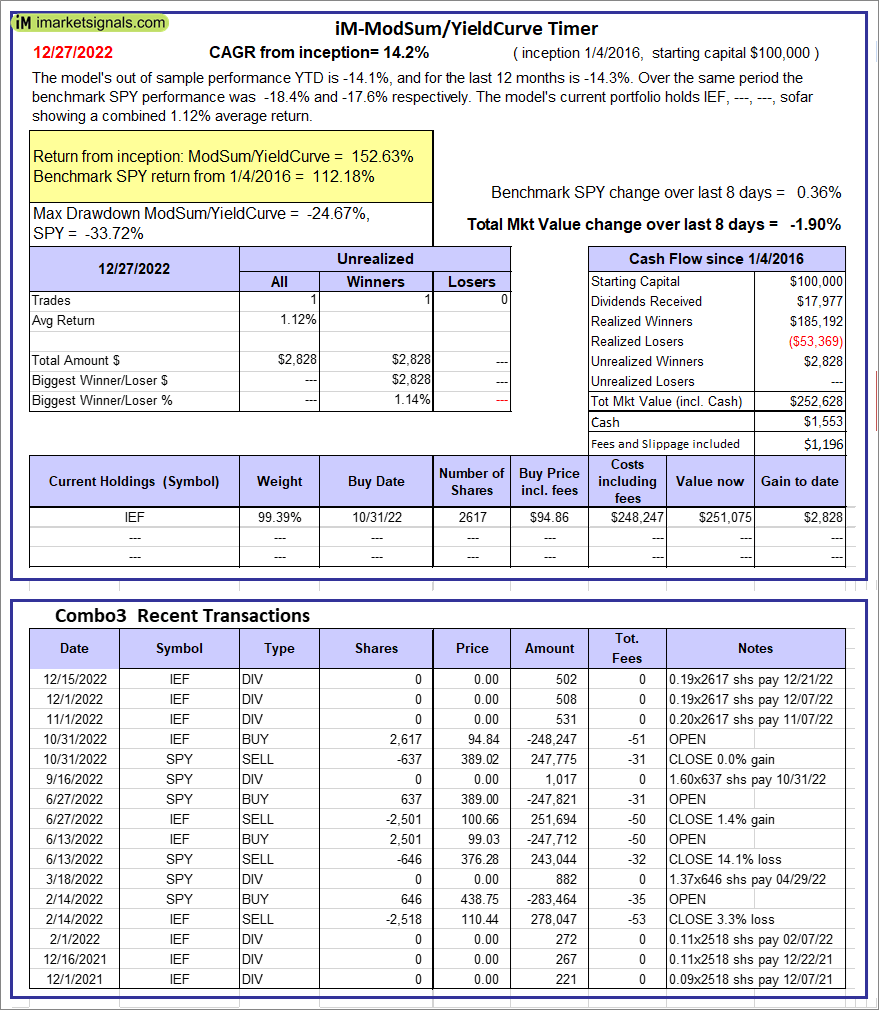 |
iM-ModSum/YieldCurve Timer: The model’s out of sample performance YTD is -14.1%, and for the last 12 months is -14.3%. Over the same period the benchmark SPY performance was -18.4% and -17.6% respectively. Over the previous week the market value of iM-PortSum/YieldCurve Timer gained -1.90% at a time when SPY gained 0.36%. A starting capital of $100,000 at inception on 1/1/2016 would have grown to $252,628 which includes $1,553 cash and excludes $1,196 spent on fees and slippage. |
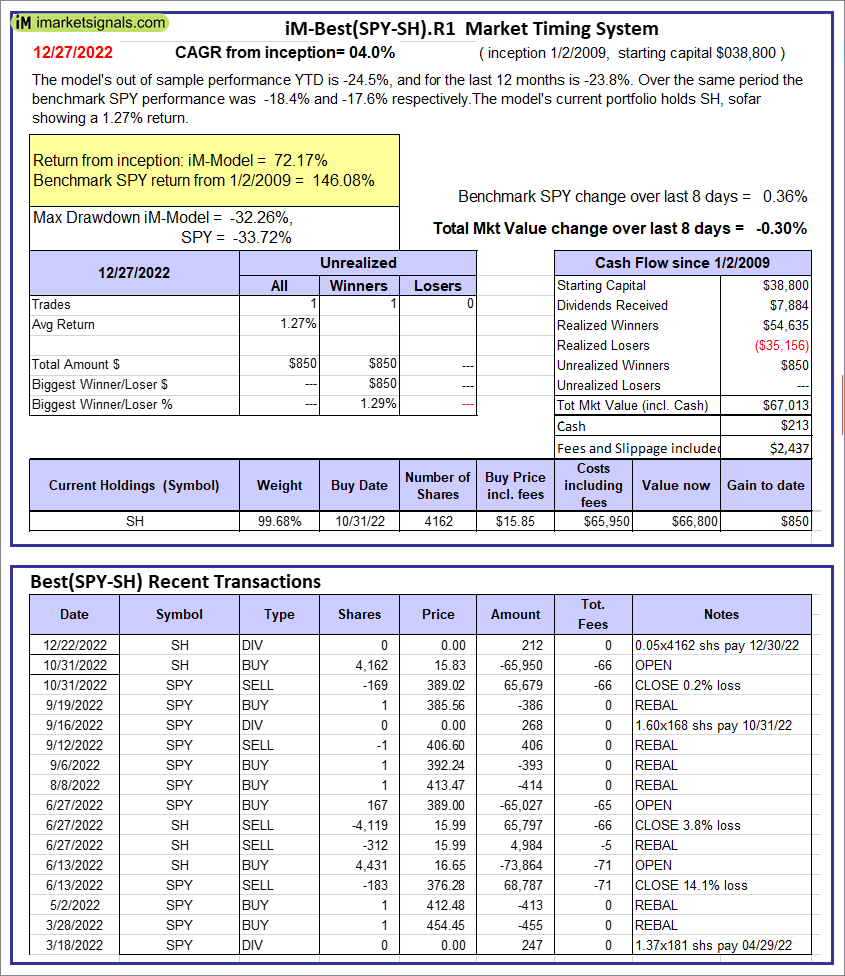 |
iM-Best(SPY-SH).R1: The model’s out of sample performance YTD is -24.5%, and for the last 12 months is -23.8%. Over the same period the benchmark SPY performance was -18.4% and -17.6% respectively. Over the previous week the market value of Best(SPY-SH) gained -0.30% at a time when SPY gained 0.36%. A starting capital of $100,000 at inception on 1/2/2009 would have grown to $67,013 which includes $213 cash and excludes $2,437 spent on fees and slippage. |
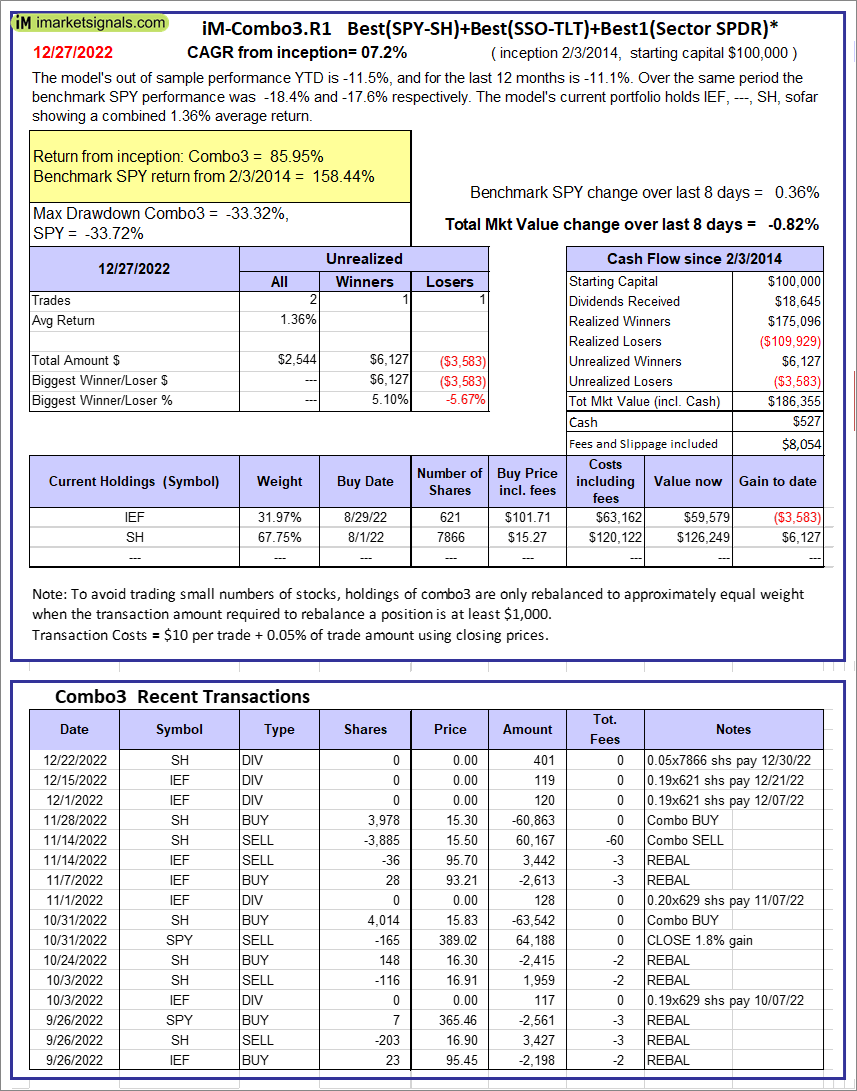 |
iM-Combo3.R1: The model’s out of sample performance YTD is -11.5%, and for the last 12 months is -11.1%. Over the same period the benchmark SPY performance was -18.4% and -17.6% respectively. Over the previous week the market value of iM-Combo3.R1 gained -0.82% at a time when SPY gained 0.36%. A starting capital of $100,000 at inception on 2/3/2014 would have grown to $186,355 which includes $527 cash and excludes $8,054 spent on fees and slippage. |
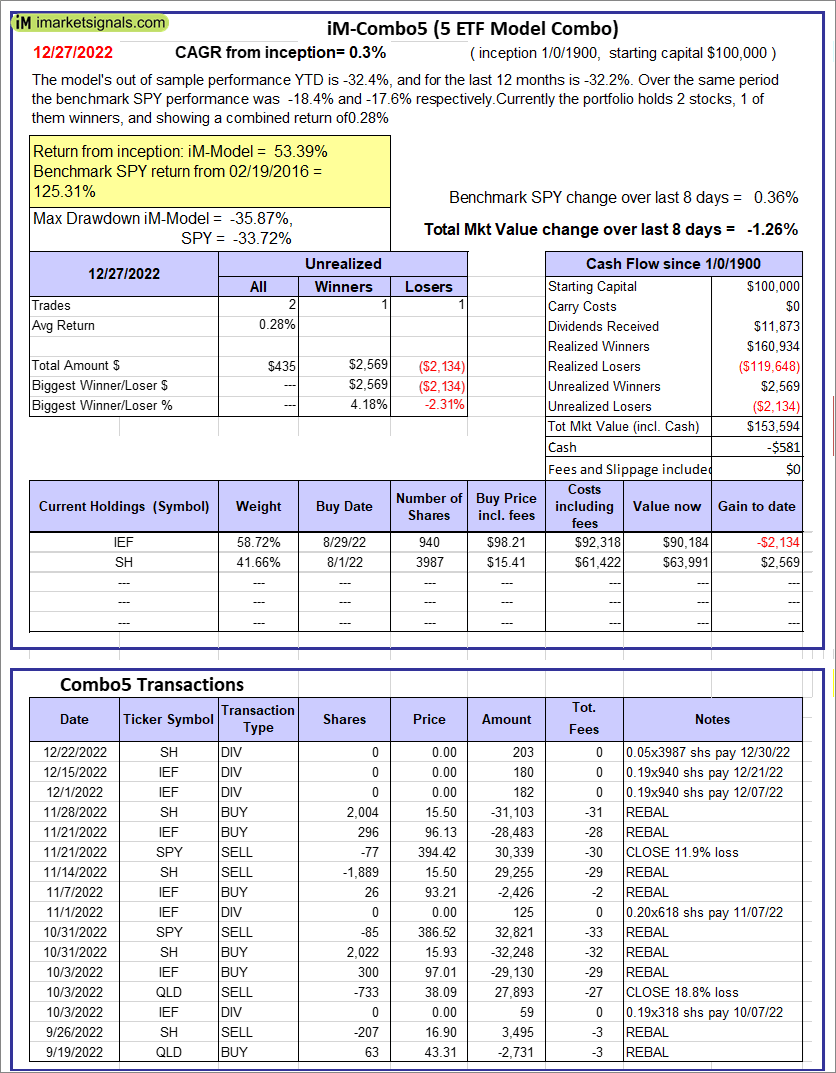 |
iM-Combo5: The model’s out of sample performance YTD is -32.4%, and for the last 12 months is -32.2%. Over the same period the benchmark SPY performance was -18.4% and -17.6% respectively. Over the previous week the market value of iM-Combo5 gained -1.26% at a time when SPY gained 0.36%. A starting capital of $100,000 at inception on 2/22/2016 would have grown to $153,594 which includes -$581 cash and excludes $0 spent on fees and slippage. |
 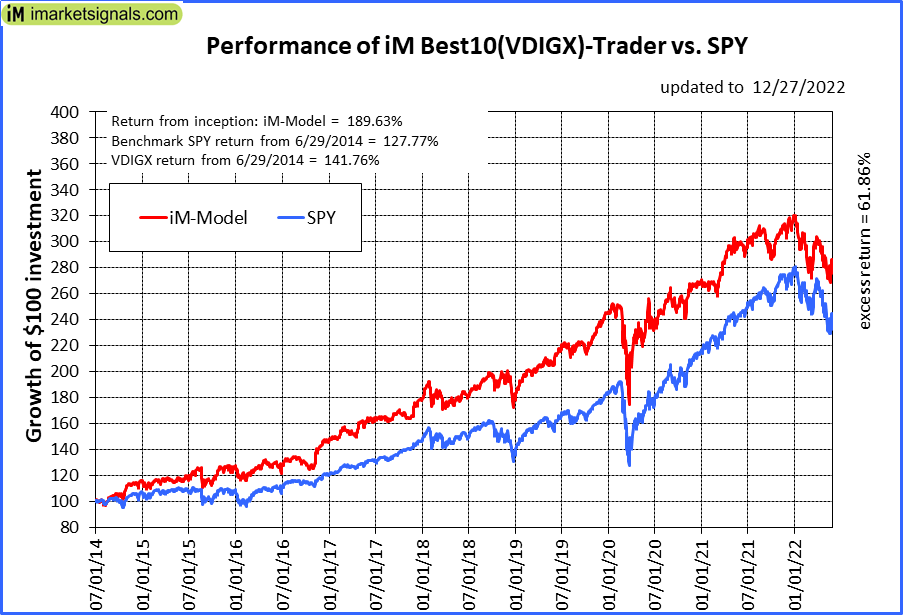 |
iM-Best10(VDIGX)-Trader: The model’s out of sample performance YTD is -9.6%, and for the last 12 months is -8.3%. Over the same period the benchmark SPY performance was -18.4% and -17.6% respectively. Since inception, on 7/1/2014, the model gained 189.63% while the benchmark SPY gained 127.77% and VDIGX gained 141.76% over the same period. Over the previous week the market value of iM-Best10(VDIGX) gained 0.86% at a time when SPY gained 0.36%. A starting capital of $100,000 at inception on 7/1/2014 would have grown to $289,631 which includes $716 cash and excludes $4,445 spent on fees and slippage. |
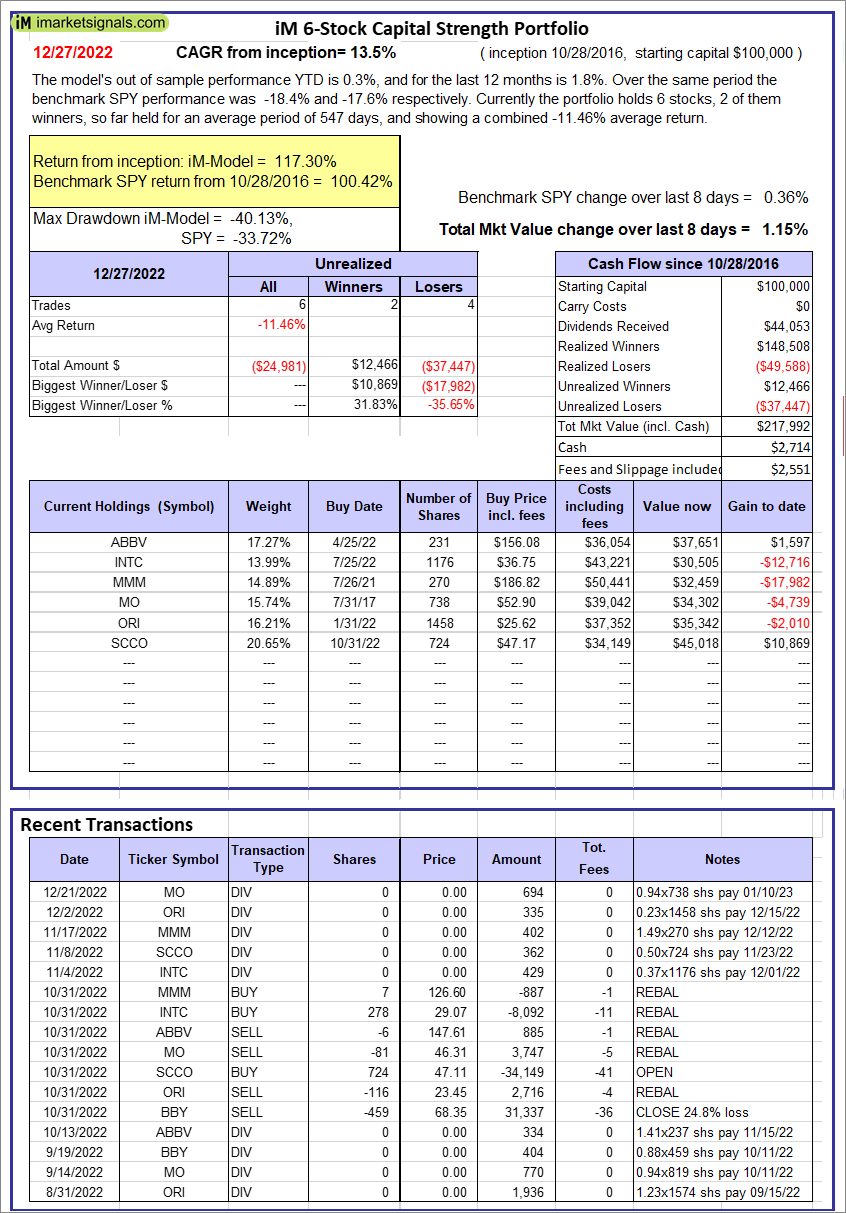 |
iM 6-Stock Capital Strength Portfolio: The model’s out of sample performance YTD is 0.3%, and for the last 12 months is 1.8%. Over the same period the benchmark SPY performance was -18.4% and -17.6% respectively. Over the previous week the market value of the iM 6-Stock Capital Strength Portfolio gained 1.15% at a time when SPY gained 0.36%. A starting capital of $100,000 at inception on 10/28/2016 would have grown to $217,992 which includes $2,714 cash and excludes $2,551 spent on fees and slippage. |
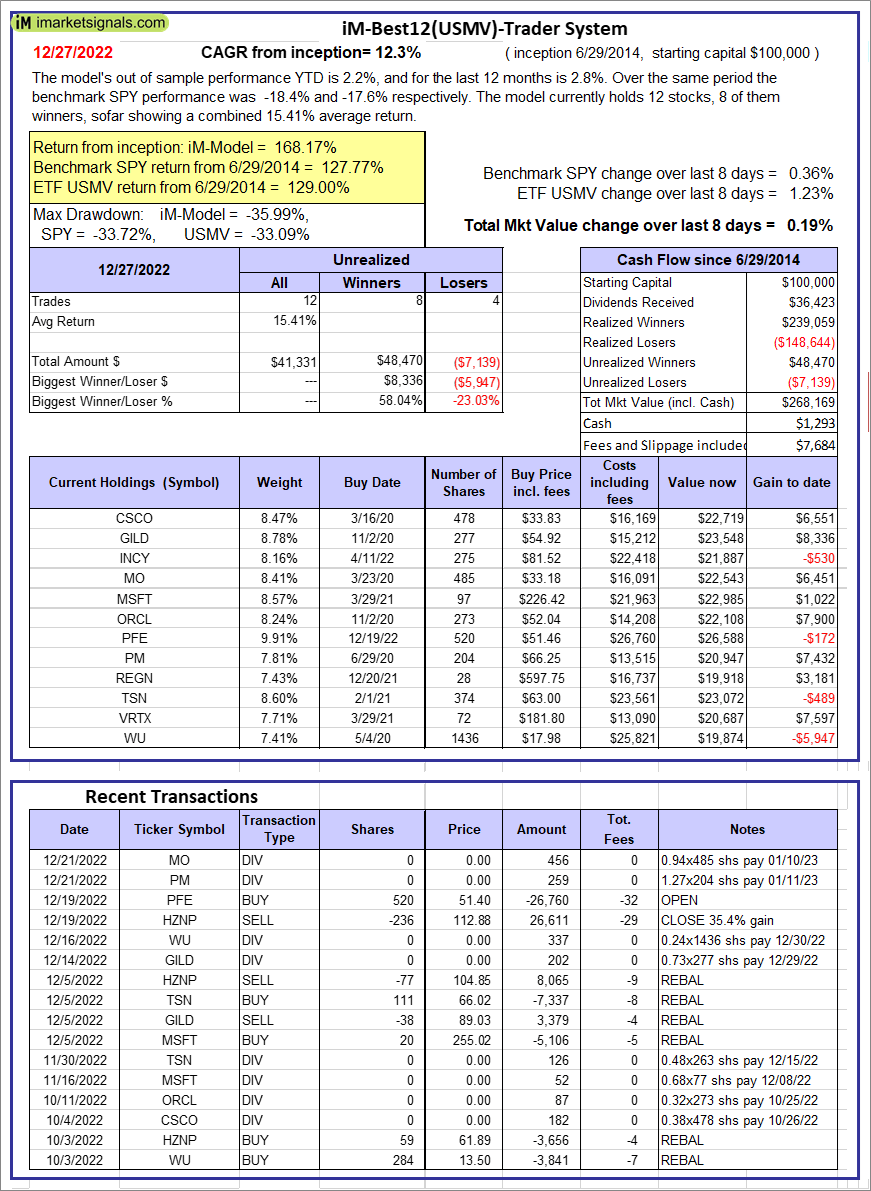 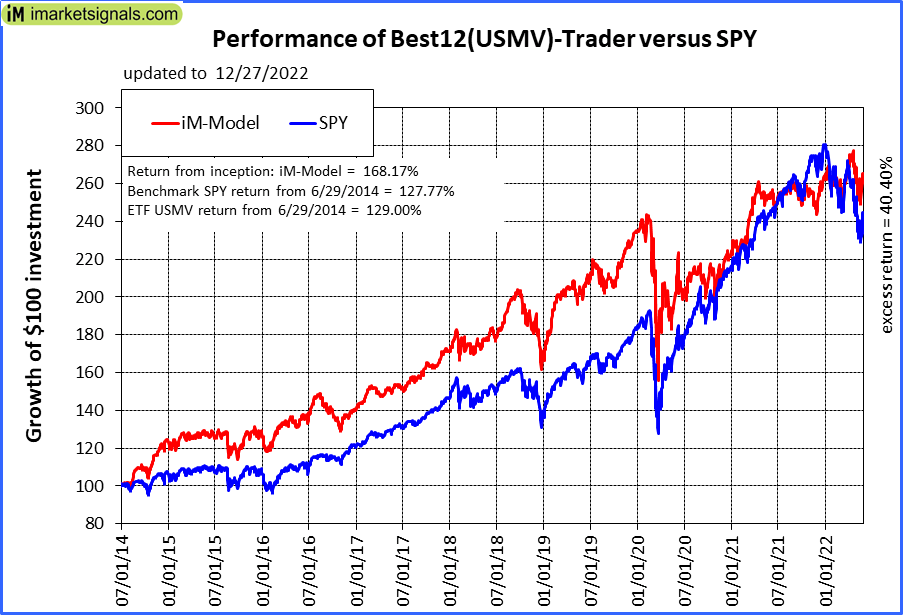 |
iM-Best12(USMV)-Trader: The model’s out of sample performance YTD is 2.2%, and for the last 12 months is 2.8%. Over the same period the benchmark SPY performance was -18.4% and -17.6% respectively. Since inception, on 6/30/2014, the model gained 168.17% while the benchmark SPY gained 127.77% and the ETF USMV gained 129.00% over the same period. Over the previous week the market value of iM-Best12(USMV)-Trader gained 0.19% at a time when SPY gained 0.36%. A starting capital of $100,000 at inception on 6/30/2014 would have grown to $268,169 which includes $1,293 cash and excludes $7,684 spent on fees and slippage. |
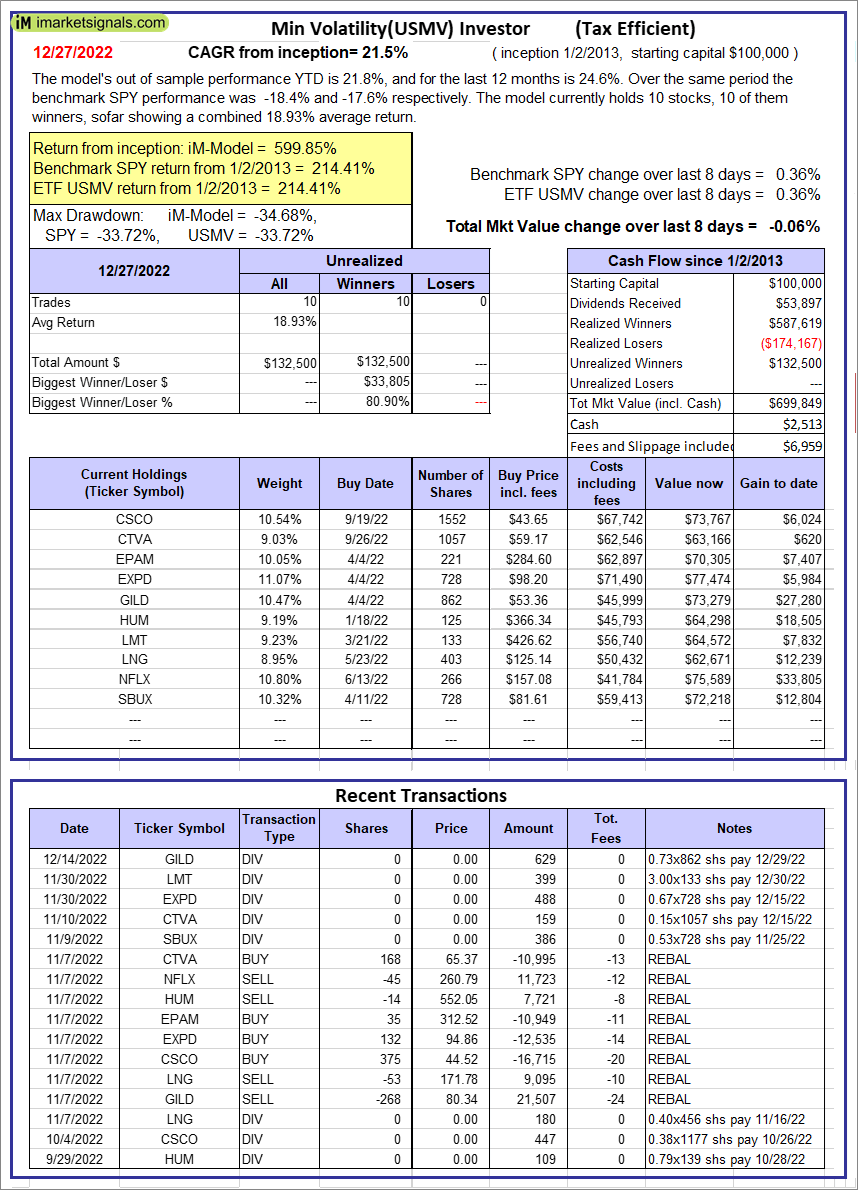 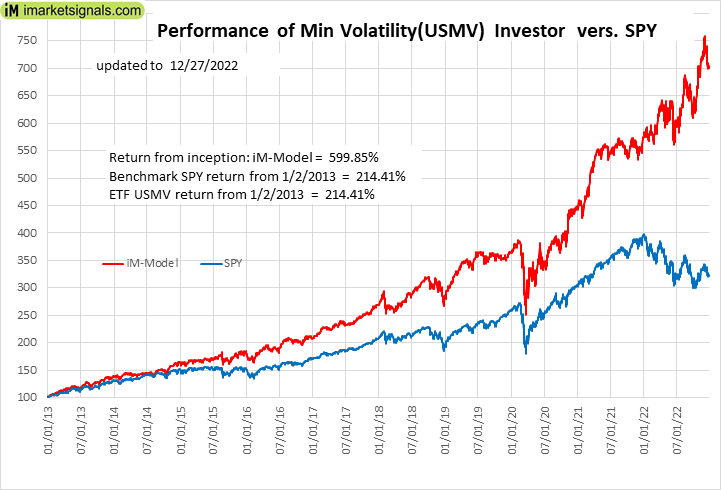 |
iM-Min Volatility(USMV) Investor (Tax Efficient): The model’s out of sample performance YTD is 21.8%, and for the last 12 months is 24.6%. Over the same period the benchmark SPY performance was -18.4% and -17.6% respectively. Since inception, on 1/3/2013, the model gained 599.85% while the benchmark SPY gained 214.41% and the ETF USMV gained 214.41% over the same period. Over the previous week the market value of iM-Best12(USMV)Q1 gained -0.06% at a time when SPY gained 0.36%. A starting capital of $100,000 at inception on 1/3/2013 would have grown to $699,849 which includes $2,513 cash and excludes $6,959 spent on fees and slippage. |
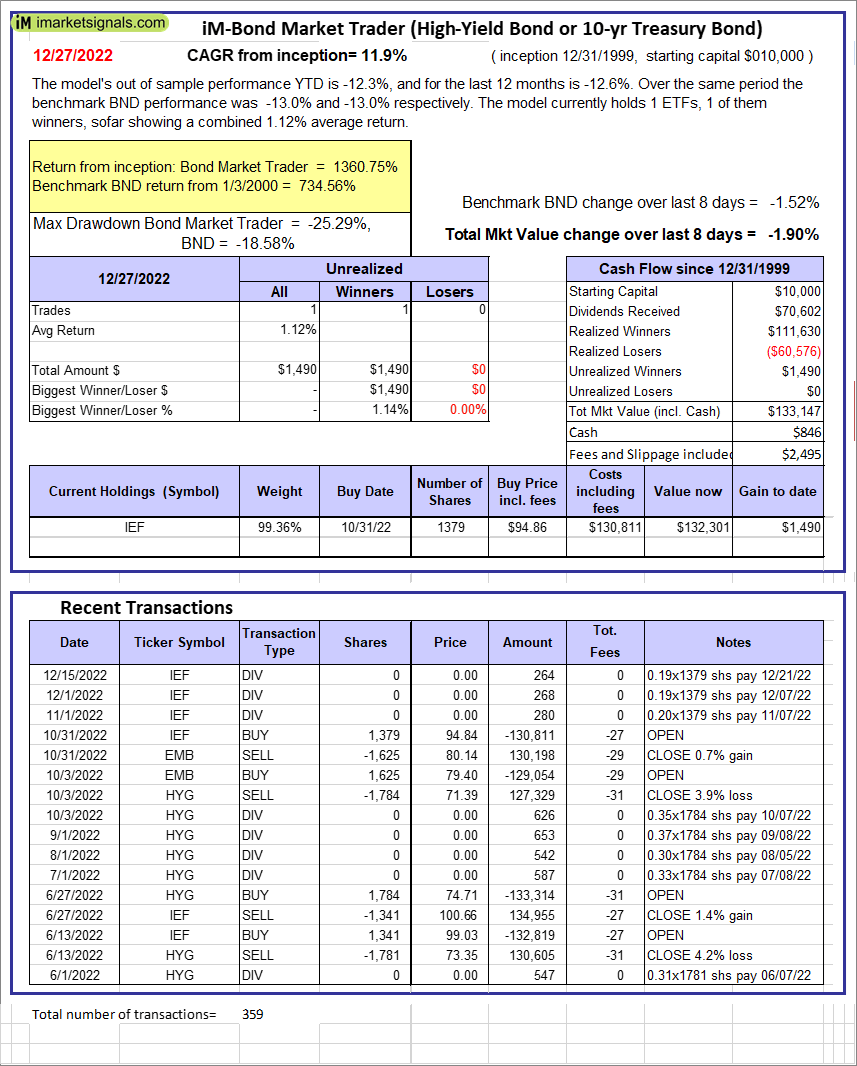 |
iM-Bond Market Trader (High-Yield Bond or 10-yr Treasury Bond): The model’s out of sample performance YTD is -12.3%, and for the last 12 months is -12.6%. Over the same period the benchmark BND performance was -13.0% and -13.0% respectively. Over the previous week the market value of the iM-Bond Market Trader (High-Yield Bond or 10-yr Treasury Bond) gained -1.90% at a time when BND gained -1.52%. A starting capital of $10,000 at inception on 1/3/2000 would have grown to $133,147 which includes $846 cash and excludes $2,495 spent on fees and slippage. |
|
|
iM-ModSum/YieldCurve Timer: The model’s out of sample performance YTD is -14.1%, and for the last 12 months is -14.3%. Over the same period the benchmark SPY performance was -18.4% and -17.6% respectively. Over the previous week the market value of iM-PortSum/YieldCurve Timer gained -1.90% at a time when SPY gained 0.36%. A starting capital of $100,000 at inception on 1/1/2016 would have grown to $252,628 which includes $1,553 cash and excludes $1,196 spent on fees and slippage. |
 |
iM-Best2 MC-Score ETF System: The model’s out of sample performance YTD is -10.2%, and for the last 12 months is -8.4%. Over the same period the benchmark SPY performance was -18.4% and -17.6% respectively. Over the previous week the market value of the iM-Best2 MC-Score ETF System gained 0.07% at a time when SPY gained 0.36%. A starting capital of $100,000 at inception on 6/30/2016 would have grown to $139,834 which includes $1,320 cash and excludes $2,232 spent on fees and slippage. |
 |
iM-Best4 MC-Score Vanguard System: The model’s out of sample performance YTD is -10.7%, and for the last 12 months is -8.4%. Over the same period the benchmark SPY performance was -18.4% and -17.6% respectively. Over the previous week the market value of the iM-Best4 MC-Score Vanguard System gained -1.23% at a time when SPY gained 0.36%. A starting capital of $100,000 at inception on 6/30/2016 would have grown to $150,321 which includes $555 cash and excludes $00 spent on fees and slippage. |
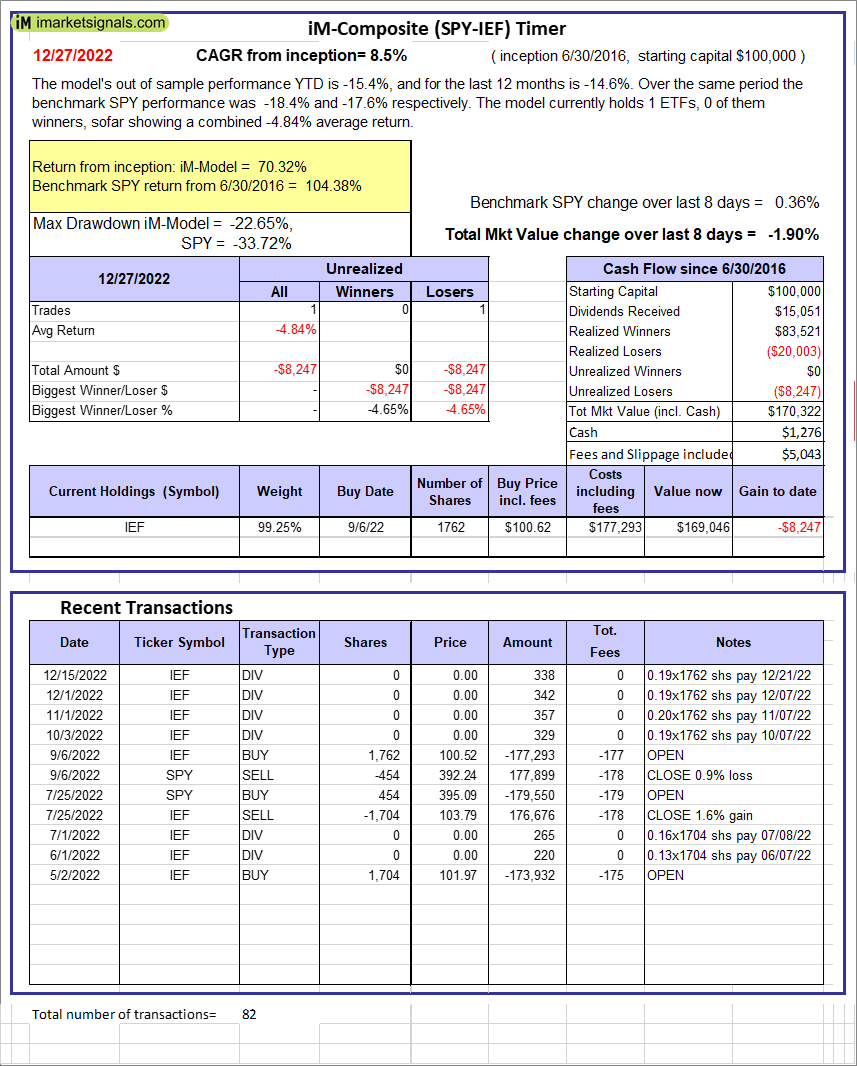 |
iM-Composite (SPY-IEF) Timer: The model’s out of sample performance YTD is -15.4%, and for the last 12 months is -14.6%. Over the same period the benchmark SPY performance was -18.4% and -17.6% respectively. Over the previous week the market value of the iM-Composite (SPY-IEF) Timer gained -1.90% at a time when SPY gained 0.36%. A starting capital of $100,000 at inception on 6/30/2016 would have grown to $170,322 which includes $1,276 cash and excludes $5,043 spent on fees and slippage. |
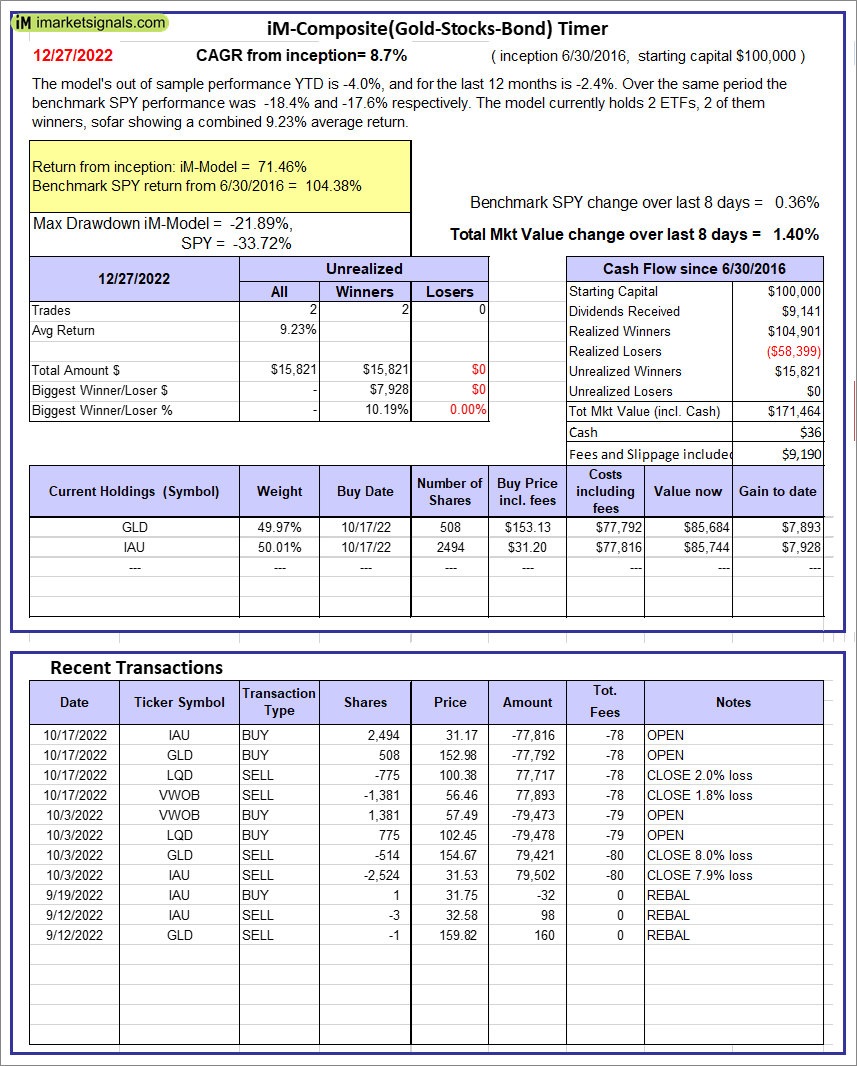 |
iM-Composite(Gold-Stocks-Bond) Timer: The model’s out of sample performance YTD is -4.0%, and for the last 12 months is -2.4%. Over the same period the benchmark SPY performance was -18.4% and -17.6% respectively. Over the previous week the market value of the iM-Composite(Gold-Stocks-Bond) Timer gained 1.40% at a time when SPY gained 0.36%. A starting capital of $100,000 at inception on 6/30/2016 would have grown to $171,464 which includes $36 cash and excludes $9,190 spent on fees and slippage. |
iM-Best Reports – 12/27/2022
Posted in pmp SPY-SH
Leave a Reply
You must be logged in to post a comment.