
  |
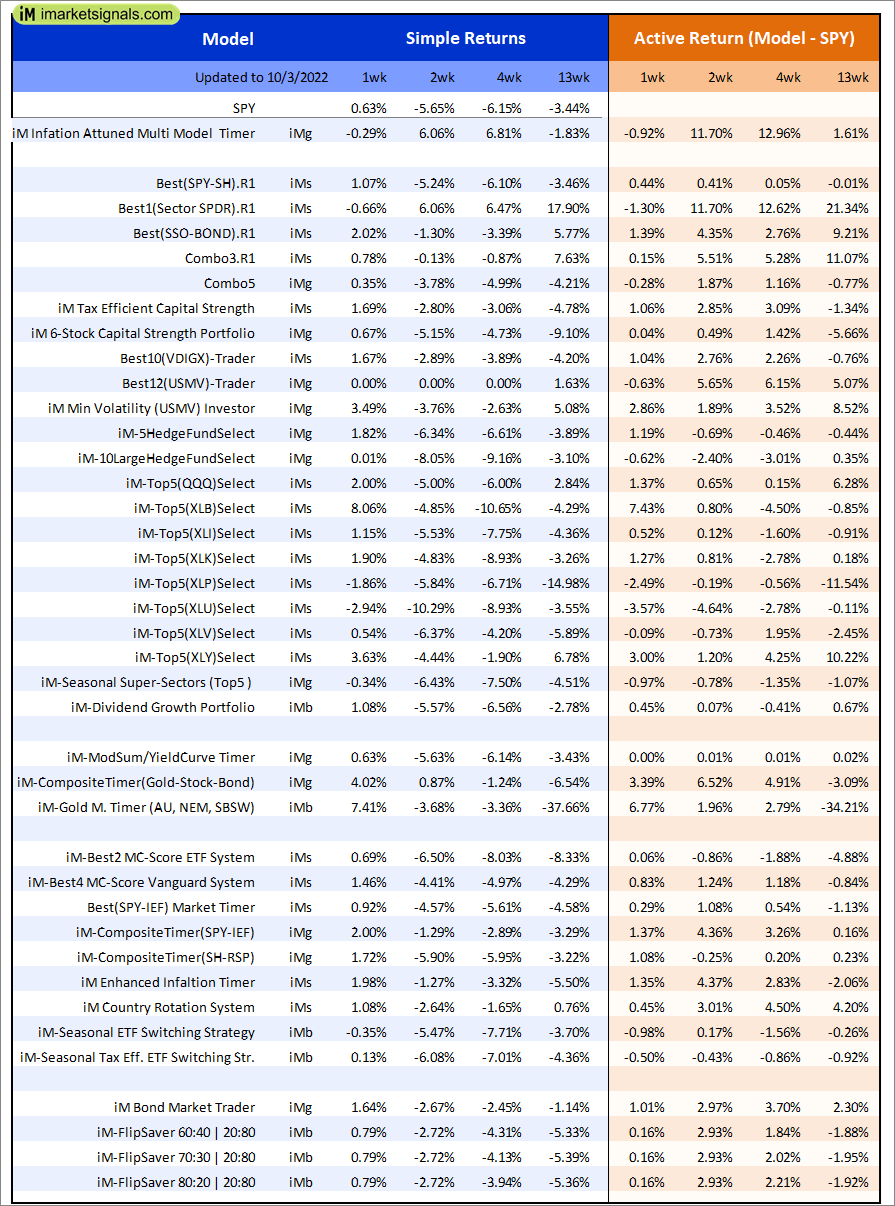
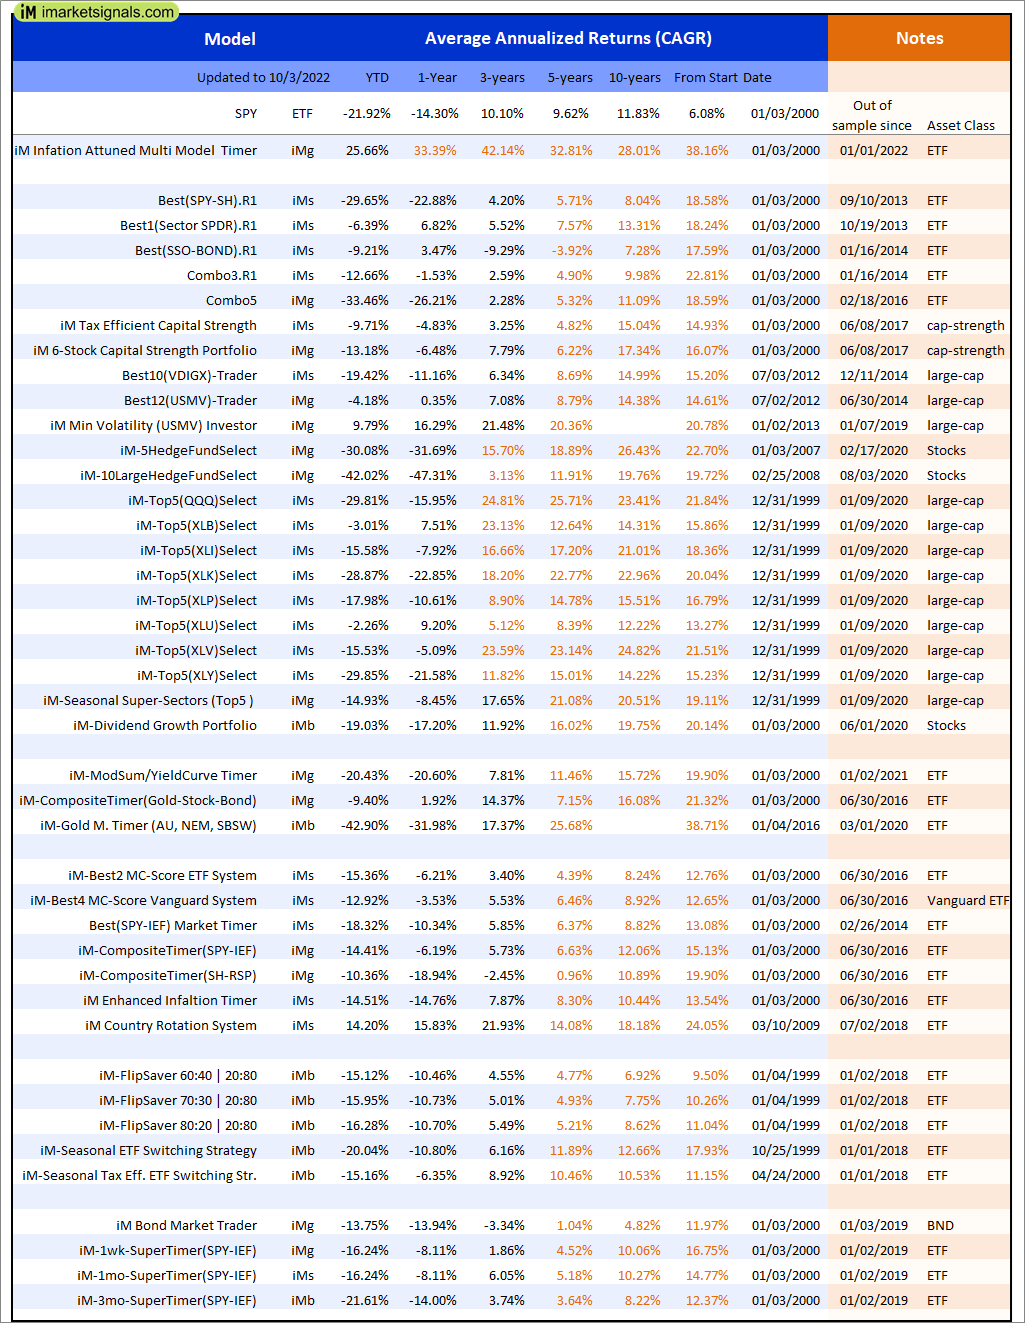
Out of sample performance summary of our models for the past 1, 2, 4 and 13 week periods. The active active return indicates how the models over- or underperformed the benchmark ETF SPY. Also the YTD, and the 1-, 3-, 5- and 10-year annualized returns are shown in the second table |
 |
iM-FlipSaver 60:40 | 20:80 – 2017: The model’s out of sample performance YTD is -15.6%, and for the last 12 months is -10.9%. Over the same period the benchmark E60B40 performance was -18.4% and -13.7% respectively. Over the previous week the market value of iM-FlipSaver 80:20 | 20:80 gained 0.79% at a time when SPY gained 0.86%. A starting capital of $100,000 at inception on 7/16/2015 would have grown to $137,435 which includes $738 cash and excludes $2,673 spent on fees and slippage. |
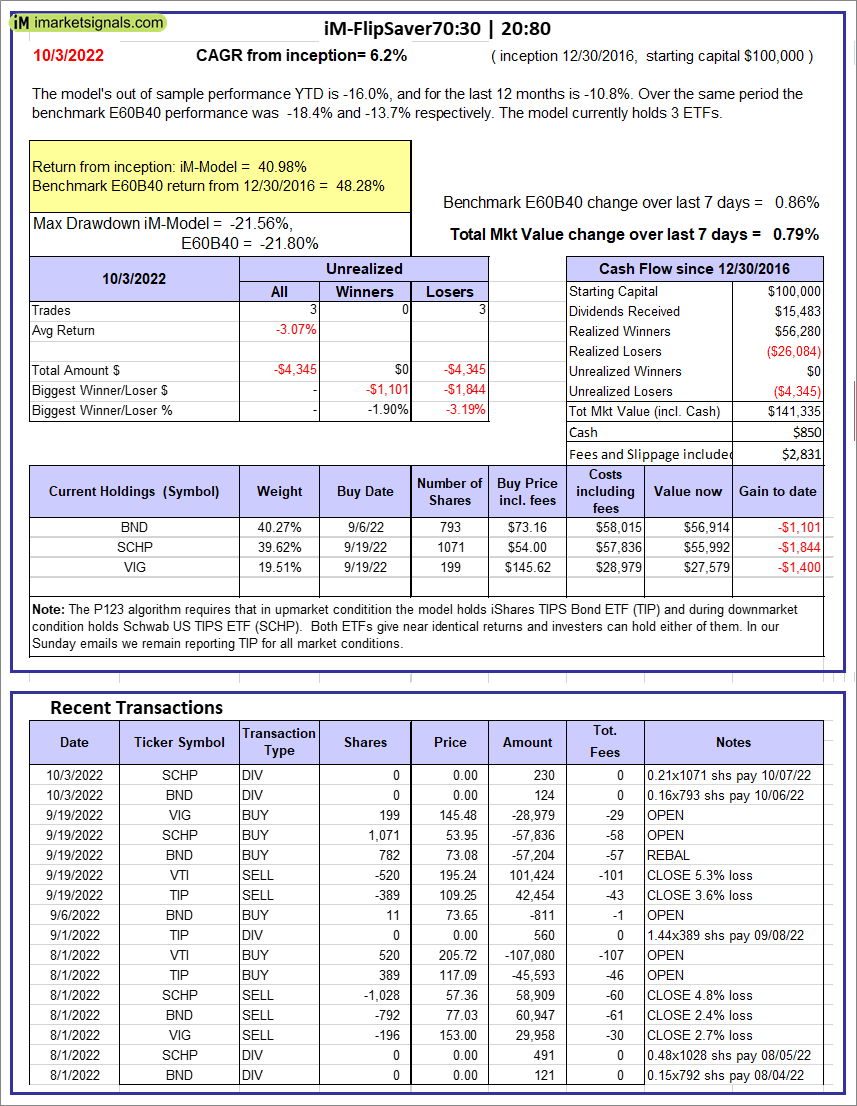 |
iM-FlipSaver 70:30 | 20:80 – 2017: The model’s out of sample performance YTD is -16.0%, and for the last 12 months is -10.8%. Over the same period the benchmark E60B40 performance was -18.4% and -13.7% respectively. Over the previous week the market value of iM-FlipSaver 70:30 | 20:80 gained 0.79% at a time when SPY gained 0.86%. A starting capital of $100,000 at inception on 7/15/2015 would have grown to $141,335 which includes $850 cash and excludes $2,831 spent on fees and slippage. |
 |
iM-FlipSaver 80:20 | 20:80 – 2017: The model’s out of sample performance YTD is -16.3%, and for the last 12 months is -10.7%. Over the same period the benchmark E60B40 performance was -18.4% and -13.7% respectively. Over the previous week the market value of iM-FlipSaver 80:20 | 20:80 gained 0.79% at a time when SPY gained 0.86%. A starting capital of $100,000 at inception on 1/2/2017 would have grown to $145,078 which includes $1,001 cash and excludes $2,982 spent on fees and slippage. |
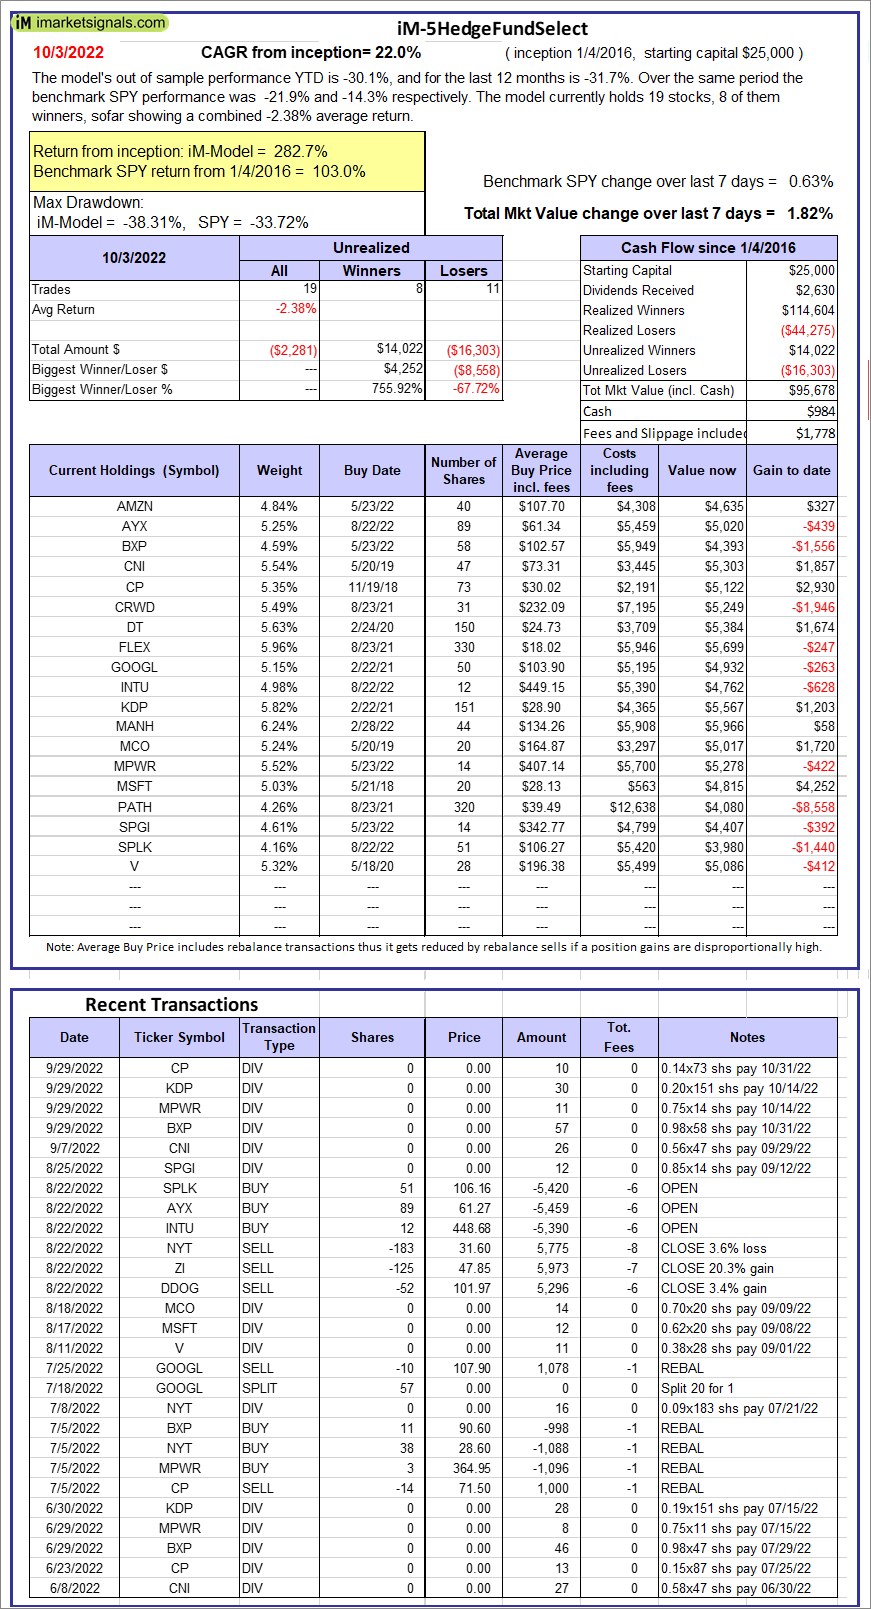  |
iM-5HedgeFundSelect: Since inception, on 1/5/2016, the model gained 282.71% while the benchmark SPY gained 103.02% over the same period. Over the previous week the market value of iM-5HedgeFundSelect gained 1.82% at a time when SPY gained 0.63%. A starting capital of $25,000 at inception on 1/5/2016 would have grown to $95,678 which includes $984 cash and excludes $1,778 spent on fees and slippage. |
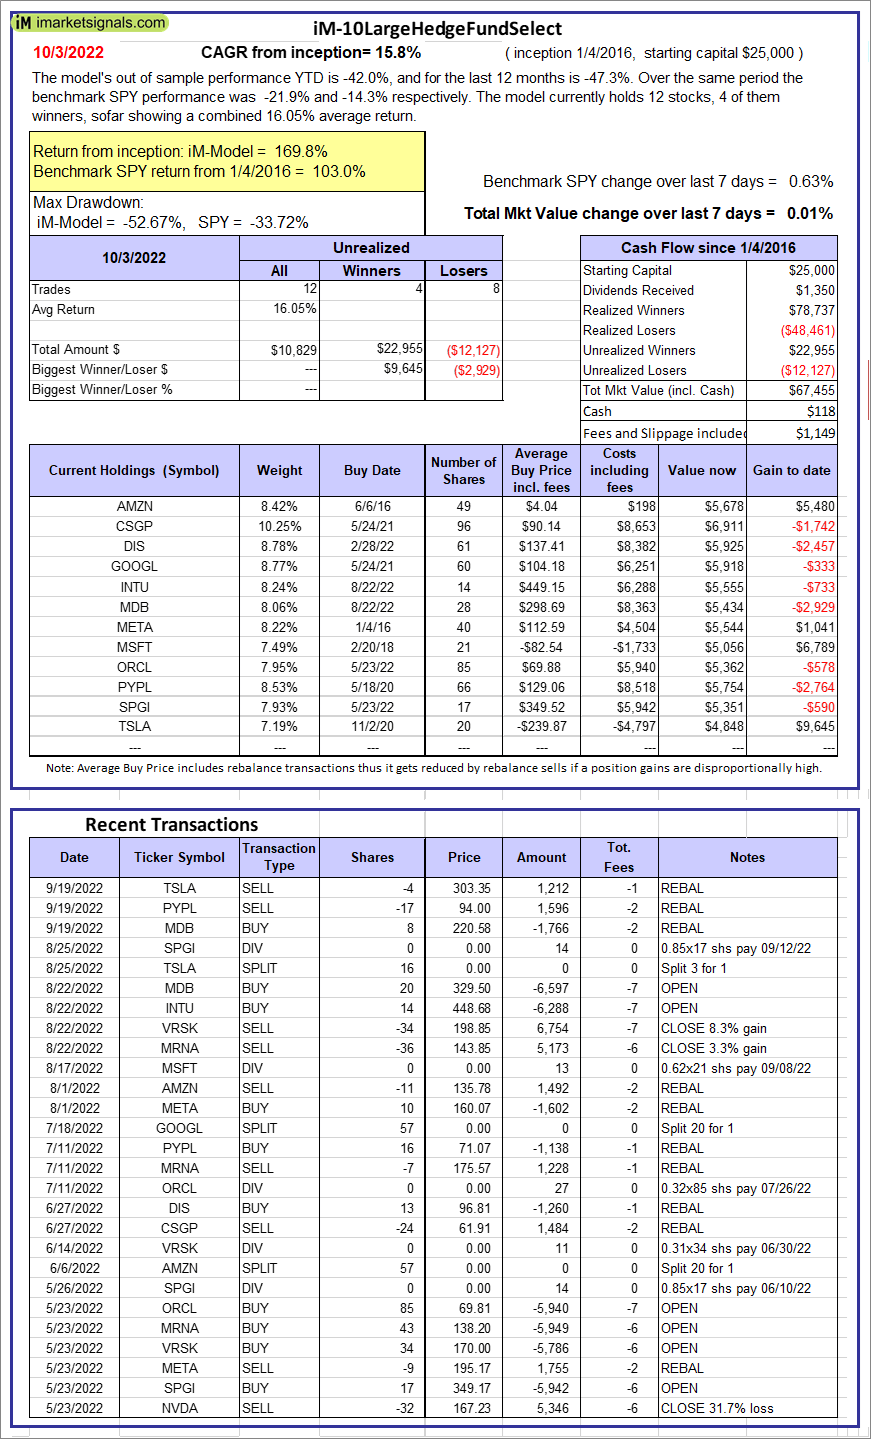 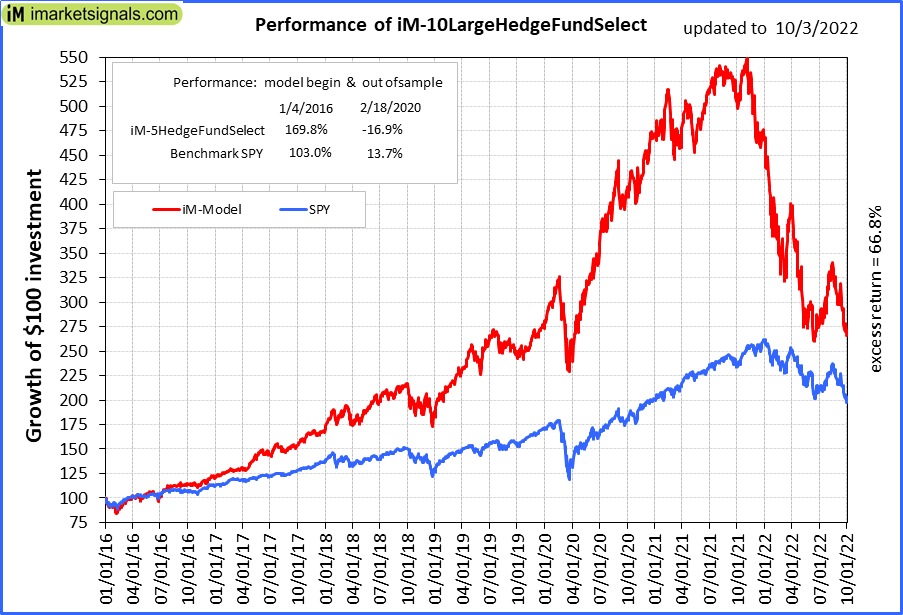 |
iM-10LargeHedgeFundSelect: Since inception, on 1/5/2016, the model gained 169.82% while the benchmark SPY gained 103.02% over the same period. Over the previous week the market value of iM-10LargeHedgeFundSelect gained 0.01% at a time when SPY gained 0.63%. A starting capital of $25,000 at inception on 1/5/2016 would have grown to $67,455 which includes $118 cash and excludes $1,149 spent on fees and slippage. |
 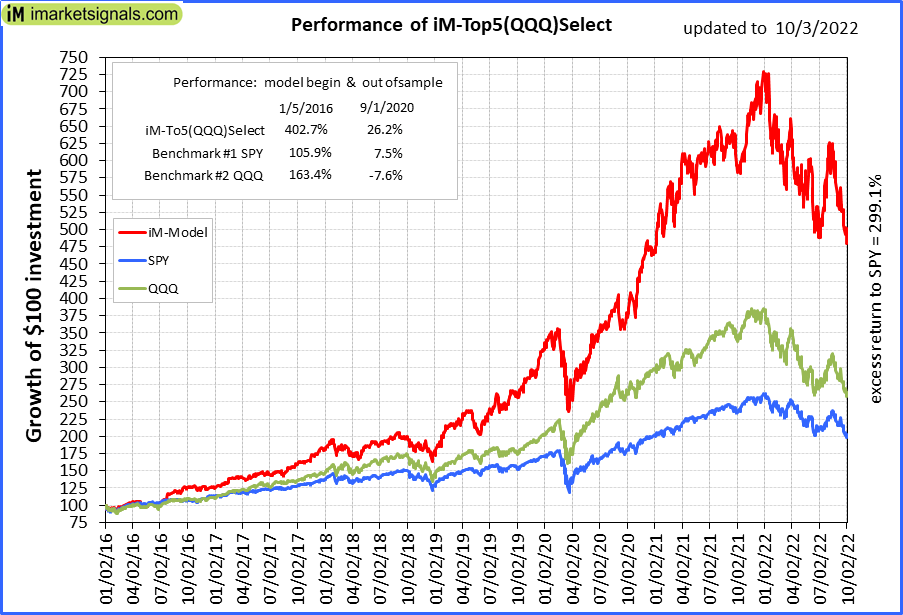 |
iM-Top5(QQQ)Select: Since inception, on 1/5/2016, the model gained 402.14% while the benchmark SPY gained 103.02% over the same period. Over the previous week the market value of iM-Top5(QQQ)Select gained 2.00% at a time when SPY gained 0.63%. A starting capital of $100,000 at inception on 1/5/2016 would have grown to $502,136 which includes $2,160 cash and excludes $9,392 spent on fees and slippage. |
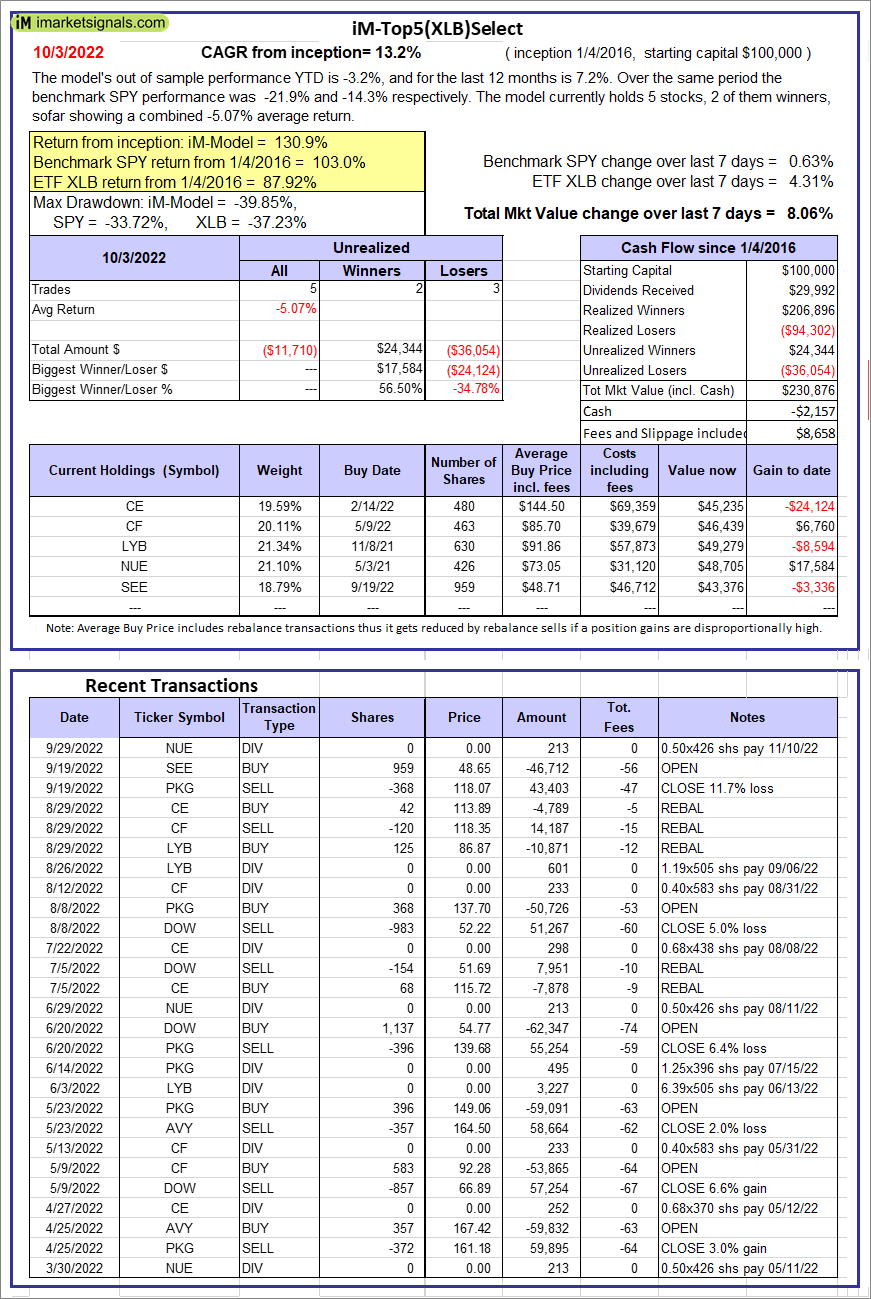 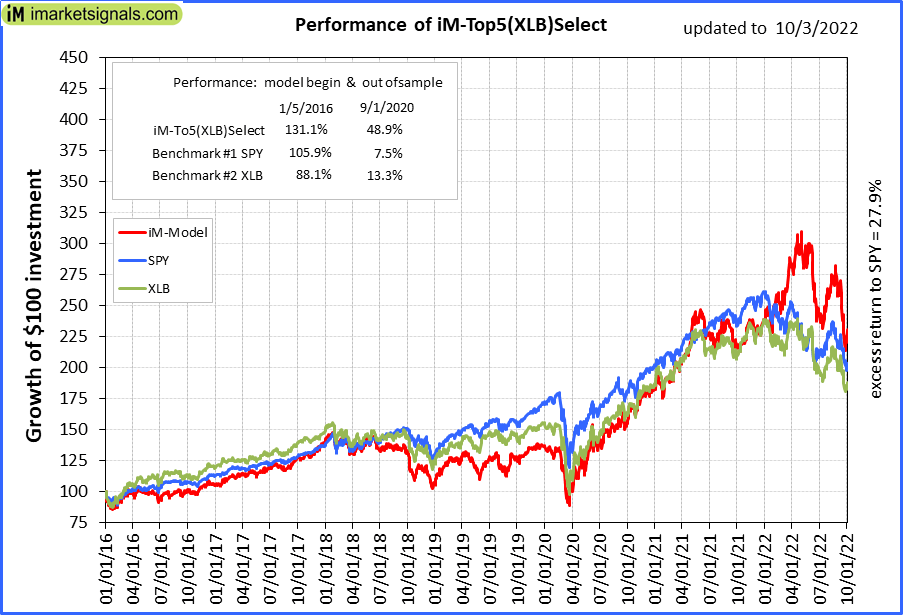 |
iM-Top5(XLB)Select: Since inception, on 1/5/2016, the model gained 130.88% while the benchmark SPY gained 103.02% over the same period. Over the previous week the market value of iM-Top5(XLB)Select gained 8.06% at a time when SPY gained 0.63%. A starting capital of $100,000 at inception on 1/5/2016 would have grown to $230,876 which includes -$2,157 cash and excludes $8,658 spent on fees and slippage. |
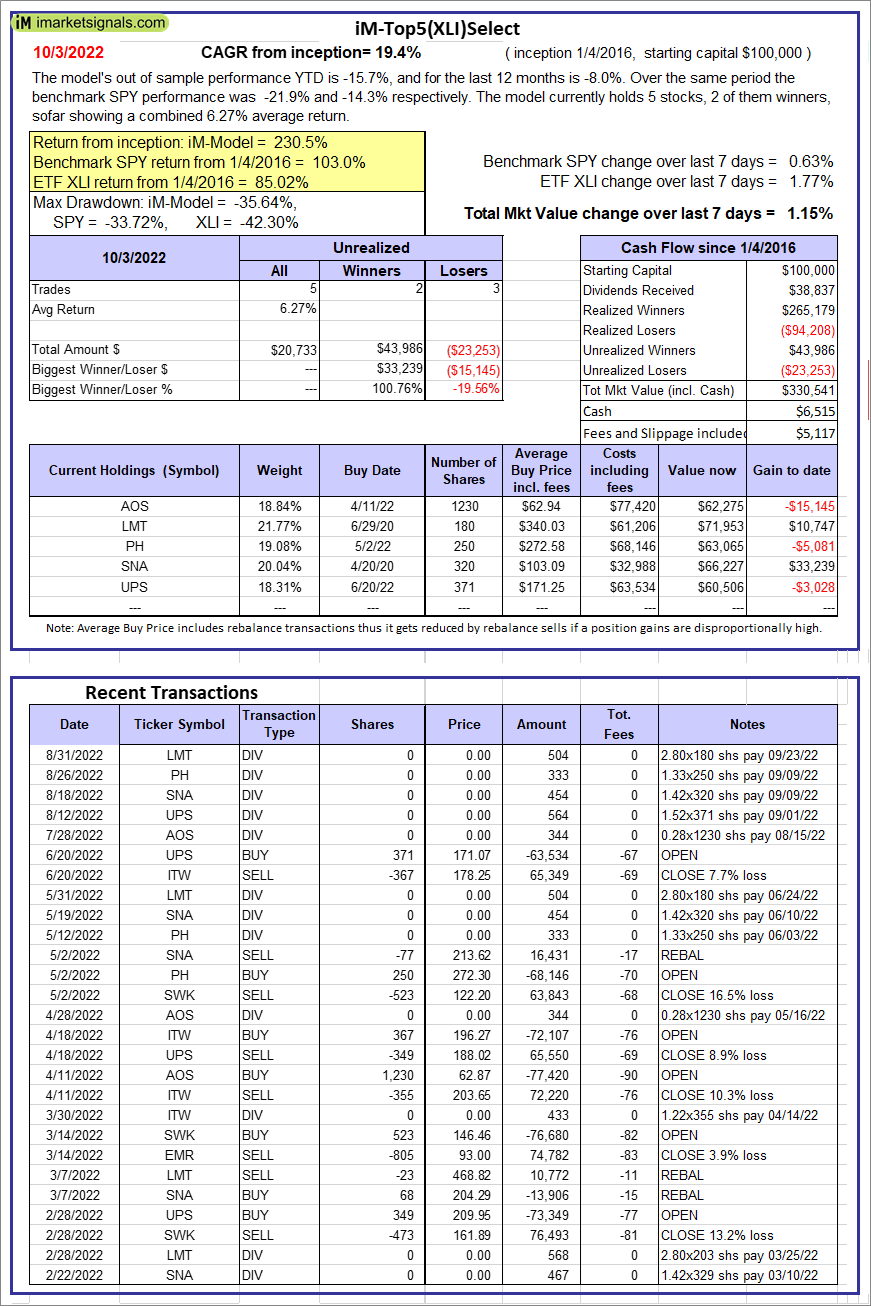 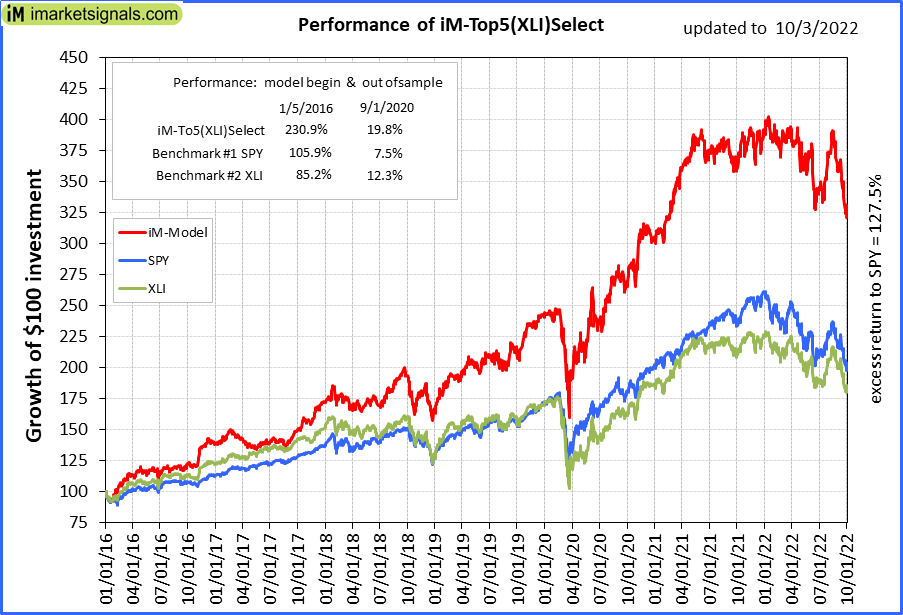 |
iM-Top5(XLI)Select: Since inception, on 1/5/2016, the model gained 230.54% while the benchmark SPY gained 103.02% over the same period. Over the previous week the market value of iM-Top5(XLI)Select gained 1.15% at a time when SPY gained 0.63%. A starting capital of $100,000 at inception on 1/5/2016 would have grown to $330,541 which includes $6,515 cash and excludes $5,117 spent on fees and slippage. |
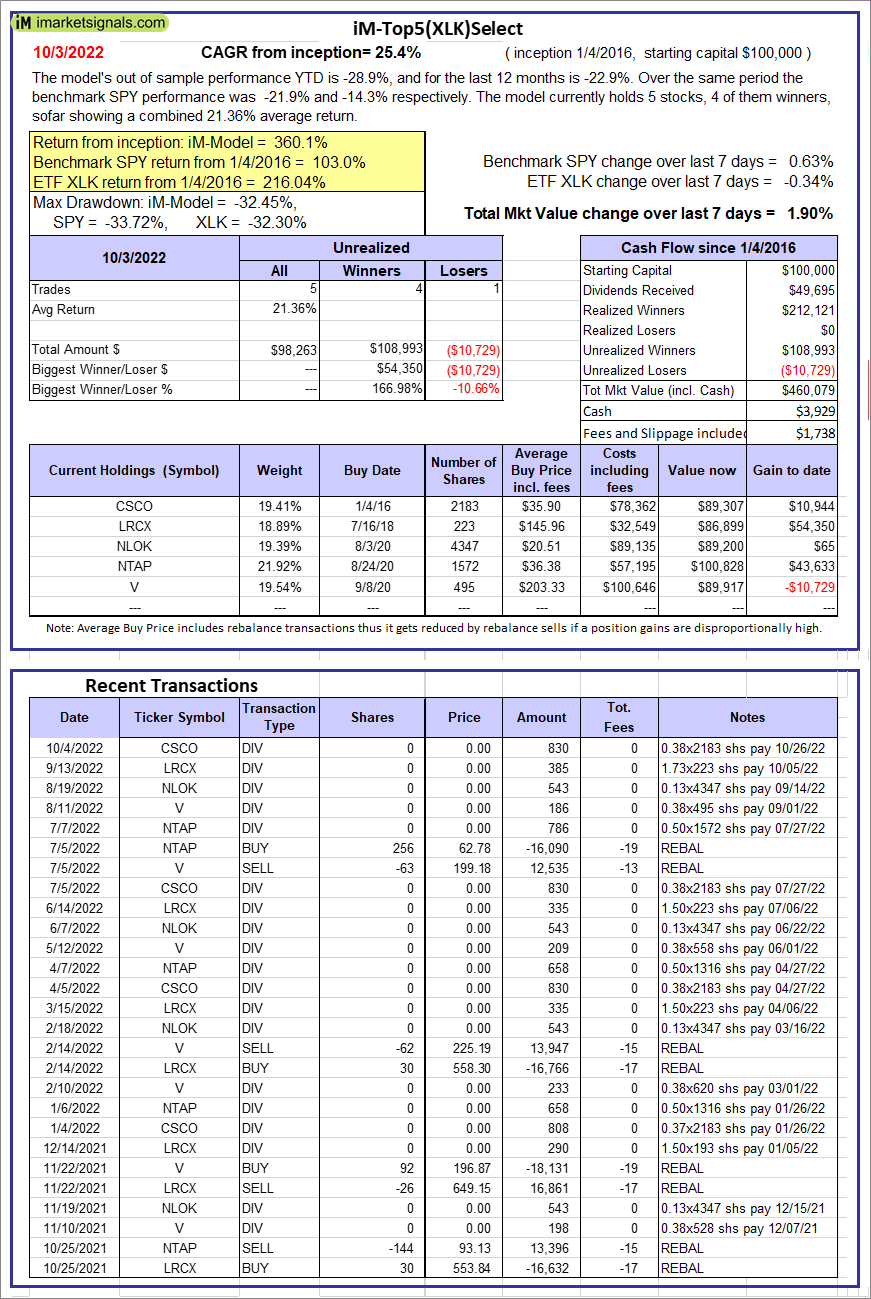 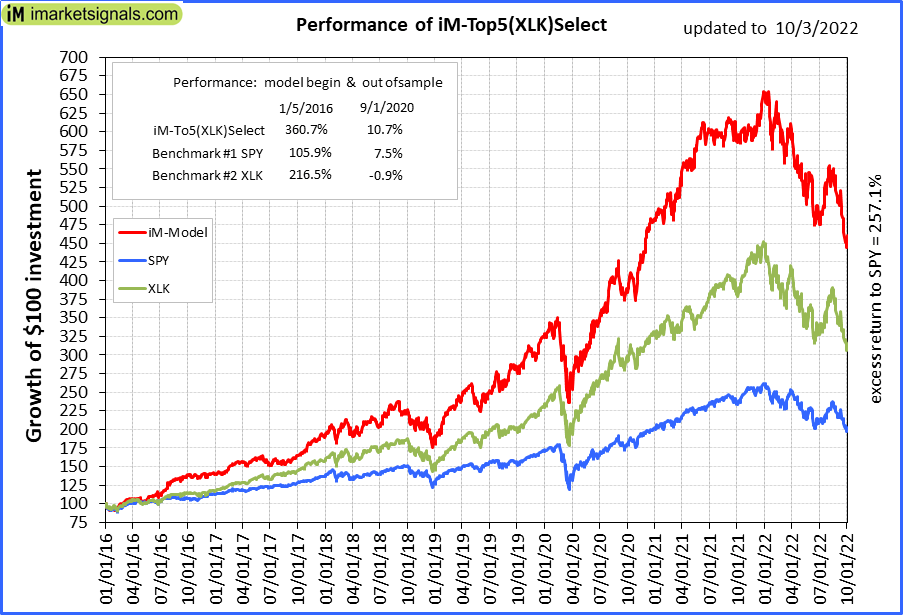 |
iM-Top5(XLK)Select: Since inception, on 1/5/2016, the model gained 360.08% while the benchmark SPY gained 103.02% over the same period. Over the previous week the market value of iM-Top5(XLK)Select gained 1.90% at a time when SPY gained 0.63%. A starting capital of $100,000 at inception on 1/5/2016 would have grown to $460,079 which includes $3,929 cash and excludes $1,738 spent on fees and slippage. |
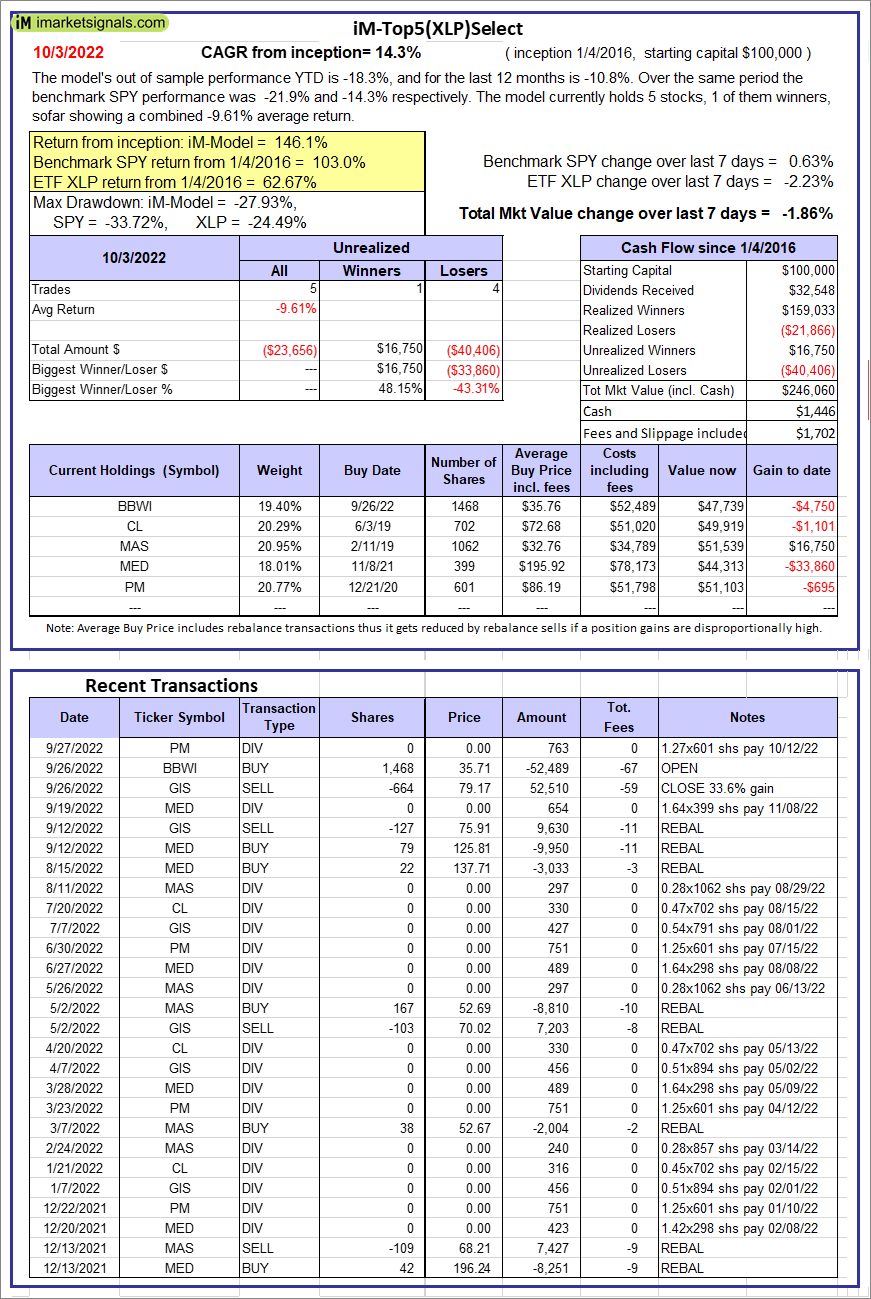  |
iM-Top5(XLP)Select: Since inception, on 1/5/2016, the model gained 146.06% while the benchmark SPY gained 103.02% over the same period. Over the previous week the market value of iM-Top5(XLP)Select gained -1.86% at a time when SPY gained 0.63%. A starting capital of $100,000 at inception on 1/5/2016 would have grown to $246,060 which includes $1,446 cash and excludes $1,702 spent on fees and slippage. |
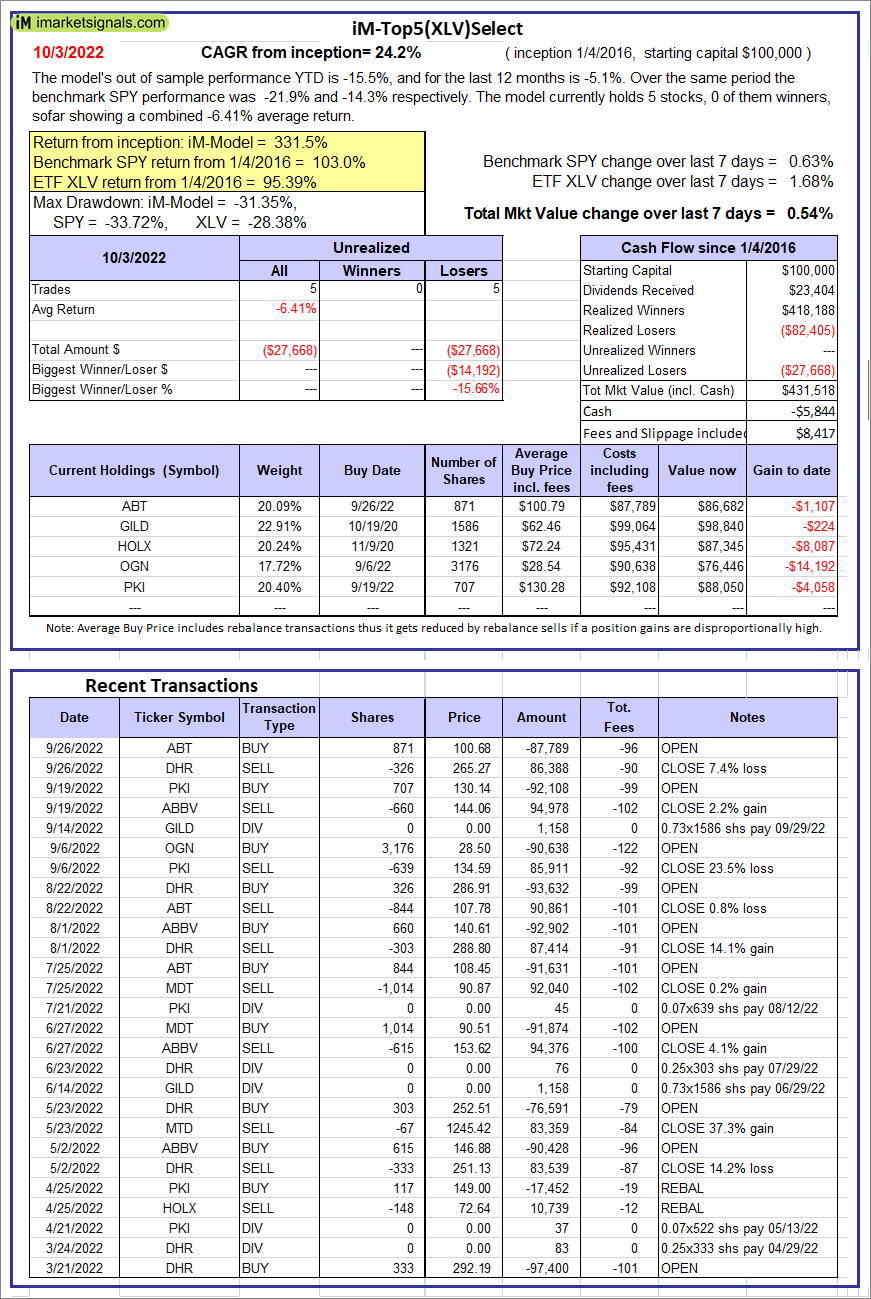 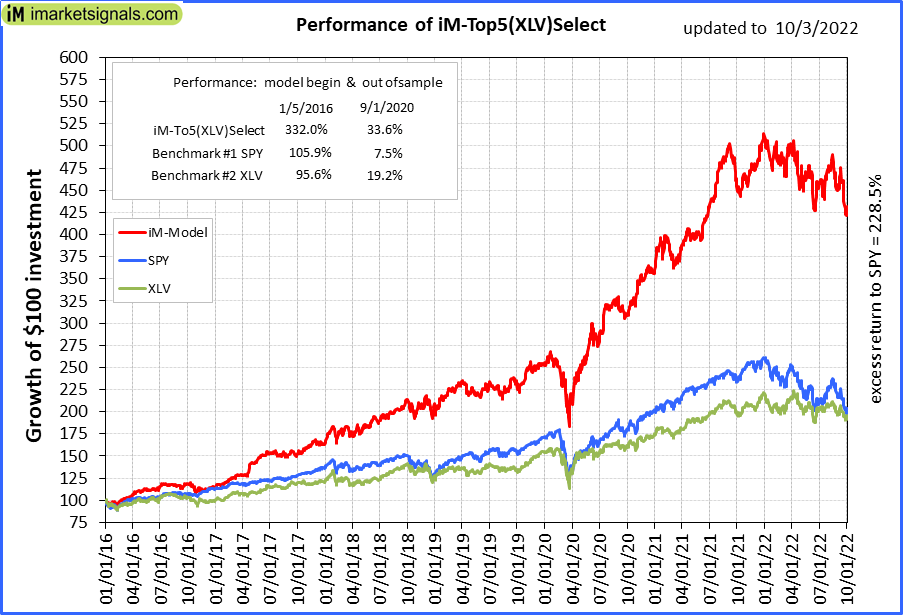 |
iM-Top5(XLV)Select: Since inception, on 1/5/2016, the model gained 331.52% while the benchmark SPY gained 103.02% over the same period. Over the previous week the market value of iM-Top5(XLV)Select gained 0.54% at a time when SPY gained 0.63%. A starting capital of $100,000 at inception on 1/5/2016 would have grown to $431,518 which includes -$5,844 cash and excludes $8,417 spent on fees and slippage. |
  |
iM-Top5(XLU)Select: Since inception, on 1/5/2016, the model gained 116.60% while the benchmark SPY gained 103.02% over the same period. Over the previous week the market value of iM-Top5(XLU)Select gained -2.94% at a time when SPY gained 0.63%. A starting capital of $100,000 at inception on 1/5/2016 would have grown to $216,603 which includes -$145 cash and excludes $10,303 spent on fees and slippage. |
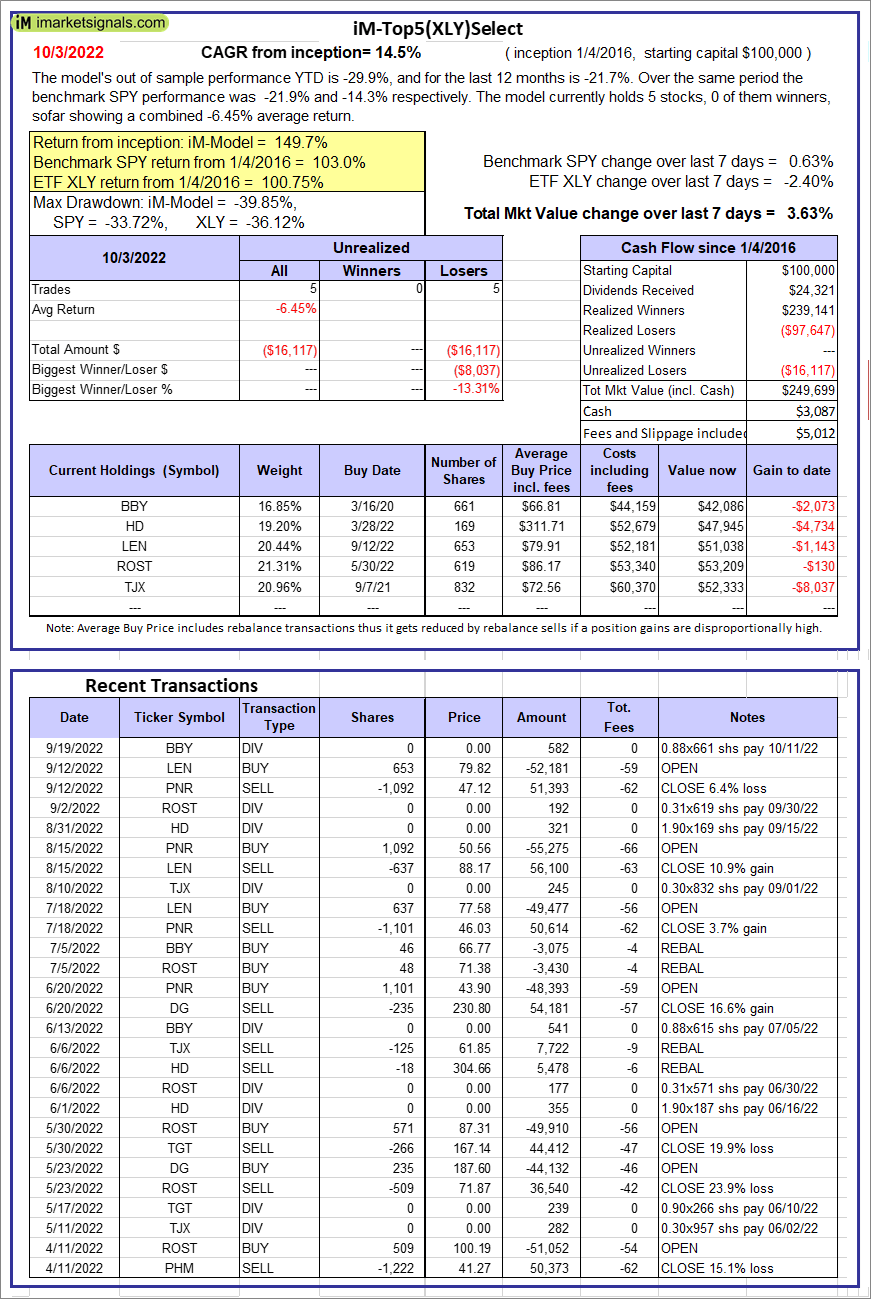 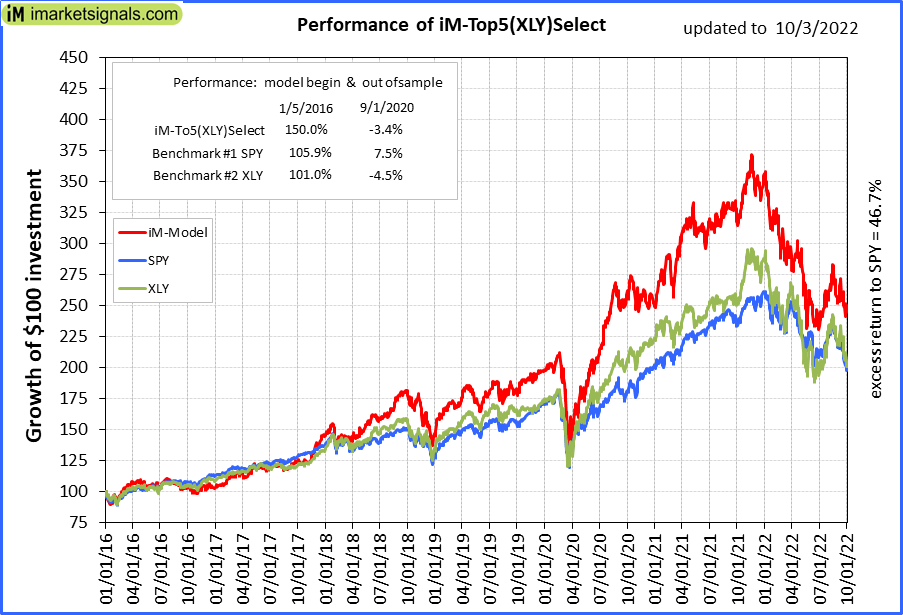 |
iM-Top5(XLY)Select: Since inception, on 1/5/2016, the model gained 149.70% while the benchmark SPY gained 103.02% over the same period. Over the previous week the market value of iM-Top5(XLY)Select gained 3.63% at a time when SPY gained 0.63%. A starting capital of $100,000 at inception on 1/5/2016 would have grown to $249,699 which includes $3,087 cash and excludes $5,012 spent on fees and slippage. |
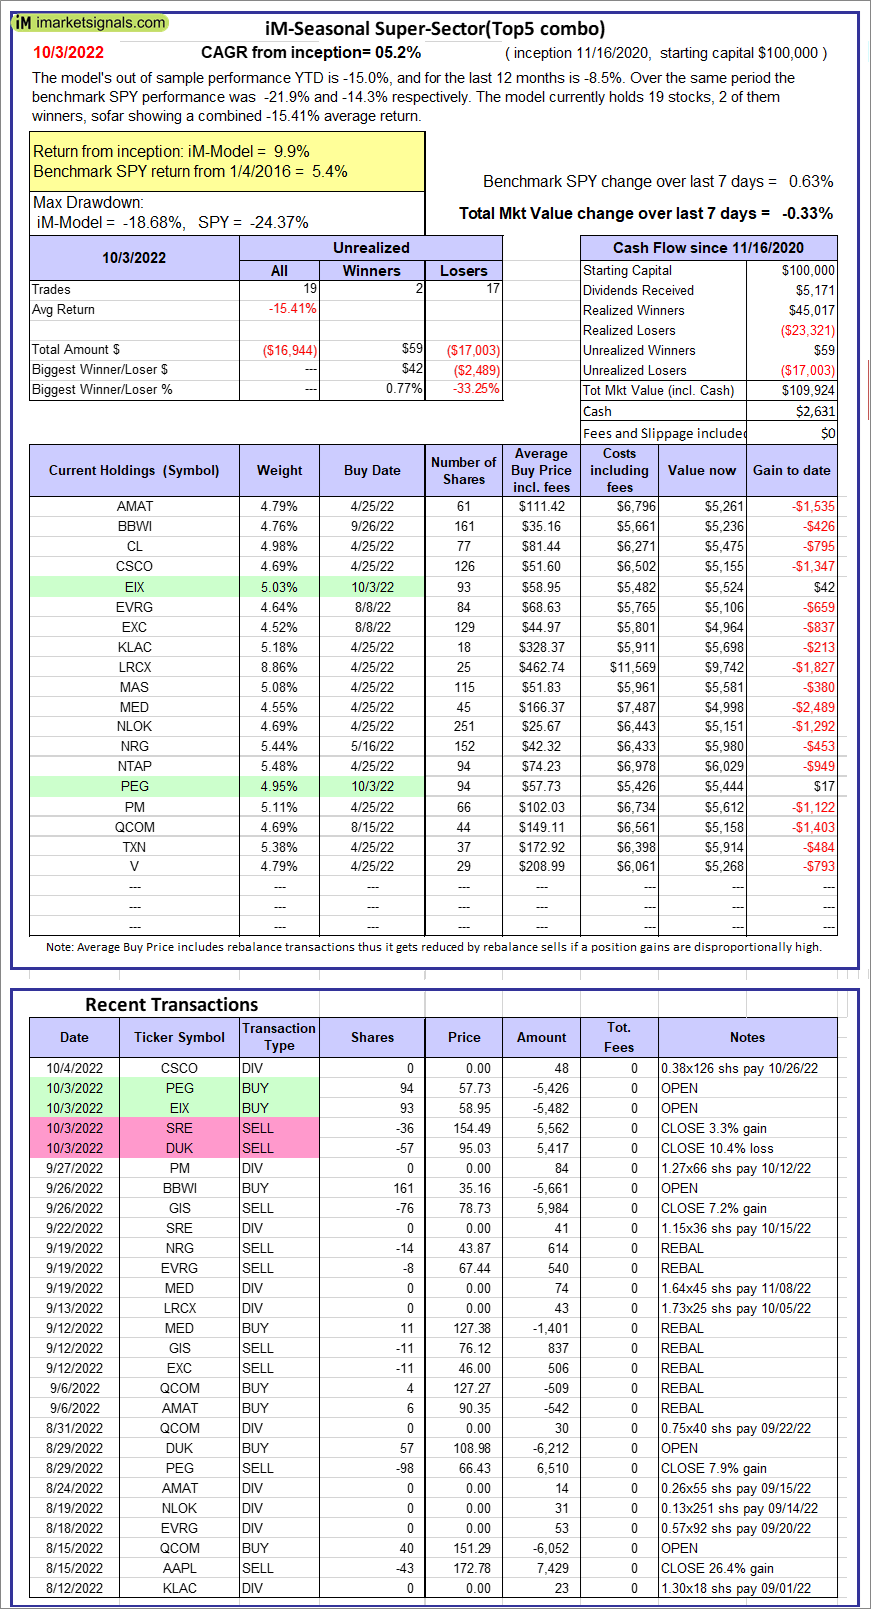 |
iM-Seasonal Super-Sectors (Top5 combo) : Since inception, on 11/17/2020, the model gained 9.92% while the benchmark SPY gained 5.39% over the same period. Over the previous week the market value of iM-Seasonal Super-Sectors (Top5 combo) gained -0.33% at a time when SPY gained 0.63%. A starting capital of $100,000 at inception on 11/17/2020 would have grown to $109,924 which includes $2,631 cash and excludes $00 spent on fees and slippage. |
 |
iM-Dividend Growth Portfolio: The model’s out of sample performance YTD is -19.2%, and for the last 12 months is -17.5%. Over the same period the benchmark SPY performance was -21.9% and -14.3% respectively. Over the previous week the market value of the iM-Dividend Growth Portfolio gained 0.71% at a time when SPY gained 0.63%. A starting capital of $100,000 at inception on 6/30/2016 would have grown to $325,385 which includes $2,056 cash and excludes $8,653 spent on fees and slippage. |
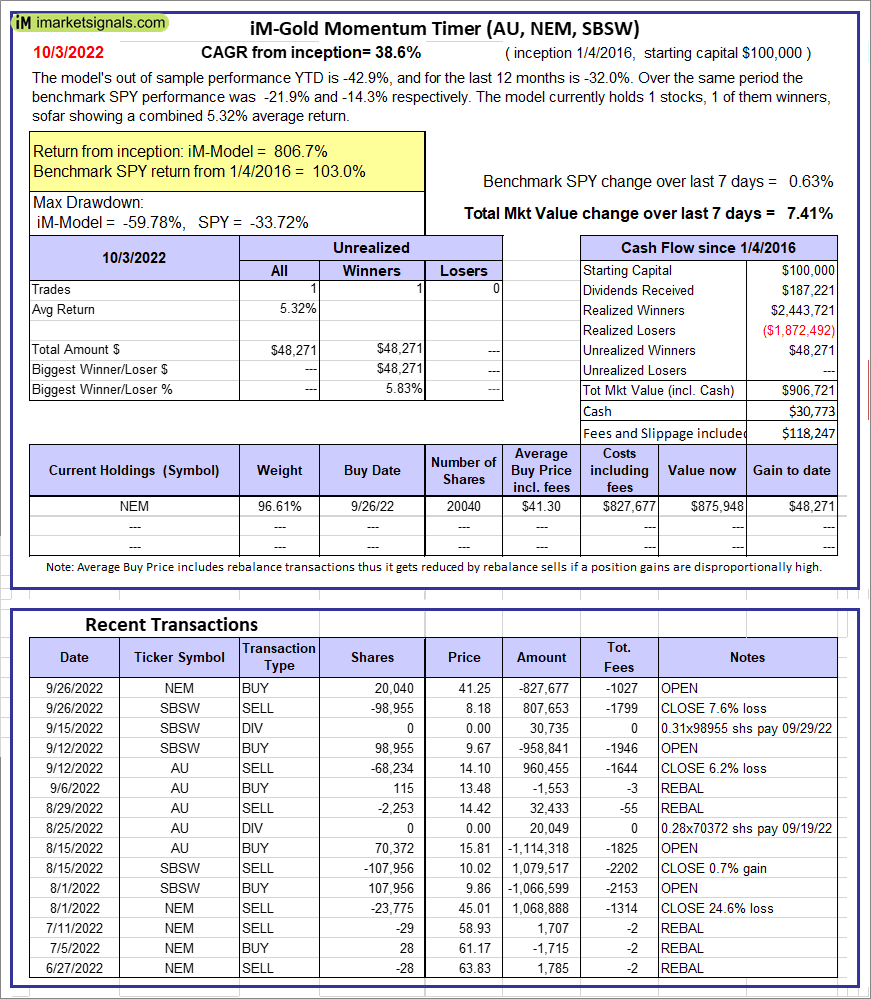 |
iM-Gold Momentum Timer (AU, NEM, SBSW): The model’s out of sample performance YTD is -42.9%, and for the last 12 months is -32.0%. Over the same period the benchmark SPY performance was -21.9% and -14.3% respectively. Over the previous week the market value of iM-Gold Momentum Timer (AU, NEM, SBSW) gained 7.41% at a time when SPY gained 0.63%. A starting capital of $100,000 at inception on 6/30/2016 would have grown to $30,773 which includes $118,247 cash and excludes Gain to date spent on fees and slippage. |
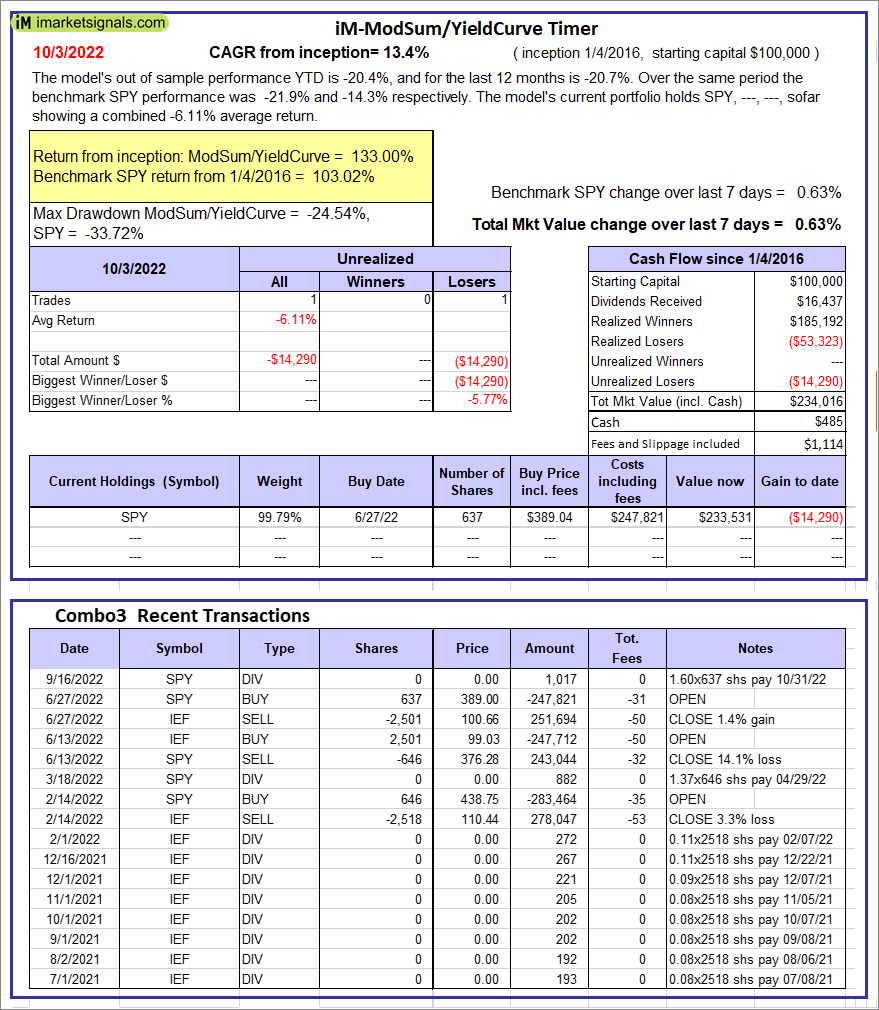 |
iM-ModSum/YieldCurve Timer: The model’s out of sample performance YTD is -20.4%, and for the last 12 months is -20.7%. Over the same period the benchmark SPY performance was -21.9% and -14.3% respectively. Over the previous week the market value of iM-PortSum/YieldCurve Timer gained 0.63% at a time when SPY gained 0.63%. A starting capital of $100,000 at inception on 1/1/2016 would have grown to $234,016 which includes $485 cash and excludes $1,114 spent on fees and slippage. |
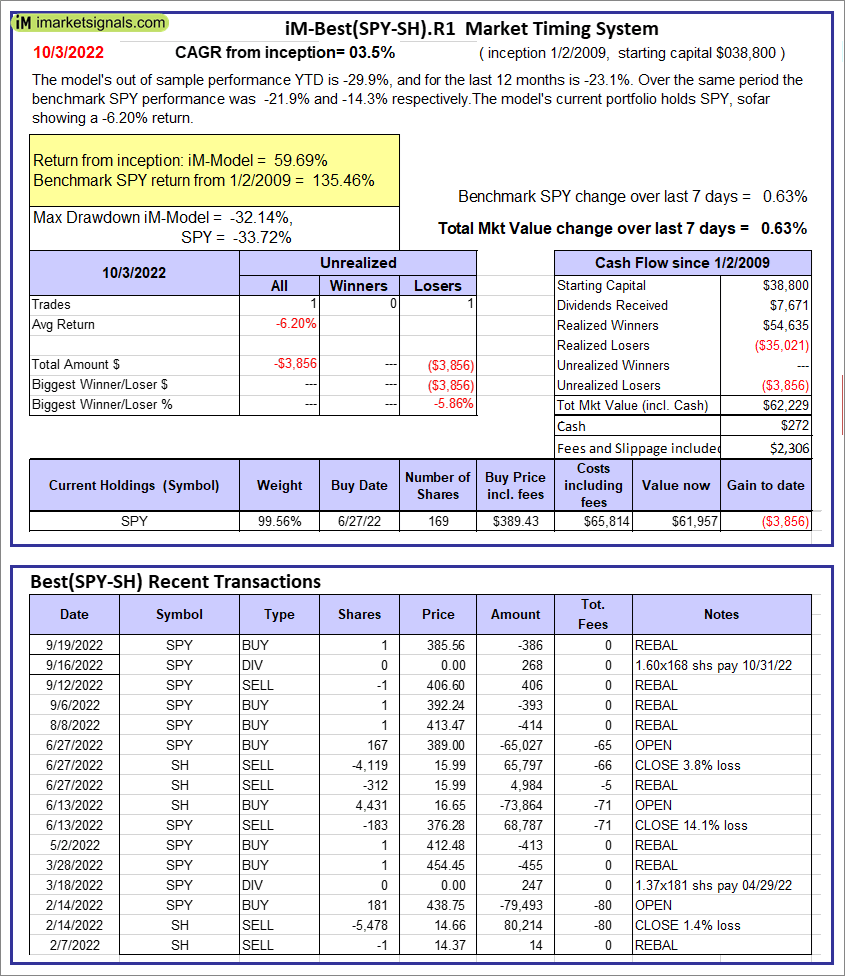 |
iM-Best(SPY-SH).R1: The model’s out of sample performance YTD is -29.9%, and for the last 12 months is -23.1%. Over the same period the benchmark SPY performance was -21.9% and -14.3% respectively. Over the previous week the market value of Best(SPY-SH) gained 0.63% at a time when SPY gained 0.63%. A starting capital of $100,000 at inception on 1/2/2009 would have grown to $62,229 which includes $272 cash and excludes $2,306 spent on fees and slippage. |
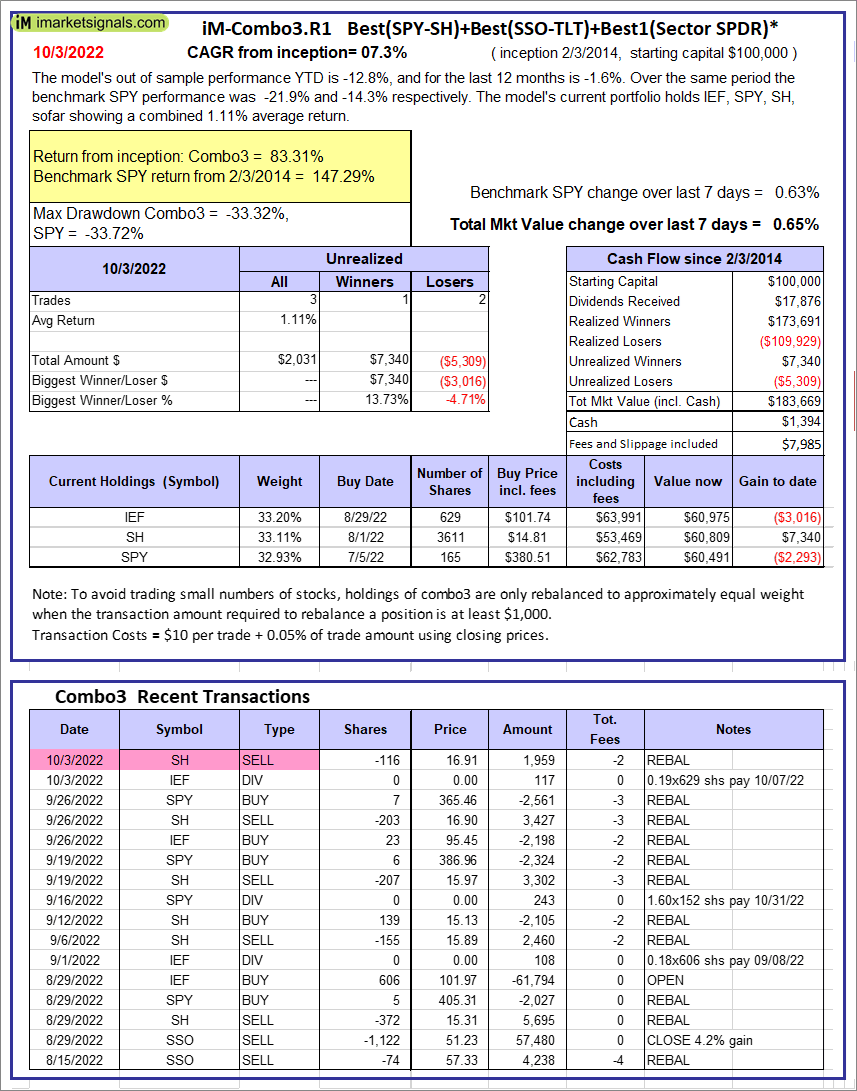 |
iM-Combo3.R1: The model’s out of sample performance YTD is -12.8%, and for the last 12 months is -1.6%. Over the same period the benchmark SPY performance was -21.9% and -14.3% respectively. Over the previous week the market value of iM-Combo3.R1 gained 0.65% at a time when SPY gained 0.63%. A starting capital of $100,000 at inception on 2/3/2014 would have grown to $183,669 which includes $1,394 cash and excludes $7,985 spent on fees and slippage. |
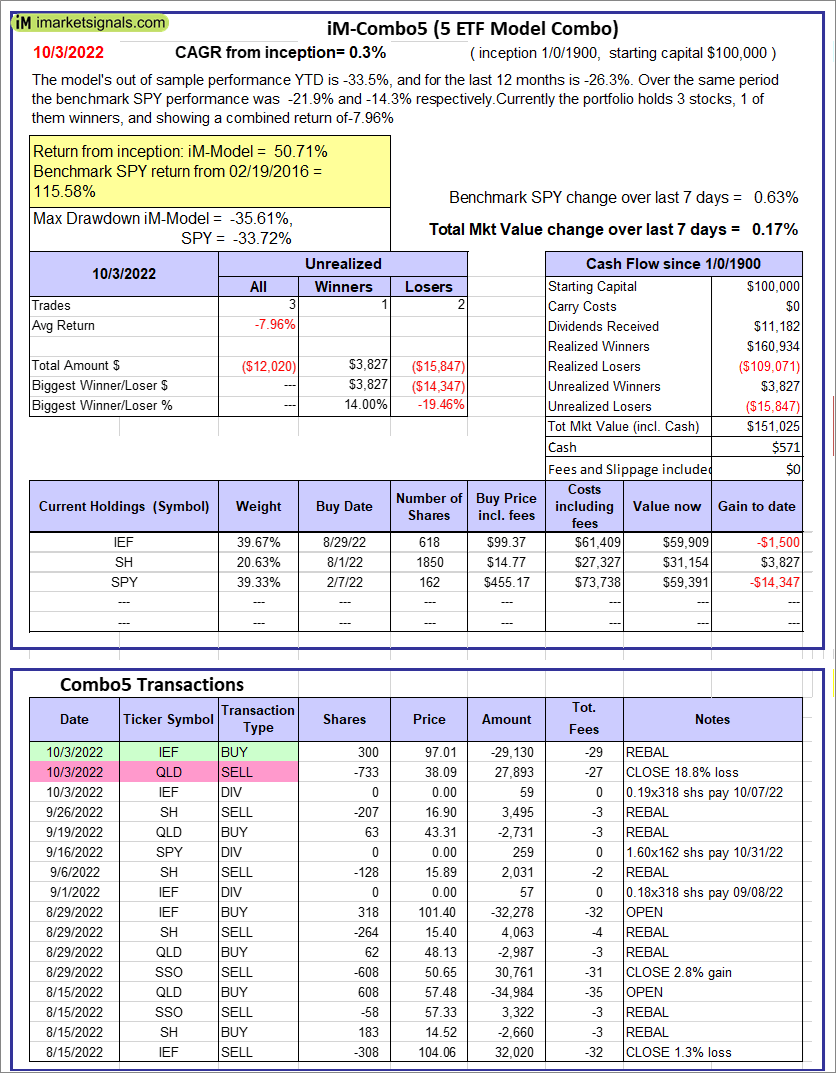 |
iM-Combo5: The model’s out of sample performance YTD is -33.5%, and for the last 12 months is -26.3%. Over the same period the benchmark SPY performance was -21.9% and -14.3% respectively. Over the previous week the market value of iM-Combo5 gained 0.17% at a time when SPY gained 0.63%. A starting capital of $100,000 at inception on 2/22/2016 would have grown to $151,025 which includes $571 cash and excludes $0 spent on fees and slippage. |
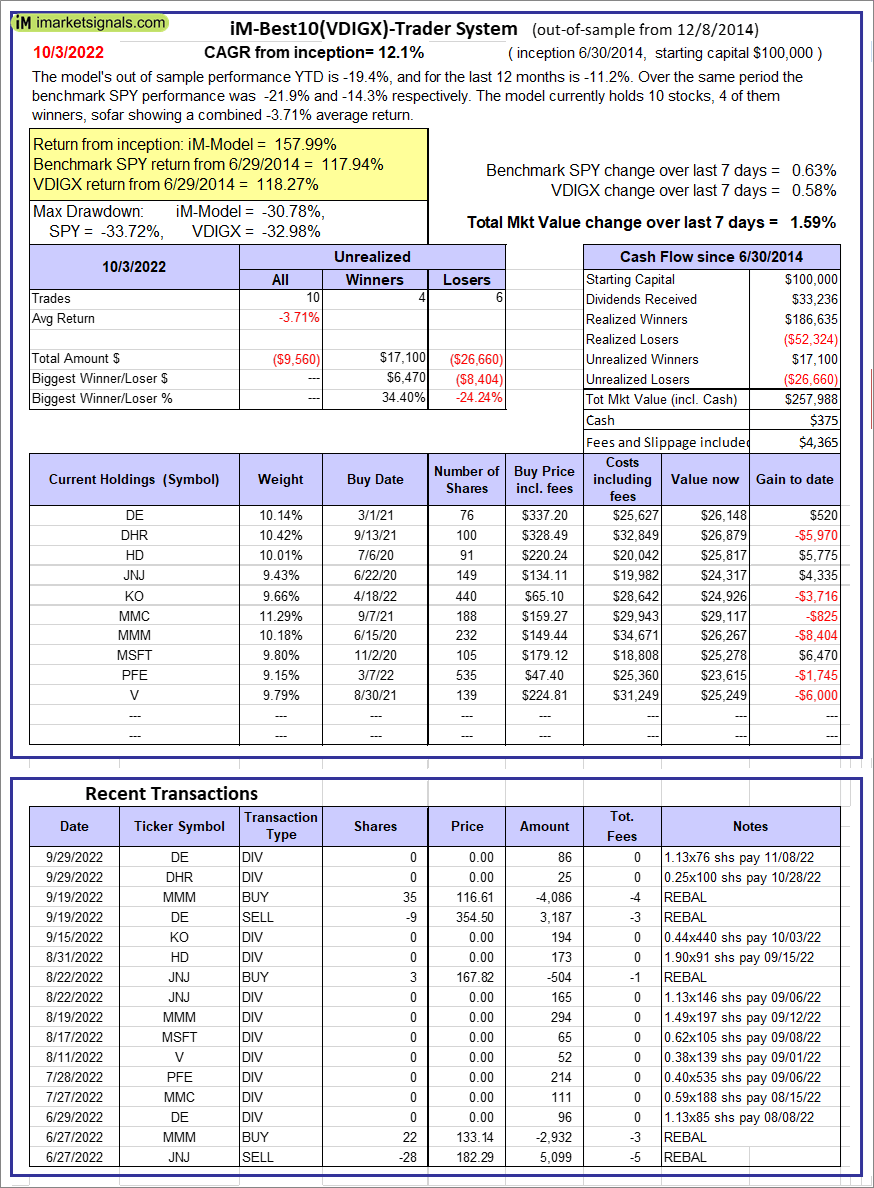 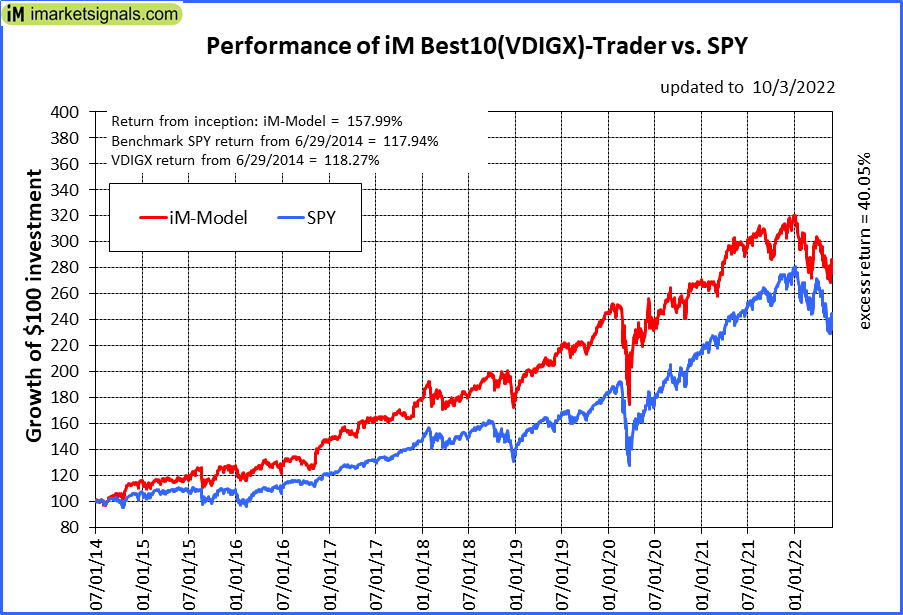 |
iM-Best10(VDIGX)-Trader: The model’s out of sample performance YTD is -19.4%, and for the last 12 months is -11.2%. Over the same period the benchmark SPY performance was -21.9% and -14.3% respectively. Since inception, on 7/1/2014, the model gained 157.99% while the benchmark SPY gained 117.94% and VDIGX gained 118.27% over the same period. Over the previous week the market value of iM-Best10(VDIGX) gained 1.59% at a time when SPY gained 0.63%. A starting capital of $100,000 at inception on 7/1/2014 would have grown to $257,988 which includes $375 cash and excludes $4,365 spent on fees and slippage. |
 |
iM 6-Stock Capital Strength Portfolio: The model’s out of sample performance YTD is -13.4%, and for the last 12 months is -6.8%. Over the same period the benchmark SPY performance was -21.9% and -14.3% respectively. Over the previous week the market value of the iM 6-Stock Capital Strength Portfolio gained 0.04% at a time when SPY gained 0.63%. A starting capital of $100,000 at inception on 10/28/2016 would have grown to $188,170 which includes $4,602 cash and excludes $2,452 spent on fees and slippage. |
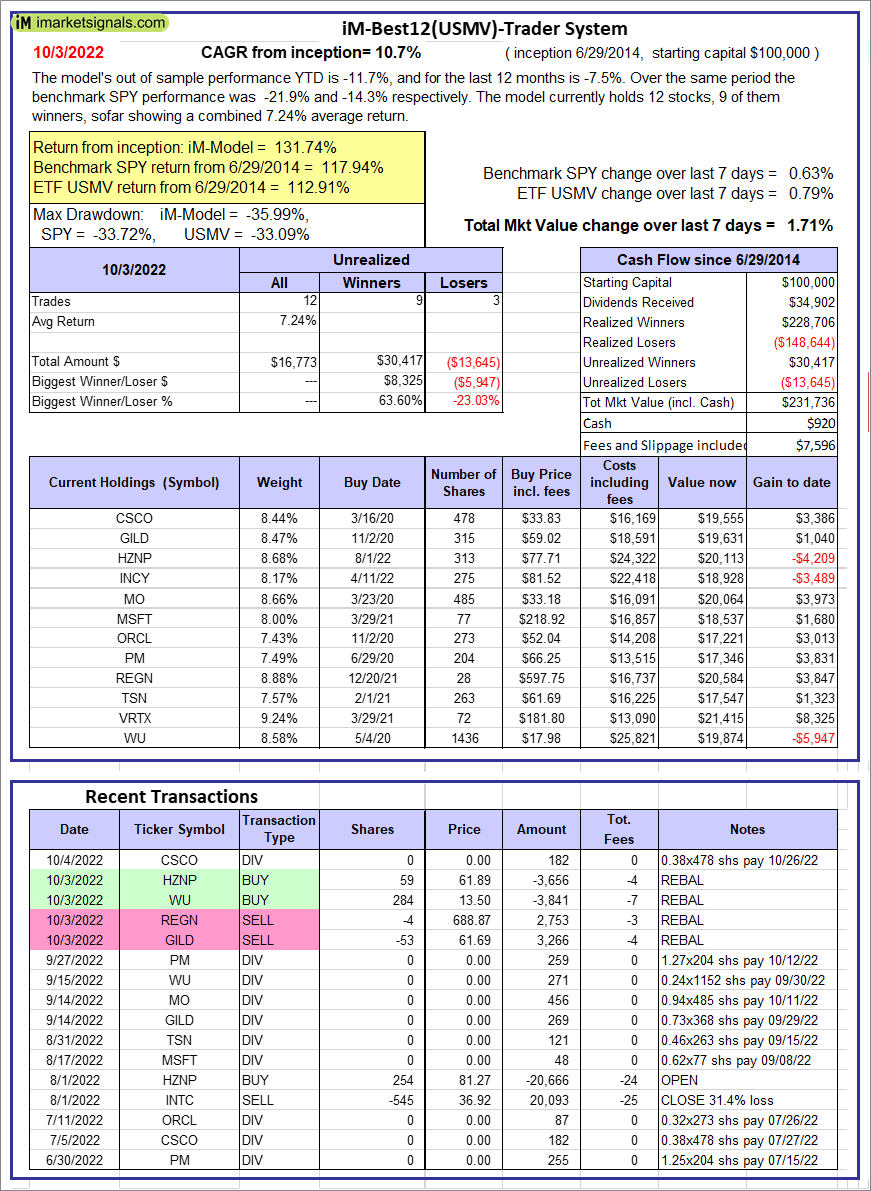 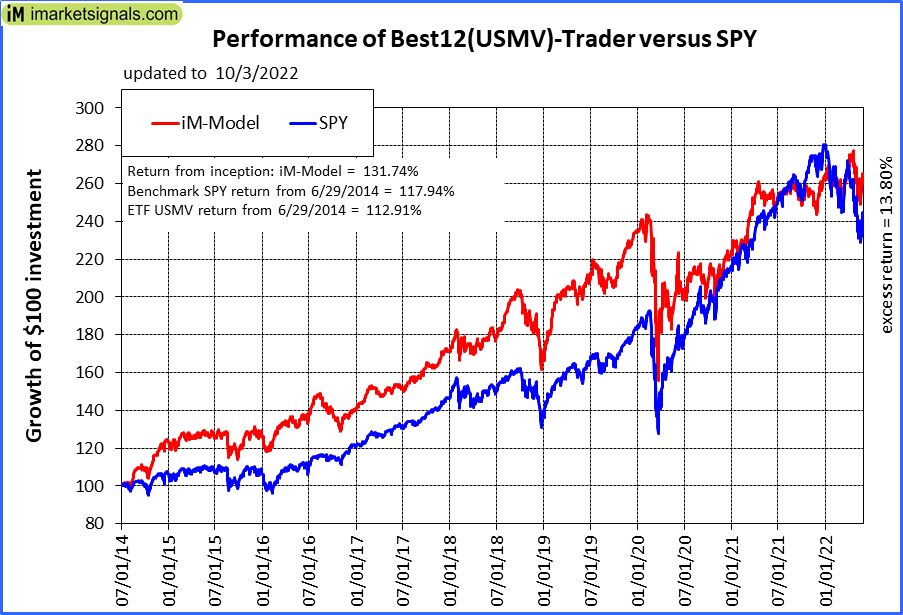 |
iM-Best12(USMV)-Trader: The model’s out of sample performance YTD is -11.7%, and for the last 12 months is -7.5%. Over the same period the benchmark SPY performance was -21.9% and -14.3% respectively. Since inception, on 6/30/2014, the model gained 131.74% while the benchmark SPY gained 117.94% and the ETF USMV gained 112.91% over the same period. Over the previous week the market value of iM-Best12(USMV)-Trader gained 1.71% at a time when SPY gained 0.63%. A starting capital of $100,000 at inception on 6/30/2014 would have grown to $231,736 which includes $920 cash and excludes $7,596 spent on fees and slippage. |
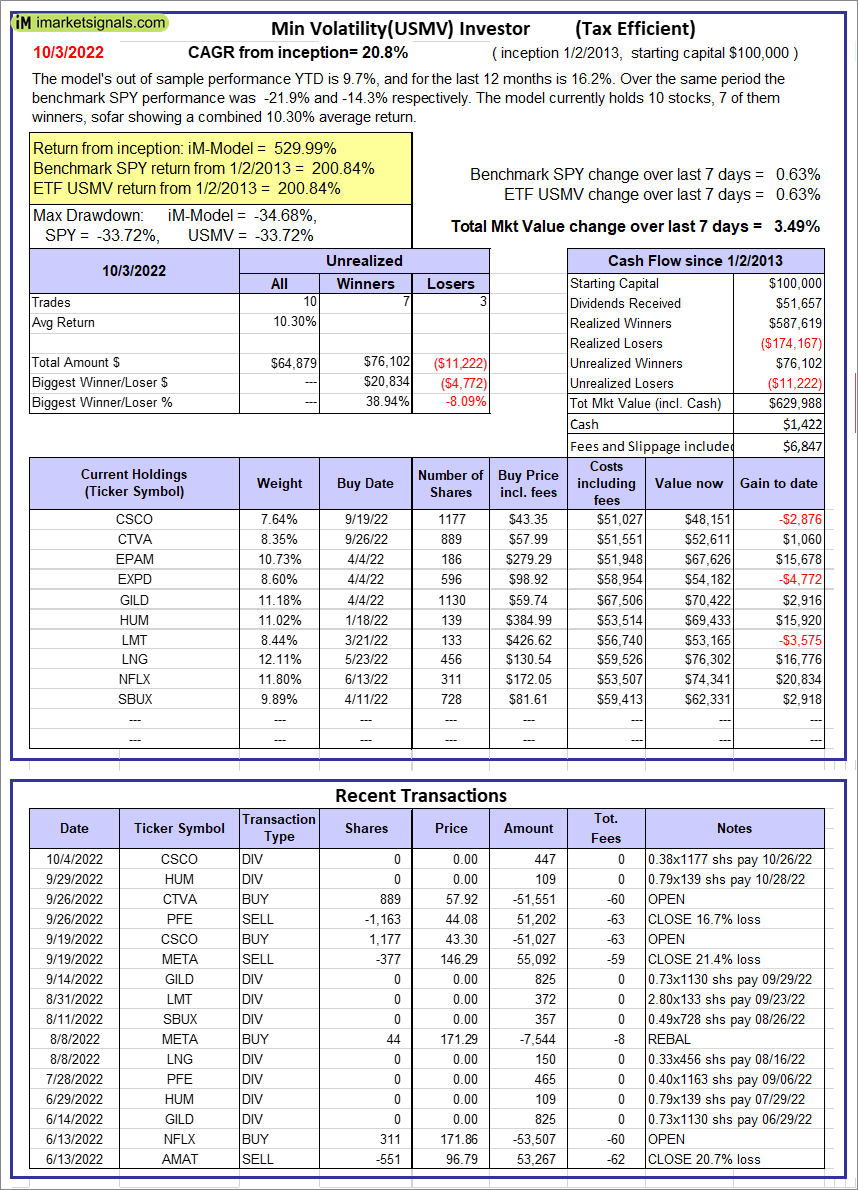 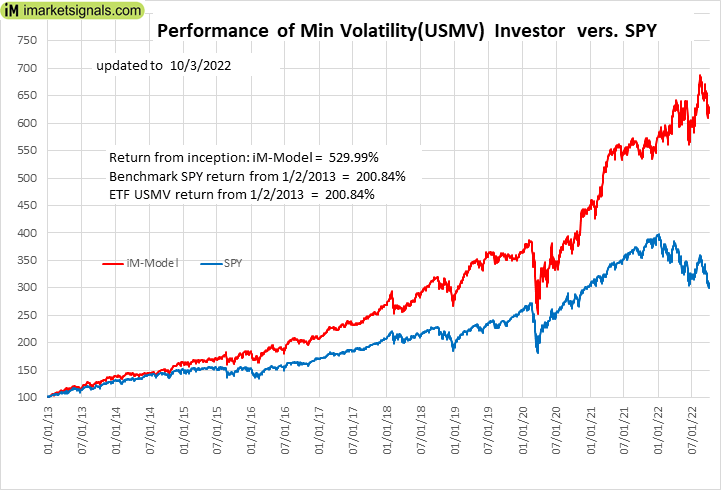 |
iM-Min Volatility(USMV) Investor (Tax Efficient): The model’s out of sample performance YTD is 9.7%, and for the last 12 months is 16.2%. Over the same period the benchmark SPY performance was -21.9% and -14.3% respectively. Since inception, on 1/3/2013, the model gained 529.99% while the benchmark SPY gained 200.84% and the ETF USMV gained 200.84% over the same period. Over the previous week the market value of iM-Best12(USMV)Q1 gained 3.49% at a time when SPY gained 0.63%. A starting capital of $100,000 at inception on 1/3/2013 would have grown to $629,988 which includes $1,422 cash and excludes $6,847 spent on fees and slippage. |
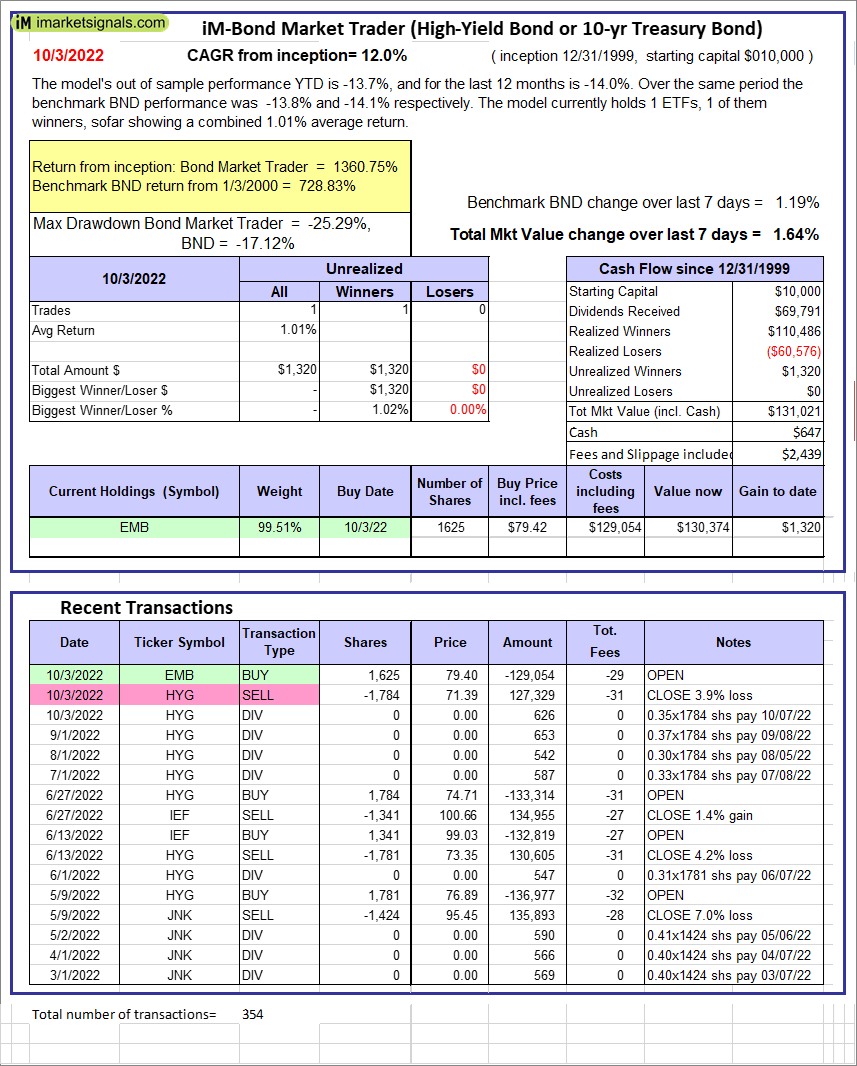 |
iM-Bond Market Trader (High-Yield Bond or 10-yr Treasury Bond): The model’s out of sample performance YTD is -13.7%, and for the last 12 months is -14.0%. Over the same period the benchmark BND performance was -13.8% and -14.1% respectively. Over the previous week the market value of the iM-Bond Market Trader (High-Yield Bond or 10-yr Treasury Bond) gained 1.64% at a time when BND gained 1.19%. A starting capital of $10,000 at inception on 1/3/2000 would have grown to $131,021 which includes $647 cash and excludes $2,439 spent on fees and slippage. |
|
|
iM-ModSum/YieldCurve Timer: The model’s out of sample performance YTD is -20.4%, and for the last 12 months is -20.7%. Over the same period the benchmark SPY performance was -21.9% and -14.3% respectively. Over the previous week the market value of iM-PortSum/YieldCurve Timer gained 0.63% at a time when SPY gained 0.63%. A starting capital of $100,000 at inception on 1/1/2016 would have grown to $234,016 which includes $485 cash and excludes $1,114 spent on fees and slippage. |
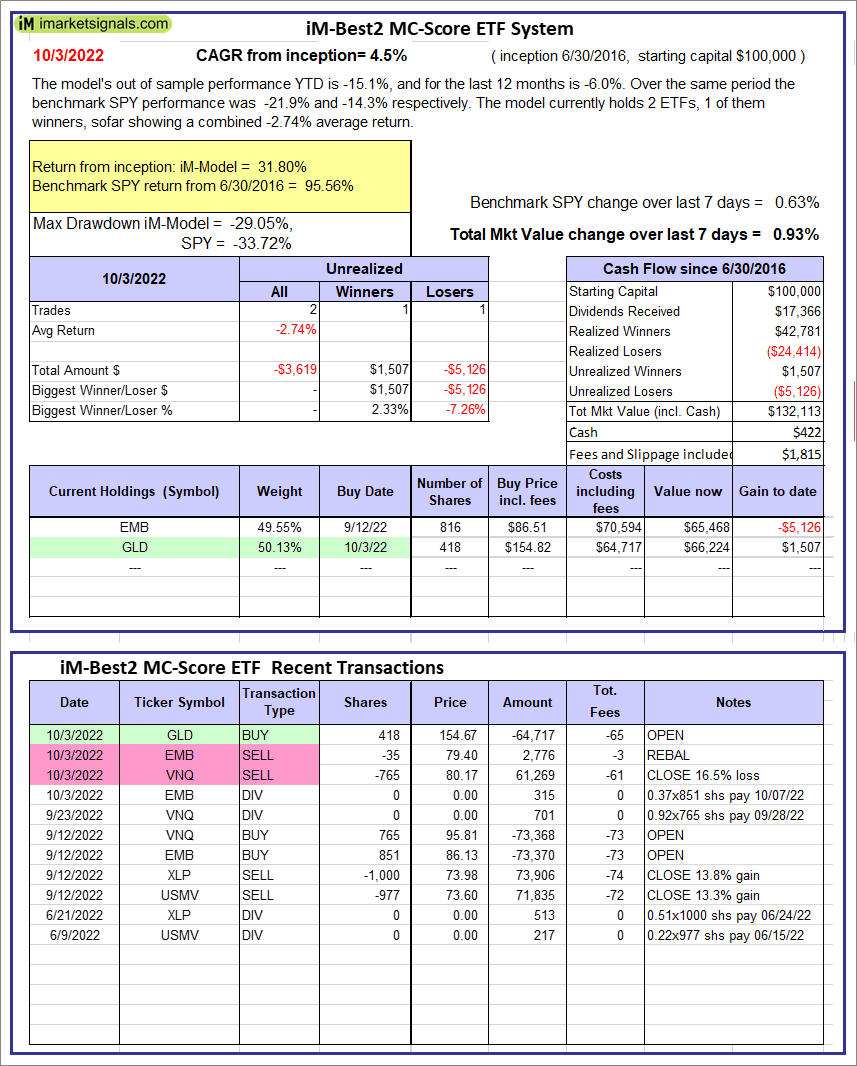 |
iM-Best2 MC-Score ETF System: The model’s out of sample performance YTD is -15.1%, and for the last 12 months is -6.0%. Over the same period the benchmark SPY performance was -21.9% and -14.3% respectively. Over the previous week the market value of the iM-Best2 MC-Score ETF System gained 0.93% at a time when SPY gained 0.63%. A starting capital of $100,000 at inception on 6/30/2016 would have grown to $132,113 which includes $422 cash and excludes $1,815 spent on fees and slippage. |
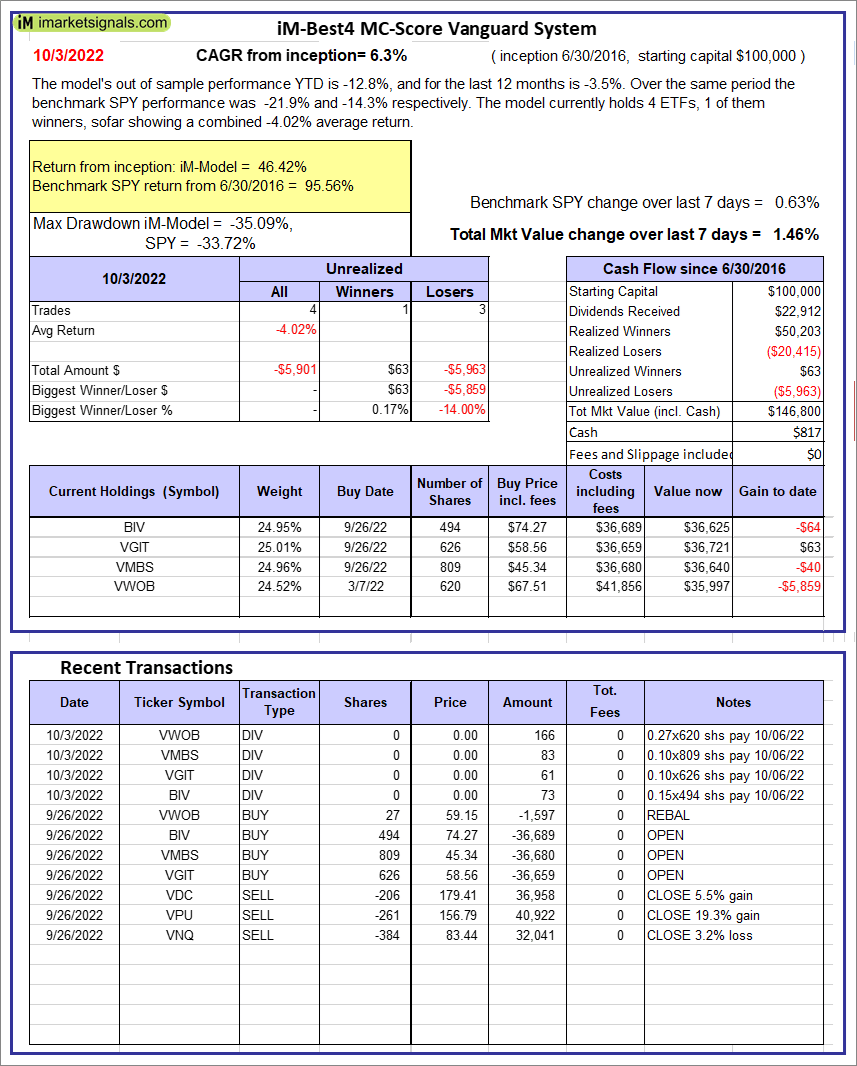 |
iM-Best4 MC-Score Vanguard System: The model’s out of sample performance YTD is -12.8%, and for the last 12 months is -3.5%. Over the same period the benchmark SPY performance was -21.9% and -14.3% respectively. Over the previous week the market value of the iM-Best4 MC-Score Vanguard System gained 1.46% at a time when SPY gained 0.63%. A starting capital of $100,000 at inception on 6/30/2016 would have grown to $146,800 which includes $817 cash and excludes $00 spent on fees and slippage. |
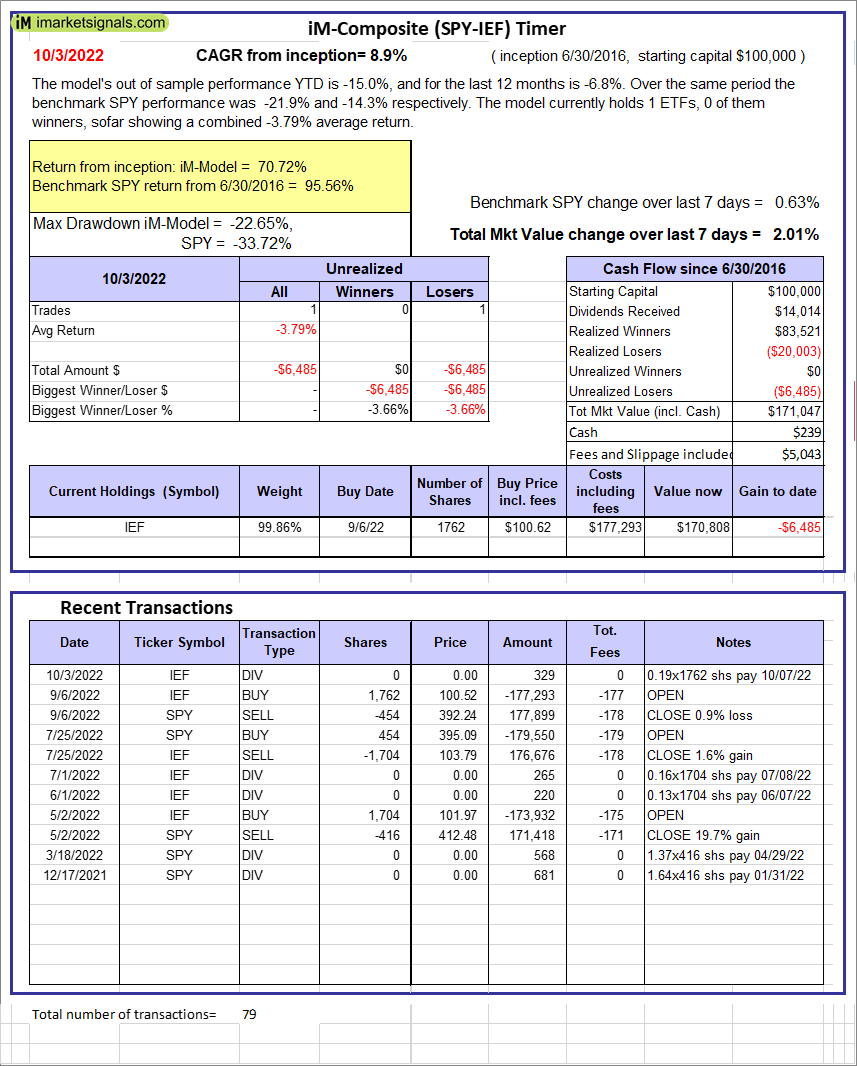 |
iM-Composite (SPY-IEF) Timer: The model’s out of sample performance YTD is -15.0%, and for the last 12 months is -6.8%. Over the same period the benchmark SPY performance was -21.9% and -14.3% respectively. Over the previous week the market value of the iM-Composite (SPY-IEF) Timer gained 2.01% at a time when SPY gained 0.63%. A starting capital of $100,000 at inception on 6/30/2016 would have grown to $171,047 which includes $239 cash and excludes $5,043 spent on fees and slippage. |
 |
iM-Composite(Gold-Stocks-Bond) Timer: The model’s out of sample performance YTD is -10.0%, and for the last 12 months is 1.3%. Over the same period the benchmark SPY performance was -21.9% and -14.3% respectively. Over the previous week the market value of the iM-Composite(Gold-Stocks-Bond) Timer gained 3.36% at a time when SPY gained 0.63%. A starting capital of $100,000 at inception on 6/30/2016 would have grown to $160,814 which includes $34 cash and excludes $8,879 spent on fees and slippage. |
iM-Best Reports – 10/3/2022
Posted in pmp SPY-SH
Leave a Reply
You must be logged in to post a comment.