
  |
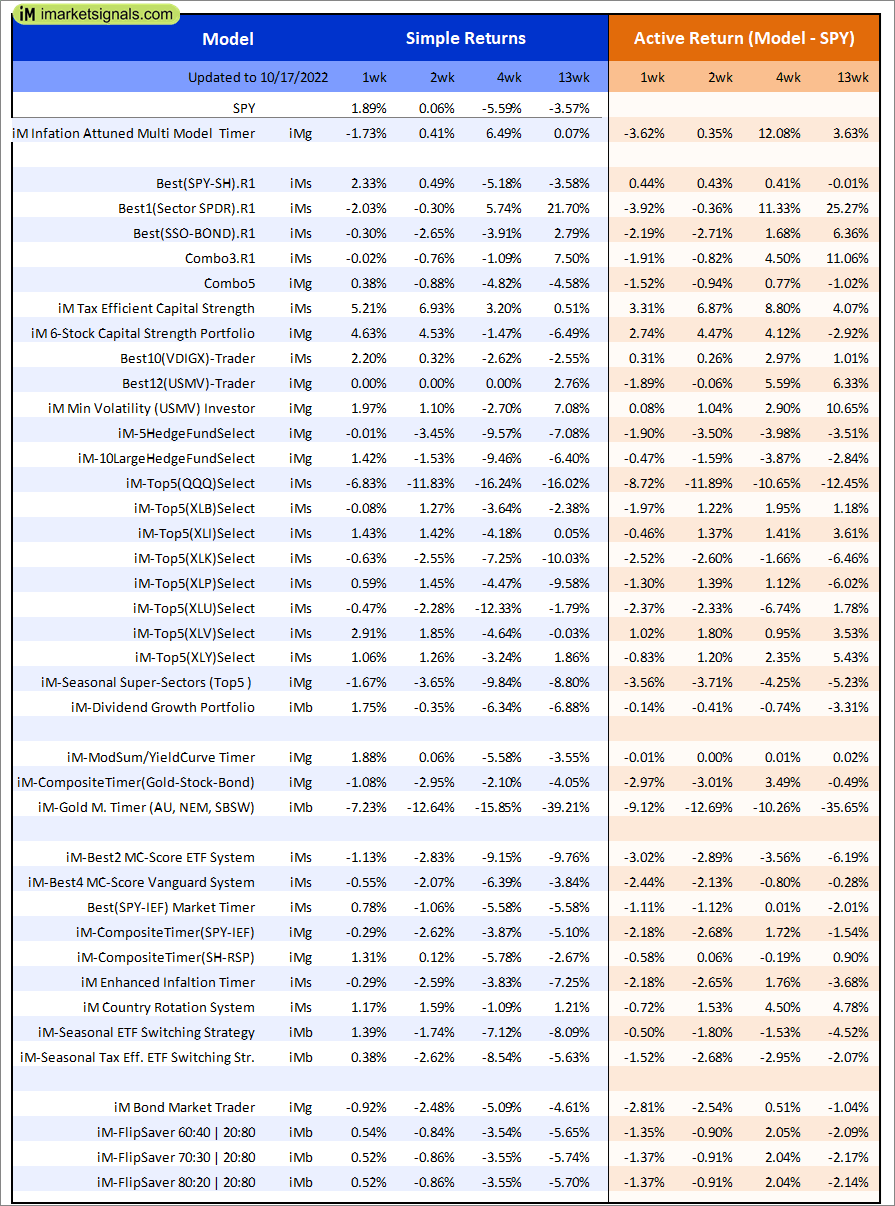
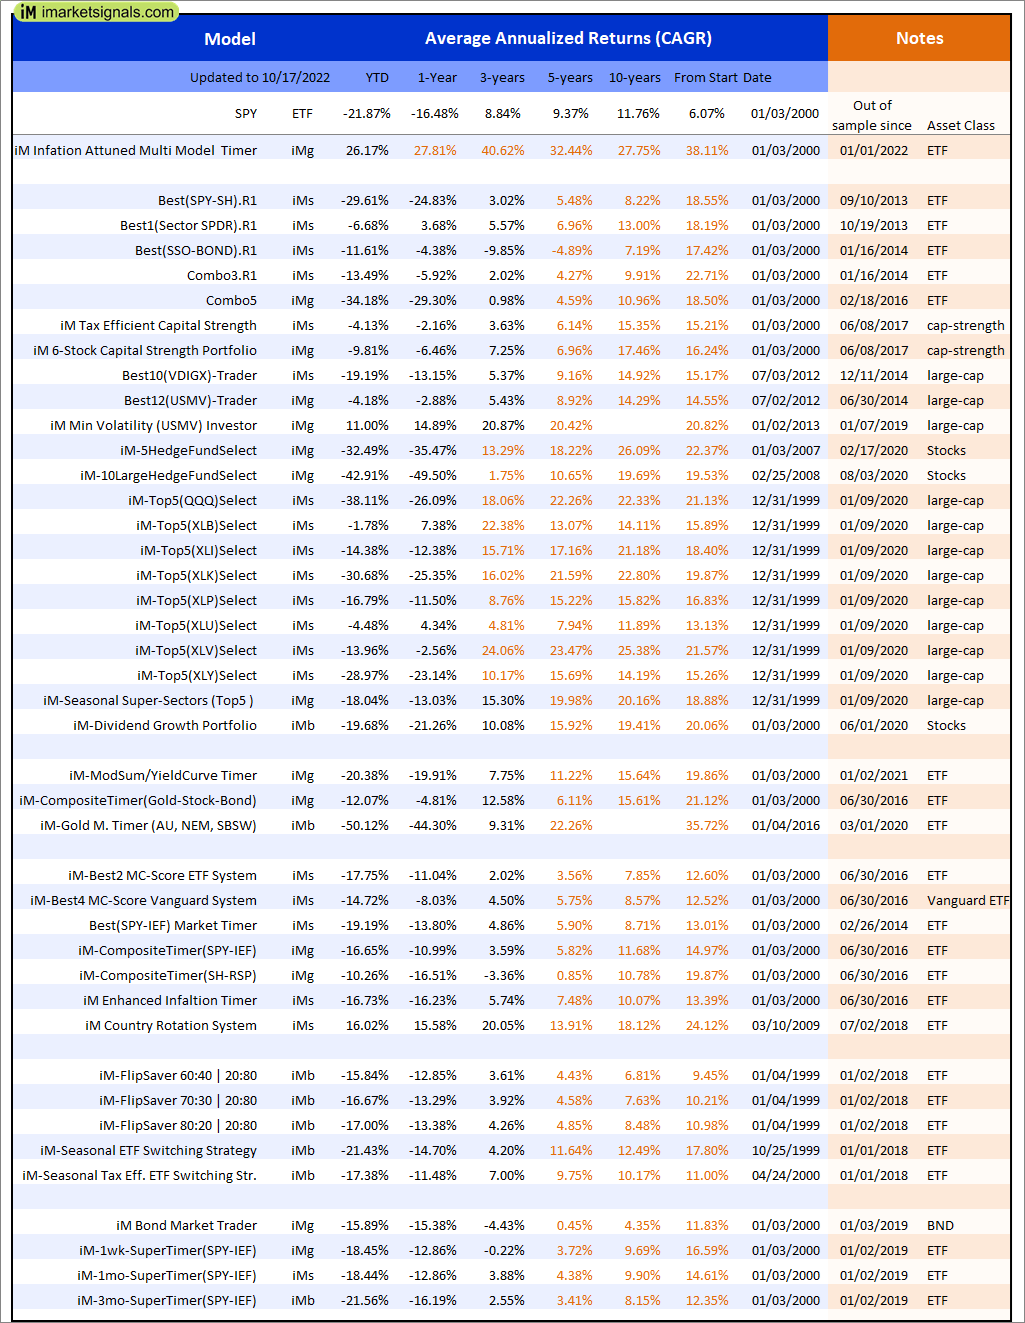
Out of sample performance summary of our models for the past 1, 2, 4 and 13 week periods. The active active return indicates how the models over- or underperformed the benchmark ETF SPY. Also the YTD, and the 1-, 3-, 5- and 10-year annualized returns are shown in the second table |
 |
iM-FlipSaver 60:40 | 20:80 – 2017: The model’s out of sample performance YTD is -16.3%, and for the last 12 months is -13.2%. Over the same period the benchmark E60B40 performance was -19.0% and -15.6% respectively. Over the previous week the market value of iM-FlipSaver 80:20 | 20:80 gained 0.52% at a time when SPY gained 0.96%. A starting capital of $100,000 at inception on 7/16/2015 would have grown to $136,258 which includes $738 cash and excludes $2,673 spent on fees and slippage. |
 |
iM-FlipSaver 70:30 | 20:80 – 2017: The model’s out of sample performance YTD is -16.7%, and for the last 12 months is -13.3%. Over the same period the benchmark E60B40 performance was -19.0% and -15.6% respectively. Over the previous week the market value of iM-FlipSaver 70:30 | 20:80 gained 0.52% at a time when SPY gained 0.96%. A starting capital of $100,000 at inception on 7/15/2015 would have grown to $140,124 which includes $850 cash and excludes $2,831 spent on fees and slippage. |
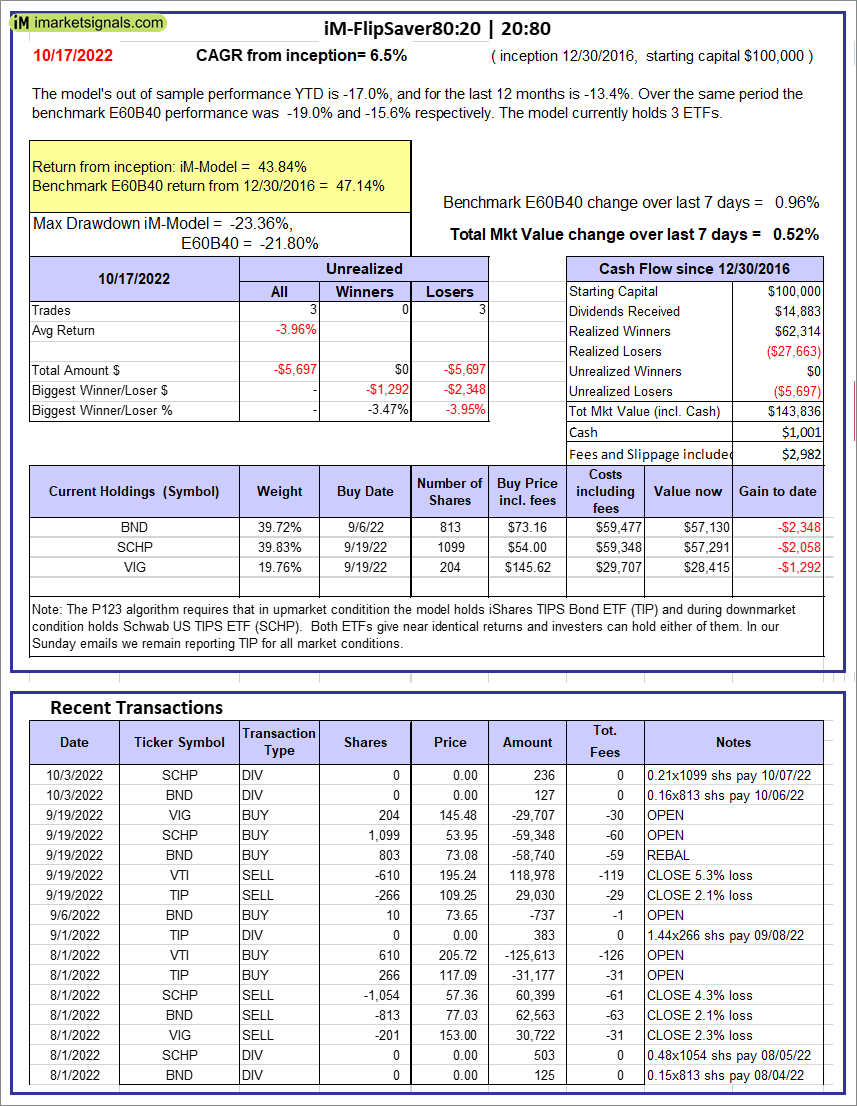 |
iM-FlipSaver 80:20 | 20:80 – 2017: The model’s out of sample performance YTD is -17.0%, and for the last 12 months is -13.4%. Over the same period the benchmark E60B40 performance was -19.0% and -15.6% respectively. Over the previous week the market value of iM-FlipSaver 80:20 | 20:80 gained 0.52% at a time when SPY gained 0.96%. A starting capital of $100,000 at inception on 1/2/2017 would have grown to $143,836 which includes $1,001 cash and excludes $2,982 spent on fees and slippage. |
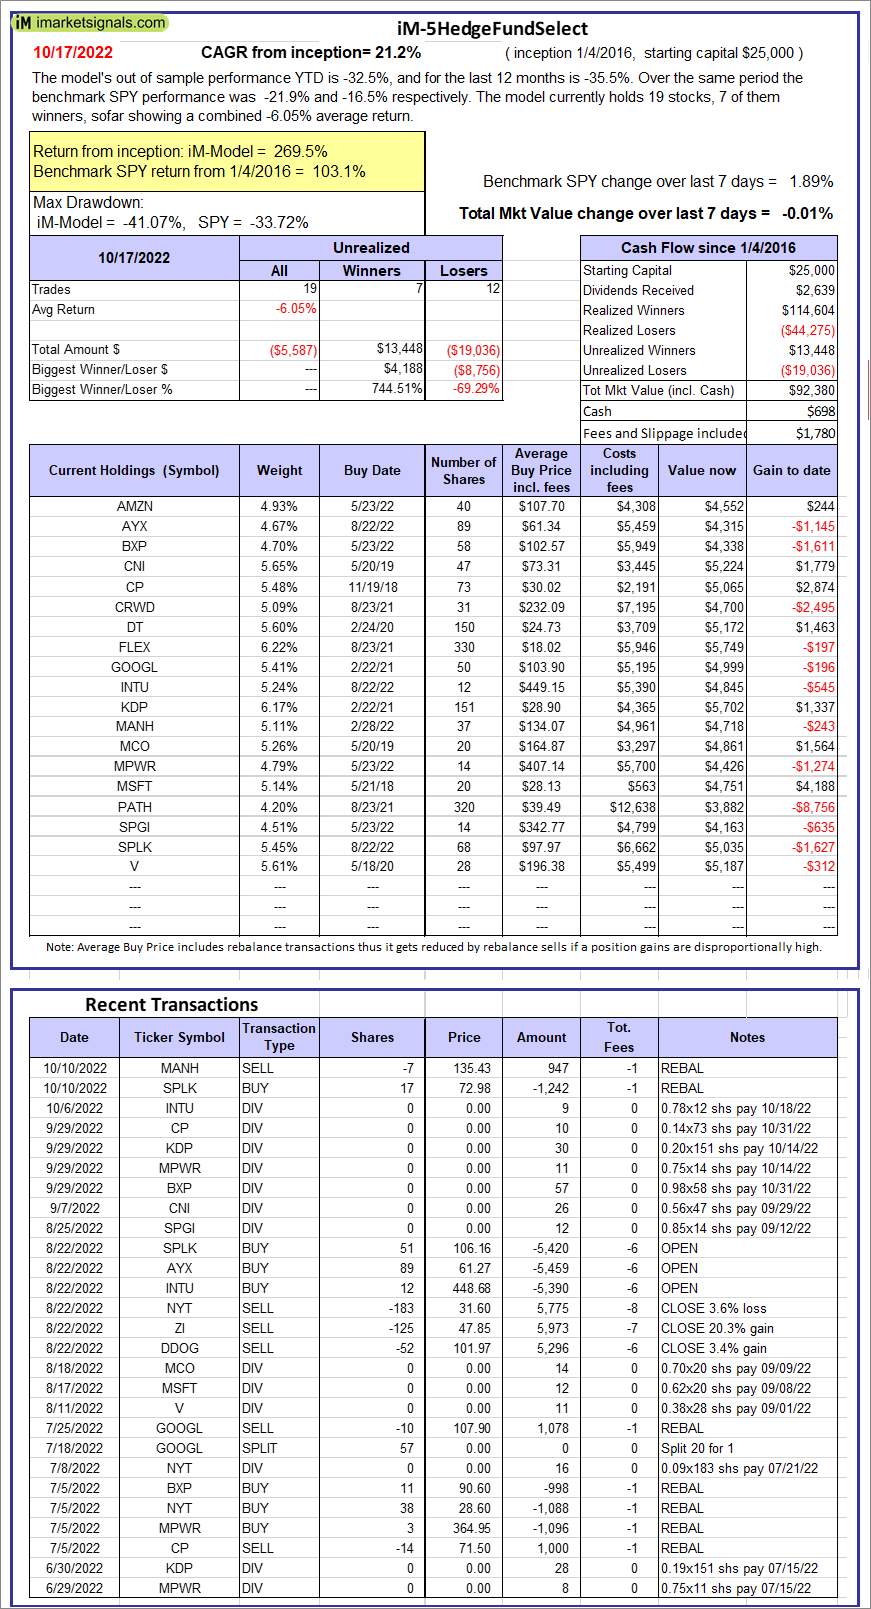 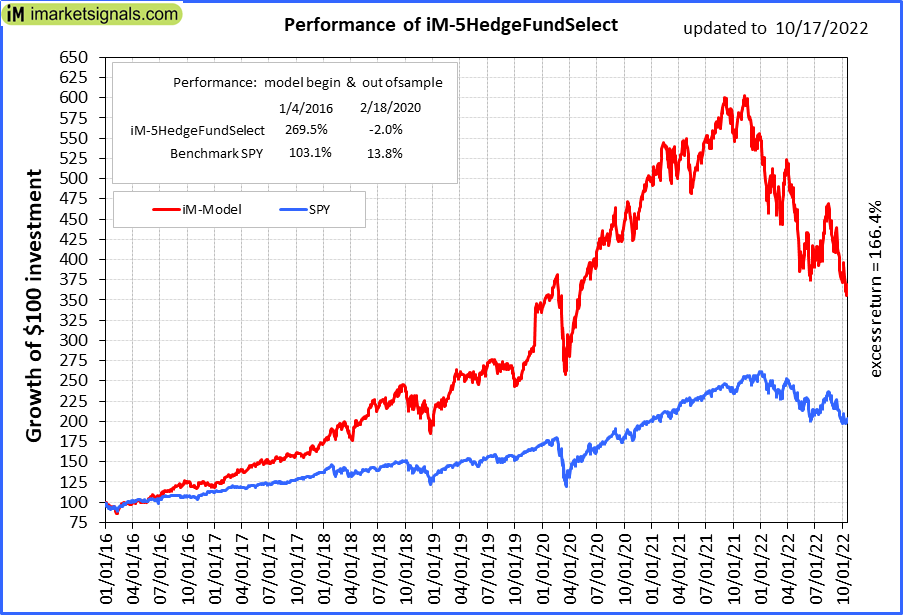 |
iM-5HedgeFundSelect: Since inception, on 1/5/2016, the model gained 269.52% while the benchmark SPY gained 103.14% over the same period. Over the previous week the market value of iM-5HedgeFundSelect gained -0.01% at a time when SPY gained 1.89%. A starting capital of $25,000 at inception on 1/5/2016 would have grown to $92,380 which includes $698 cash and excludes $1,780 spent on fees and slippage. |
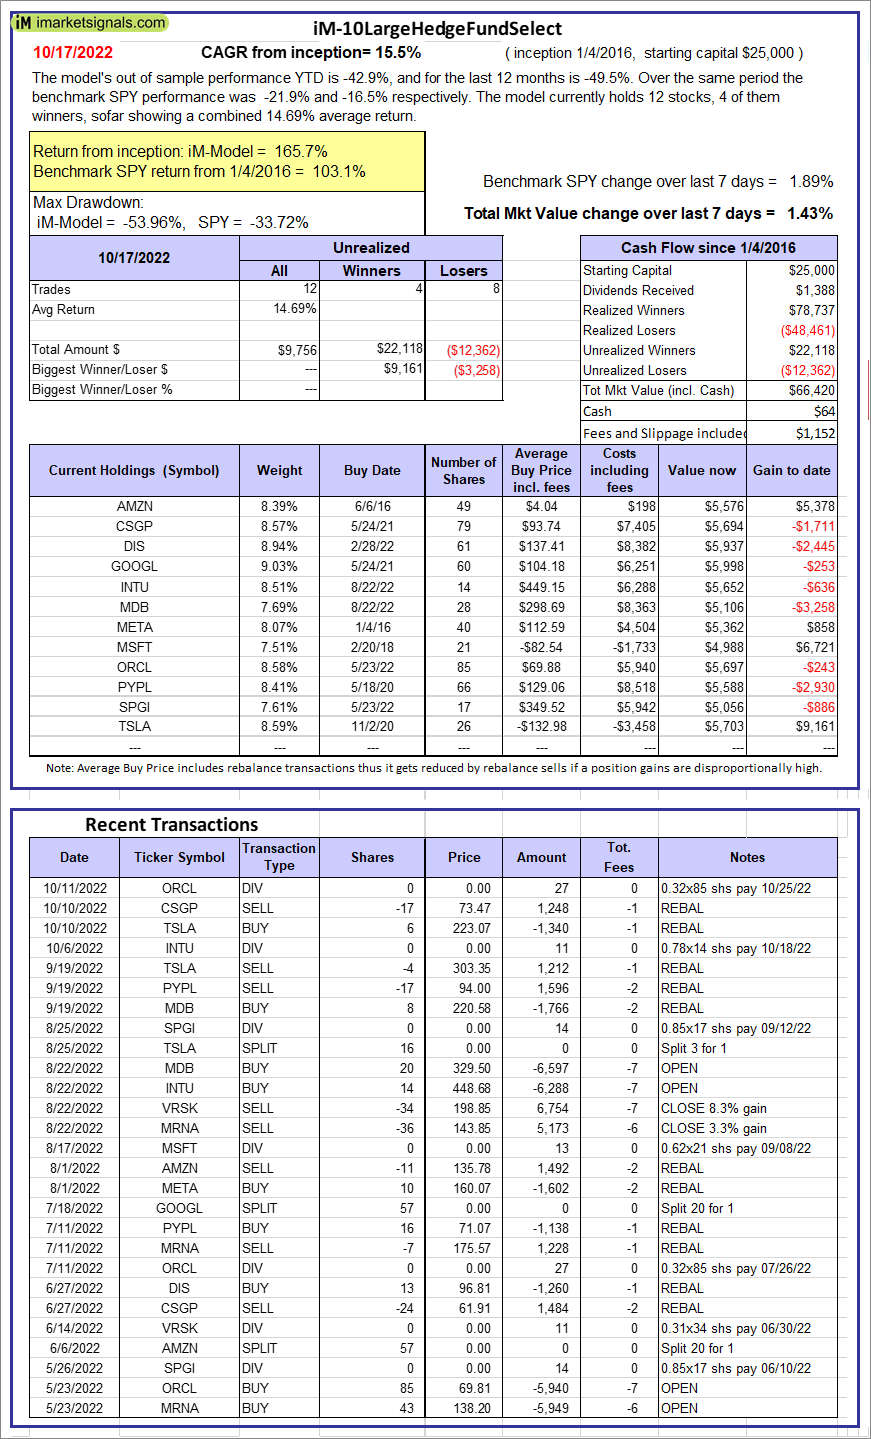 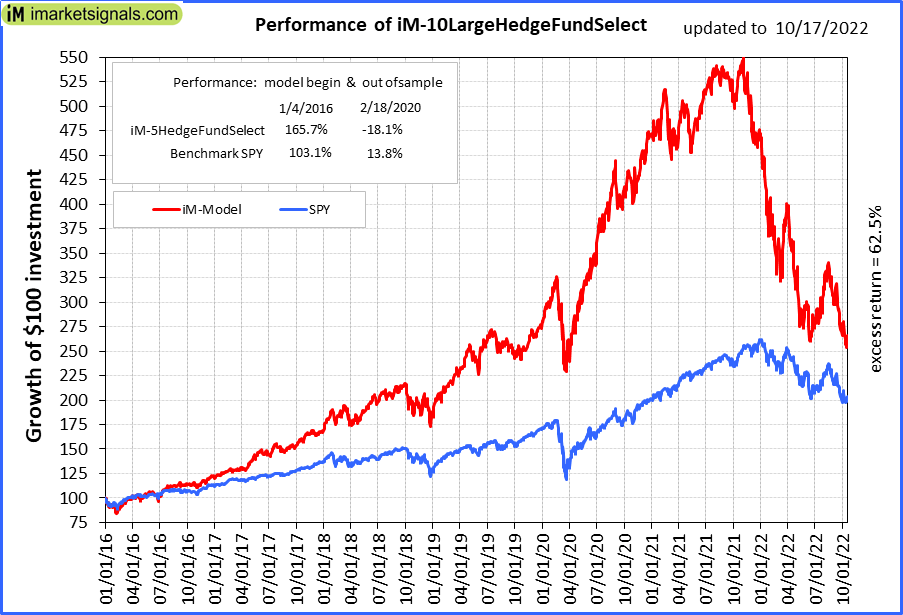 |
iM-10LargeHedgeFundSelect: Since inception, on 1/5/2016, the model gained 165.68% while the benchmark SPY gained 103.14% over the same period. Over the previous week the market value of iM-10LargeHedgeFundSelect gained 1.43% at a time when SPY gained 1.89%. A starting capital of $25,000 at inception on 1/5/2016 would have grown to $66,420 which includes $64 cash and excludes $1,152 spent on fees and slippage. |
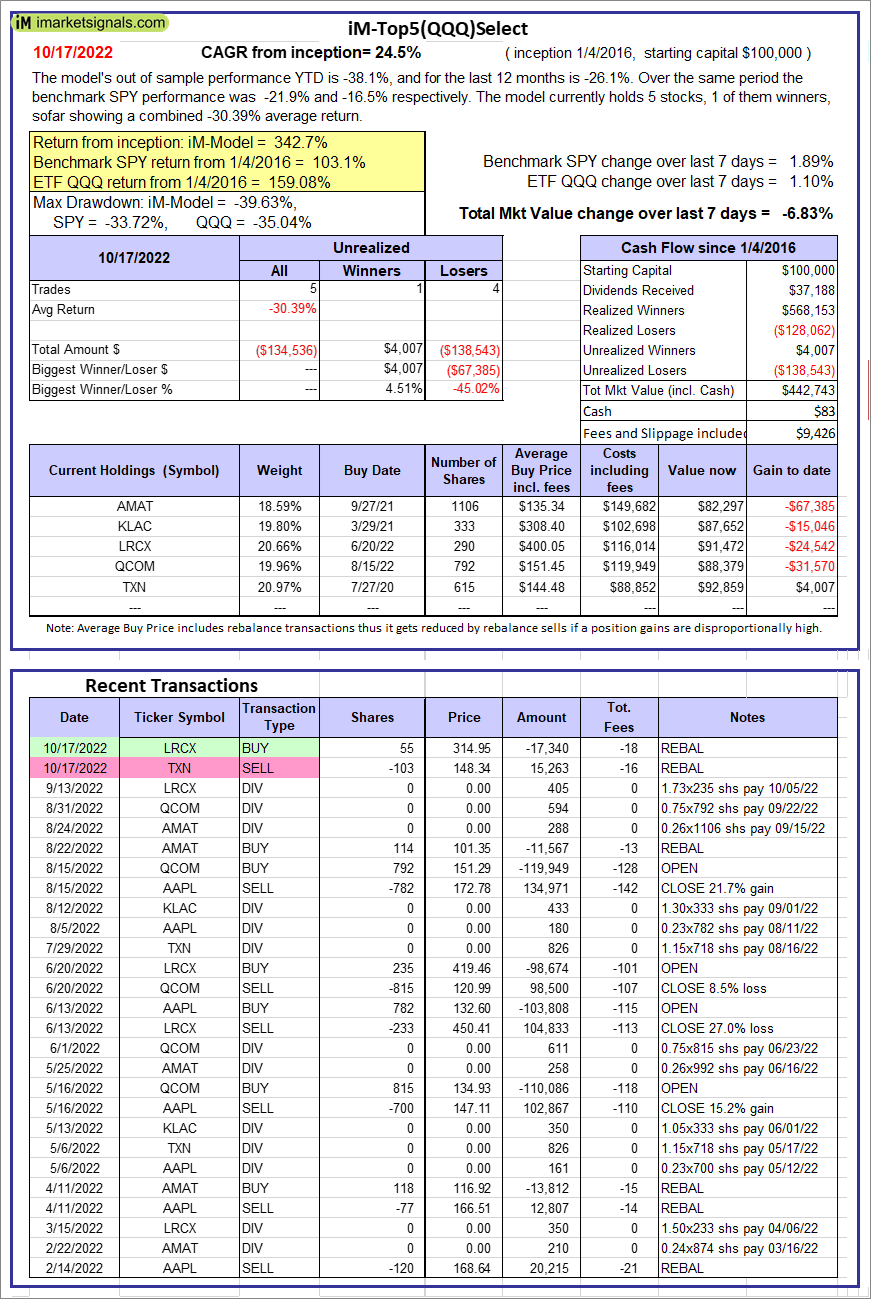 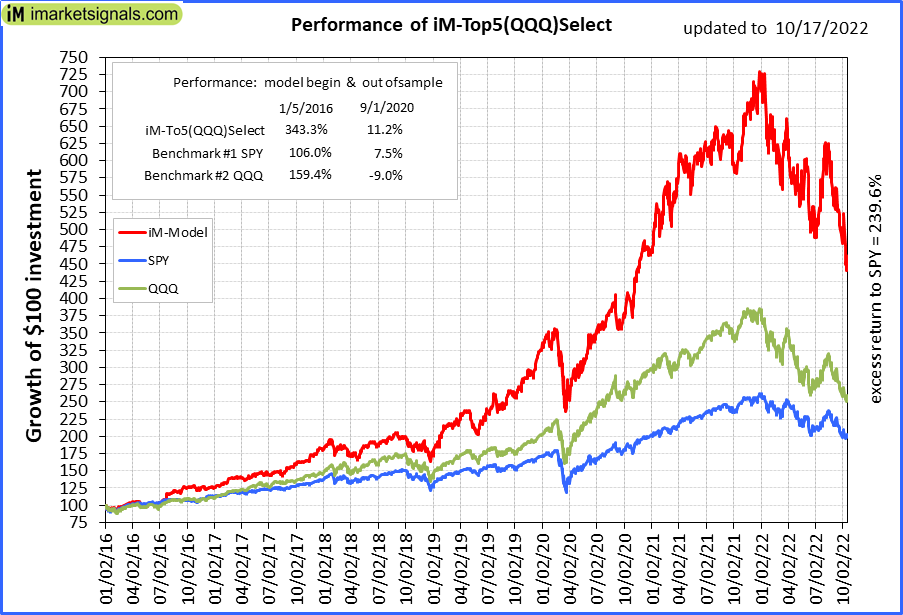 |
iM-Top5(QQQ)Select: Since inception, on 1/5/2016, the model gained 342.74% while the benchmark SPY gained 103.14% over the same period. Over the previous week the market value of iM-Top5(QQQ)Select gained -6.83% at a time when SPY gained 1.89%. A starting capital of $100,000 at inception on 1/5/2016 would have grown to $442,743 which includes $83 cash and excludes $9,426 spent on fees and slippage. |
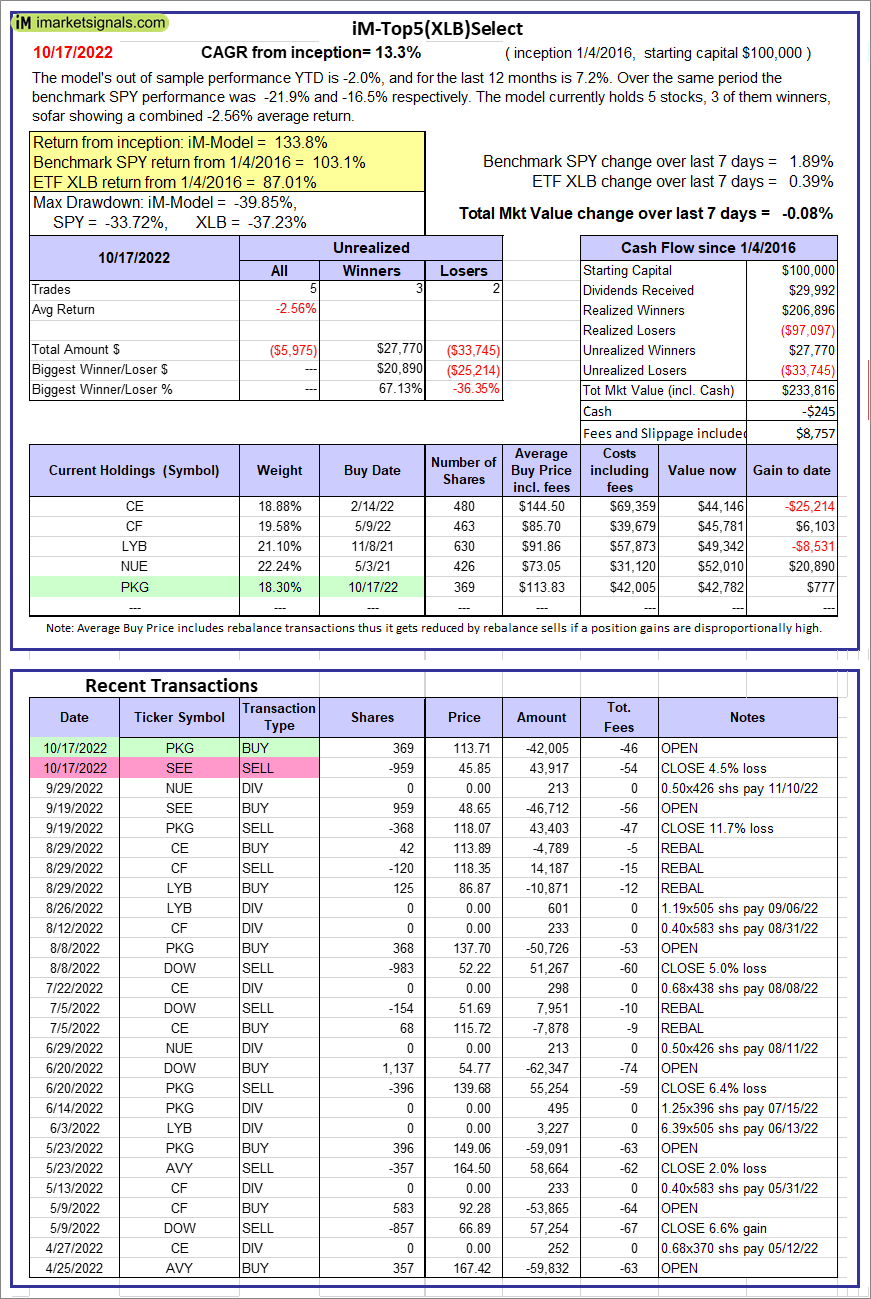 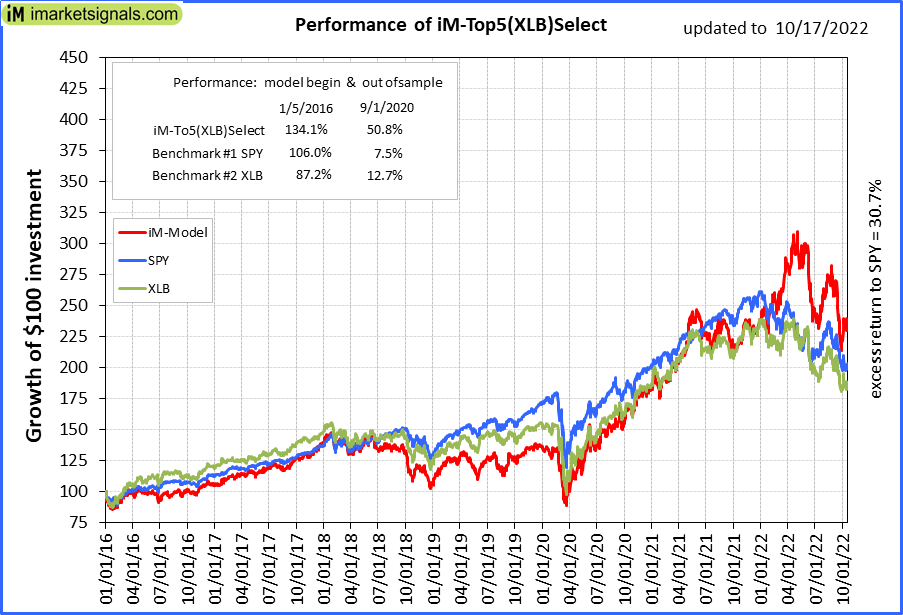 |
iM-Top5(XLB)Select: Since inception, on 1/5/2016, the model gained 133.82% while the benchmark SPY gained 103.14% over the same period. Over the previous week the market value of iM-Top5(XLB)Select gained -0.08% at a time when SPY gained 1.89%. A starting capital of $100,000 at inception on 1/5/2016 would have grown to $233,816 which includes -$245 cash and excludes $8,757 spent on fees and slippage. |
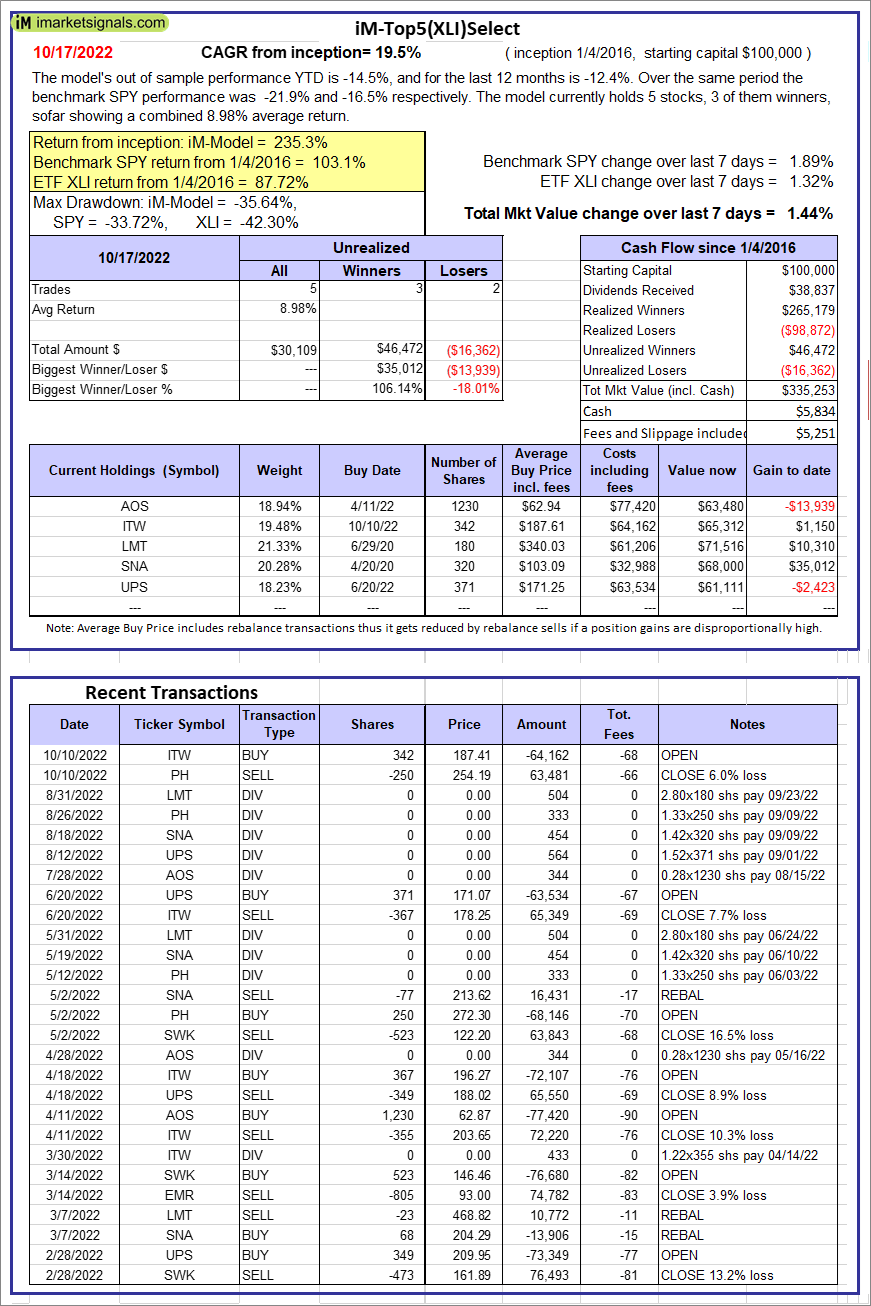 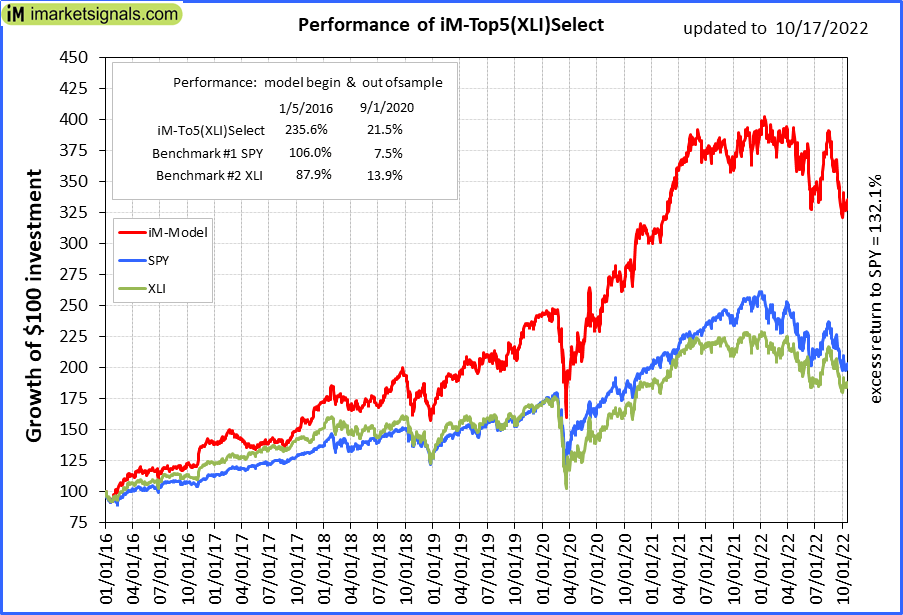 |
iM-Top5(XLI)Select: Since inception, on 1/5/2016, the model gained 235.25% while the benchmark SPY gained 103.14% over the same period. Over the previous week the market value of iM-Top5(XLI)Select gained 1.44% at a time when SPY gained 1.89%. A starting capital of $100,000 at inception on 1/5/2016 would have grown to $335,253 which includes $5,834 cash and excludes $5,251 spent on fees and slippage. |
  |
iM-Top5(XLK)Select: Since inception, on 1/5/2016, the model gained 348.37% while the benchmark SPY gained 103.14% over the same period. Over the previous week the market value of iM-Top5(XLK)Select gained -0.62% at a time when SPY gained 1.89%. A starting capital of $100,000 at inception on 1/5/2016 would have grown to $448,370 which includes $4,715 cash and excludes $1,738 spent on fees and slippage. |
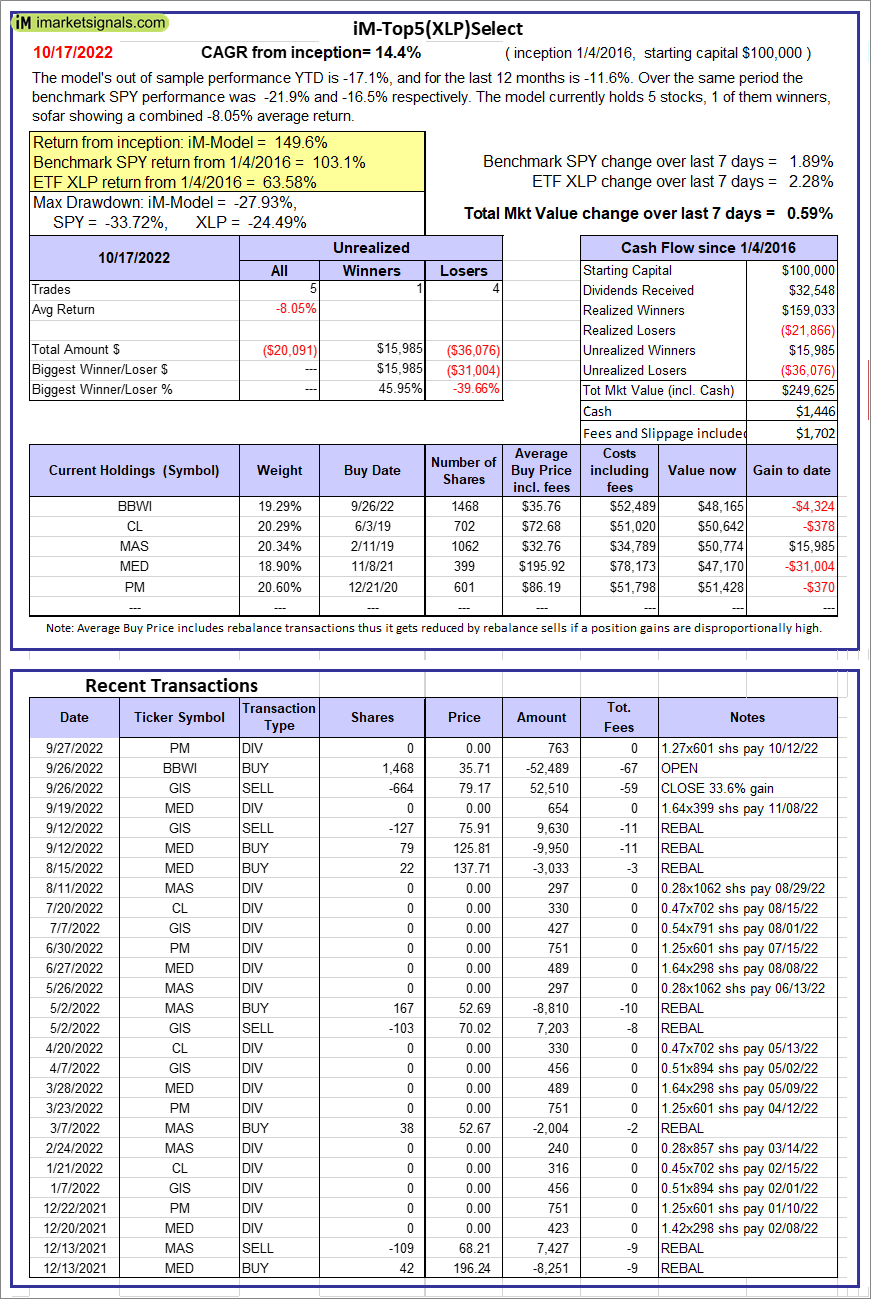 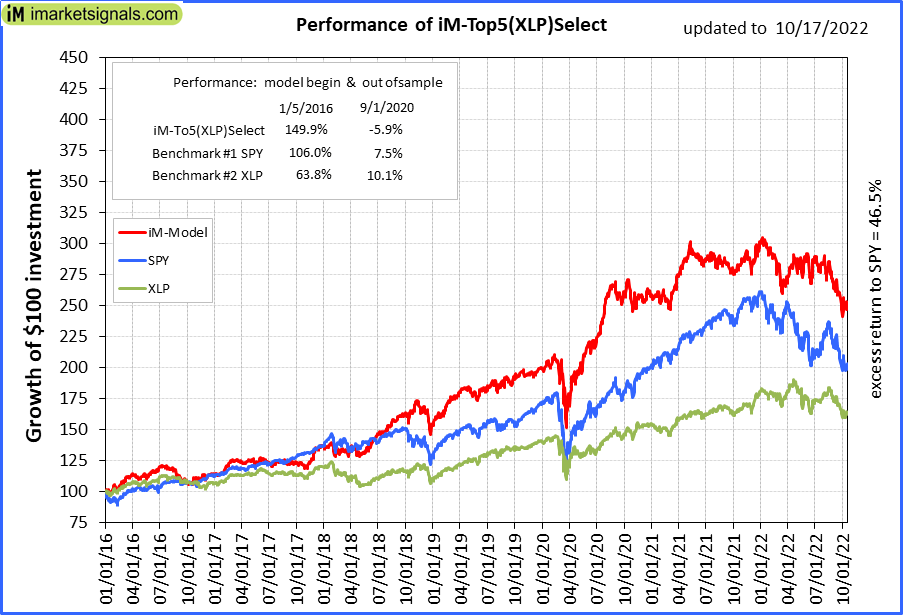 |
iM-Top5(XLP)Select: Since inception, on 1/5/2016, the model gained 149.63% while the benchmark SPY gained 103.14% over the same period. Over the previous week the market value of iM-Top5(XLP)Select gained 0.59% at a time when SPY gained 1.89%. A starting capital of $100,000 at inception on 1/5/2016 would have grown to $249,625 which includes $1,446 cash and excludes $1,702 spent on fees and slippage. |
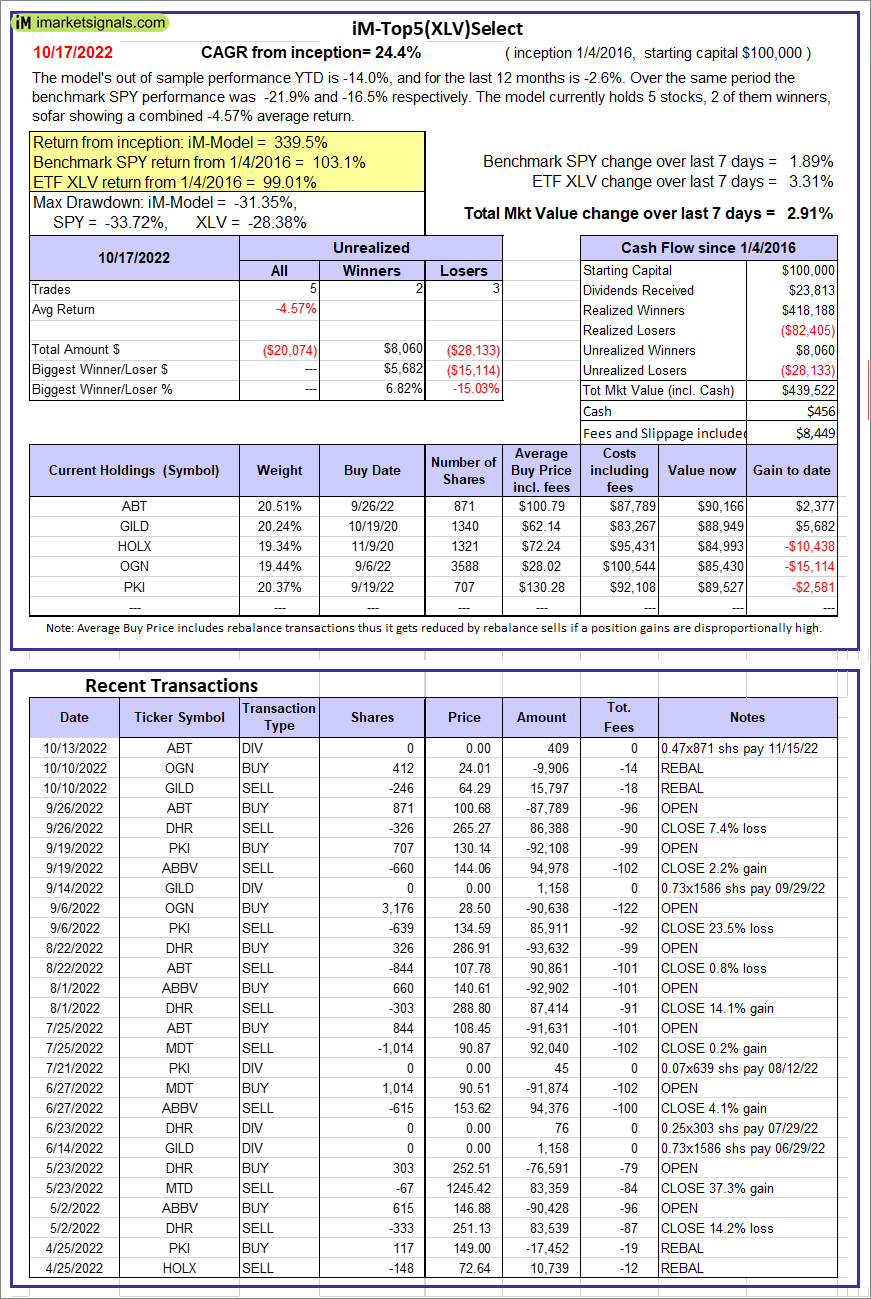 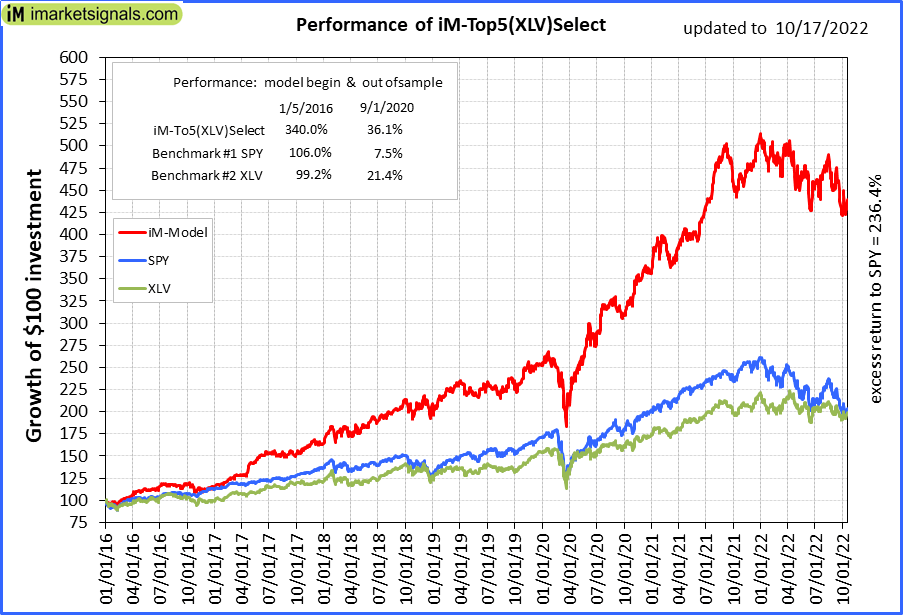 |
iM-Top5(XLV)Select: Since inception, on 1/5/2016, the model gained 339.52% while the benchmark SPY gained 103.14% over the same period. Over the previous week the market value of iM-Top5(XLV)Select gained 2.91% at a time when SPY gained 1.89%. A starting capital of $100,000 at inception on 1/5/2016 would have grown to $439,522 which includes $456 cash and excludes $8,449 spent on fees and slippage. |
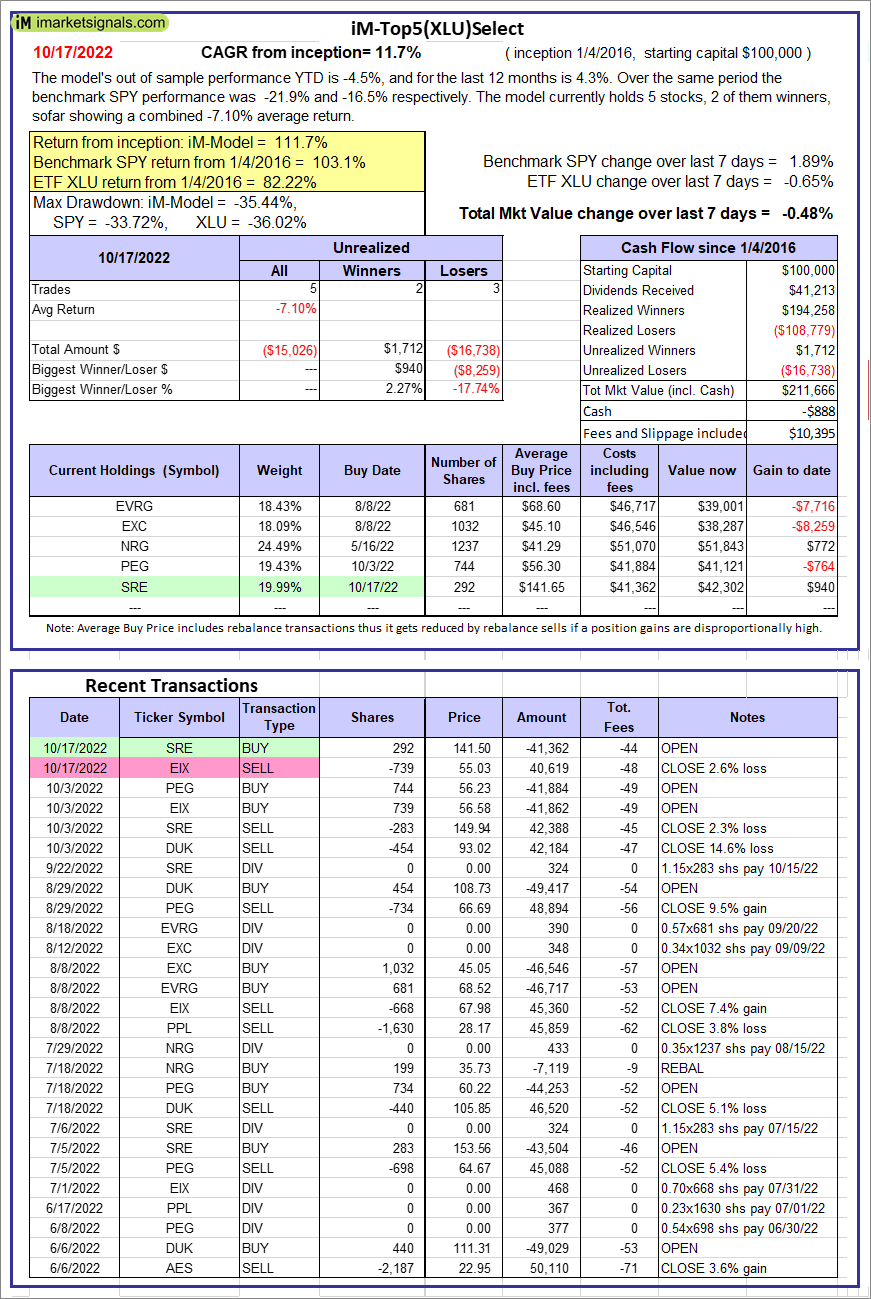 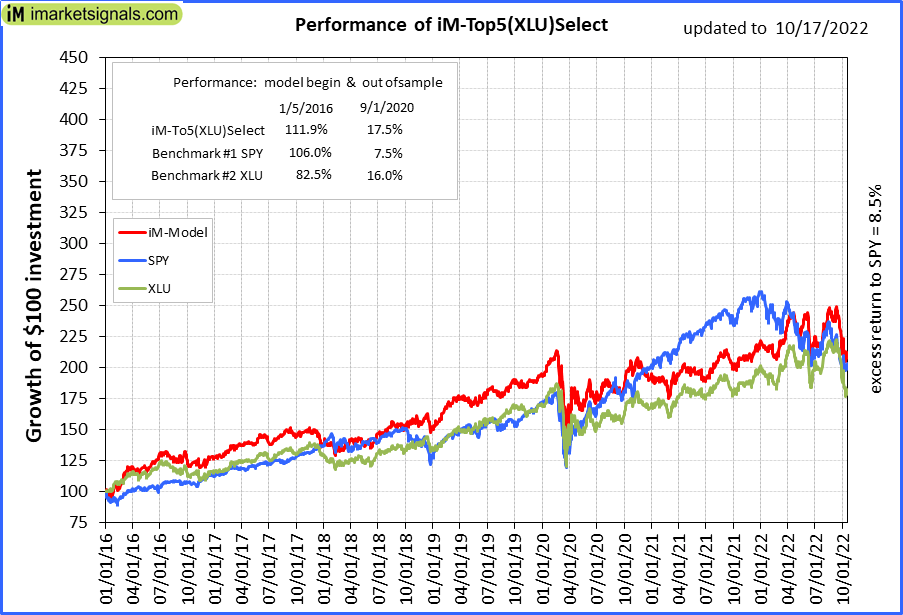 |
iM-Top5(XLU)Select: Since inception, on 1/5/2016, the model gained 111.67% while the benchmark SPY gained 103.14% over the same period. Over the previous week the market value of iM-Top5(XLU)Select gained -0.48% at a time when SPY gained 1.89%. A starting capital of $100,000 at inception on 1/5/2016 would have grown to $211,666 which includes -$888 cash and excludes $10,395 spent on fees and slippage. |
 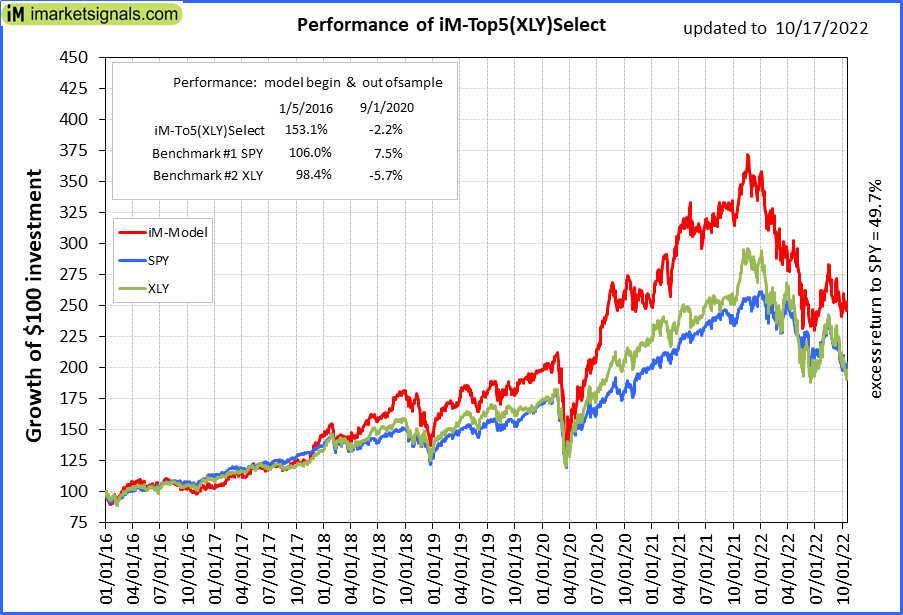 |
iM-Top5(XLY)Select: Since inception, on 1/5/2016, the model gained 152.85% while the benchmark SPY gained 103.14% over the same period. Over the previous week the market value of iM-Top5(XLY)Select gained 1.06% at a time when SPY gained 1.89%. A starting capital of $100,000 at inception on 1/5/2016 would have grown to $252,847 which includes $0 cash and excludes $5,136 spent on fees and slippage. |
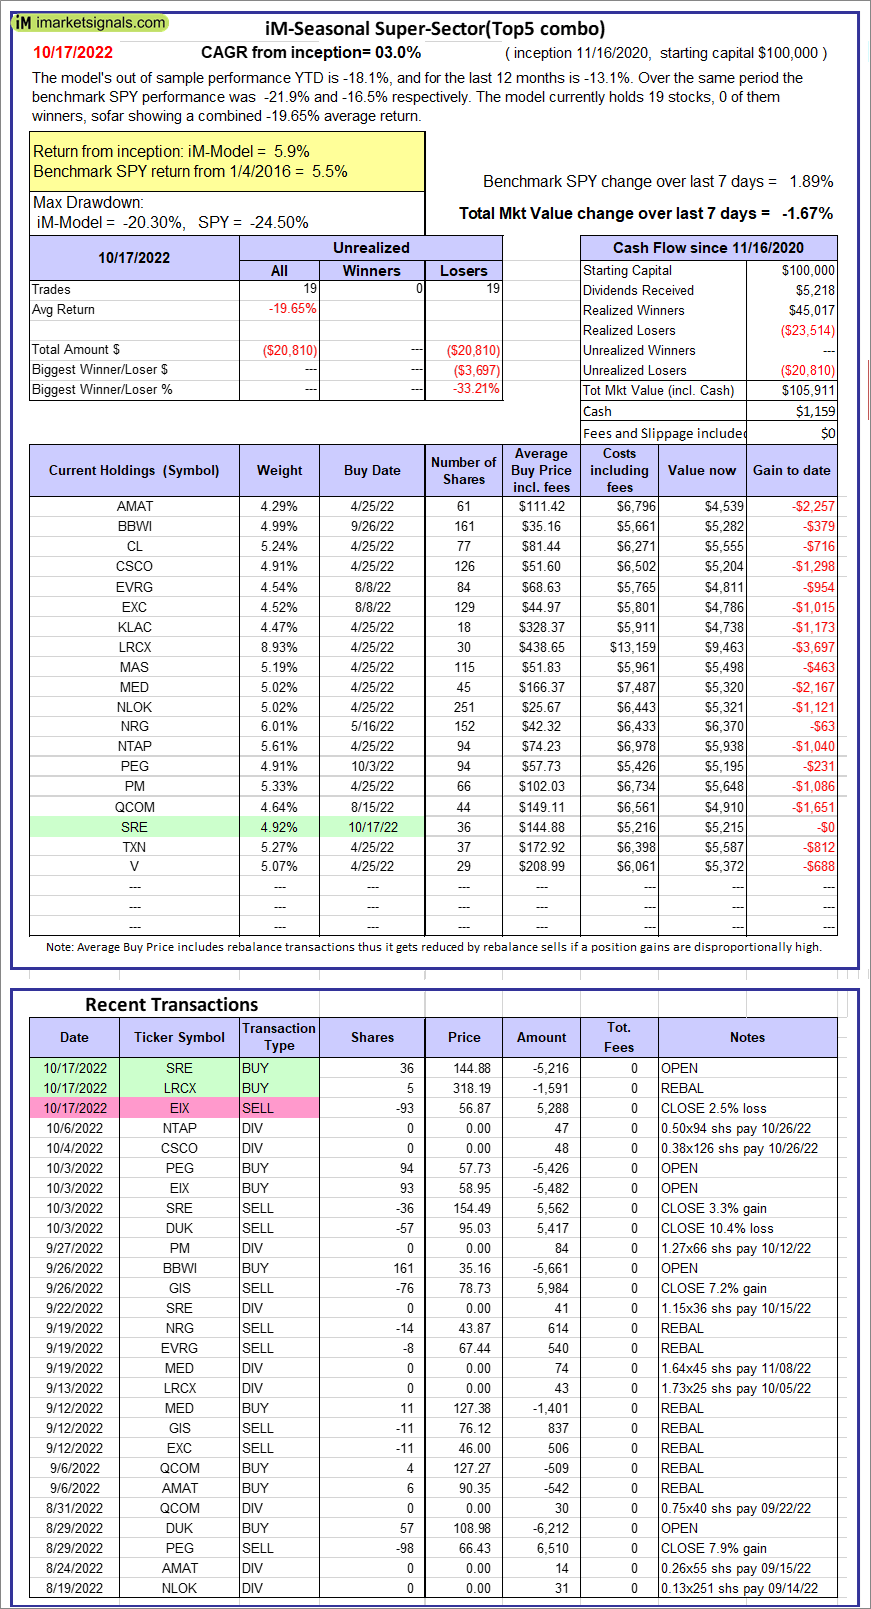 |
iM-Seasonal Super-Sectors (Top5 combo) : Since inception, on 11/17/2020, the model gained 5.91% while the benchmark SPY gained 5.45% over the same period. Over the previous week the market value of iM-Seasonal Super-Sectors (Top5 combo) gained -1.67% at a time when SPY gained 1.89%. A starting capital of $100,000 at inception on 11/17/2020 would have grown to $105,911 which includes $1,159 cash and excludes $00 spent on fees and slippage. |
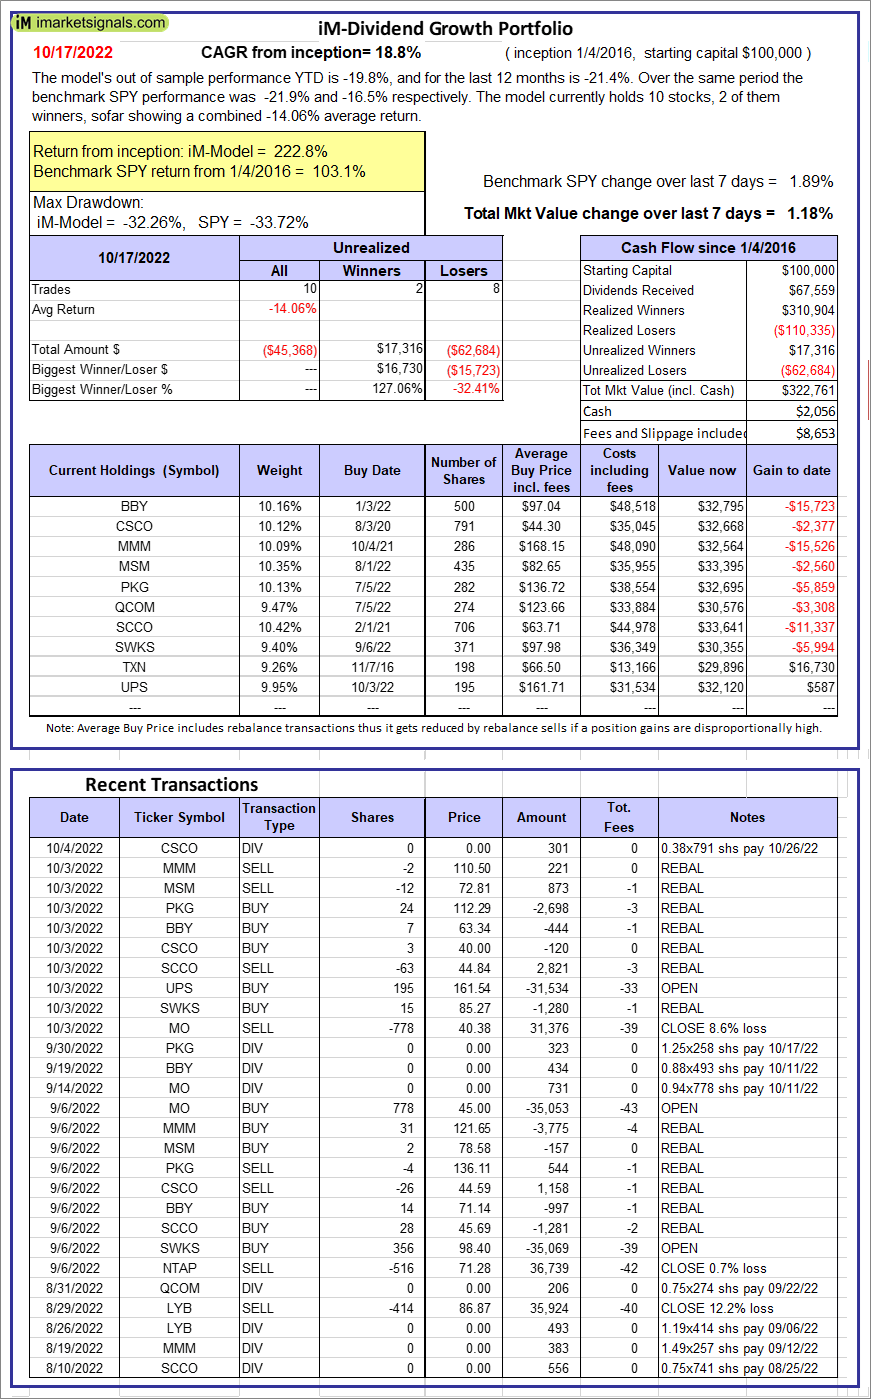 |
iM-Dividend Growth Portfolio: The model’s out of sample performance YTD is -19.8%, and for the last 12 months is -21.4%. Over the same period the benchmark SPY performance was -21.9% and -16.5% respectively. Over the previous week the market value of the iM-Dividend Growth Portfolio gained 1.18% at a time when SPY gained 1.89%. A starting capital of $100,000 at inception on 6/30/2016 would have grown to $322,761 which includes $2,056 cash and excludes $8,653 spent on fees and slippage. |
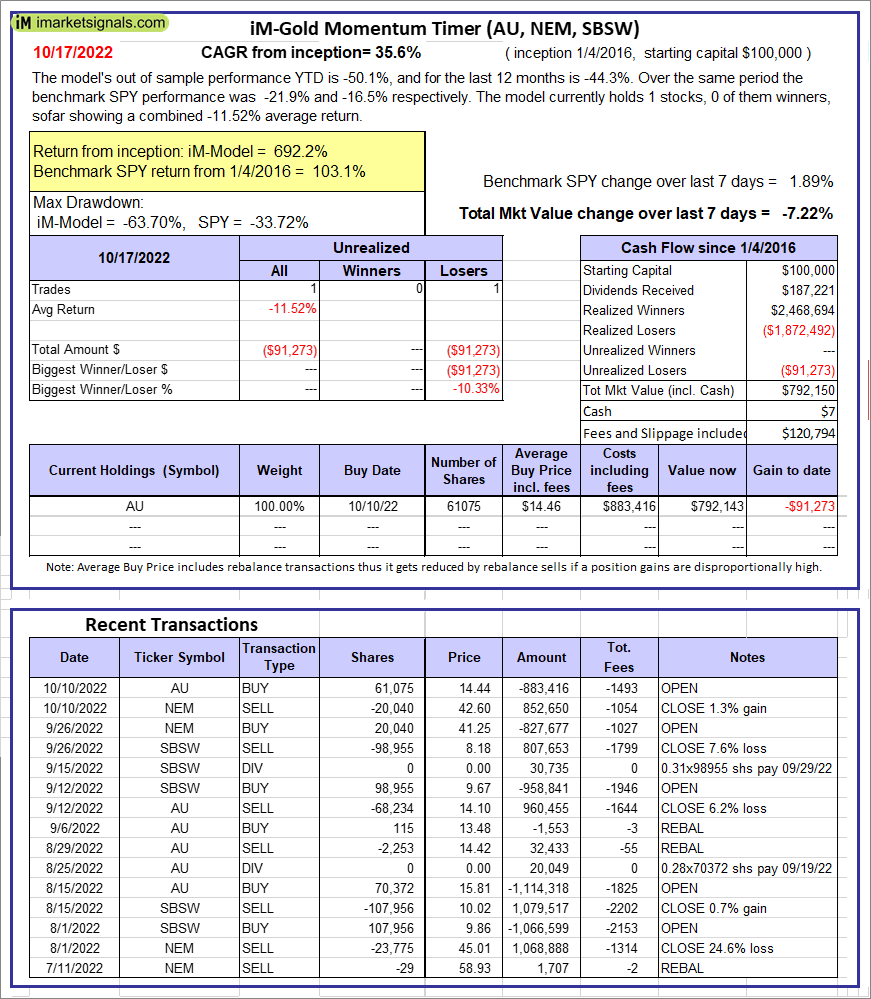 |
iM-Gold Momentum Timer (AU, NEM, SBSW): The model’s out of sample performance YTD is -50.1%, and for the last 12 months is -44.3%. Over the same period the benchmark SPY performance was -21.9% and -16.5% respectively. Over the previous week the market value of iM-Gold Momentum Timer (AU, NEM, SBSW) gained -7.22% at a time when SPY gained 1.89%. A starting capital of $100,000 at inception on 6/30/2016 would have grown to $07 which includes $120,794 cash and excludes Gain to date spent on fees and slippage. |
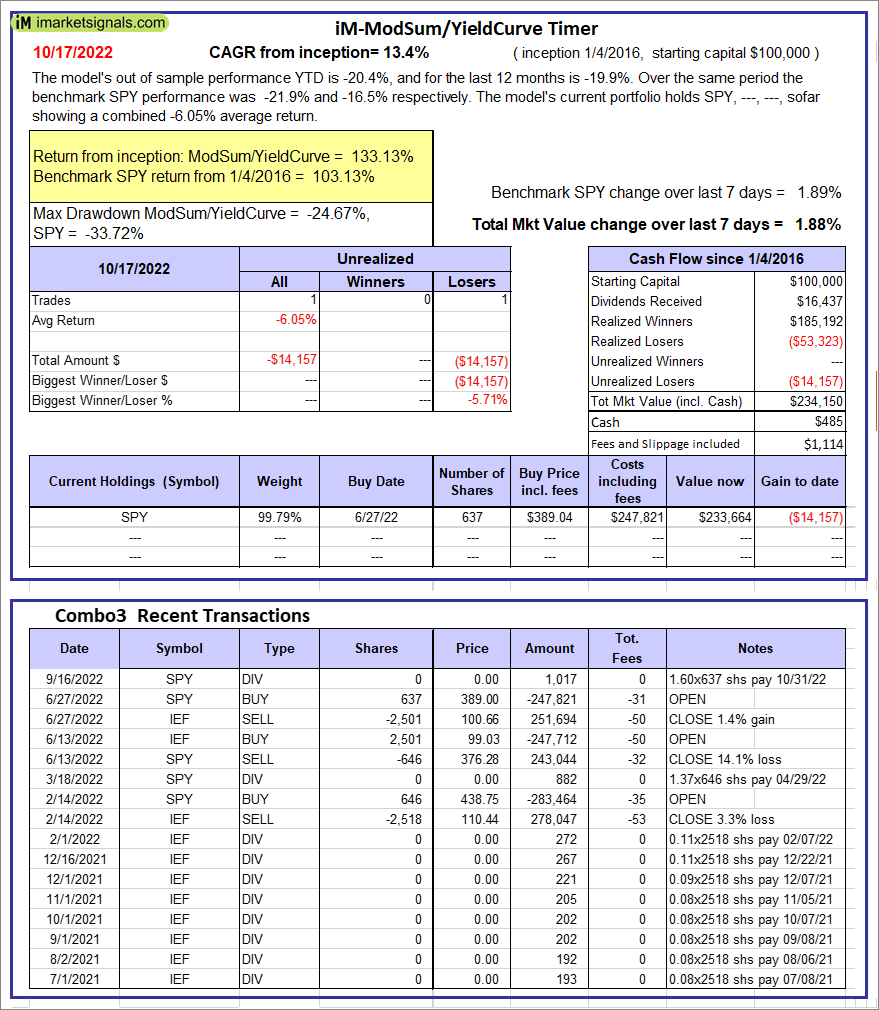 |
iM-ModSum/YieldCurve Timer: The model’s out of sample performance YTD is -20.4%, and for the last 12 months is -19.9%. Over the same period the benchmark SPY performance was -21.9% and -16.5% respectively. Over the previous week the market value of iM-PortSum/YieldCurve Timer gained 1.88% at a time when SPY gained 1.89%. A starting capital of $100,000 at inception on 1/1/2016 would have grown to $234,150 which includes $485 cash and excludes $1,114 spent on fees and slippage. |
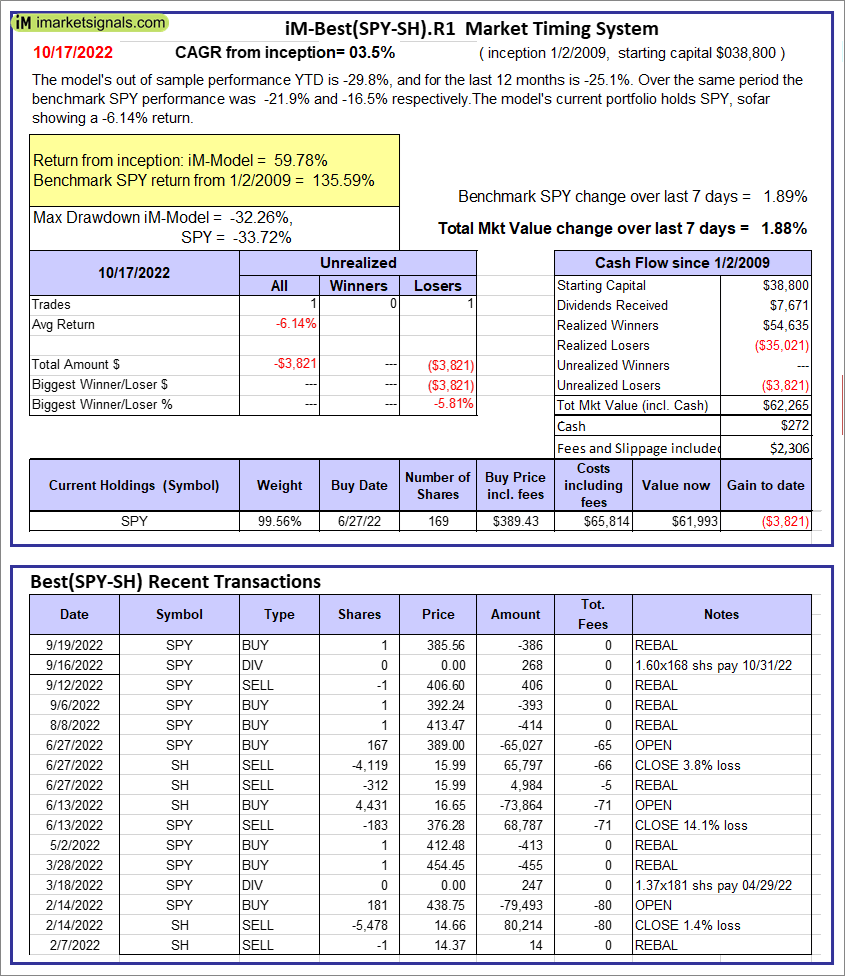 |
iM-Best(SPY-SH).R1: The model’s out of sample performance YTD is -29.8%, and for the last 12 months is -25.1%. Over the same period the benchmark SPY performance was -21.9% and -16.5% respectively. Over the previous week the market value of Best(SPY-SH) gained 1.88% at a time when SPY gained 1.89%. A starting capital of $100,000 at inception on 1/2/2009 would have grown to $62,265 which includes $272 cash and excludes $2,306 spent on fees and slippage. |
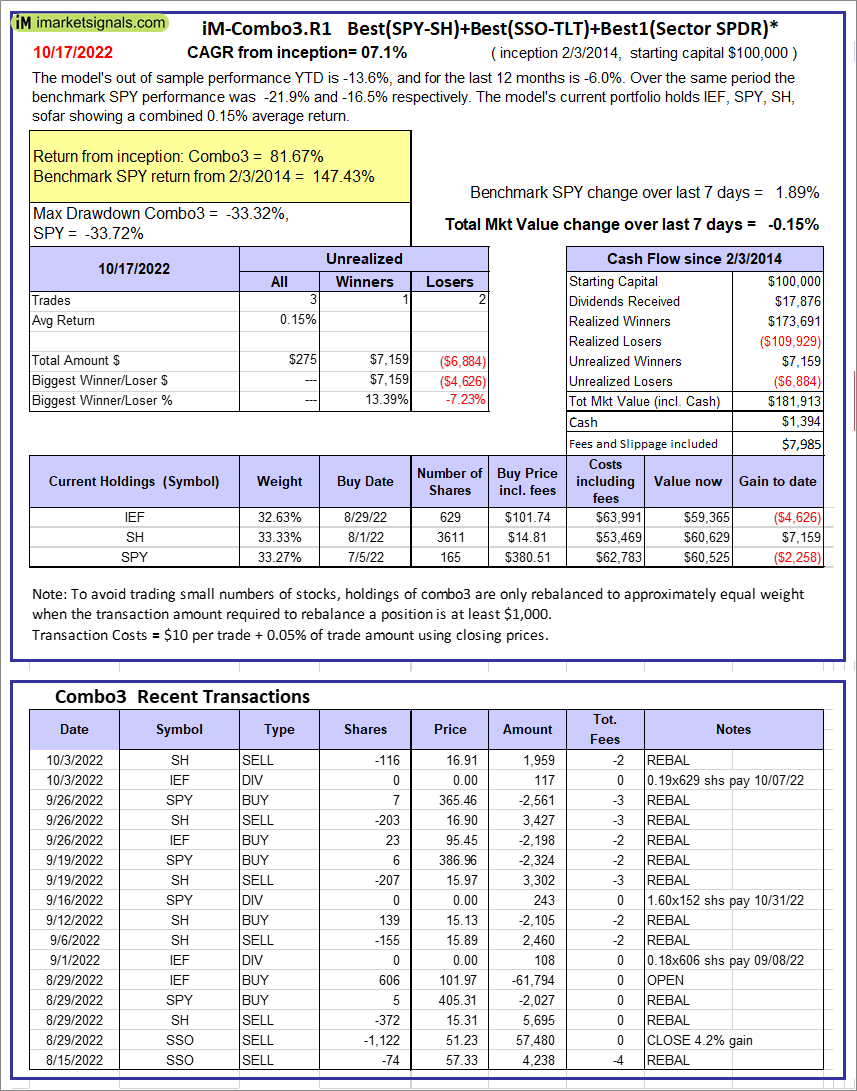 |
iM-Combo3.R1: The model’s out of sample performance YTD is -13.6%, and for the last 12 months is -6.0%. Over the same period the benchmark SPY performance was -21.9% and -16.5% respectively. Over the previous week the market value of iM-Combo3.R1 gained -0.15% at a time when SPY gained 1.89%. A starting capital of $100,000 at inception on 2/3/2014 would have grown to $181,913 which includes $1,394 cash and excludes $7,985 spent on fees and slippage. |
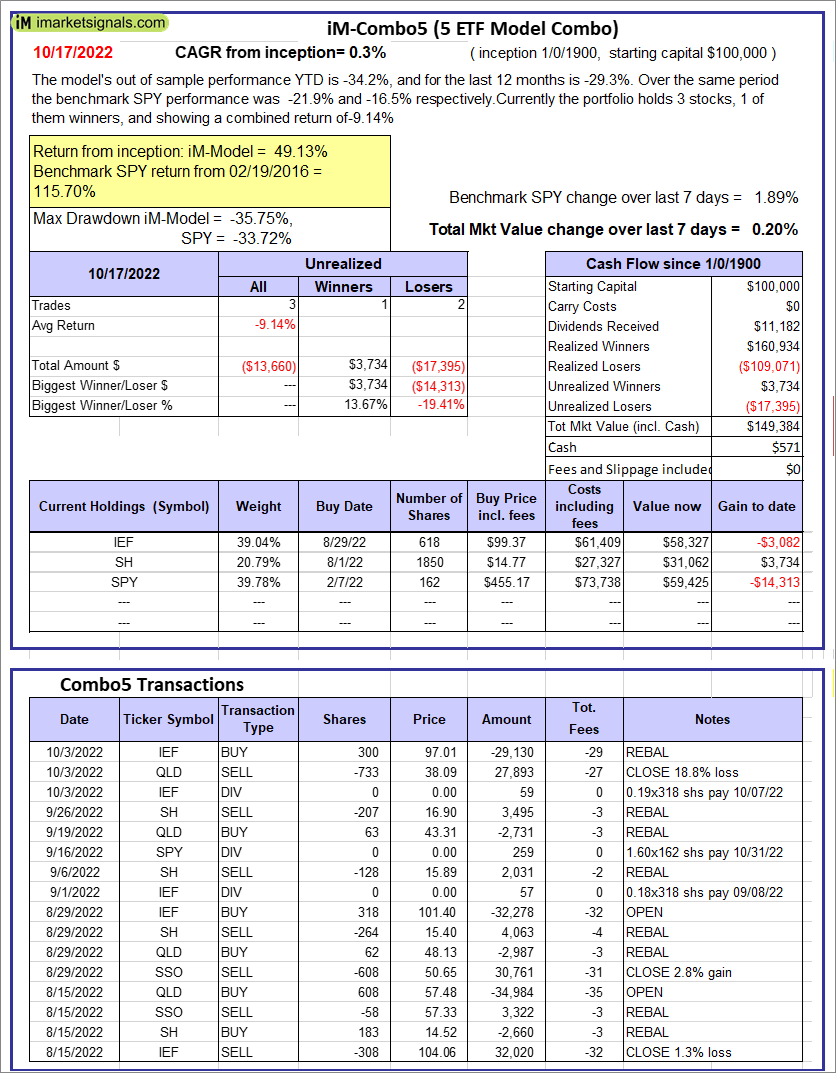 |
iM-Combo5: The model’s out of sample performance YTD is -34.2%, and for the last 12 months is -29.3%. Over the same period the benchmark SPY performance was -21.9% and -16.5% respectively. Over the previous week the market value of iM-Combo5 gained 0.20% at a time when SPY gained 1.89%. A starting capital of $100,000 at inception on 2/22/2016 would have grown to $149,384 which includes $571 cash and excludes $0 spent on fees and slippage. |
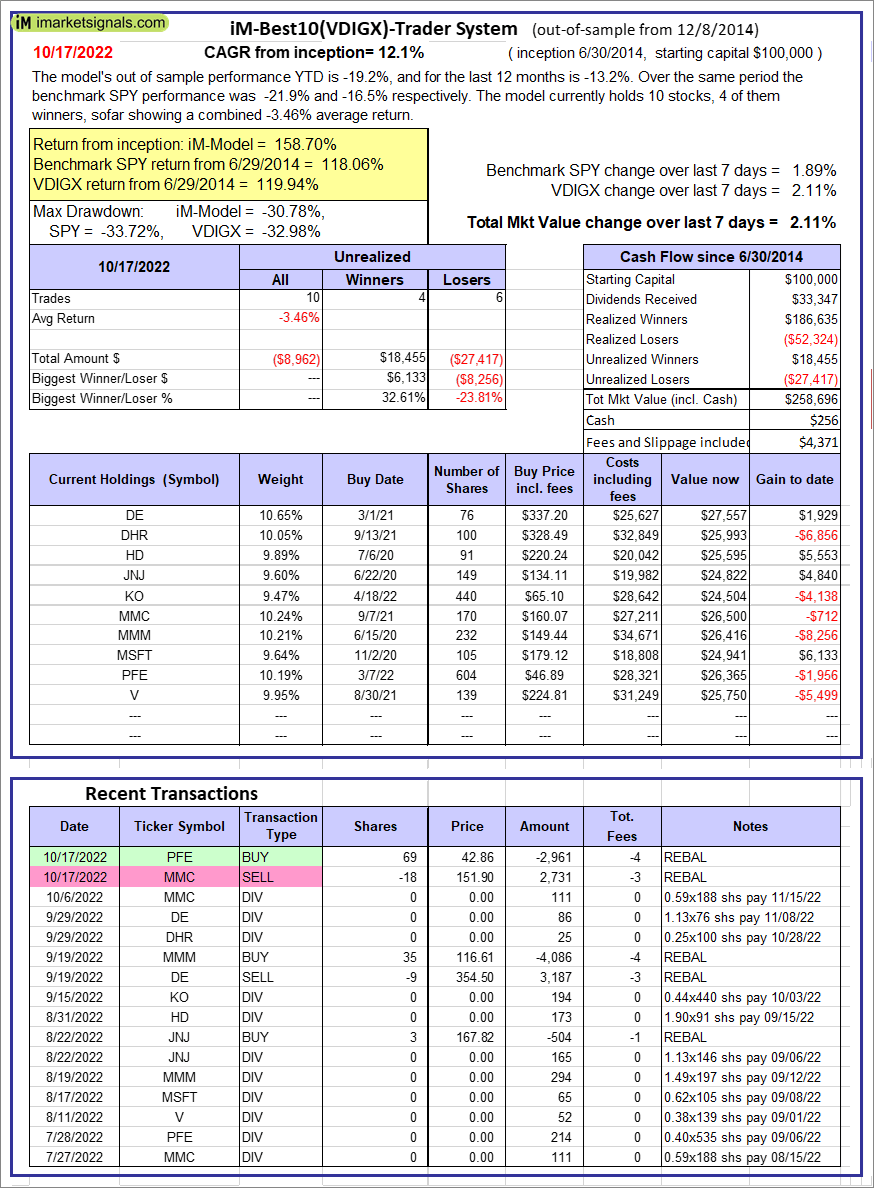 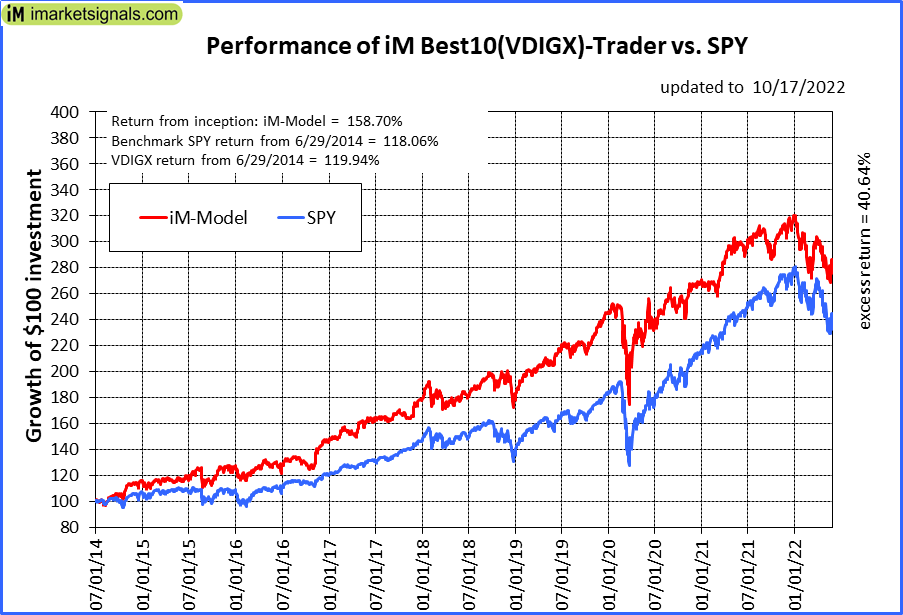 |
iM-Best10(VDIGX)-Trader: The model’s out of sample performance YTD is -19.2%, and for the last 12 months is -13.2%. Over the same period the benchmark SPY performance was -21.9% and -16.5% respectively. Since inception, on 7/1/2014, the model gained 158.70% while the benchmark SPY gained 118.06% and VDIGX gained 119.94% over the same period. Over the previous week the market value of iM-Best10(VDIGX) gained 2.11% at a time when SPY gained 1.89%. A starting capital of $100,000 at inception on 7/1/2014 would have grown to $258,696 which includes $256 cash and excludes $4,371 spent on fees and slippage. |
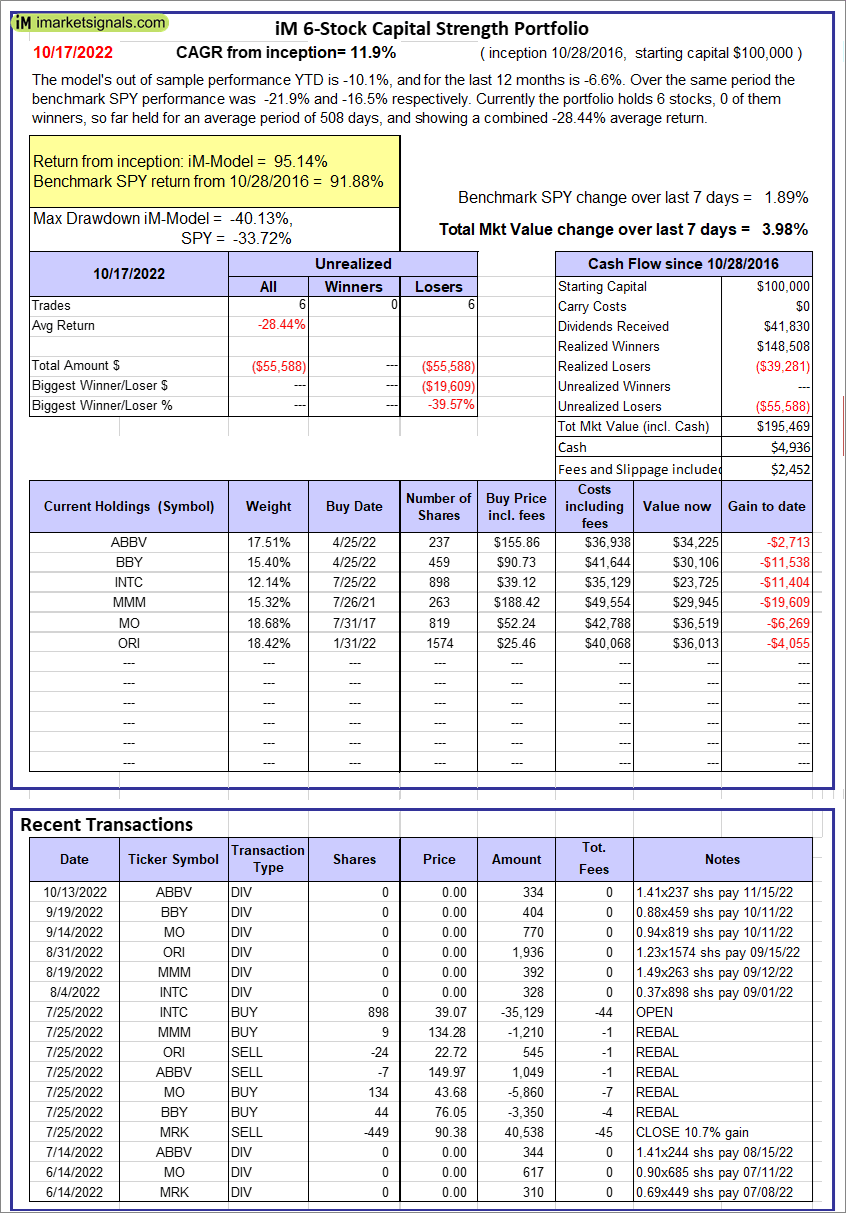 |
iM 6-Stock Capital Strength Portfolio: The model’s out of sample performance YTD is -10.1%, and for the last 12 months is -6.6%. Over the same period the benchmark SPY performance was -21.9% and -16.5% respectively. Over the previous week the market value of the iM 6-Stock Capital Strength Portfolio gained 3.98% at a time when SPY gained 1.89%. A starting capital of $100,000 at inception on 10/28/2016 would have grown to $195,469 which includes $4,936 cash and excludes $2,452 spent on fees and slippage. |
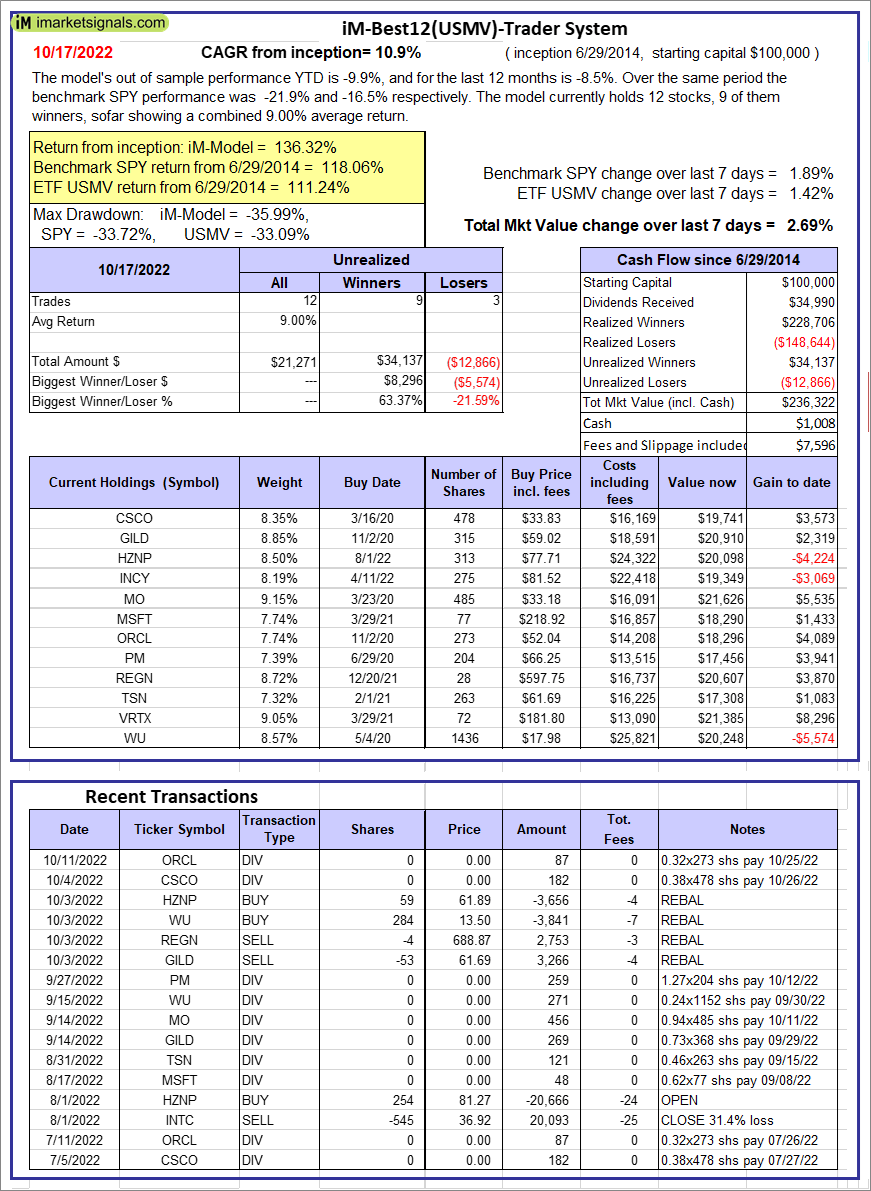 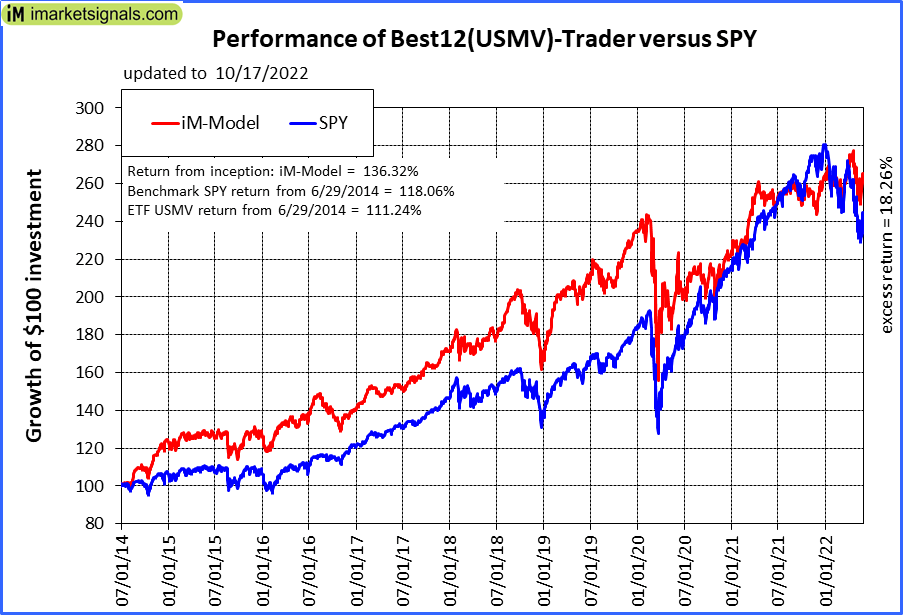 |
iM-Best12(USMV)-Trader: The model’s out of sample performance YTD is -9.9%, and for the last 12 months is -8.5%. Over the same period the benchmark SPY performance was -21.9% and -16.5% respectively. Since inception, on 6/30/2014, the model gained 136.32% while the benchmark SPY gained 118.06% and the ETF USMV gained 111.24% over the same period. Over the previous week the market value of iM-Best12(USMV)-Trader gained 2.69% at a time when SPY gained 1.89%. A starting capital of $100,000 at inception on 6/30/2014 would have grown to $236,322 which includes $1,008 cash and excludes $7,596 spent on fees and slippage. |
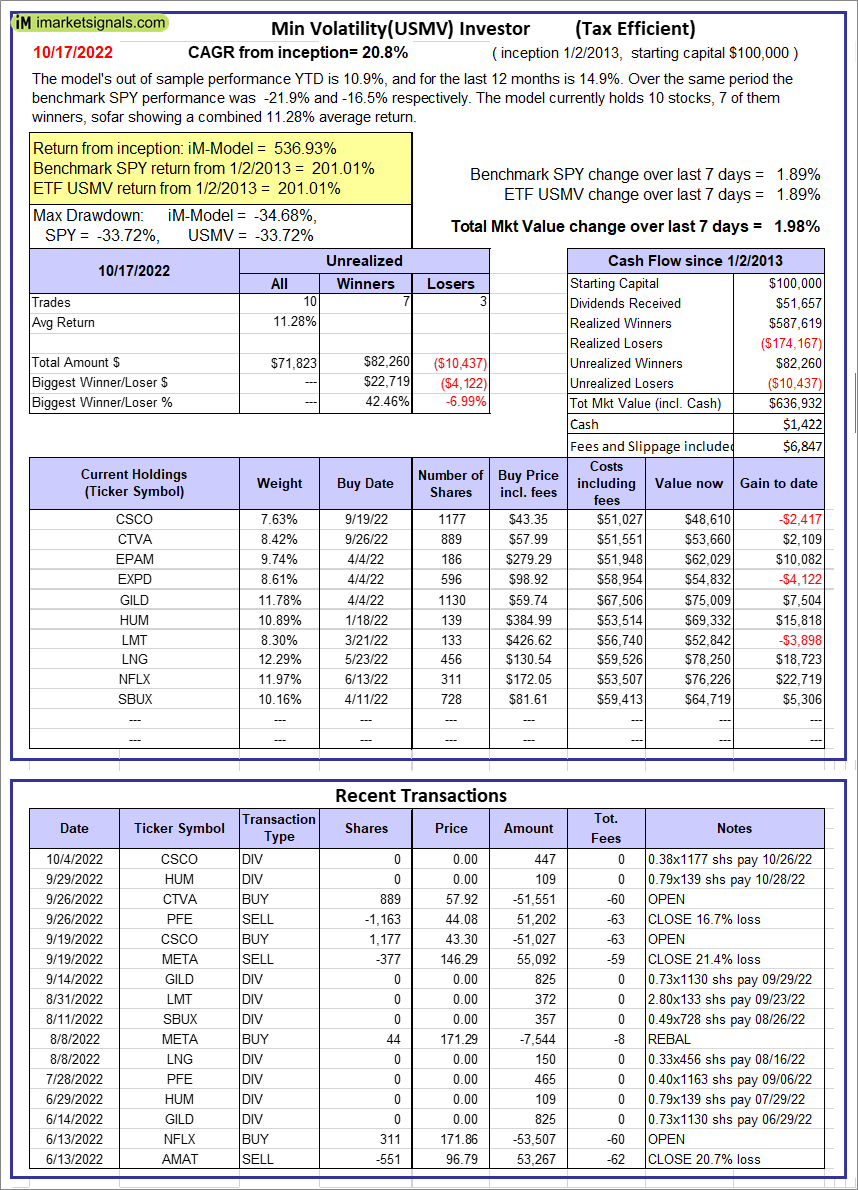 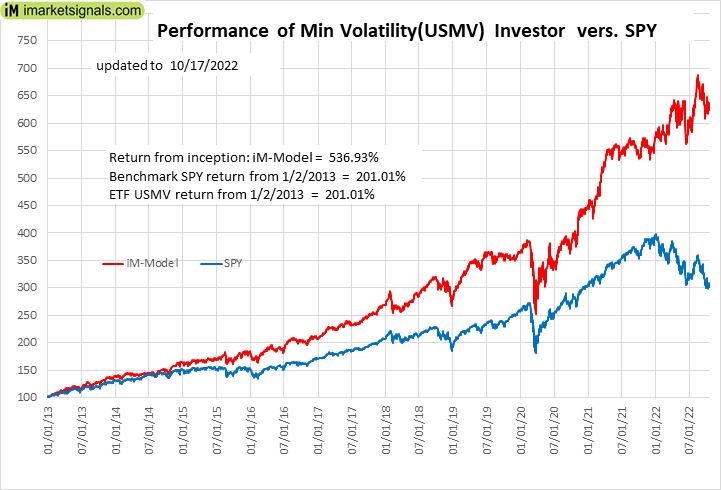 |
iM-Min Volatility(USMV) Investor (Tax Efficient): The model’s out of sample performance YTD is 10.9%, and for the last 12 months is 14.9%. Over the same period the benchmark SPY performance was -21.9% and -16.5% respectively. Since inception, on 1/3/2013, the model gained 536.93% while the benchmark SPY gained 201.01% and the ETF USMV gained 201.01% over the same period. Over the previous week the market value of iM-Best12(USMV)Q1 gained 1.98% at a time when SPY gained 1.89%. A starting capital of $100,000 at inception on 1/3/2013 would have grown to $636,932 which includes $1,422 cash and excludes $6,847 spent on fees and slippage. |
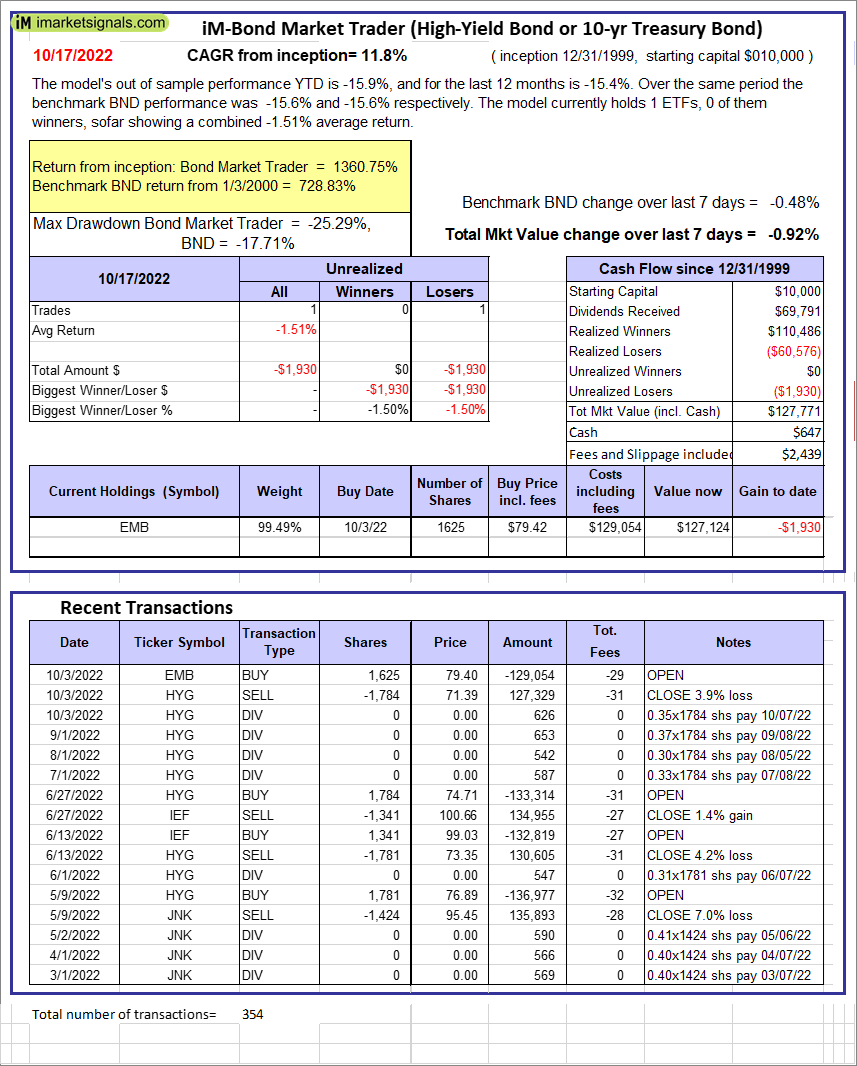 |
iM-Bond Market Trader (High-Yield Bond or 10-yr Treasury Bond): The model’s out of sample performance YTD is -15.9%, and for the last 12 months is -15.4%. Over the same period the benchmark BND performance was -15.6% and -15.6% respectively. Over the previous week the market value of the iM-Bond Market Trader (High-Yield Bond or 10-yr Treasury Bond) gained -0.92% at a time when BND gained -0.48%. A starting capital of $10,000 at inception on 1/3/2000 would have grown to $127,771 which includes $647 cash and excludes $2,439 spent on fees and slippage. |
|
|
iM-ModSum/YieldCurve Timer: The model’s out of sample performance YTD is -20.4%, and for the last 12 months is -19.9%. Over the same period the benchmark SPY performance was -21.9% and -16.5% respectively. Over the previous week the market value of iM-PortSum/YieldCurve Timer gained 1.88% at a time when SPY gained 1.89%. A starting capital of $100,000 at inception on 1/1/2016 would have grown to $234,150 which includes $485 cash and excludes $1,114 spent on fees and slippage. |
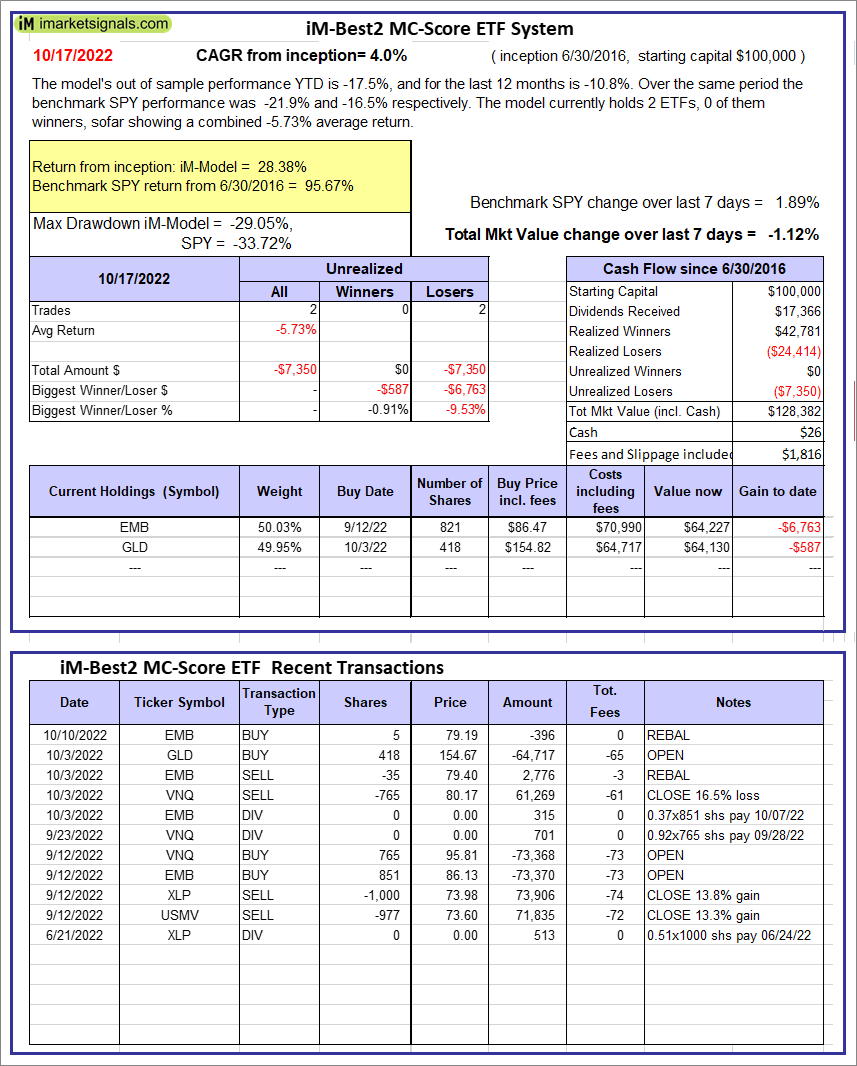 |
iM-Best2 MC-Score ETF System: The model’s out of sample performance YTD is -17.5%, and for the last 12 months is -10.8%. Over the same period the benchmark SPY performance was -21.9% and -16.5% respectively. Over the previous week the market value of the iM-Best2 MC-Score ETF System gained -1.12% at a time when SPY gained 1.89%. A starting capital of $100,000 at inception on 6/30/2016 would have grown to $128,382 which includes $26 cash and excludes $1,816 spent on fees and slippage. |
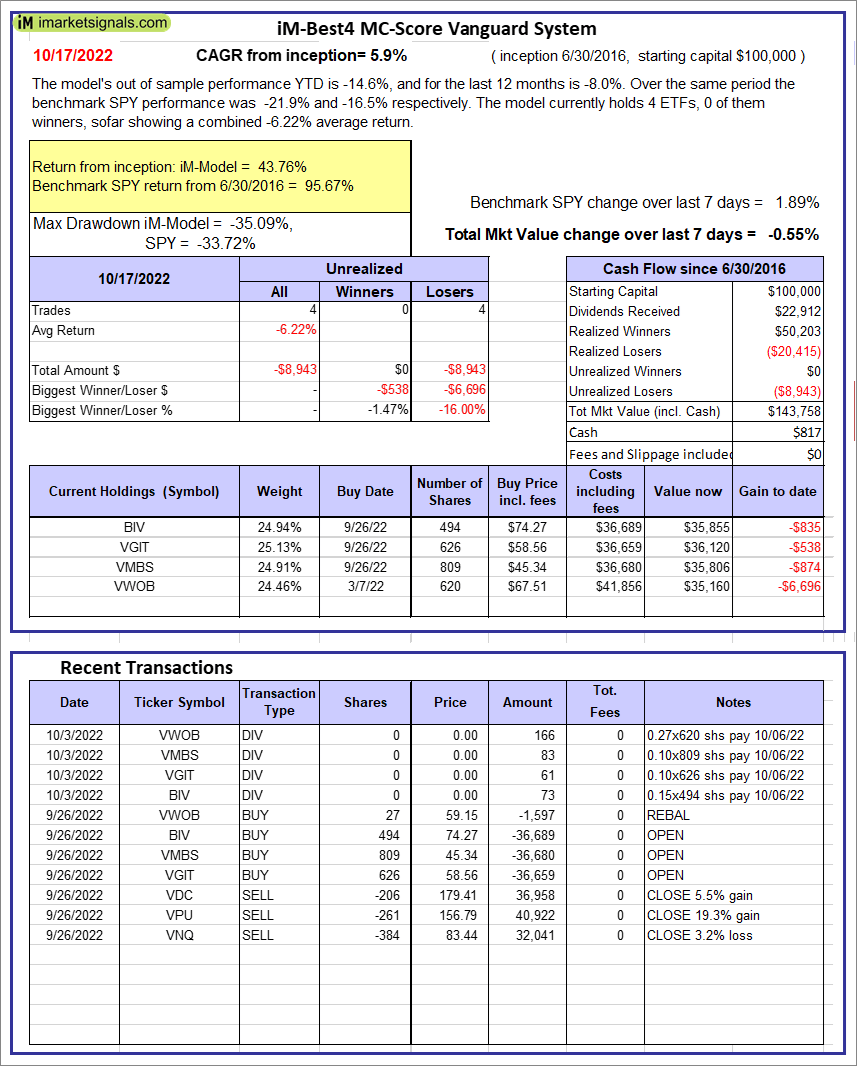 |
iM-Best4 MC-Score Vanguard System: The model’s out of sample performance YTD is -14.6%, and for the last 12 months is -8.0%. Over the same period the benchmark SPY performance was -21.9% and -16.5% respectively. Over the previous week the market value of the iM-Best4 MC-Score Vanguard System gained -0.55% at a time when SPY gained 1.89%. A starting capital of $100,000 at inception on 6/30/2016 would have grown to $143,758 which includes $817 cash and excludes $00 spent on fees and slippage. |
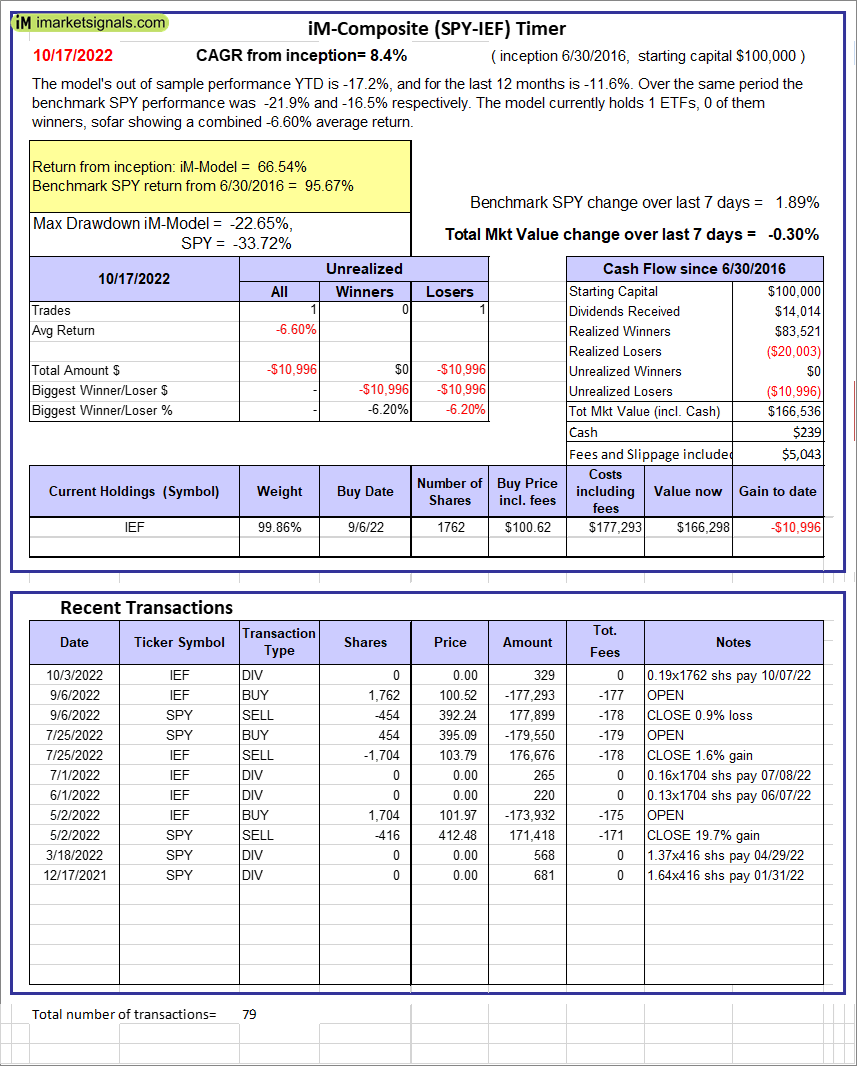 |
iM-Composite (SPY-IEF) Timer: The model’s out of sample performance YTD is -17.2%, and for the last 12 months is -11.6%. Over the same period the benchmark SPY performance was -21.9% and -16.5% respectively. Over the previous week the market value of the iM-Composite (SPY-IEF) Timer gained -0.30% at a time when SPY gained 1.89%. A starting capital of $100,000 at inception on 6/30/2016 would have grown to $166,536 which includes $239 cash and excludes $5,043 spent on fees and slippage. |
 |
iM-Composite(Gold-Stocks-Bond) Timer: The model’s out of sample performance YTD is -12.7%, and for the last 12 months is -5.5%. Over the same period the benchmark SPY performance was -21.9% and -16.5% respectively. Over the previous week the market value of the iM-Composite(Gold-Stocks-Bond) Timer gained -1.12% at a time when SPY gained 1.89%. A starting capital of $100,000 at inception on 6/30/2016 would have grown to $155,986 which includes $36 cash and excludes $9,190 spent on fees and slippage. |
iM-Best Reports – 10/17/2022
Posted in pmp SPY-SH
Leave a Reply
You must be logged in to post a comment.