
iM-Weekly Unemployment Monitor
The initial claims and continued claims decreased against the previous week but remain at record levels. Also, the Covered Employment (a quarterly updated figure) decreased by 4,401,167, or 3%. This is a record; during the 2008 Great Recession, the greatest quarterly drop was 1.4%.
The non-seasonal adjusted initial claims totaled 960,668 in the week ending January 16, a decrease of 151,303 from the previous week (compared to 956,791 initial claims on 1/10/2009 the peak during the 2008 Great Recession), the sixth running week of over 800,000. This makes up 0.68% of the Covered Employment. The 50-year long-term average (January 1971 to today) is 0.38% and the average of the last business cycle (July 2009 to March 2020) is 0.24%
The non-seasonal adjusted continuous insured unemployment in state programs totaled 5,563,048, a decrease of 203,750 from the preceding week.
The total number of people claiming benefits in all programs week ending January 2 was 15,994,519, a decrease of 2,412,508 from the previous week.
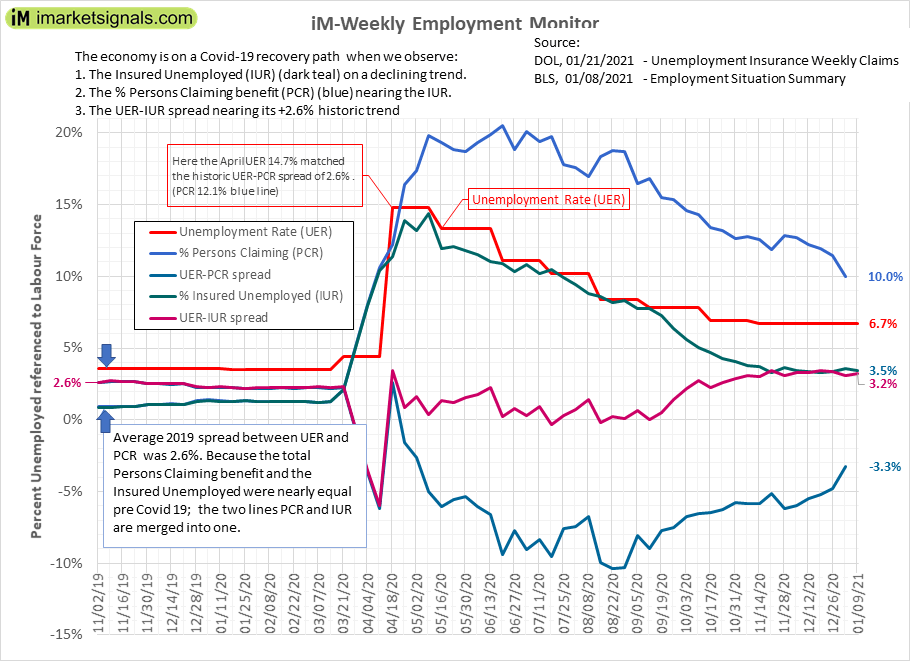
Please refer The iM-Weekly Unemployment Monitor
Leave a Reply
You must be logged in to post a comment.