
  |
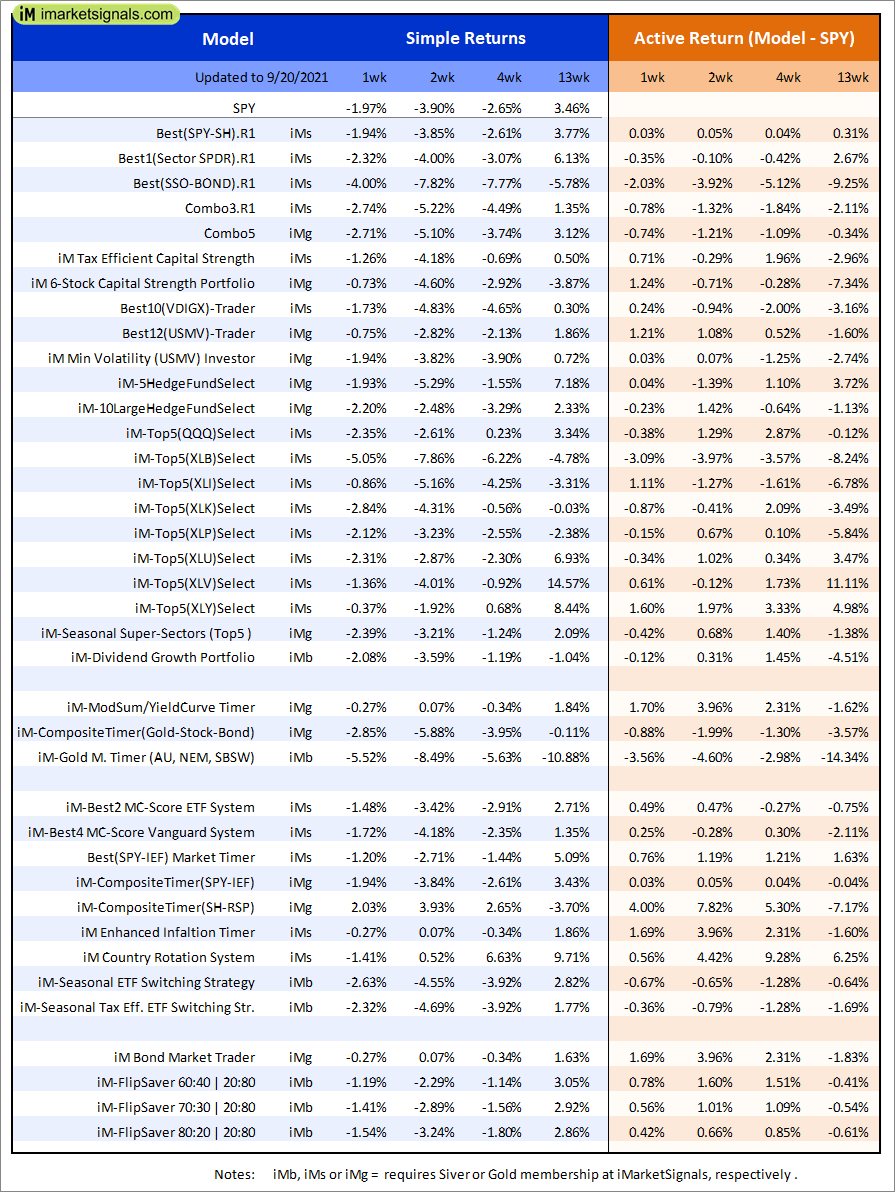
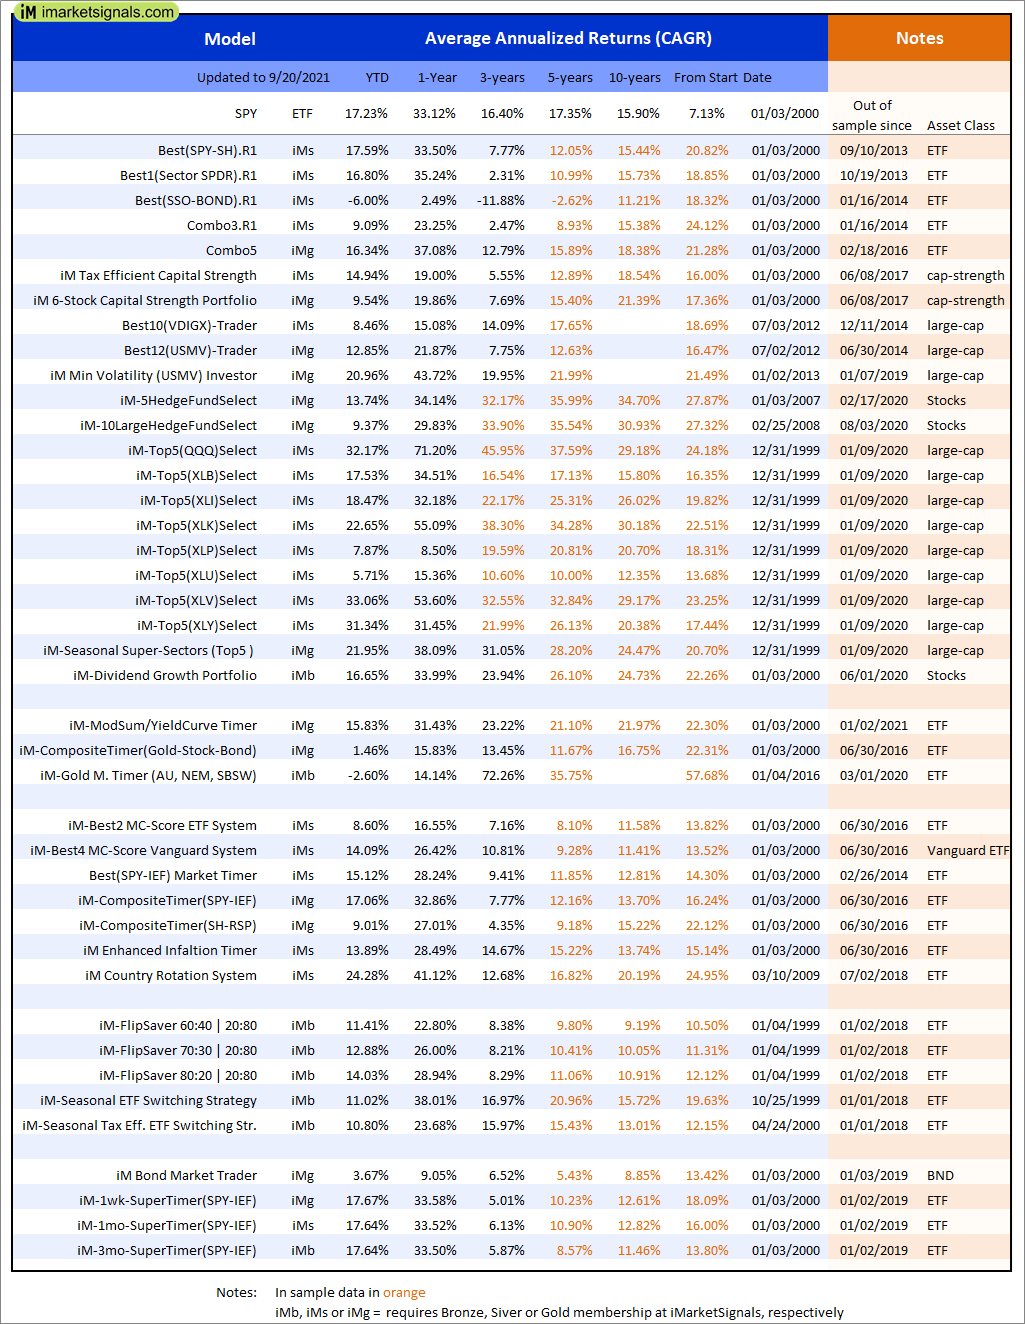
Out of sample performance summary of our models for the past 1, 2, 4 and 13 week periods. The active active return indicates how the models over- or underperformed the benchmark ETF SPY. Also the YTD, and the 1-, 3-, 5- and 10-year annualized returns are shown in the second table |
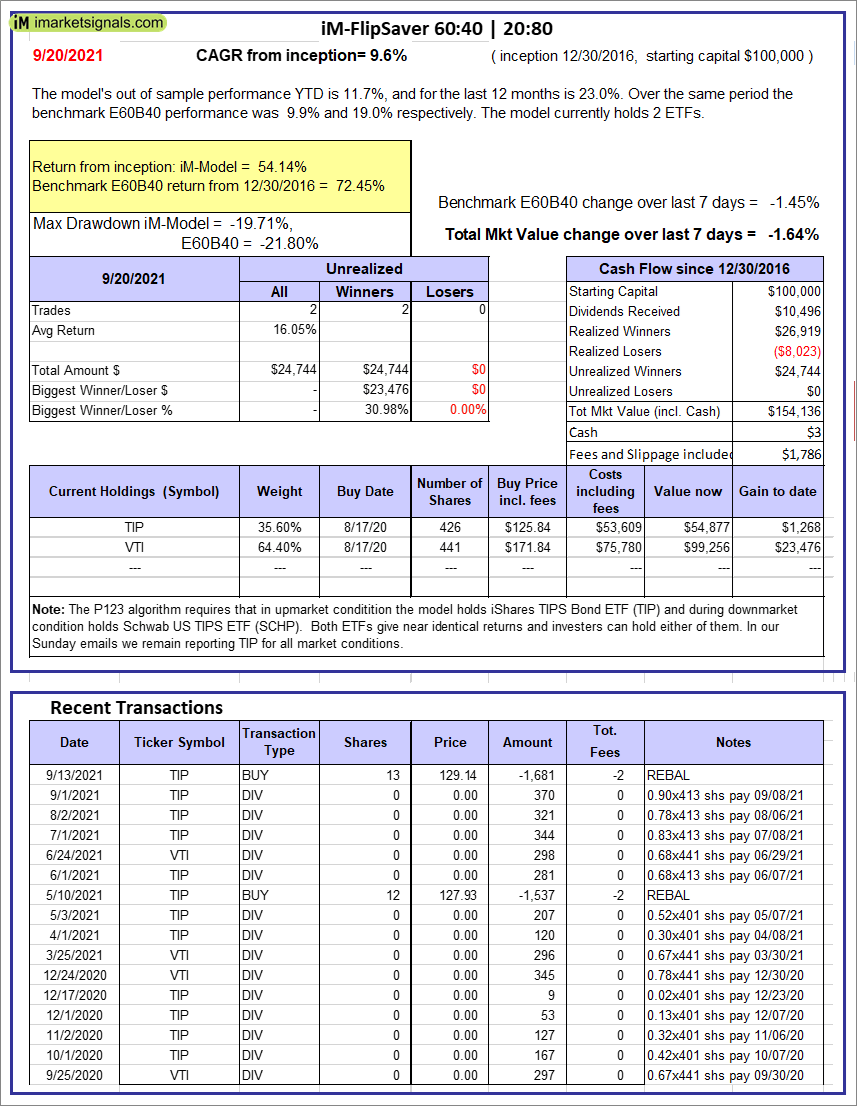 |
iM-FlipSaver 60:40 | 20:80 – 2017: The model’s out of sample performance YTD is 11.7%, and for the last 12 months is 23.0%. Over the same period the benchmark E60B40 performance was 9.9% and 19.0% respectively. Over the previous week the market value of iM-FlipSaver 80:20 | 20:80 gained -1.64% at a time when SPY gained -1.45%. A starting capital of $100,000 at inception on 7/16/2015 would have grown to $154,136 which includes $3 cash and excludes $1,786 spent on fees and slippage. |
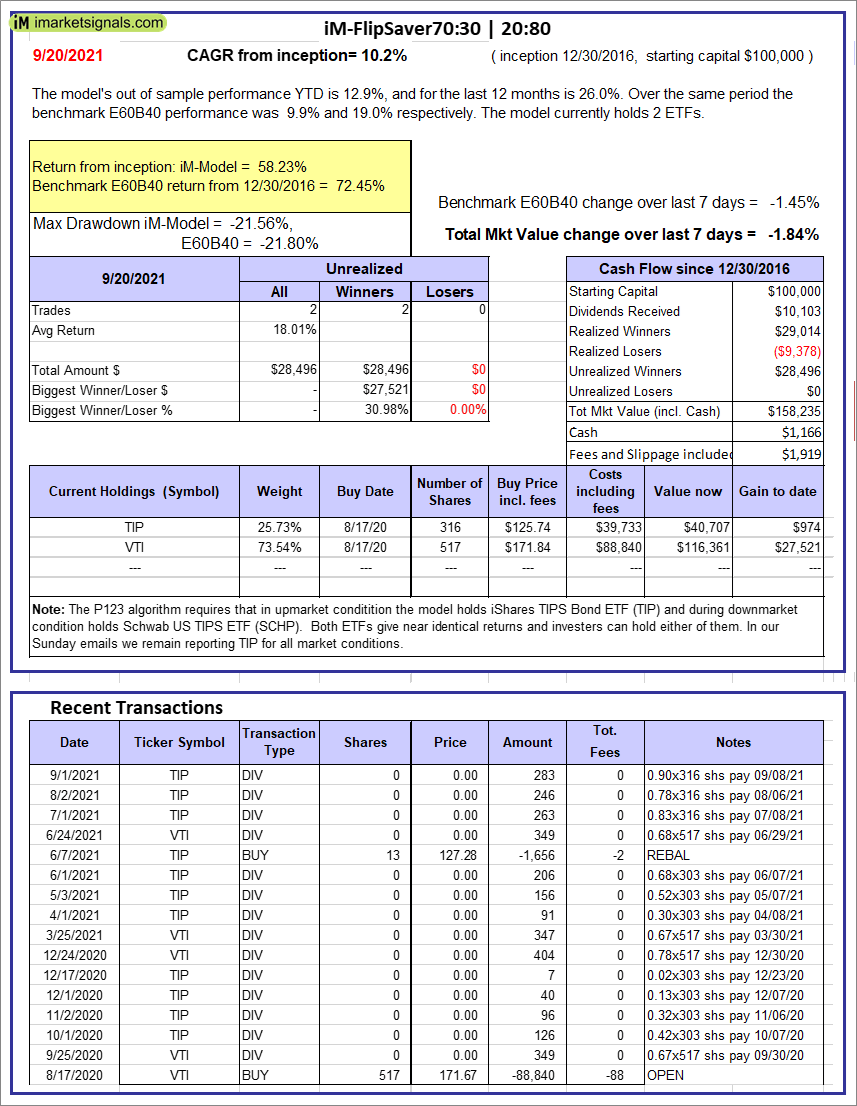 |
iM-FlipSaver 70:30 | 20:80 – 2017: The model’s out of sample performance YTD is 12.9%, and for the last 12 months is 26.0%. Over the same period the benchmark E60B40 performance was 9.9% and 19.0% respectively. Over the previous week the market value of iM-FlipSaver 70:30 | 20:80 gained -1.84% at a time when SPY gained -1.45%. A starting capital of $100,000 at inception on 7/15/2015 would have grown to $158,235 which includes $1,166 cash and excludes $1,919 spent on fees and slippage. |
 |
iM-FlipSaver 80:20 | 20:80 – 2017: The model’s out of sample performance YTD is 14.0%, and for the last 12 months is 28.9%. Over the same period the benchmark E60B40 performance was 9.9% and 19.0% respectively. Over the previous week the market value of iM-FlipSaver 80:20 | 20:80 gained -2.02% at a time when SPY gained -1.45%. A starting capital of $100,000 at inception on 1/2/2017 would have grown to $162,215 which includes $1,052 cash and excludes $2,047 spent on fees and slippage. |
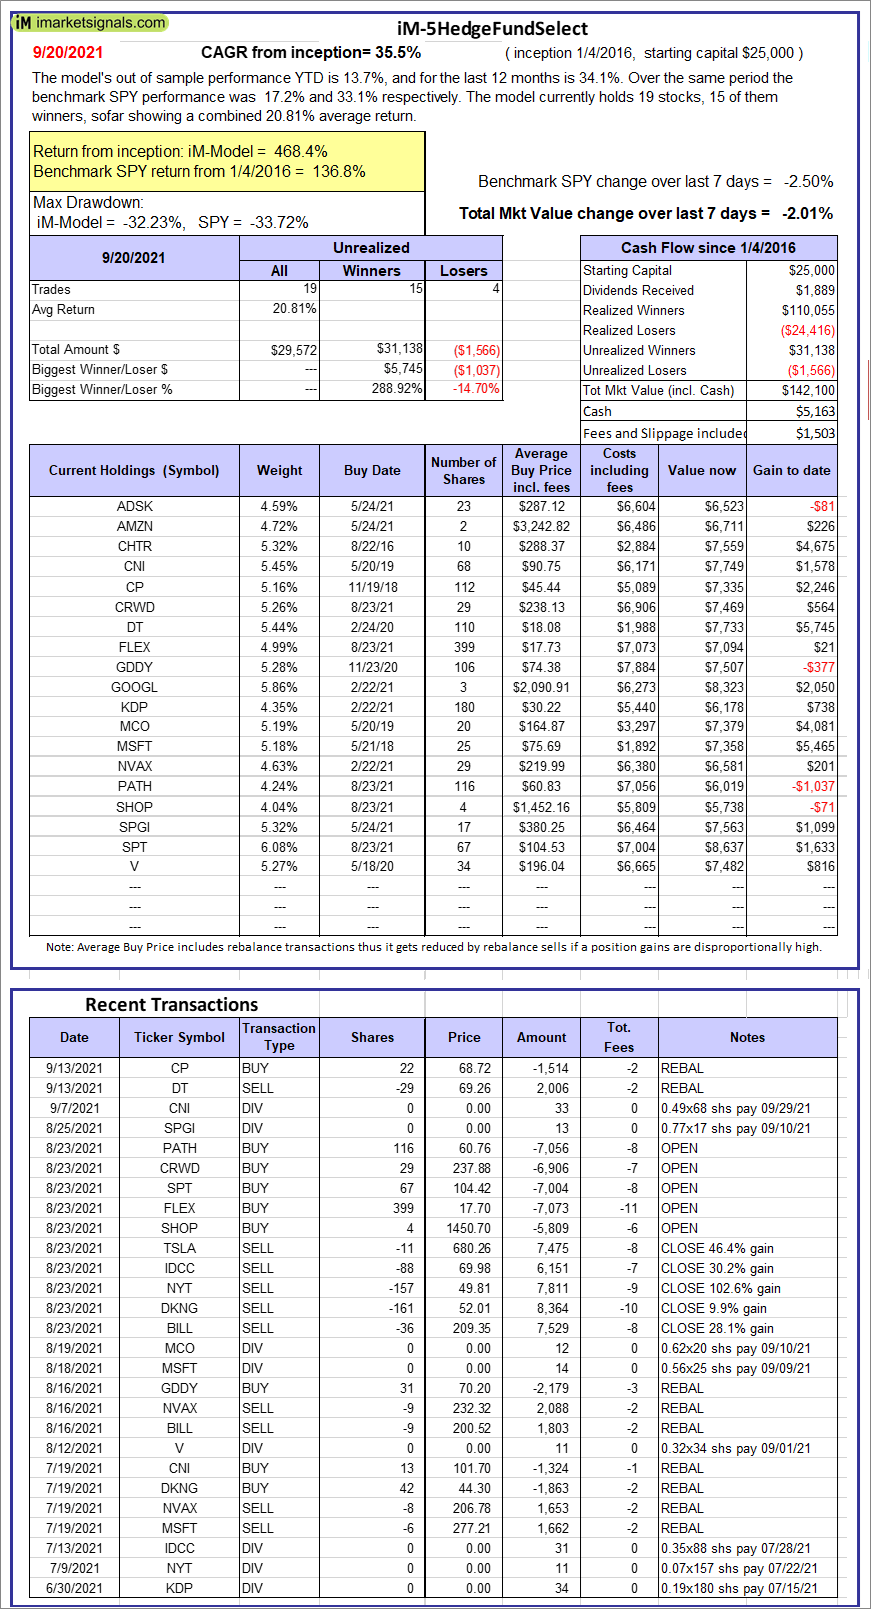 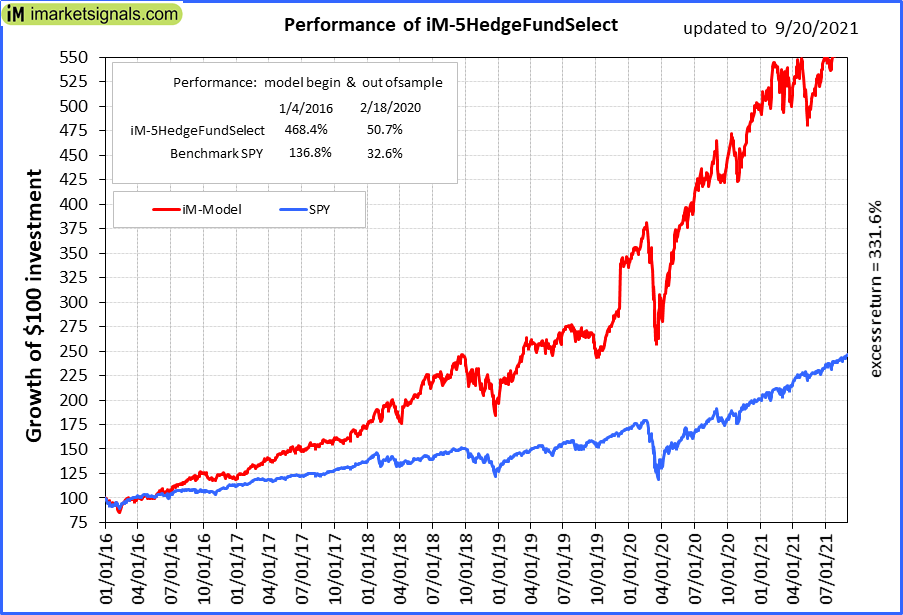 |
iM-5HedgeFundSelect: Since inception, on 1/5/2016, the model gained 468.40% while the benchmark SPY gained 136.78% over the same period. Over the previous week the market value of iM-5HedgeFundSelect gained -2.01% at a time when SPY gained -2.50%. A starting capital of $25,000 at inception on 1/5/2016 would have grown to $142,100 which includes $5,163 cash and excludes $1,503 spent on fees and slippage. |
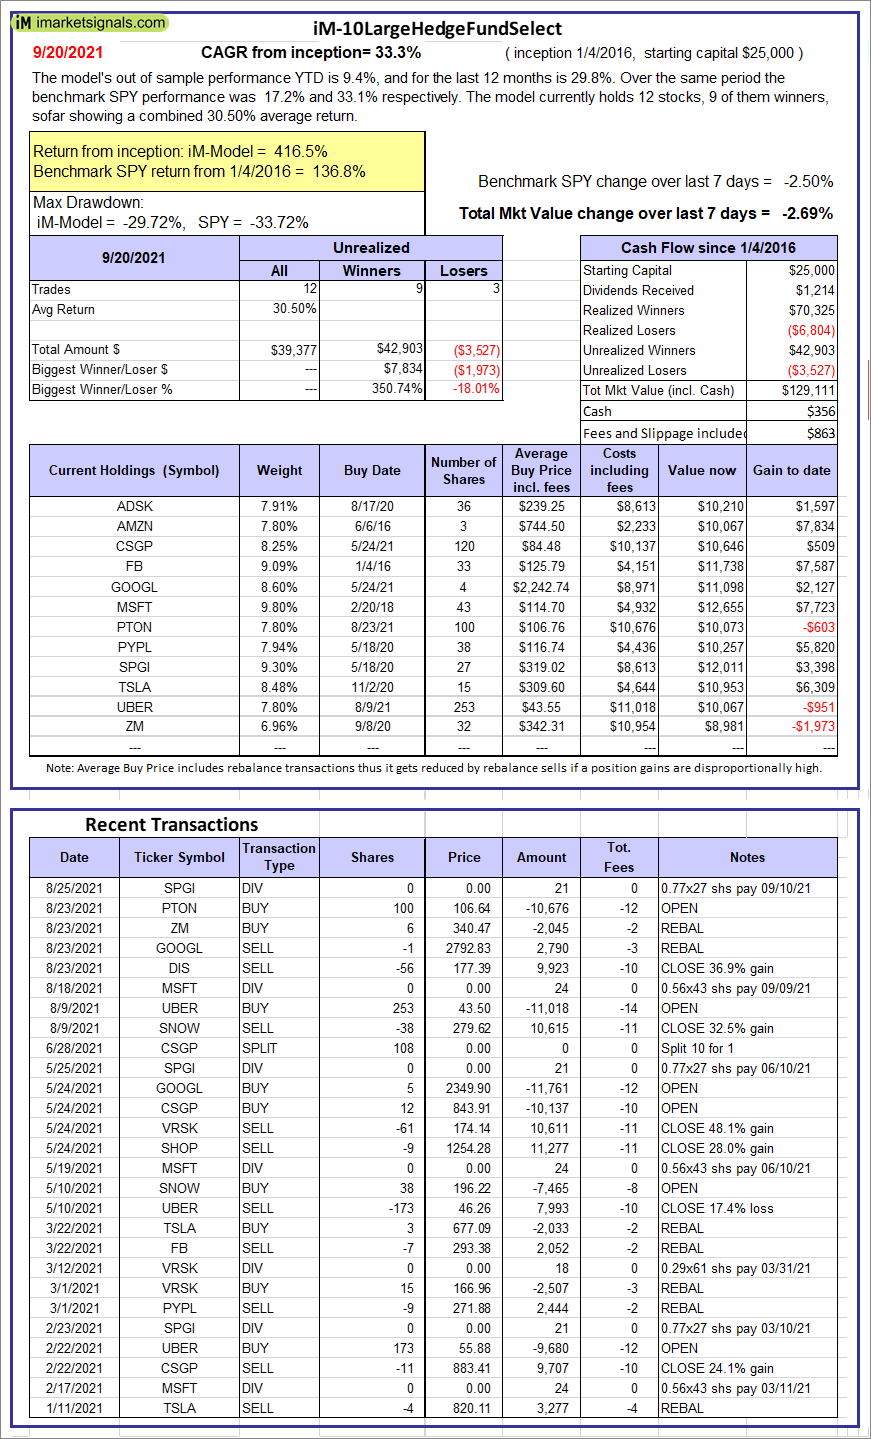 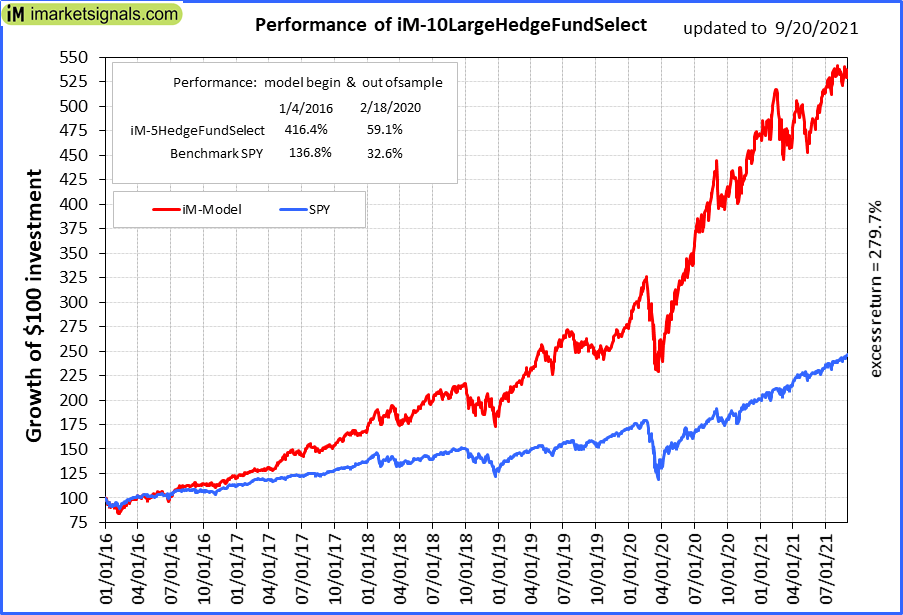 |
iM-10LargeHedgeFundSelect: Since inception, on 1/5/2016, the model gained 416.45% while the benchmark SPY gained 136.78% over the same period. Over the previous week the market value of iM-10LargeHedgeFundSelect gained -2.69% at a time when SPY gained -2.50%. A starting capital of $25,000 at inception on 1/5/2016 would have grown to $129,111 which includes $356 cash and excludes $863 spent on fees and slippage. |
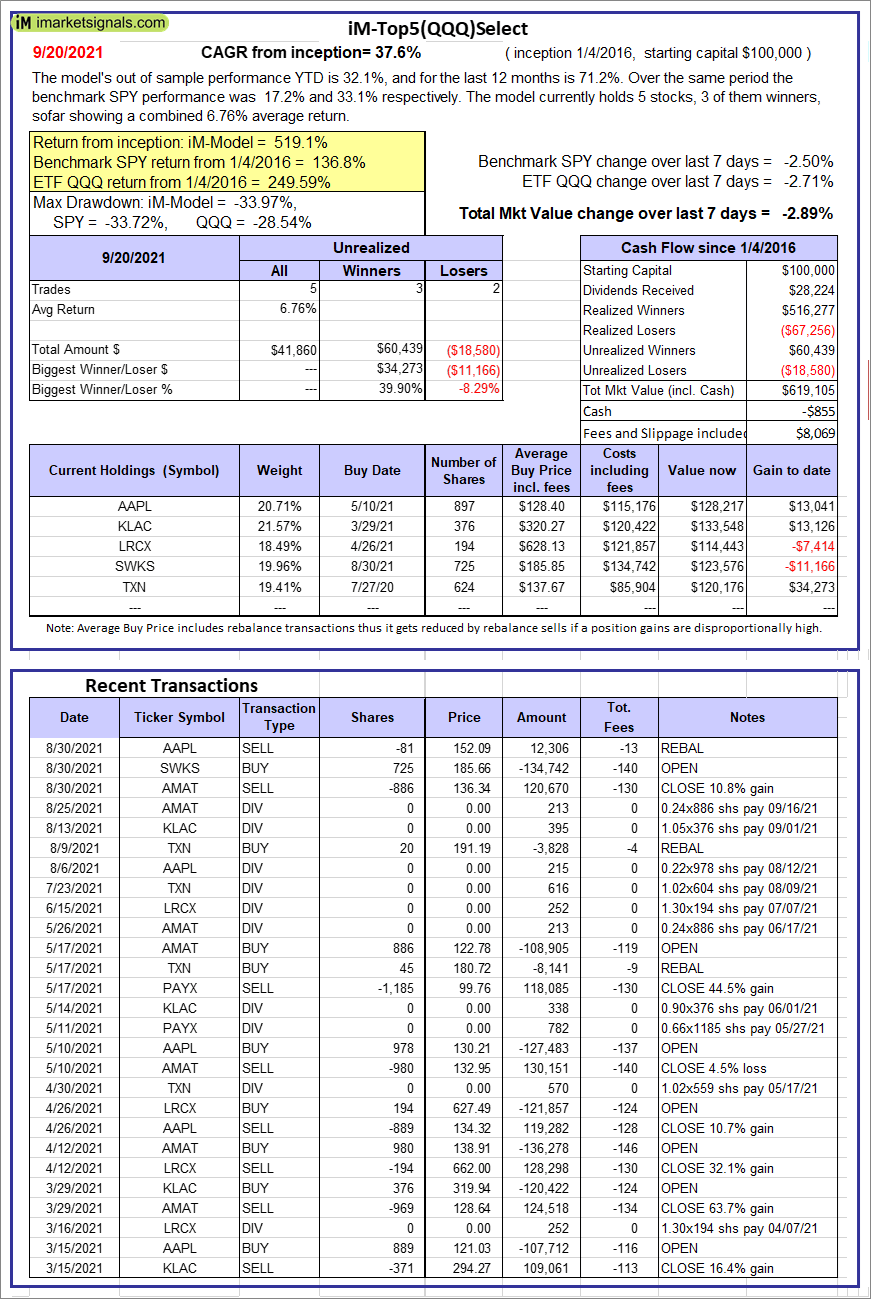 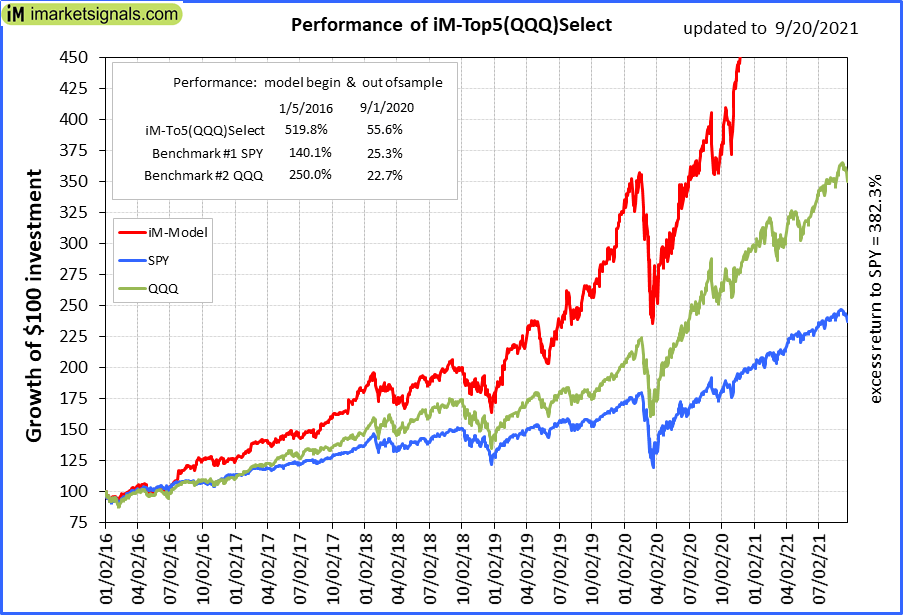 |
iM-Top5(QQQ)Select: Since inception, on 1/5/2016, the model gained 519.11% while the benchmark SPY gained 136.78% over the same period. Over the previous week the market value of iM-Top5(QQQ)Select gained -2.89% at a time when SPY gained -2.50%. A starting capital of $100,000 at inception on 1/5/2016 would have grown to $619,105 which includes -$855 cash and excludes $8,069 spent on fees and slippage. |
 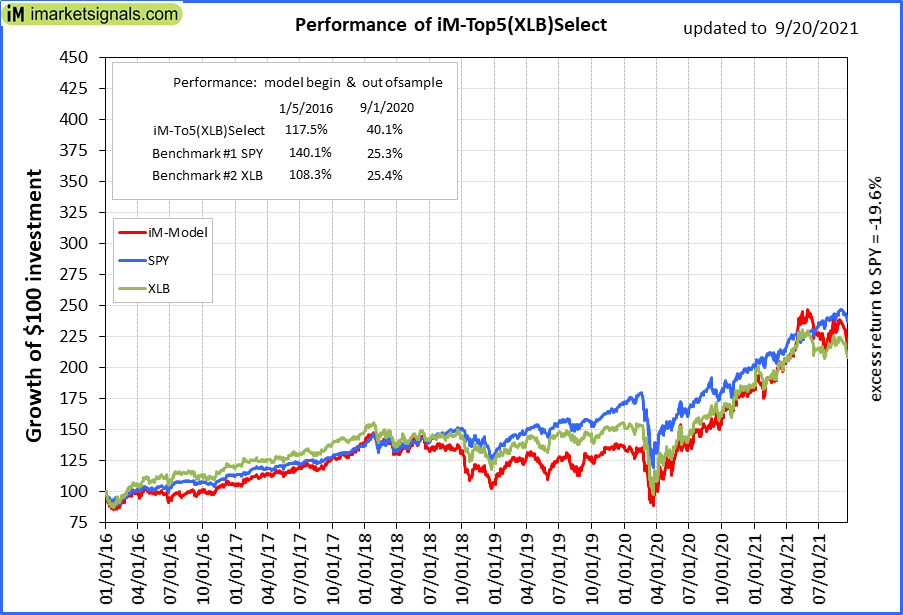 |
iM-Top5(XLB)Select: Since inception, on 1/5/2016, the model gained 117.23% while the benchmark SPY gained 136.78% over the same period. Over the previous week the market value of iM-Top5(XLB)Select gained -6.03% at a time when SPY gained -2.50%. A starting capital of $100,000 at inception on 1/5/2016 would have grown to $217,232 which includes $51 cash and excludes $6,612 spent on fees and slippage. |
 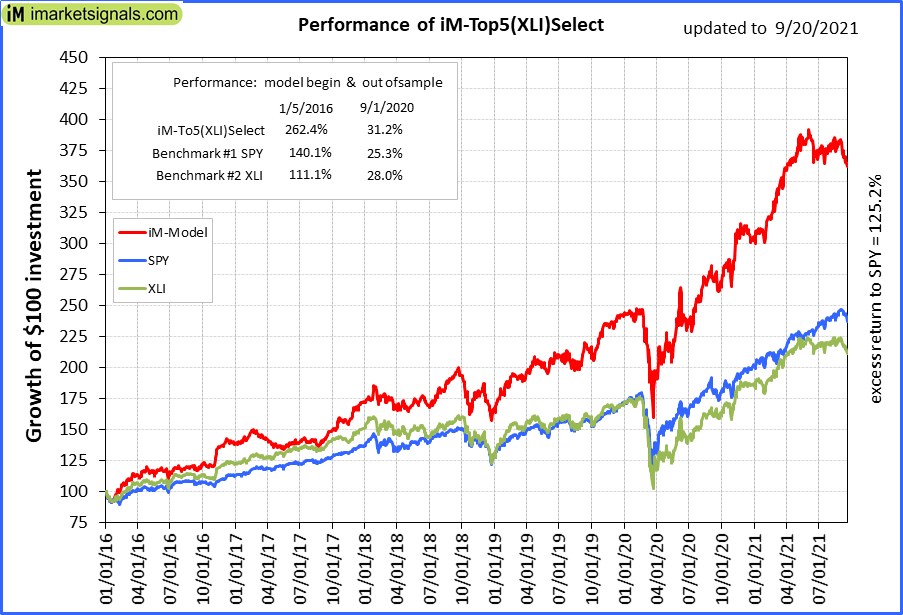 |
iM-Top5(XLI)Select: Since inception, on 1/5/2016, the model gained 261.94% while the benchmark SPY gained 136.78% over the same period. Over the previous week the market value of iM-Top5(XLI)Select gained -2.00% at a time when SPY gained -2.50%. A starting capital of $100,000 at inception on 1/5/2016 would have grown to $361,945 which includes $1,328 cash and excludes $3,785 spent on fees and slippage. |
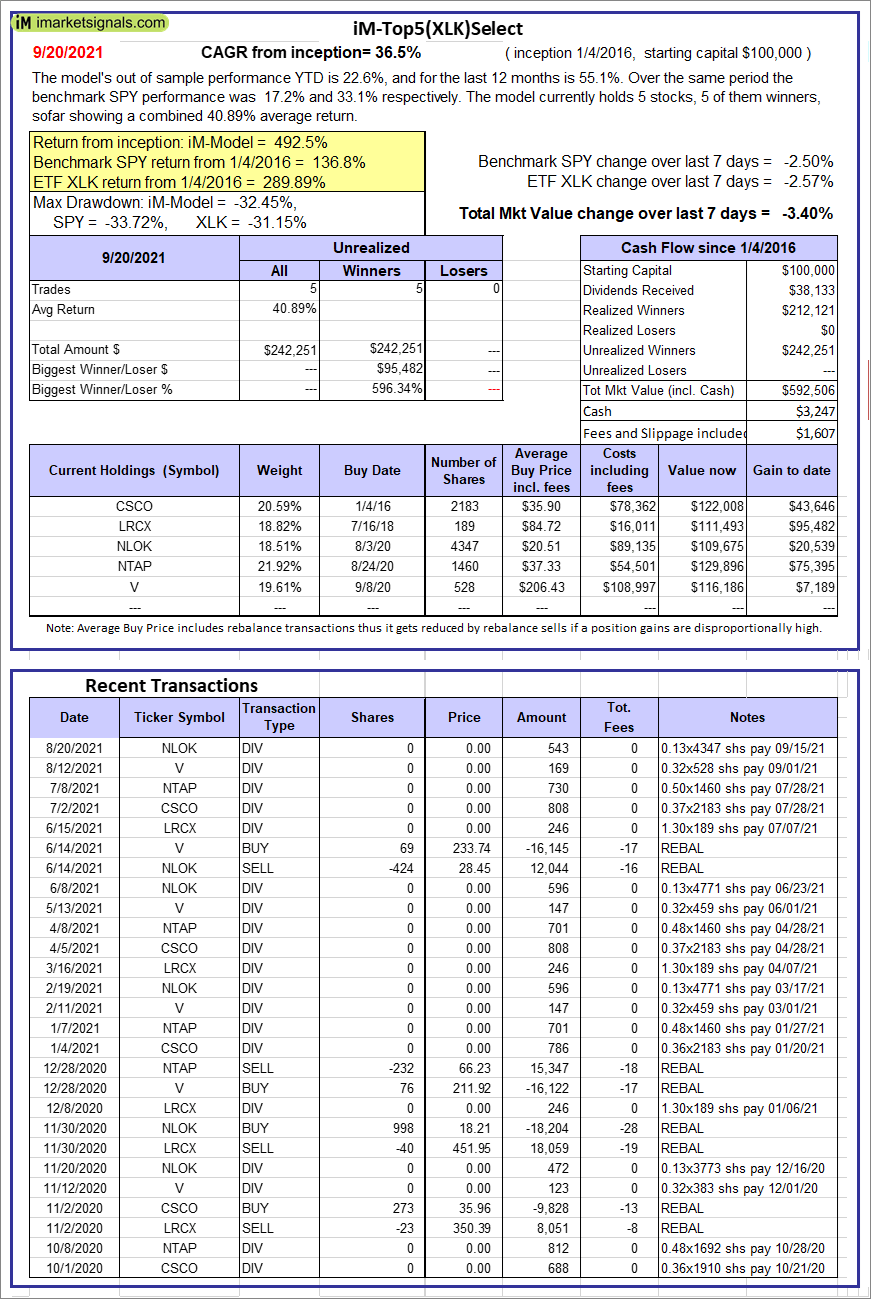 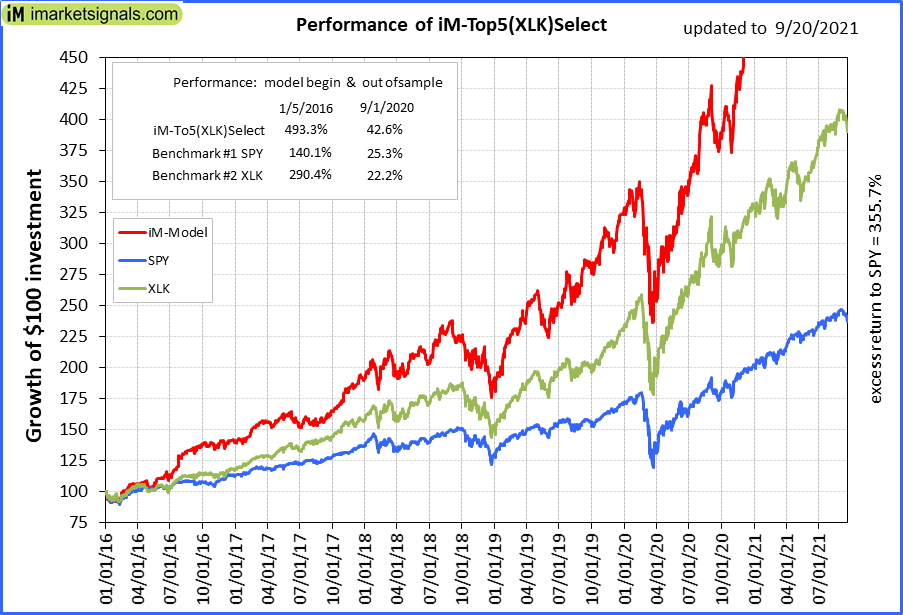 |
iM-Top5(XLK)Select: Since inception, on 1/5/2016, the model gained 492.51% while the benchmark SPY gained 136.78% over the same period. Over the previous week the market value of iM-Top5(XLK)Select gained -3.40% at a time when SPY gained -2.50%. A starting capital of $100,000 at inception on 1/5/2016 would have grown to $592,506 which includes $3,247 cash and excludes $1,607 spent on fees and slippage. |
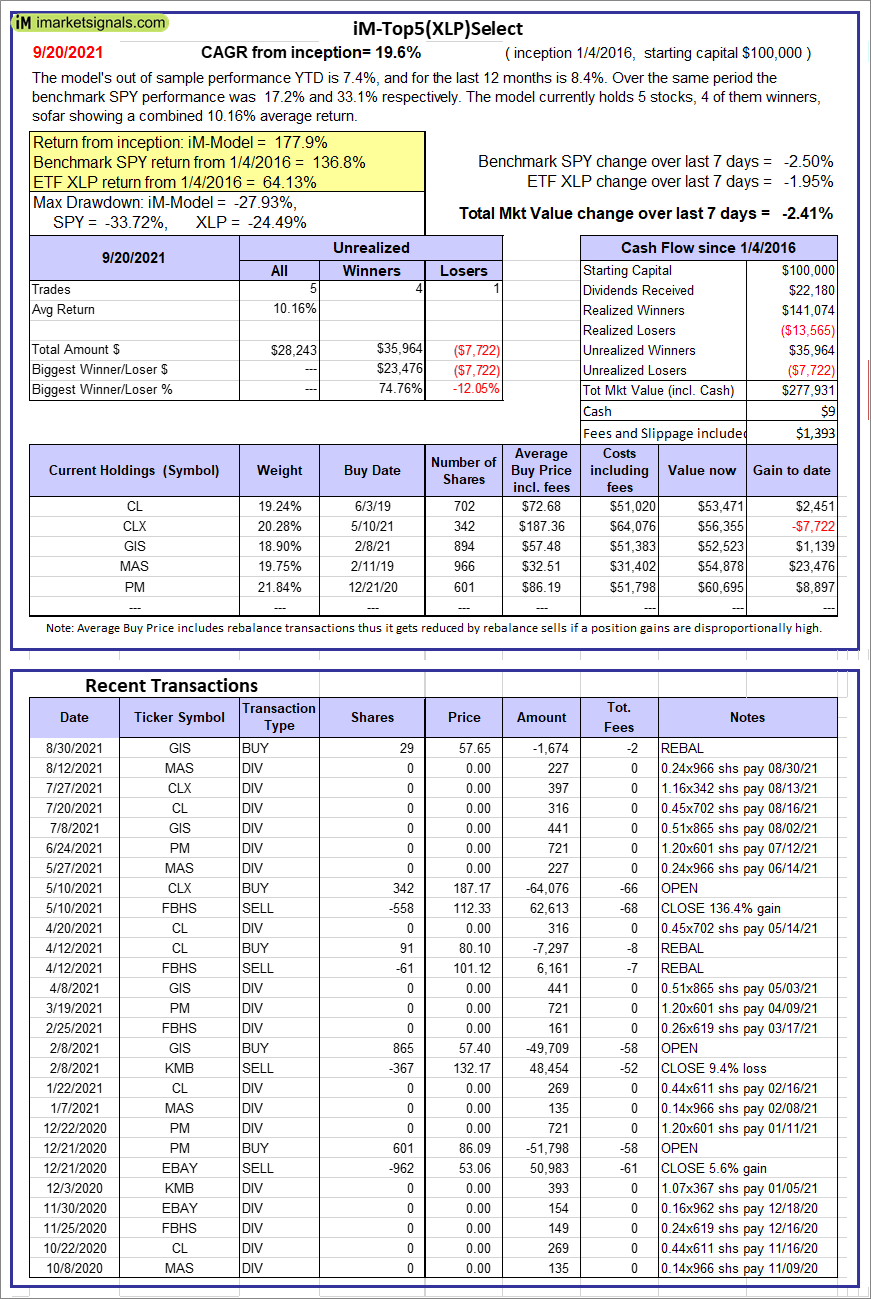 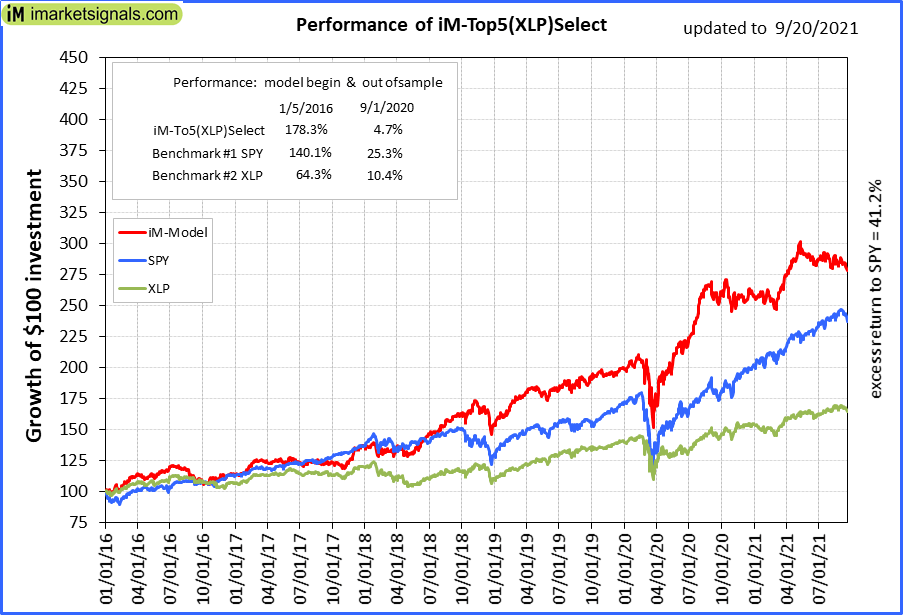 |
iM-Top5(XLP)Select: Since inception, on 1/5/2016, the model gained 177.93% while the benchmark SPY gained 136.78% over the same period. Over the previous week the market value of iM-Top5(XLP)Select gained -2.41% at a time when SPY gained -2.50%. A starting capital of $100,000 at inception on 1/5/2016 would have grown to $277,931 which includes $9 cash and excludes $1,393 spent on fees and slippage. |
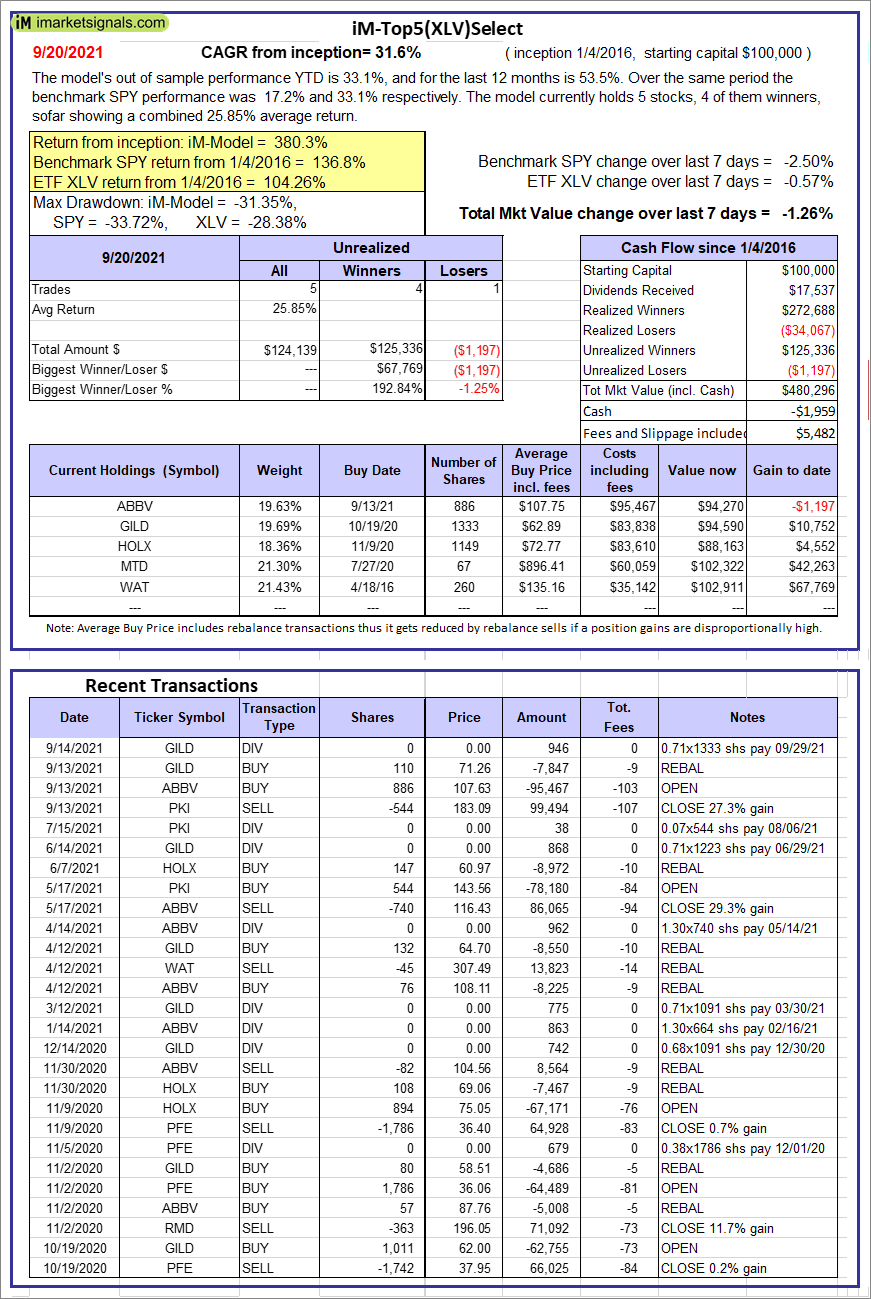 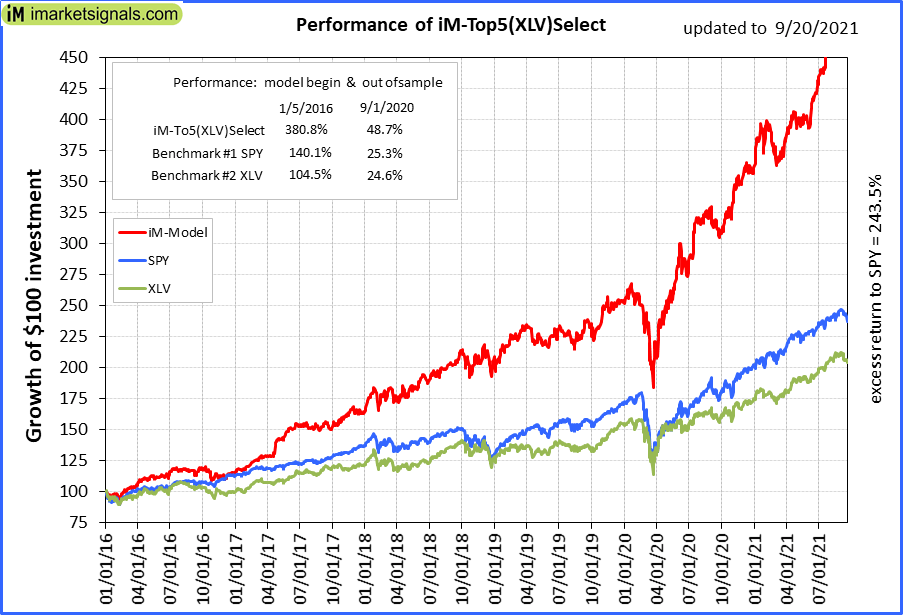 |
iM-Top5(XLV)Select: Since inception, on 1/5/2016, the model gained 380.30% while the benchmark SPY gained 136.78% over the same period. Over the previous week the market value of iM-Top5(XLV)Select gained -1.26% at a time when SPY gained -2.50%. A starting capital of $100,000 at inception on 1/5/2016 would have grown to $480,296 which includes -$1,959 cash and excludes $5,482 spent on fees and slippage. |
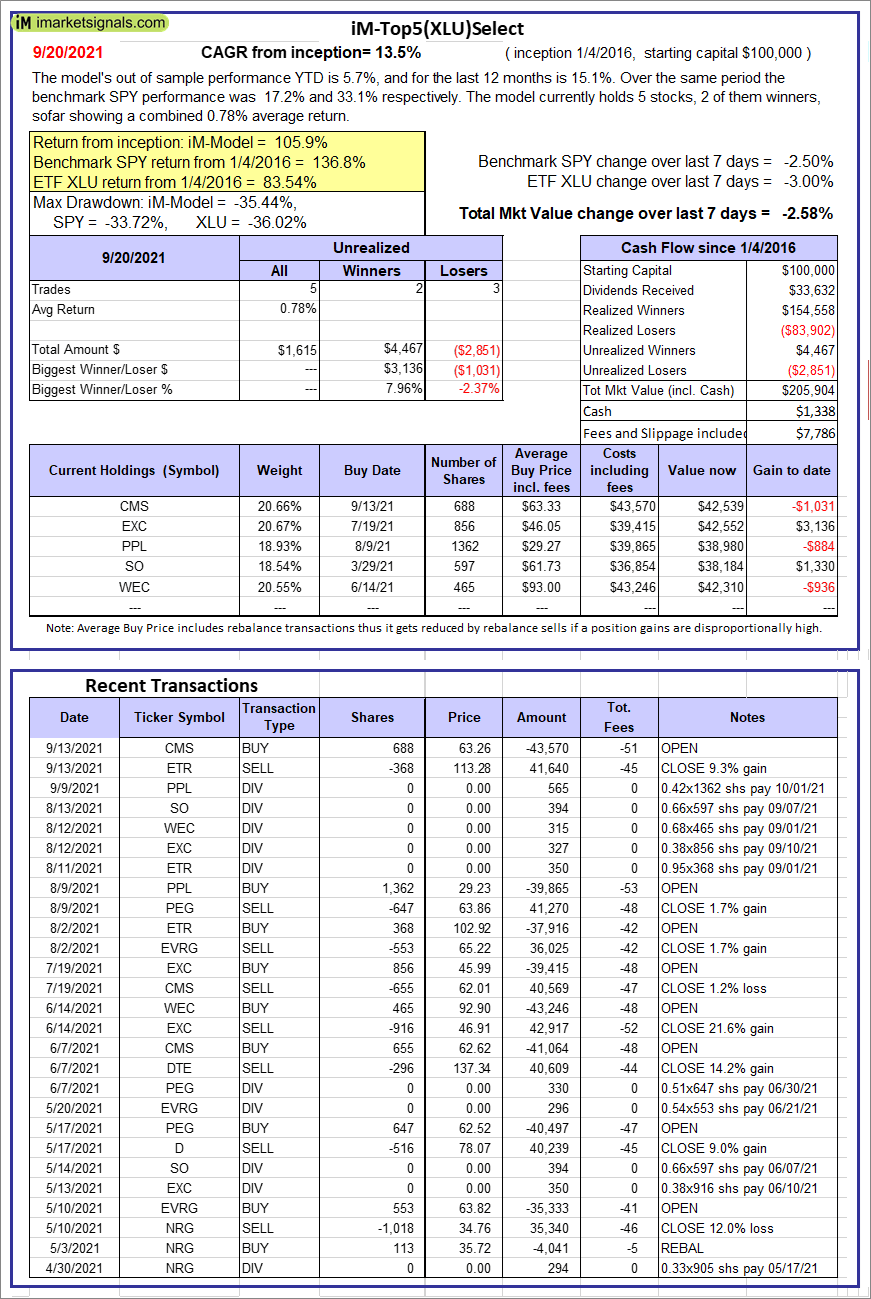 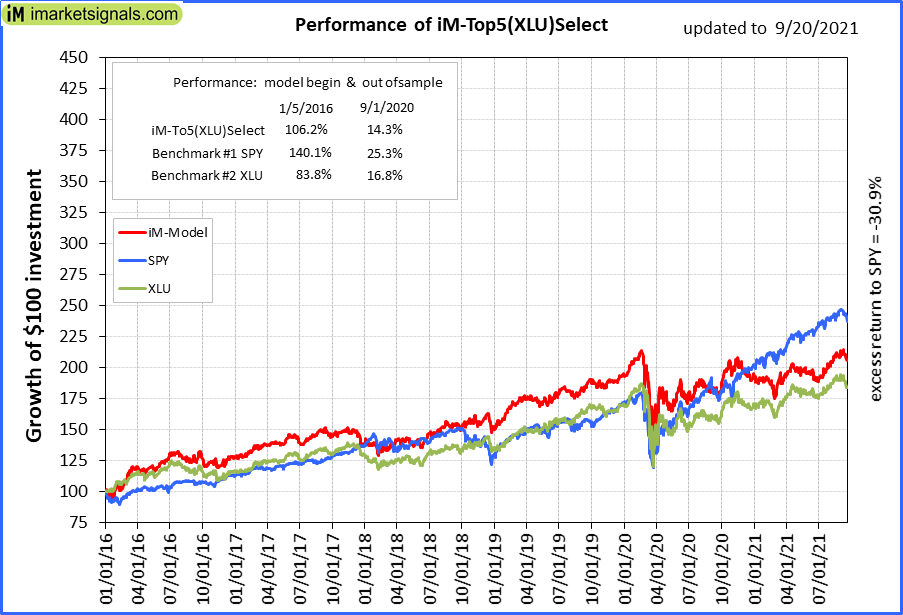 |
iM-Top5(XLU)Select: Since inception, on 1/5/2016, the model gained 105.90% while the benchmark SPY gained 136.78% over the same period. Over the previous week the market value of iM-Top5(XLU)Select gained -2.58% at a time when SPY gained -2.50%. A starting capital of $100,000 at inception on 1/5/2016 would have grown to $205,904 which includes $1,338 cash and excludes $7,786 spent on fees and slippage. |
 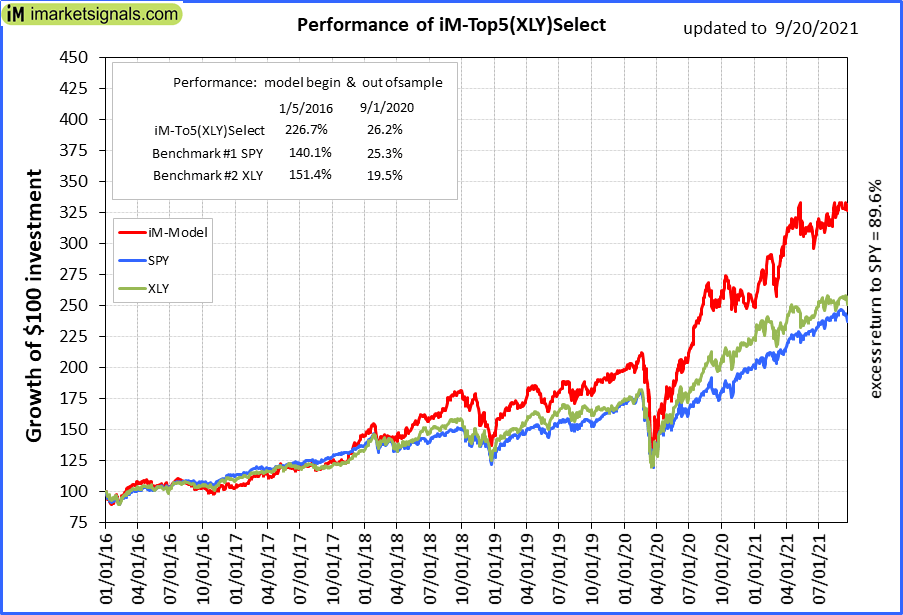 |
iM-Top5(XLY)Select: Since inception, on 1/5/2016, the model gained 226.33% while the benchmark SPY gained 136.78% over the same period. Over the previous week the market value of iM-Top5(XLY)Select gained -0.60% at a time when SPY gained -2.50%. A starting capital of $100,000 at inception on 1/5/2016 would have grown to $326,325 which includes $1,447 cash and excludes $3,192 spent on fees and slippage. |
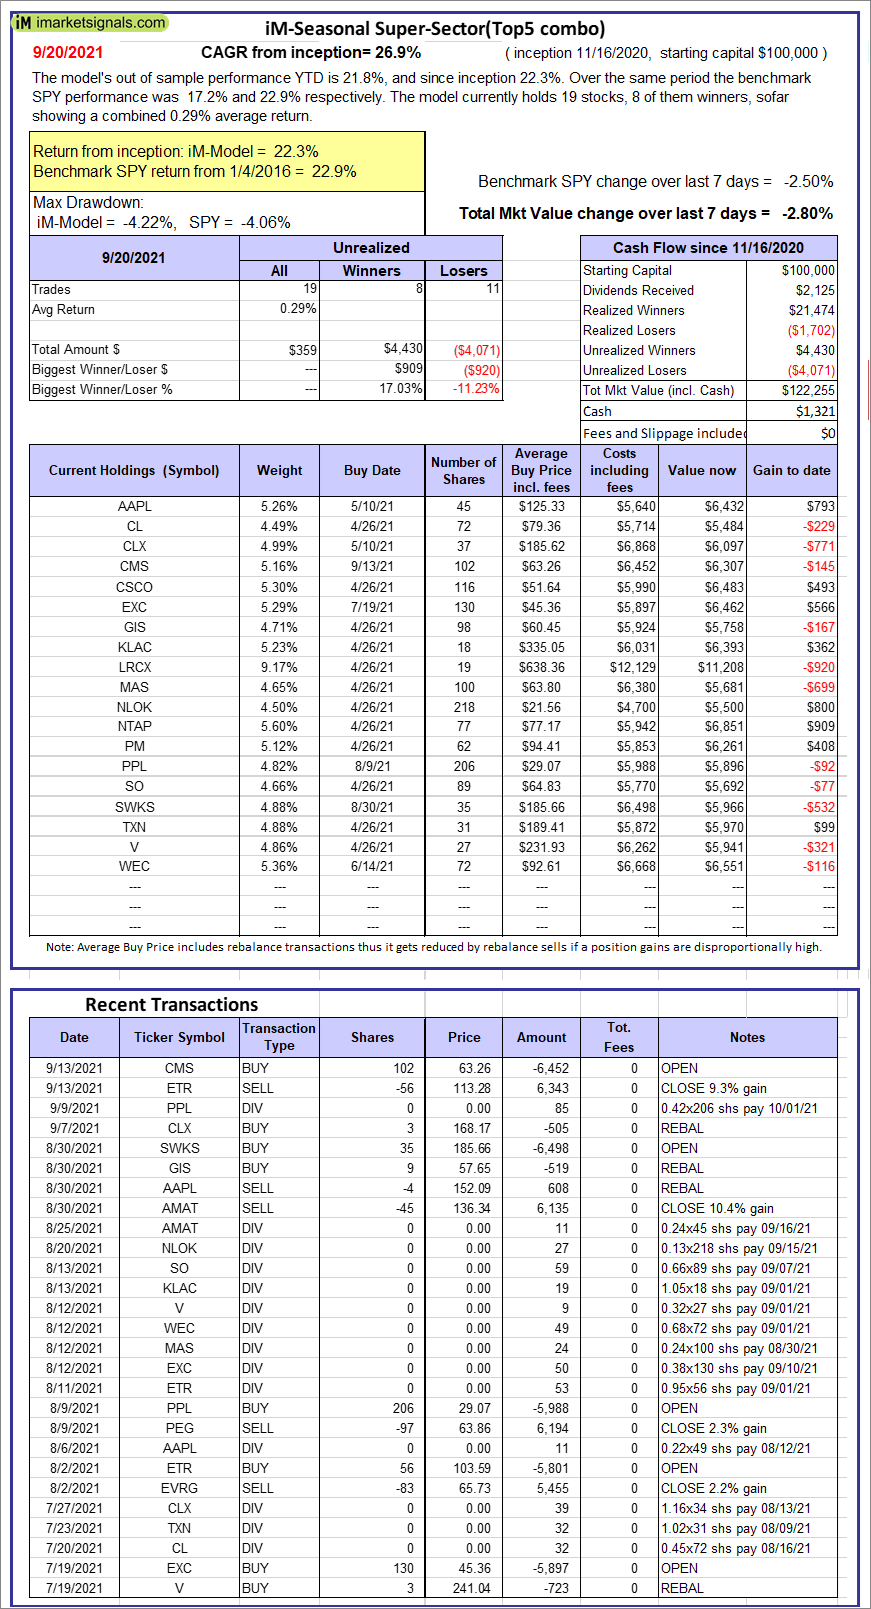 |
iM-Seasonal Super-Sectors (Top5 combo) : Since inception, on 11/17/2020, the model gained 22.26% while the benchmark SPY gained 22.91% over the same period. Over the previous week the market value of iM-Seasonal Super-Sectors (Top5 combo) gained -2.80% at a time when SPY gained -2.50%. A starting capital of $100,000 at inception on 11/17/2020 would have grown to $122,255 which includes $1,321 cash and excludes $00 spent on fees and slippage. |
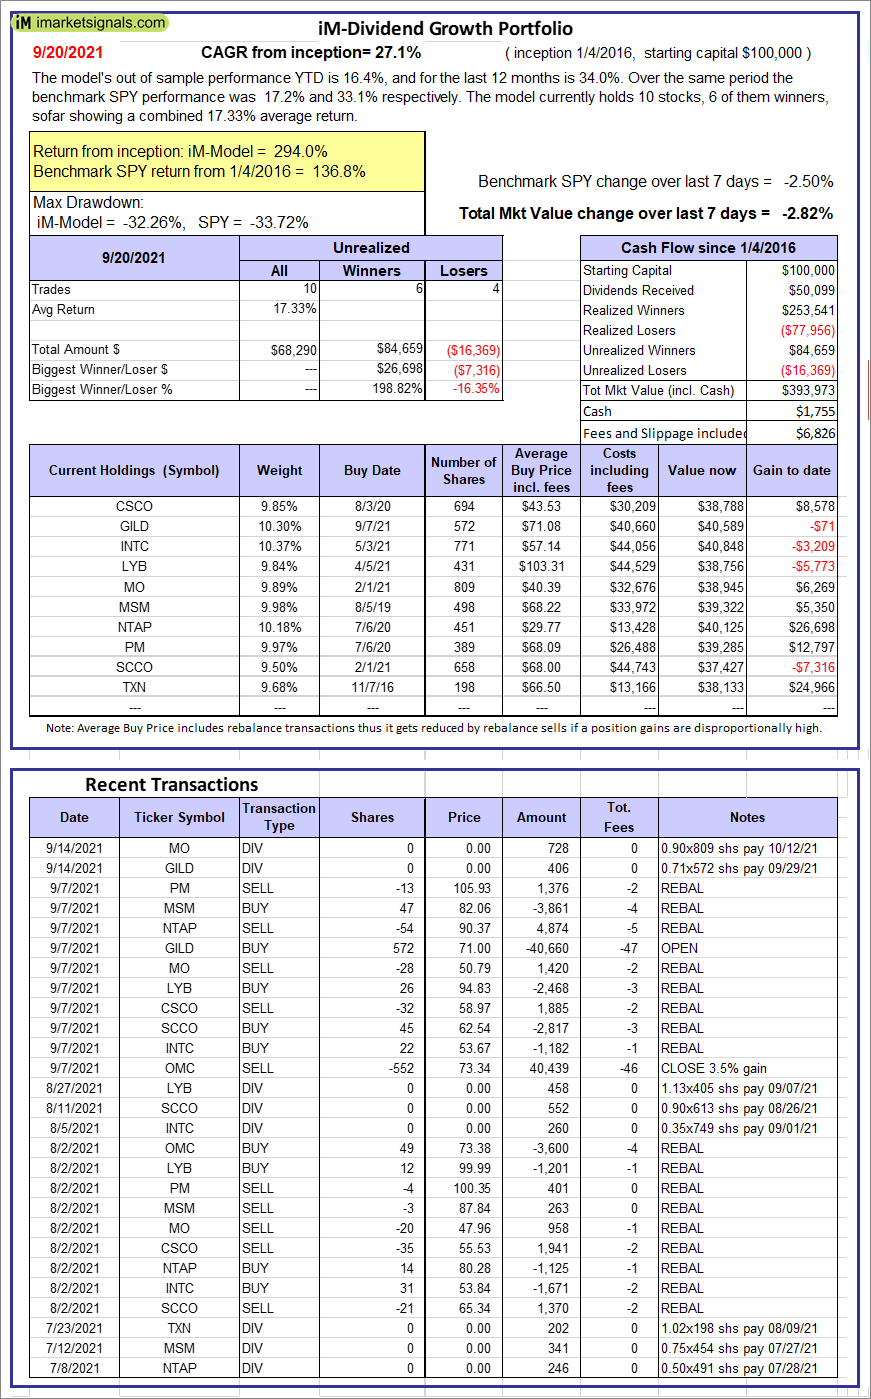 |
iM-Dividend Growth Portfolio: The model’s out of sample performance YTD is 16.4%, and for the last 12 months is 34.0%. Over the same period the benchmark SPY performance was 17.2% and 33.1% respectively. Over the previous week the market value of the iM-Dividend Growth Portfolio gained -2.82% at a time when SPY gained -2.50%. A starting capital of $100,000 at inception on 6/30/2016 would have grown to $393,973 which includes $1,755 cash and excludes $6,826 spent on fees and slippage. |
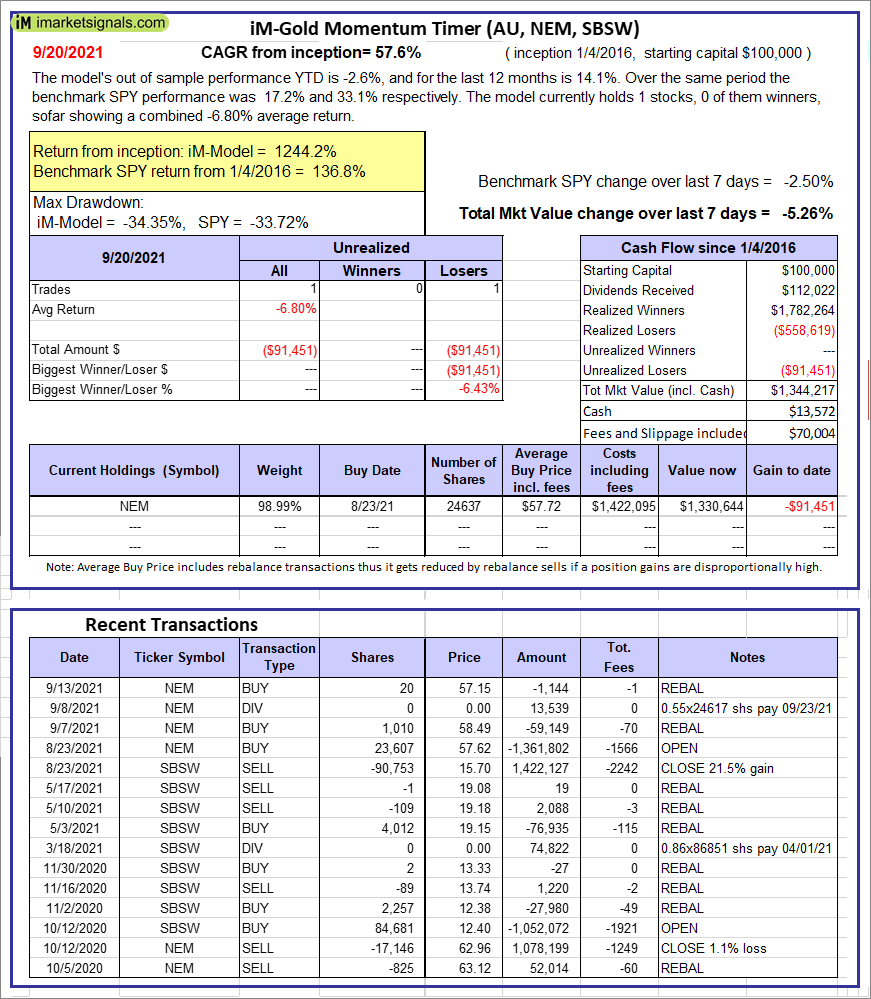 |
iM-Gold Momentum Timer (AU, NEM, SBSW): The model’s out of sample performance YTD is -2.6%, and for the last 12 months is 14.1%. Over the same period the benchmark SPY performance was 17.2% and 33.1% respectively. Over the previous week the market value of iM-Gold Momentum Timer (AU, NEM, SBSW) gained -5.26% at a time when SPY gained -2.50%. A starting capital of $100,000 at inception on 6/30/2016 would have grown to $13,572 which includes $70,004 cash and excludes Gain to date spent on fees and slippage. |
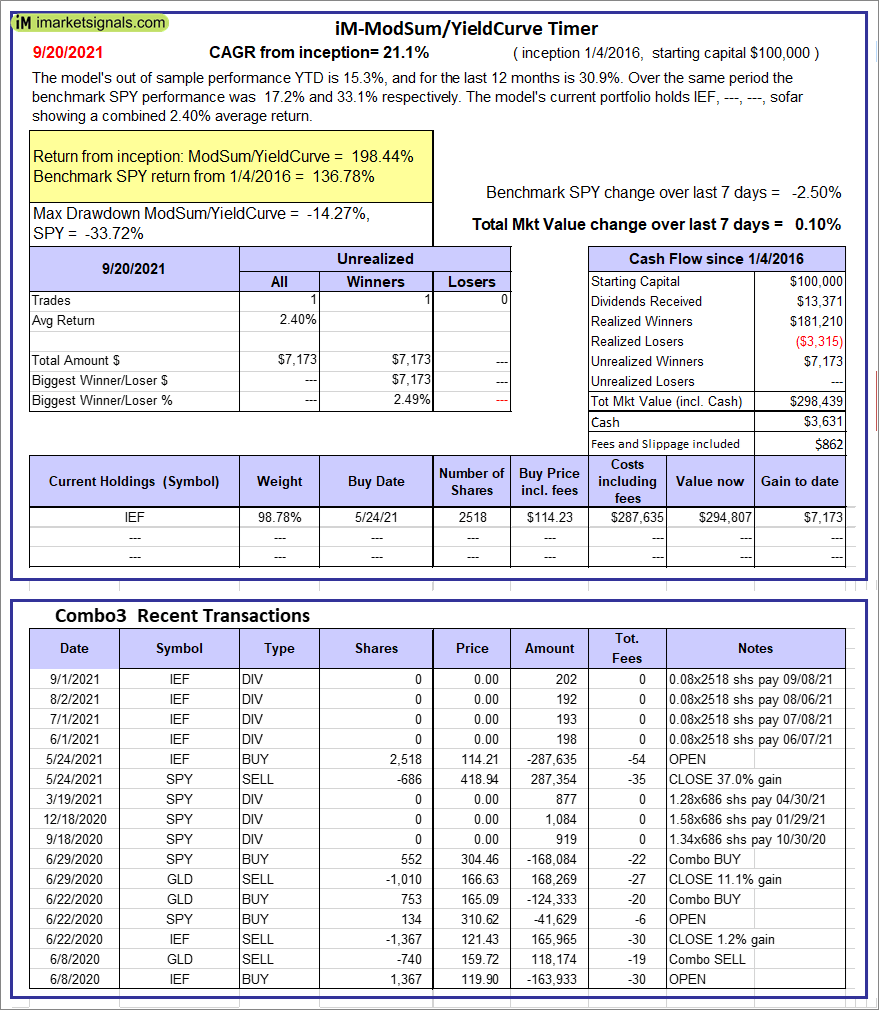 |
iM-ModSum/YieldCurve Timer: The model’s out of sample performance YTD is 15.3%, and for the last 12 months is 30.9%. Over the same period the benchmark SPY performance was 17.2% and 33.1% respectively. Over the previous week the market value of iM-PortSum/YieldCurve Timer gained 0.10% at a time when SPY gained -2.50%. A starting capital of $100,000 at inception on 1/1/2016 would have grown to $298,439 which includes $3,631 cash and excludes $862 spent on fees and slippage. |
 |
iM-Best(SPY-SH).R1: The model’s out of sample performance YTD is 17.1%, and for the last 12 months is 32.9%. Over the same period the benchmark SPY performance was 17.2% and 33.1% respectively. Over the previous week the market value of Best(SPY-SH) gained -2.46% at a time when SPY gained -2.50%. A starting capital of $100,000 at inception on 1/2/2009 would have grown to $775,764 which includes $10,552 cash and excludes $25,118 spent on fees and slippage. |
 |
iM-Combo3.R1: The model’s out of sample performance YTD is 8.9%, and for the last 12 months is 23.1%. Over the same period the benchmark SPY performance was 17.2% and 33.1% respectively. Over the previous week the market value of iM-Combo3.R1 gained -3.29% at a time when SPY gained -2.50%. A starting capital of $100,000 at inception on 2/3/2014 would have grown to $187,060 which includes $3,904 cash and excludes $7,165 spent on fees and slippage. |
 |
iM-Combo5: The model’s out of sample performance YTD is 16.2%, and for the last 12 months is 36.9%. Over the same period the benchmark SPY performance was 17.2% and 33.1% respectively. Over the previous week the market value of iM-Combo5 gained -3.08% at a time when SPY gained -2.50%. A starting capital of $100,000 at inception on 2/22/2016 would have grown to $206,303 which includes $3,111 cash and excludes $0 spent on fees and slippage. |
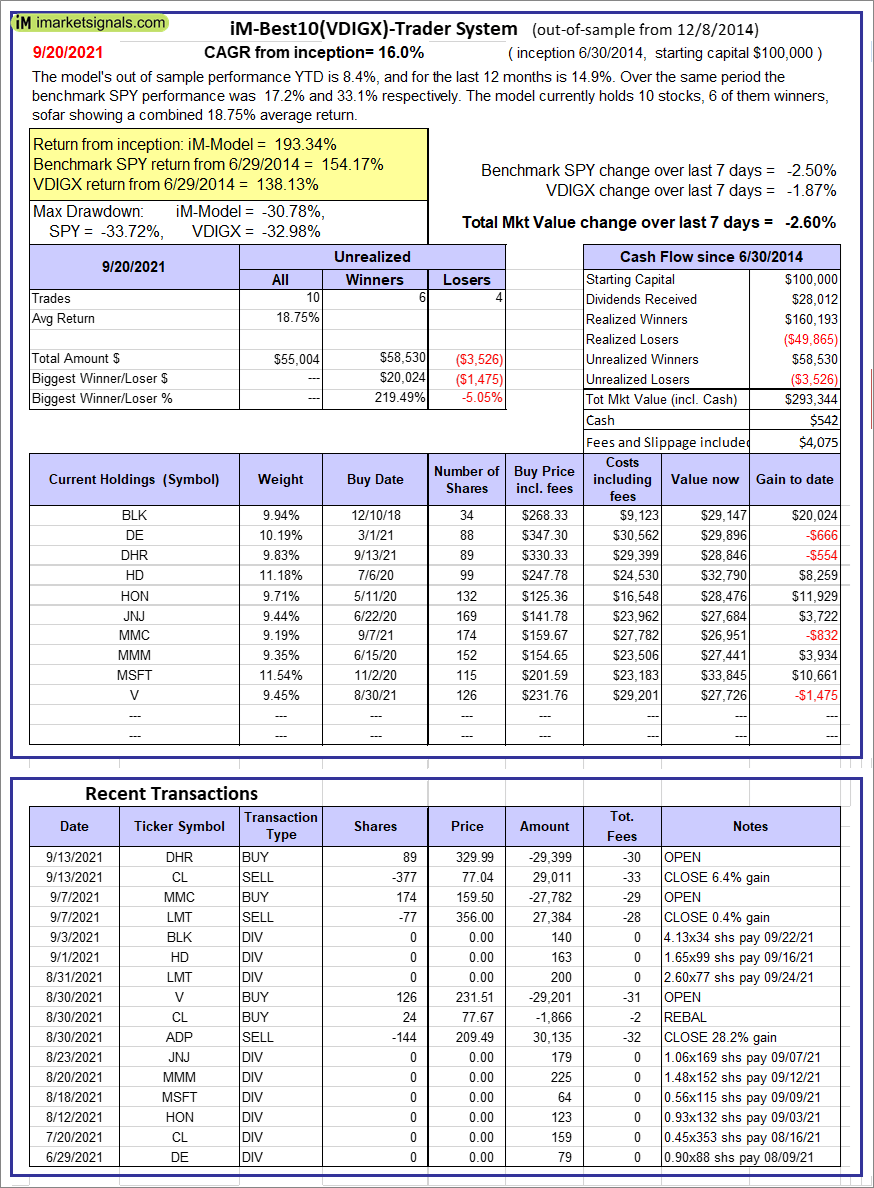 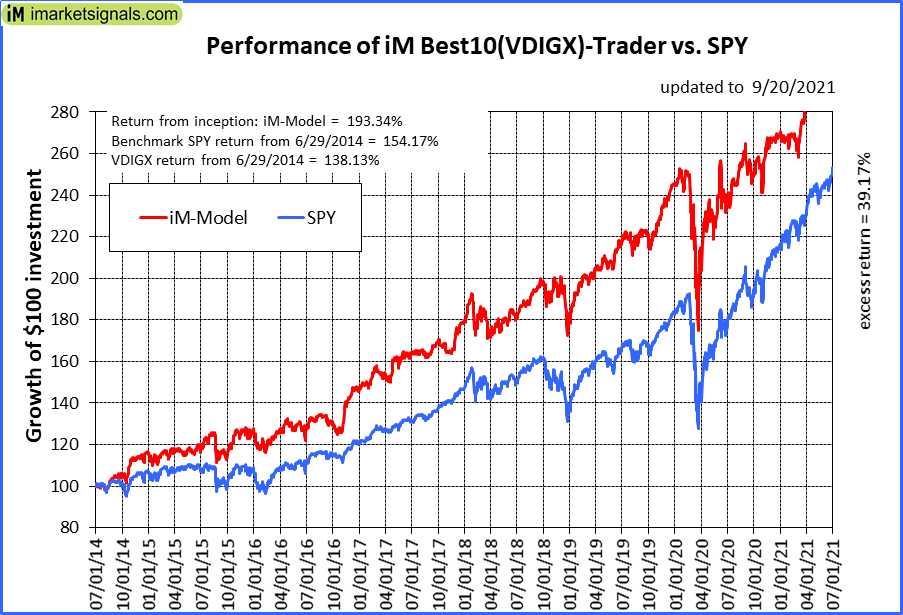 |
iM-Best10(VDIGX)-Trader: The model’s out of sample performance YTD is 8.4%, and for the last 12 months is 14.9%. Over the same period the benchmark SPY performance was 17.2% and 33.1% respectively. Since inception, on 7/1/2014, the model gained 193.34% while the benchmark SPY gained 154.17% and VDIGX gained 138.13% over the same period. Over the previous week the market value of iM-Best10(VDIGX) gained -2.60% at a time when SPY gained -2.50%. A starting capital of $100,000 at inception on 7/1/2014 would have grown to $293,344 which includes $542 cash and excludes $4,075 spent on fees and slippage. |
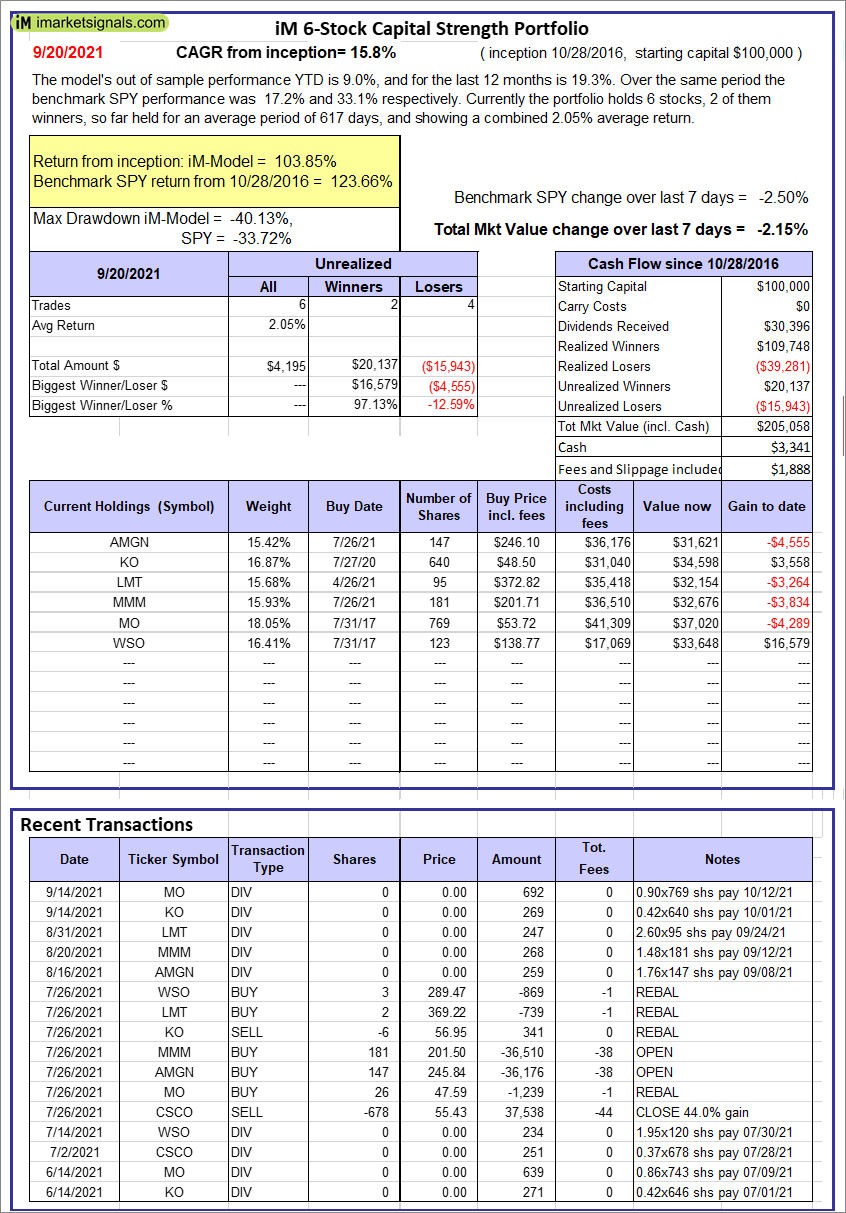 |
iM 6-Stock Capital Strength Portfolio: The model’s out of sample performance YTD is 9.0%, and for the last 12 months is 19.3%. Over the same period the benchmark SPY performance was 17.2% and 33.1% respectively. Over the previous week the market value of the iM 6-Stock Capital Strength Portfolio gained -2.15% at a time when SPY gained -2.50%. A starting capital of $100,000 at inception on 10/28/2016 would have grown to $205,058 which includes $3,341 cash and excludes $1,888 spent on fees and slippage. |
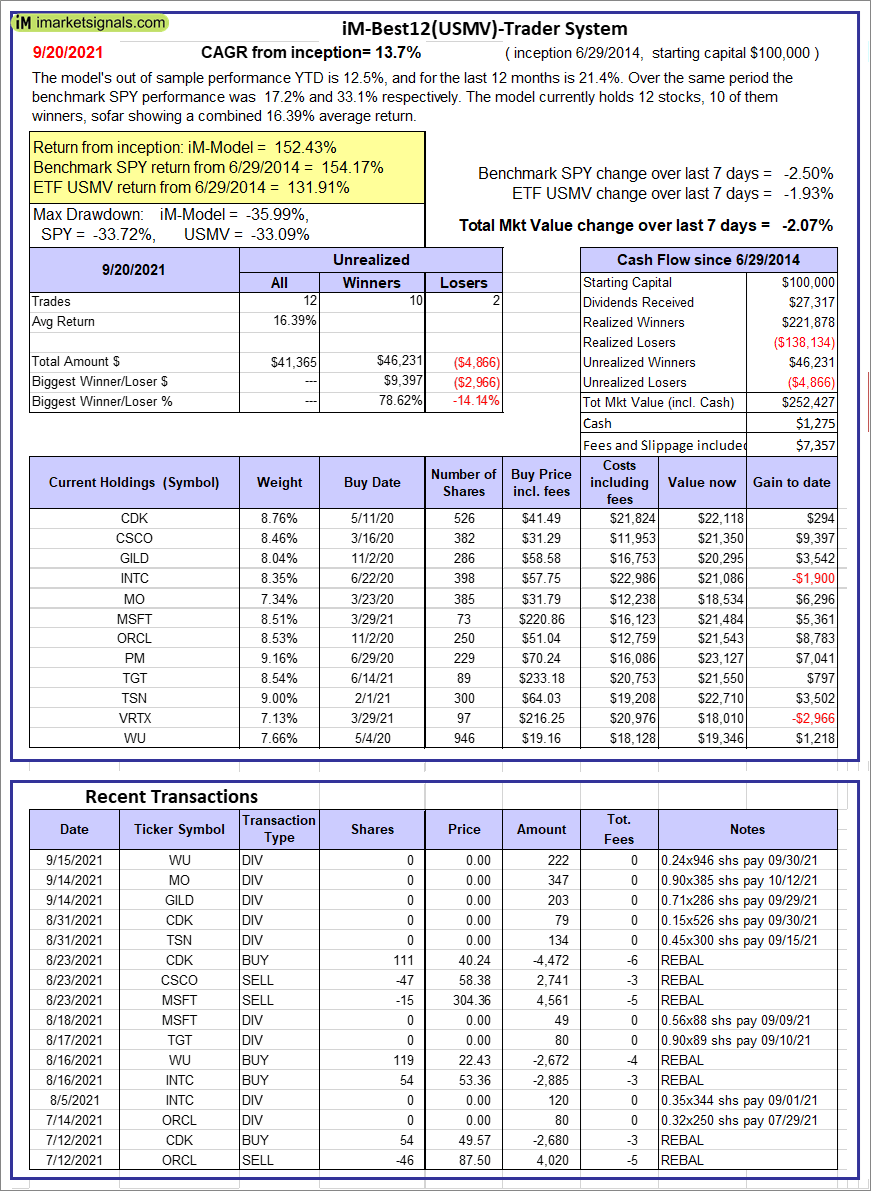 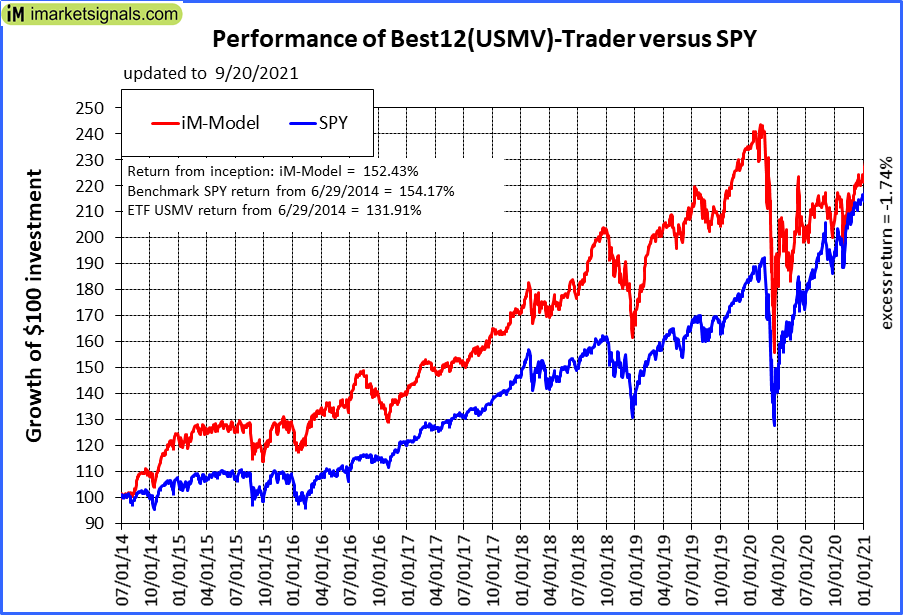 |
iM-Best12(USMV)-Trader: The model’s out of sample performance YTD is 12.5%, and for the last 12 months is 21.4%. Over the same period the benchmark SPY performance was 17.2% and 33.1% respectively. Since inception, on 6/30/2014, the model gained 152.43% while the benchmark SPY gained 154.17% and the ETF USMV gained 131.91% over the same period. Over the previous week the market value of iM-Best12(USMV)-Trader gained -2.07% at a time when SPY gained -2.50%. A starting capital of $100,000 at inception on 6/30/2014 would have grown to $252,427 which includes $1,275 cash and excludes $7,357 spent on fees and slippage. |
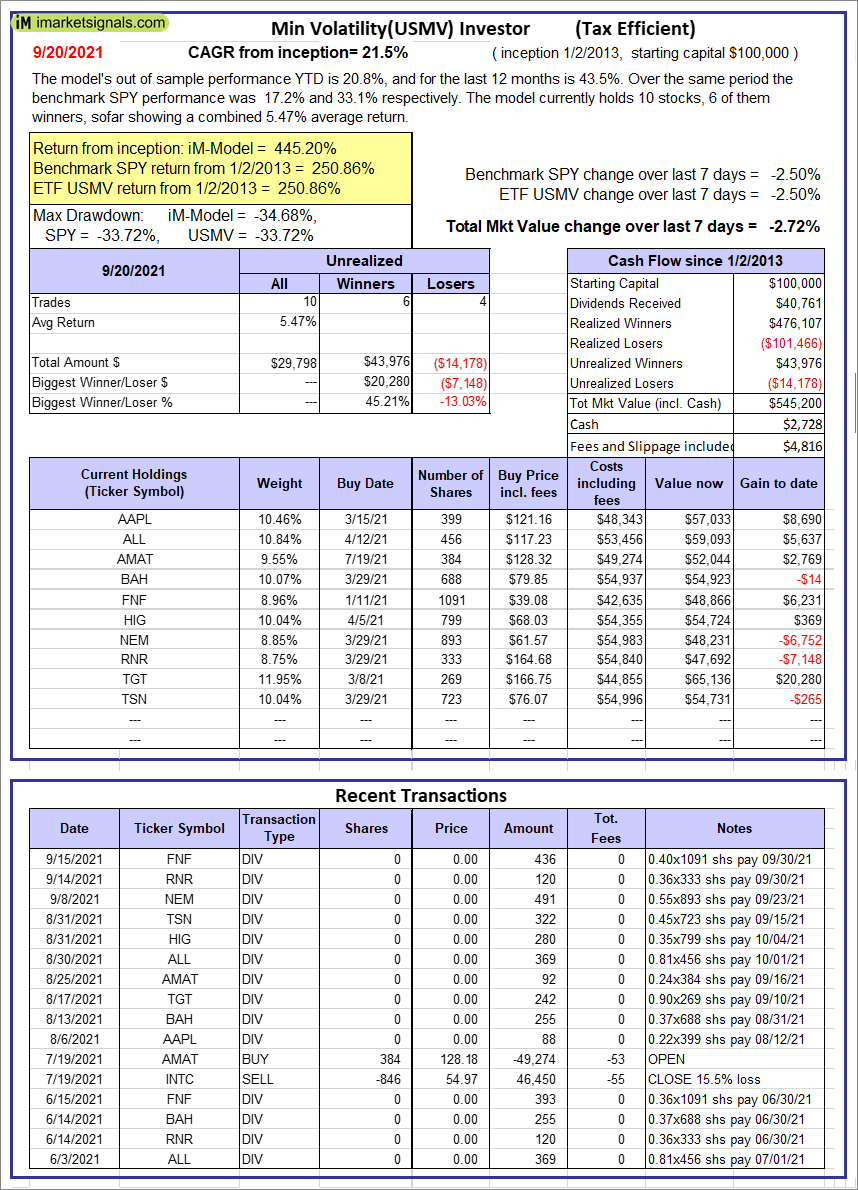  |
iM-Min Volatility(USMV) Investor (Tax Efficient): The model’s out of sample performance YTD is 20.8%, and for the last 12 months is 43.5%. Over the same period the benchmark SPY performance was 17.2% and 33.1% respectively. Since inception, on 1/3/2013, the model gained 445.20% while the benchmark SPY gained 250.86% and the ETF USMV gained 250.86% over the same period. Over the previous week the market value of iM-Best12(USMV)Q1 gained -2.72% at a time when SPY gained -2.50%. A starting capital of $100,000 at inception on 1/3/2013 would have grown to $545,200 which includes $2,728 cash and excludes $4,816 spent on fees and slippage. |
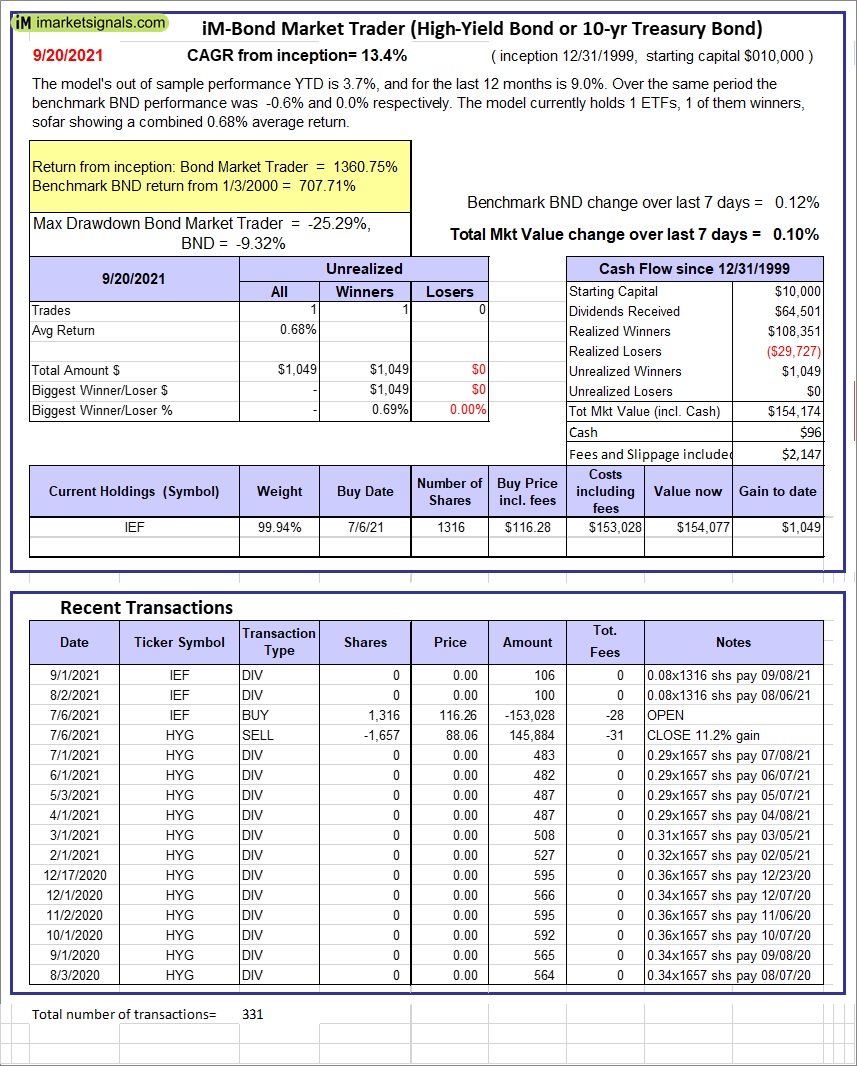 |
iM-Bond Market Trader (High-Yield Bond or 10-yr Treasury Bond): The model’s out of sample performance YTD is 3.7%, and for the last 12 months is 9.0%. Over the same period the benchmark BND performance was -0.6% and 0.0% respectively. Over the previous week the market value of the iM-Bond Market Trader (High-Yield Bond or 10-yr Treasury Bond) gained 0.10% at a time when BND gained 0.12%. A starting capital of $10,000 at inception on 1/3/2000 would have grown to $154,174 which includes $96 cash and excludes $2,147 spent on fees and slippage. |
|
|
iM-ModSum/YieldCurve Timer: The model’s out of sample performance YTD is 15.3%, and for the last 12 months is 30.9%. Over the same period the benchmark SPY performance was 17.2% and 33.1% respectively. Over the previous week the market value of iM-PortSum/YieldCurve Timer gained 0.10% at a time when SPY gained -2.50%. A starting capital of $100,000 at inception on 1/1/2016 would have grown to $298,439 which includes $3,631 cash and excludes $862 spent on fees and slippage. |
 |
iM-Best2 MC-Score ETF System: The model’s out of sample performance YTD is 8.6%, and for the last 12 months is 16.5%. Over the same period the benchmark SPY performance was 17.2% and 33.1% respectively. Over the previous week the market value of the iM-Best2 MC-Score ETF System gained -1.90% at a time when SPY gained -2.50%. A starting capital of $100,000 at inception on 6/30/2016 would have grown to $142,544 which includes $3,205 cash and excludes $1,386 spent on fees and slippage. |
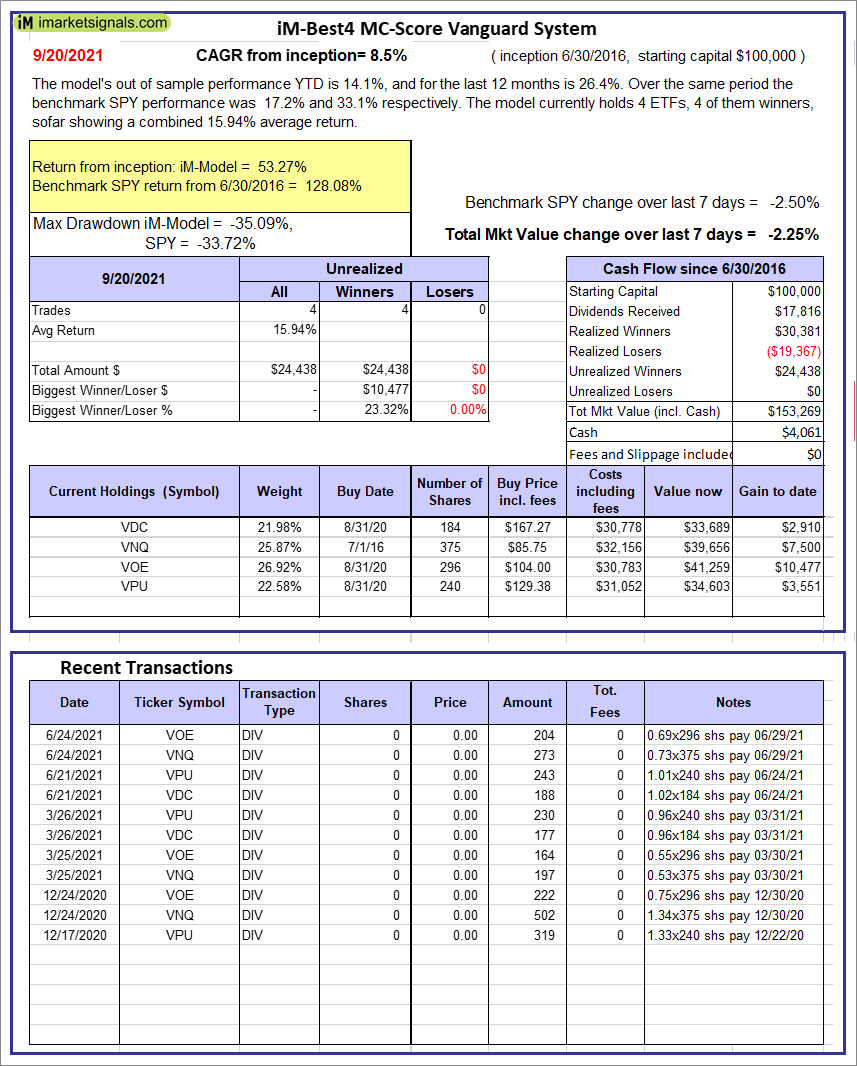 |
iM-Best4 MC-Score Vanguard System: The model’s out of sample performance YTD is 14.1%, and for the last 12 months is 26.4%. Over the same period the benchmark SPY performance was 17.2% and 33.1% respectively. Over the previous week the market value of the iM-Best4 MC-Score Vanguard System gained -2.25% at a time when SPY gained -2.50%. A starting capital of $100,000 at inception on 6/30/2016 would have grown to $153,269 which includes $4,061 cash and excludes $00 spent on fees and slippage. |
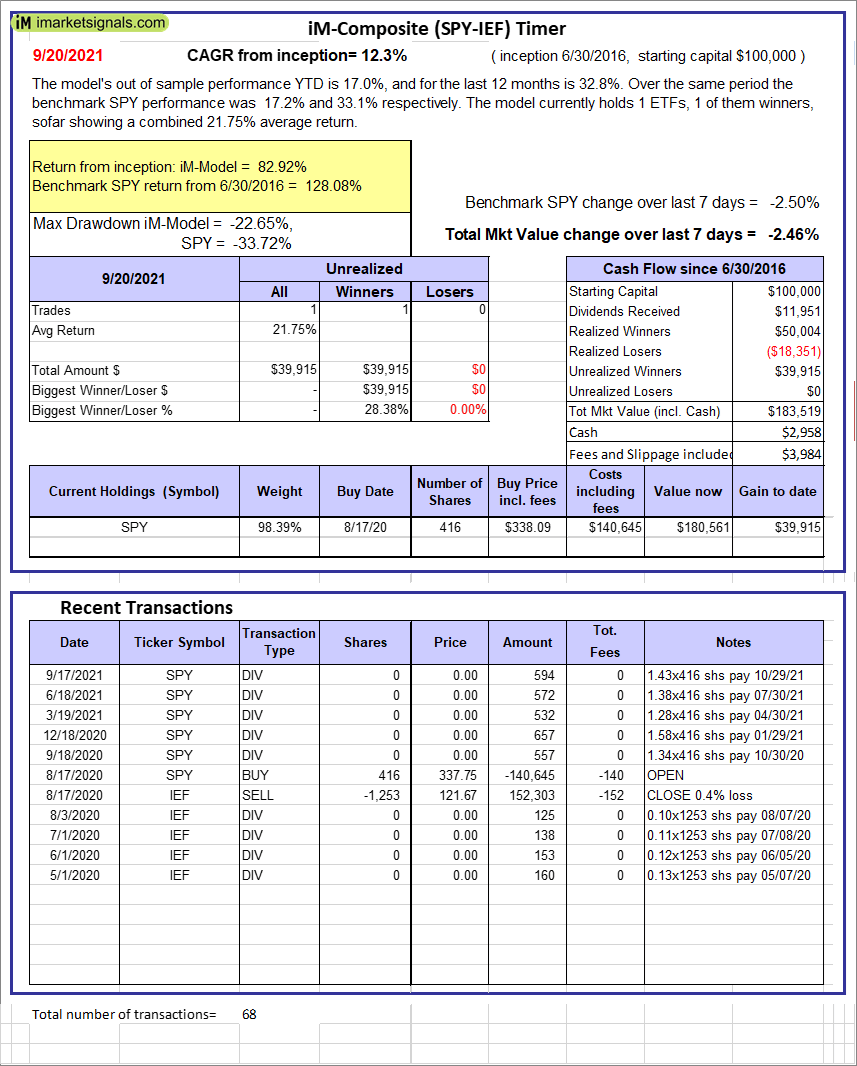 |
iM-Composite (SPY-IEF) Timer: The model’s out of sample performance YTD is 17.0%, and for the last 12 months is 32.8%. Over the same period the benchmark SPY performance was 17.2% and 33.1% respectively. Over the previous week the market value of the iM-Composite (SPY-IEF) Timer gained -2.46% at a time when SPY gained -2.50%. A starting capital of $100,000 at inception on 6/30/2016 would have grown to $183,519 which includes $2,958 cash and excludes $3,984 spent on fees and slippage. |
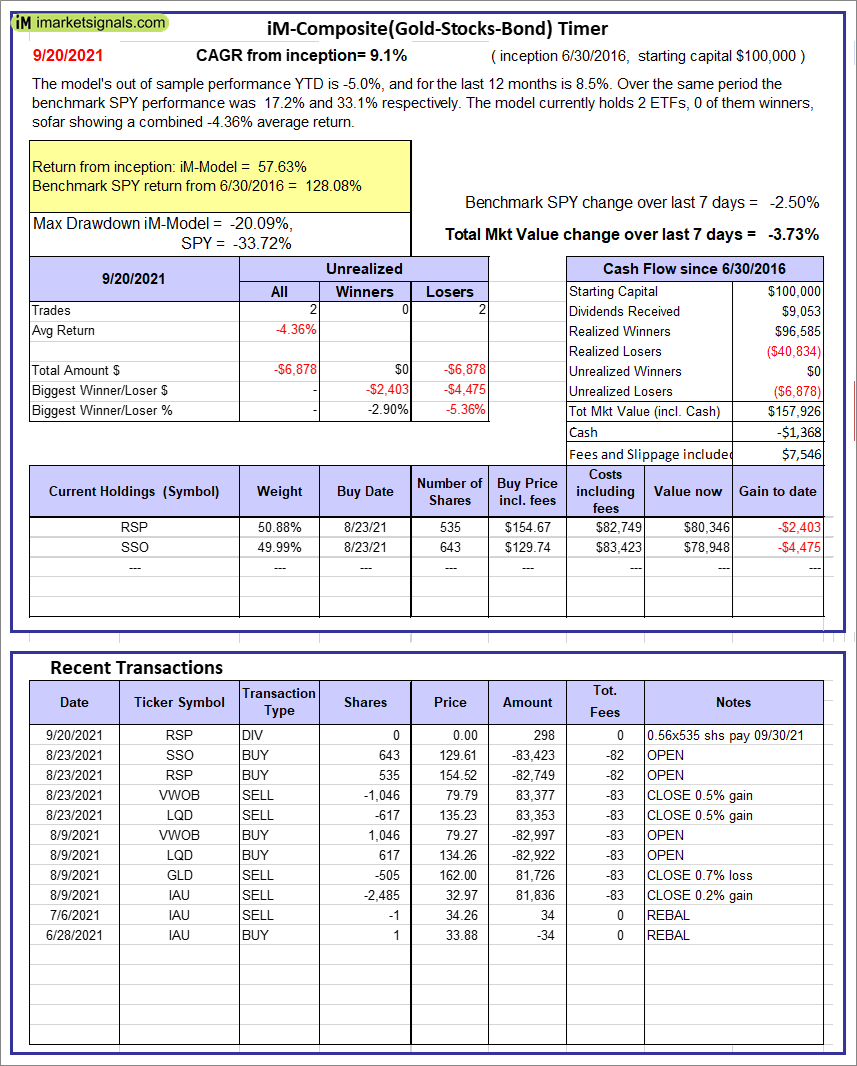 |
iM-Composite(Gold-Stocks-Bond) Timer: The model’s out of sample performance YTD is -5.0%, and for the last 12 months is 8.5%. Over the same period the benchmark SPY performance was 17.2% and 33.1% respectively. Over the previous week the market value of the iM-Composite(Gold-Stocks-Bond) Timer gained -3.73% at a time when SPY gained -2.50%. A starting capital of $100,000 at inception on 6/30/2016 would have grown to $157,926 which includes -$1,368 cash and excludes $7,546 spent on fees and slippage. |
iM-Best Reports – 9/20/21
Posted in pmp SPY-SH
Leave a Reply
You must be logged in to post a comment.