
  |
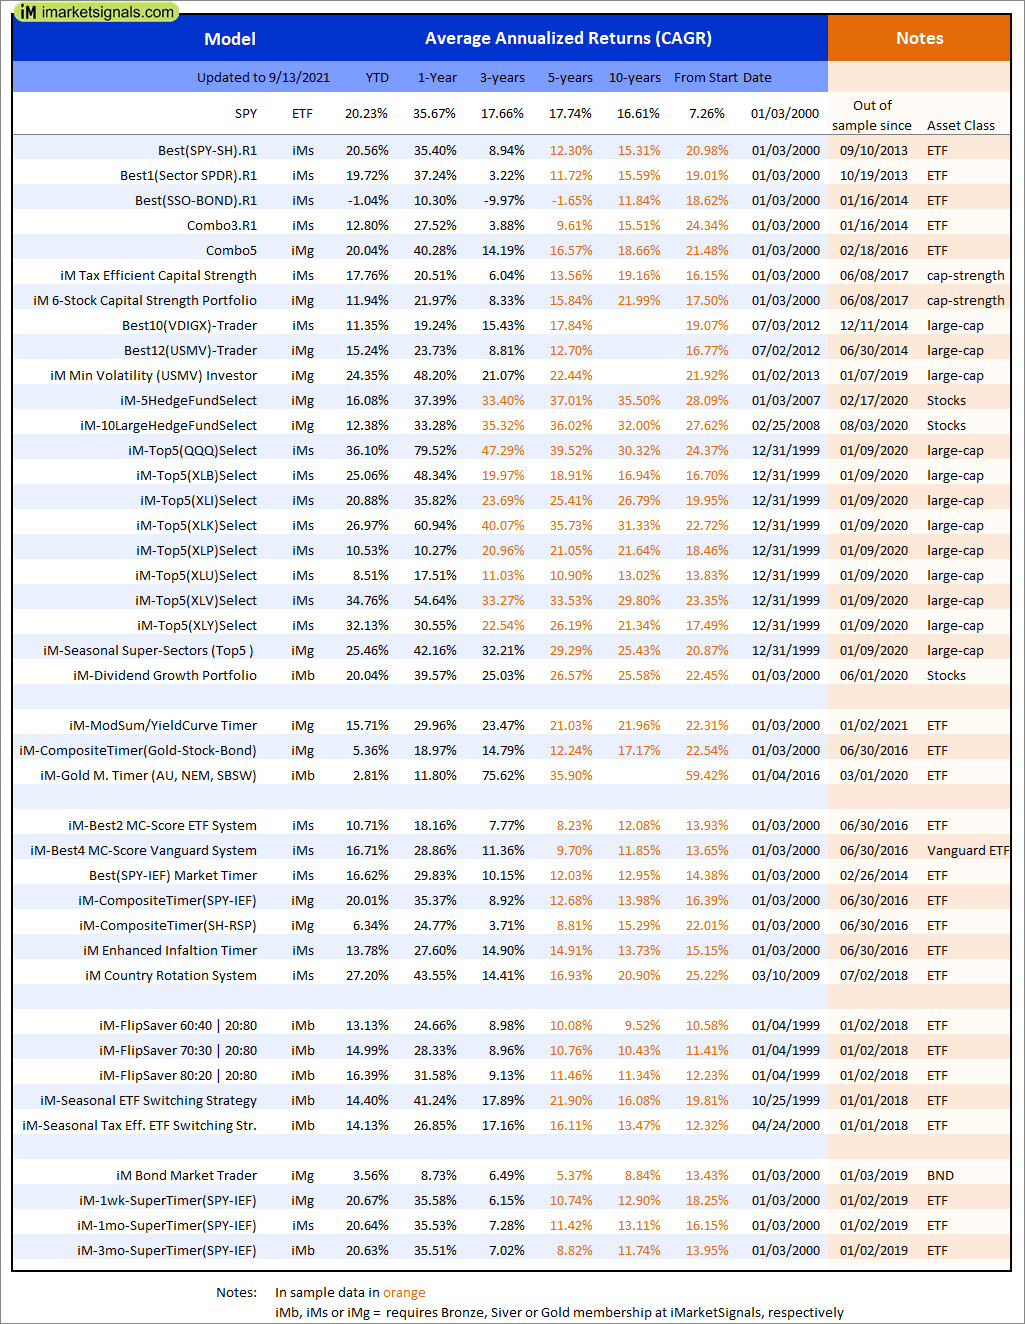
Out of sample performance summary of our models for the past 1, 2, 4 and 13 week periods. The active active return indicates how the models over- or underperformed the benchmark ETF SPY. Also the YTD, and the 1-, 3-, 5- and 10-year annualized returns are shown in the second table |
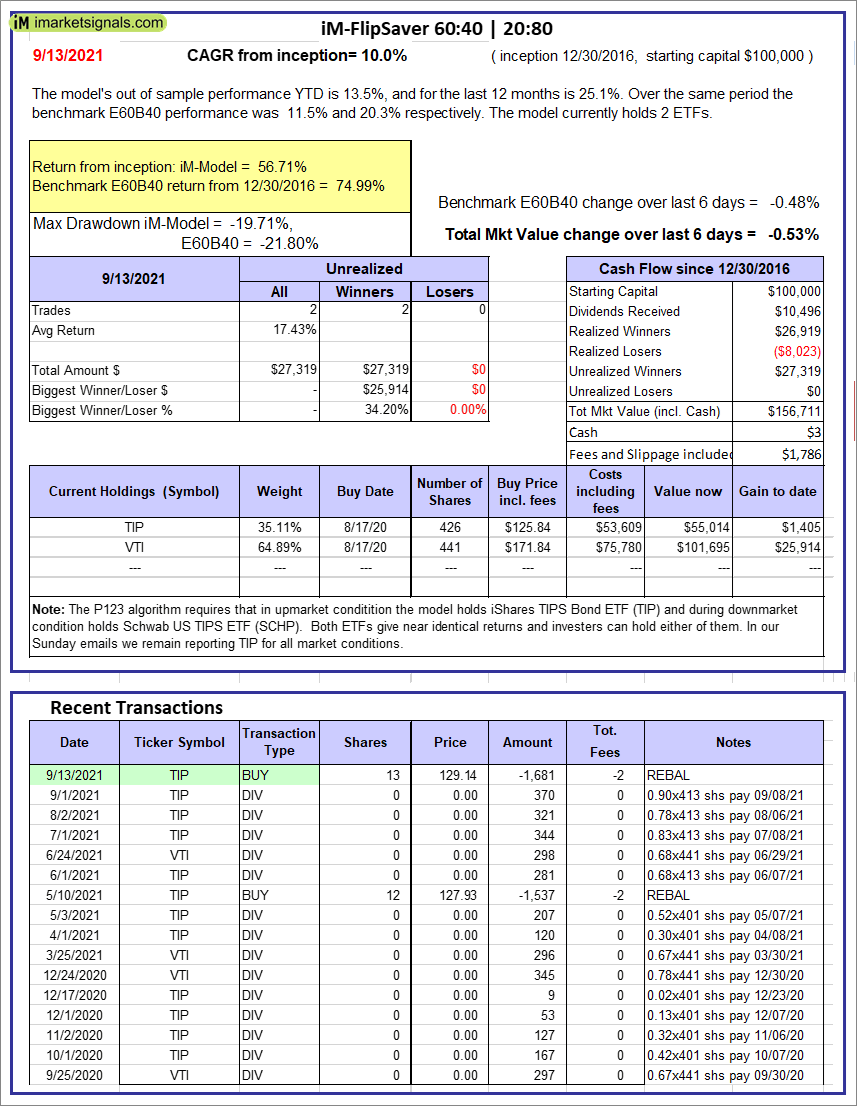 |
iM-FlipSaver 60:40 | 20:80 – 2017: The model’s out of sample performance YTD is 13.5%, and for the last 12 months is 25.1%. Over the same period the benchmark E60B40 performance was 11.5% and 20.3% respectively. Over the previous week the market value of iM-FlipSaver 80:20 | 20:80 gained -0.53% at a time when SPY gained -0.48%. A starting capital of $100,000 at inception on 7/16/2015 would have grown to $156,711 which includes $3 cash and excludes $1,786 spent on fees and slippage. |
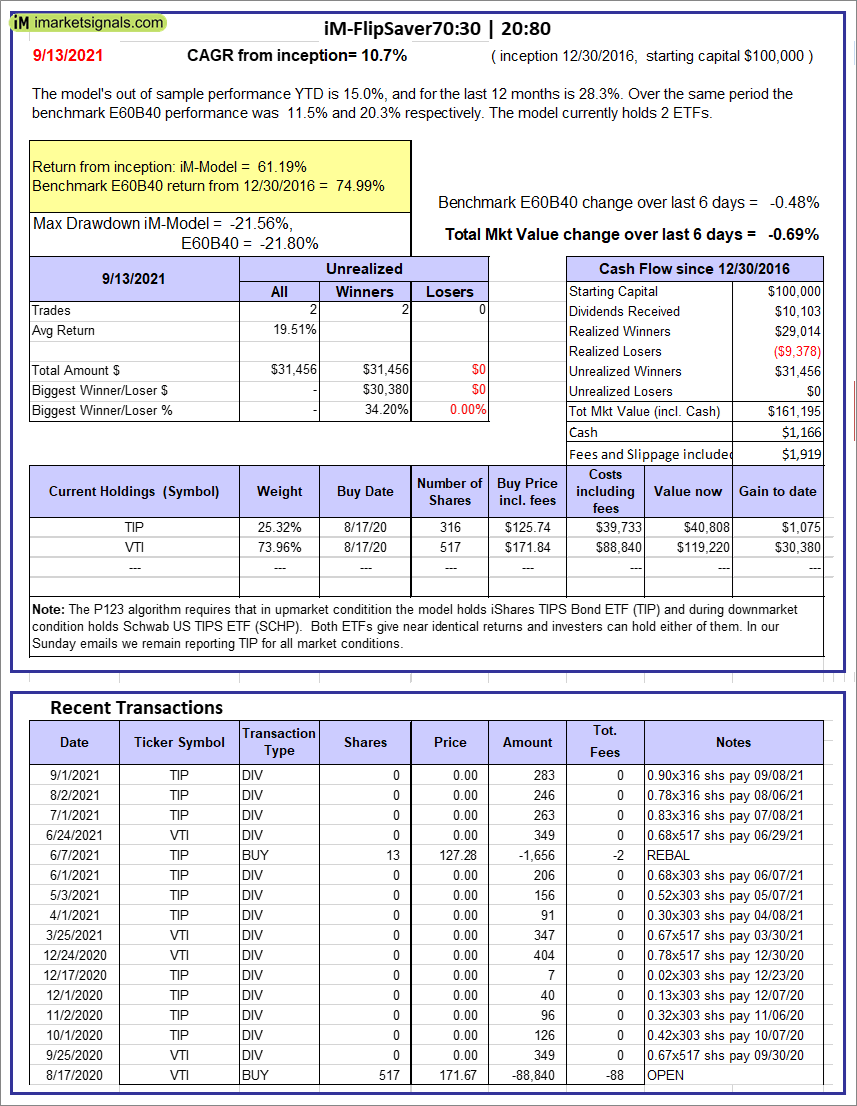 |
iM-FlipSaver 70:30 | 20:80 – 2017: The model’s out of sample performance YTD is 15.0%, and for the last 12 months is 28.3%. Over the same period the benchmark E60B40 performance was 11.5% and 20.3% respectively. Over the previous week the market value of iM-FlipSaver 70:30 | 20:80 gained -0.69% at a time when SPY gained -0.48%. A starting capital of $100,000 at inception on 7/15/2015 would have grown to $161,195 which includes $1,166 cash and excludes $1,919 spent on fees and slippage. |
 |
iM-FlipSaver 80:20 | 20:80 – 2017: The model’s out of sample performance YTD is 16.4%, and for the last 12 months is 31.5%. Over the same period the benchmark E60B40 performance was 11.5% and 20.3% respectively. Over the previous week the market value of iM-FlipSaver 80:20 | 20:80 gained -0.84% at a time when SPY gained -0.48%. A starting capital of $100,000 at inception on 1/2/2017 would have grown to $165,563 which includes $1,052 cash and excludes $2,047 spent on fees and slippage. |
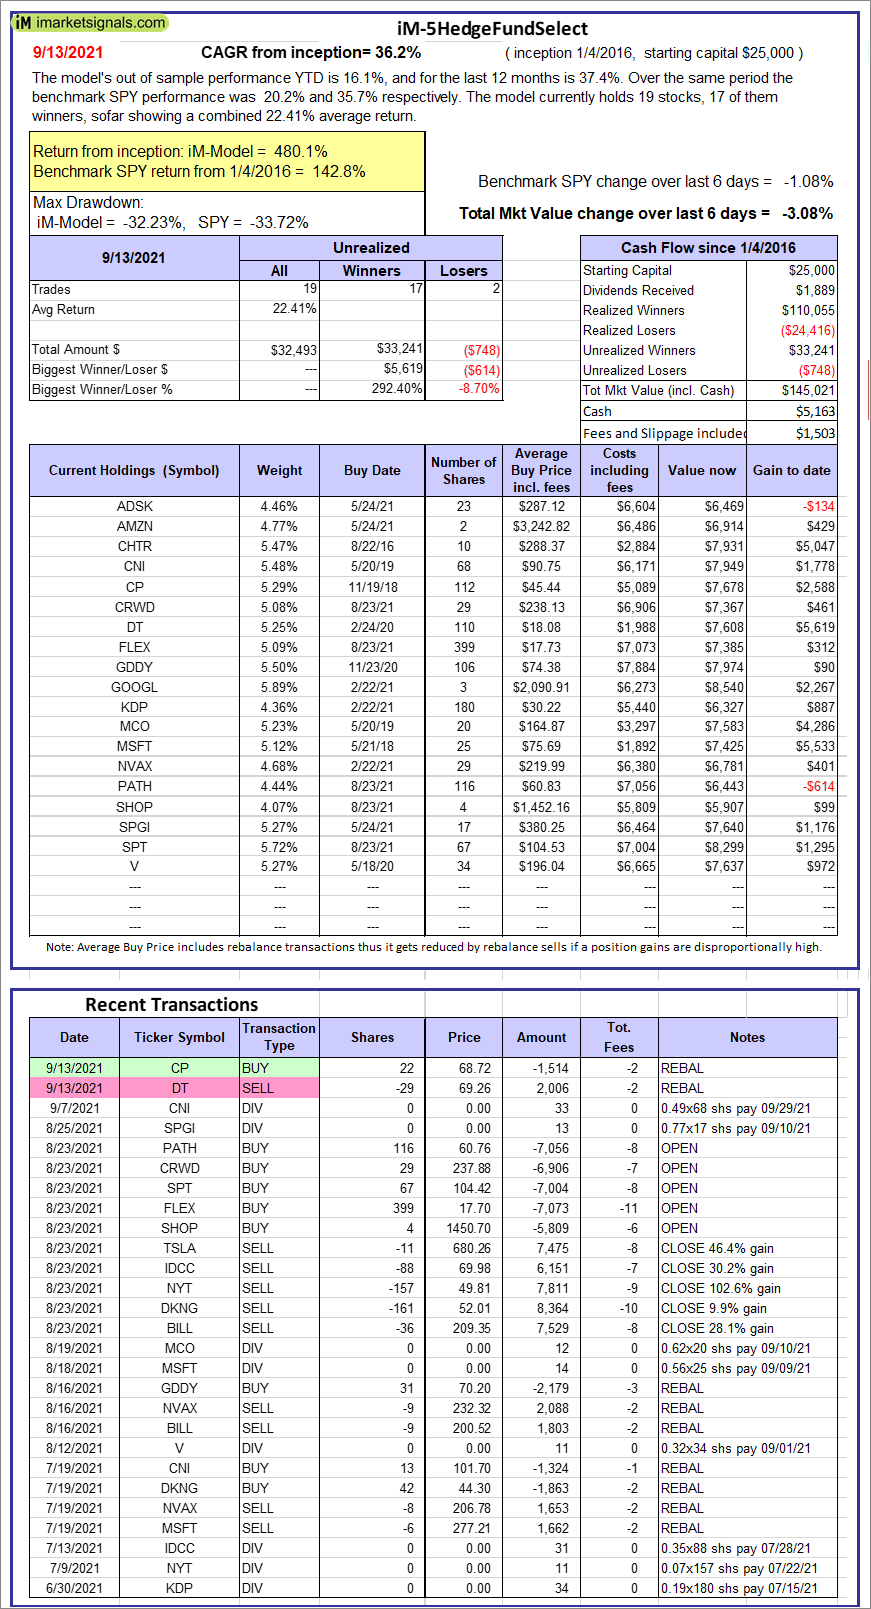 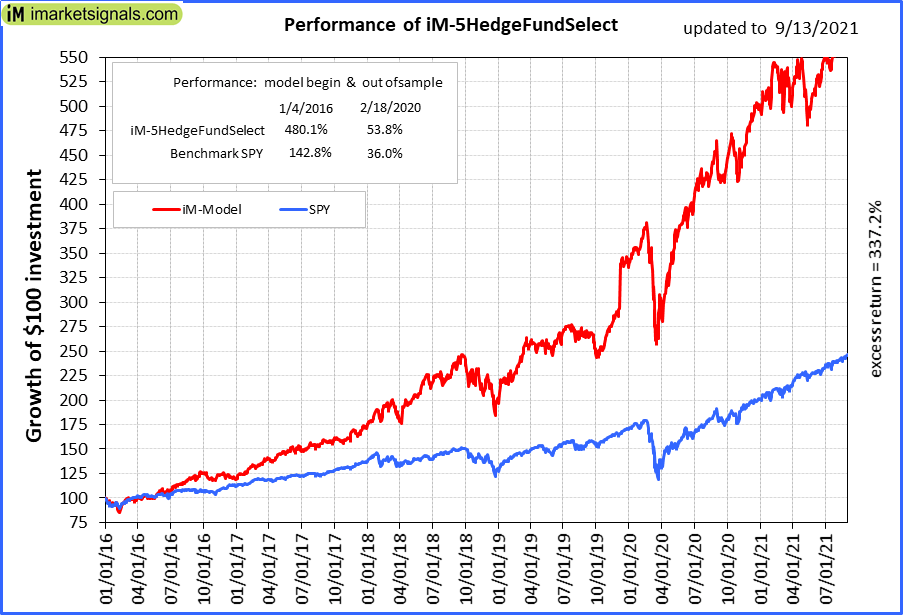 |
iM-5HedgeFundSelect: Since inception, on 1/5/2016, the model gained 480.08% while the benchmark SPY gained 142.84% over the same period. Over the previous week the market value of iM-5HedgeFundSelect gained -3.08% at a time when SPY gained -1.08%. A starting capital of $25,000 at inception on 1/5/2016 would have grown to $145,021 which includes $5,163 cash and excludes $1,503 spent on fees and slippage. |
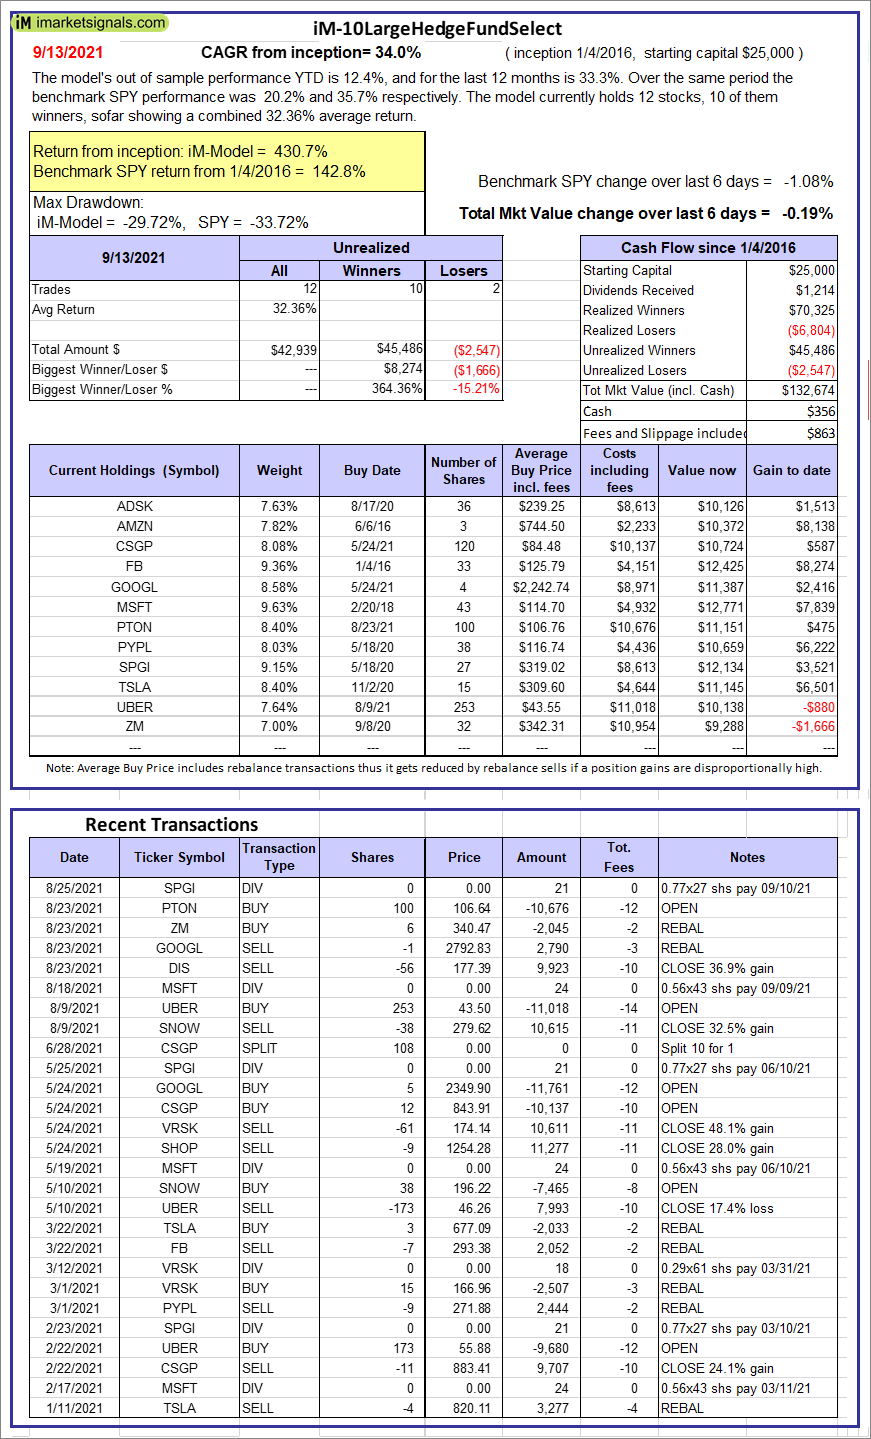  |
iM-10LargeHedgeFundSelect: Since inception, on 1/5/2016, the model gained 430.70% while the benchmark SPY gained 142.84% over the same period. Over the previous week the market value of iM-10LargeHedgeFundSelect gained -0.19% at a time when SPY gained -1.08%. A starting capital of $25,000 at inception on 1/5/2016 would have grown to $132,674 which includes $356 cash and excludes $863 spent on fees and slippage. |
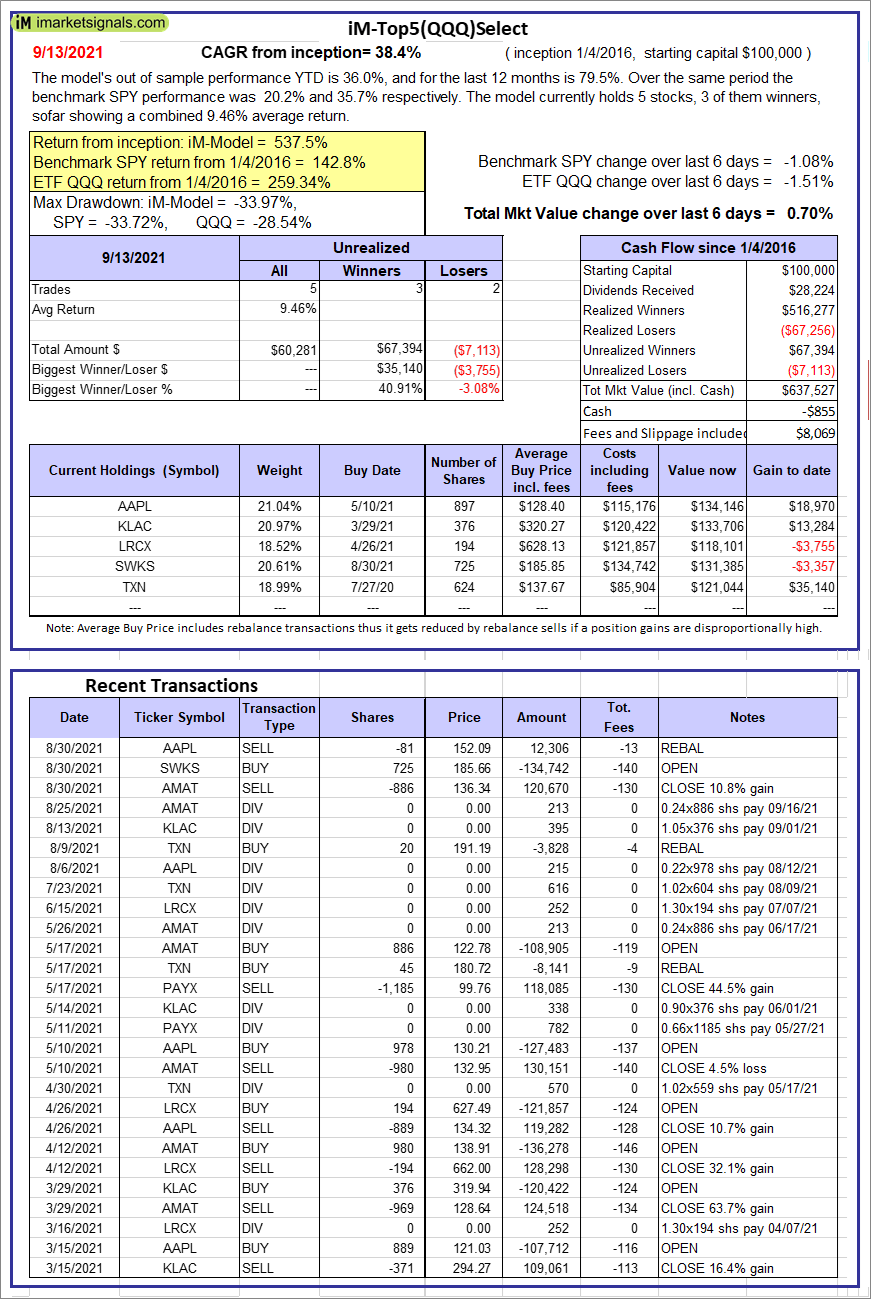 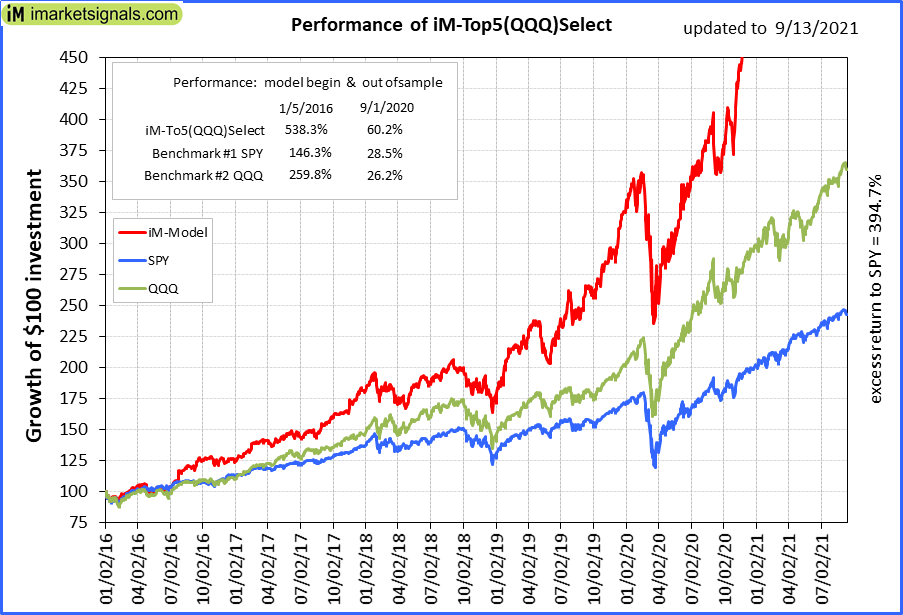 |
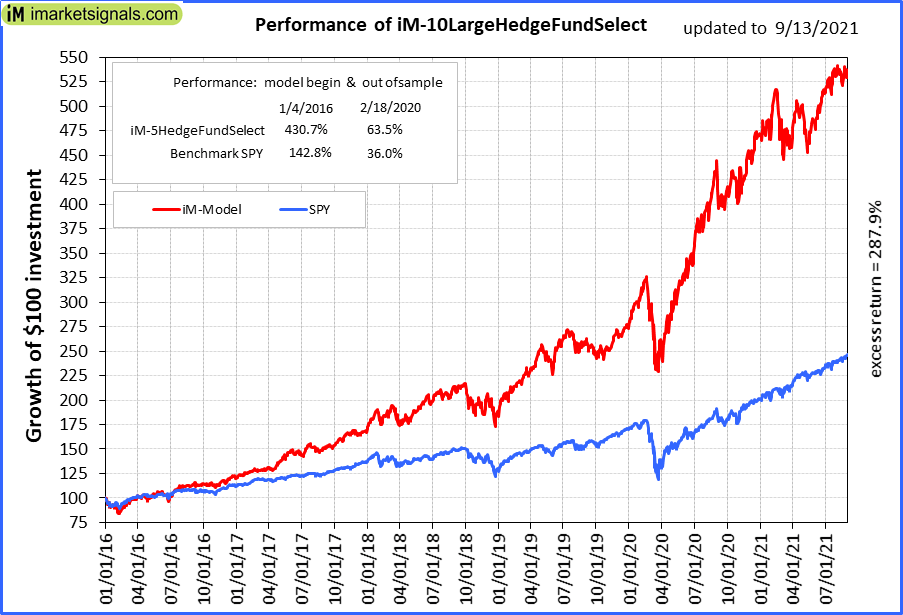
iM-Top5(QQQ)Select: Since inception, on 1/5/2016, the model gained 537.53% while the benchmark SPY gained 142.84% over the same period. Over the previous week the market value of iM-Top5(QQQ)Select gained 0.70% at a time when SPY gained -1.08%. A starting capital of $100,000 at inception on 1/5/2016 would have grown to $637,527 which includes -$855 cash and excludes $8,069 spent on fees and slippage. |
 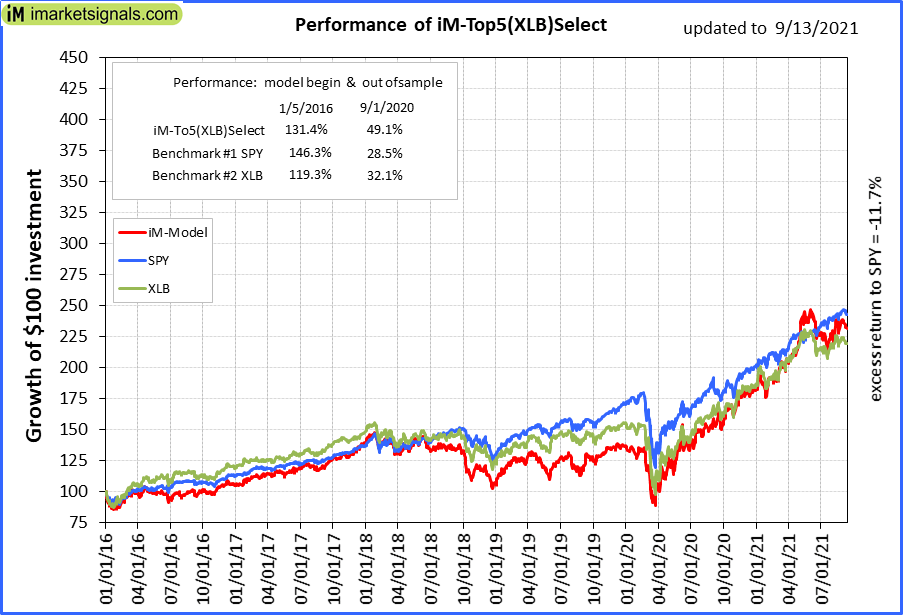 |
iM-Top5(XLB)Select: Since inception, on 1/5/2016, the model gained 131.17% while the benchmark SPY gained 142.84% over the same period. Over the previous week the market value of iM-Top5(XLB)Select gained -1.46% at a time when SPY gained -1.08%. A starting capital of $100,000 at inception on 1/5/2016 would have grown to $231,462 which includes $51 cash and excludes $6,612 spent on fees and slippage. |
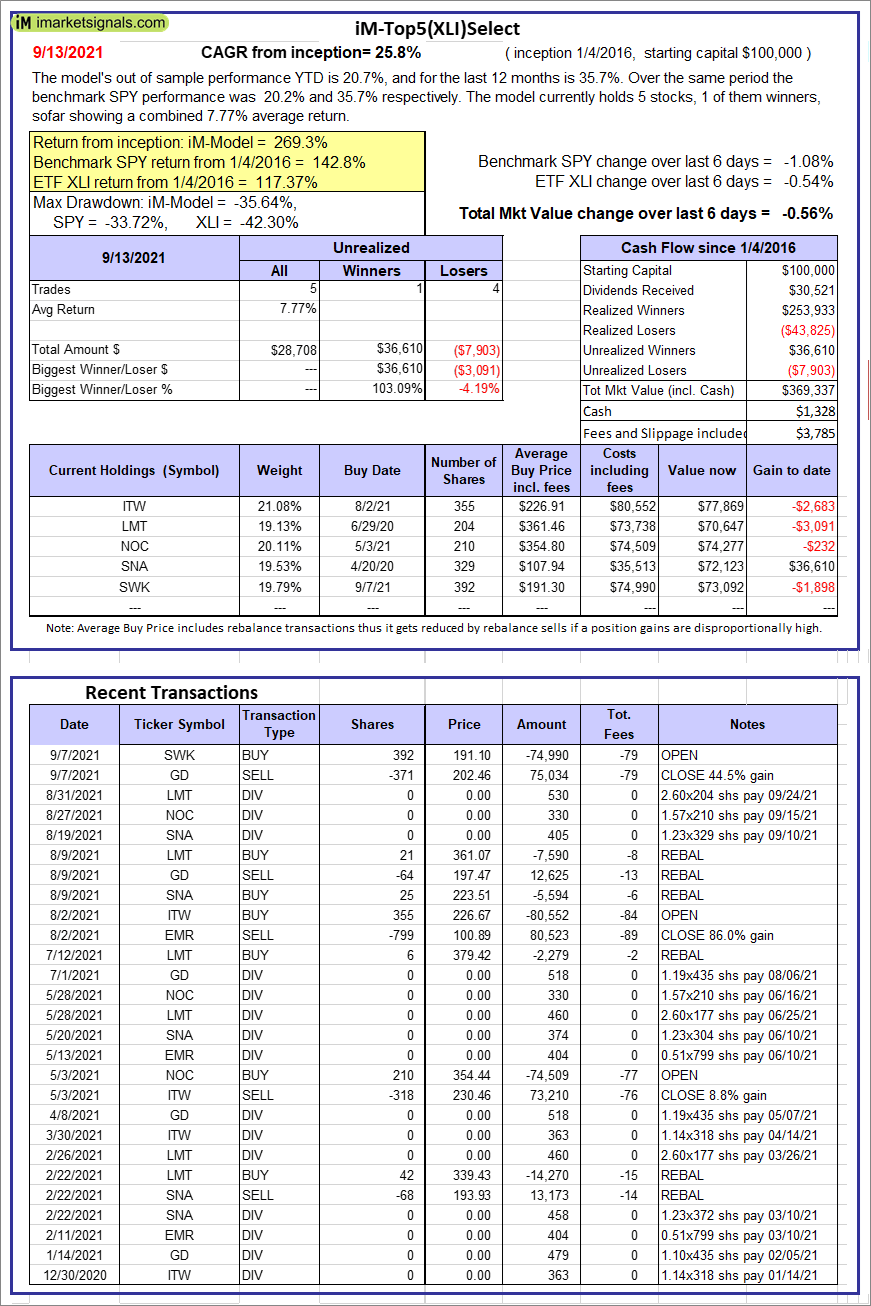 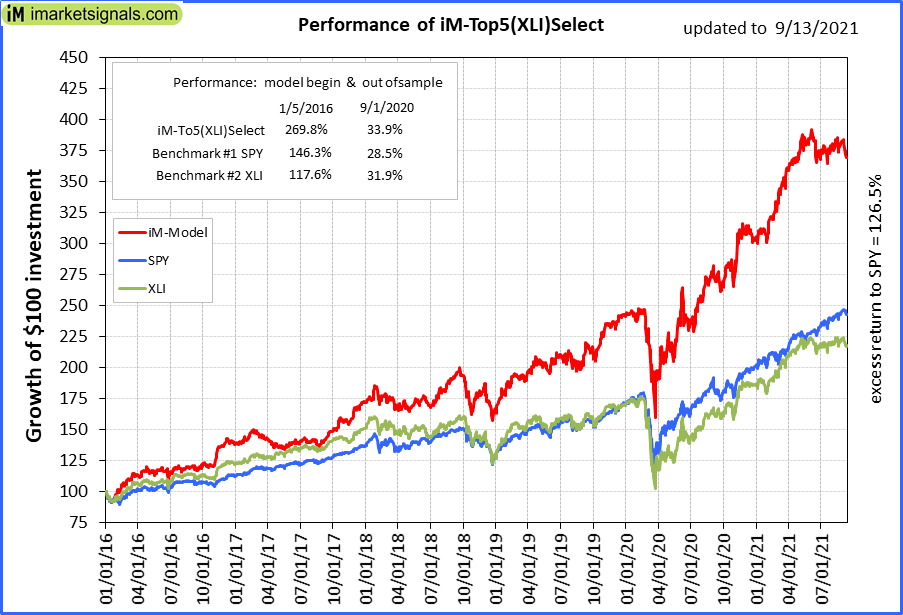 |
iM-Top5(XLI)Select: Since inception, on 1/5/2016, the model gained 269.34% while the benchmark SPY gained 142.84% over the same period. Over the previous week the market value of iM-Top5(XLI)Select gained -0.56% at a time when SPY gained -1.08%. A starting capital of $100,000 at inception on 1/5/2016 would have grown to $369,337 which includes $1,328 cash and excludes $3,785 spent on fees and slippage. |
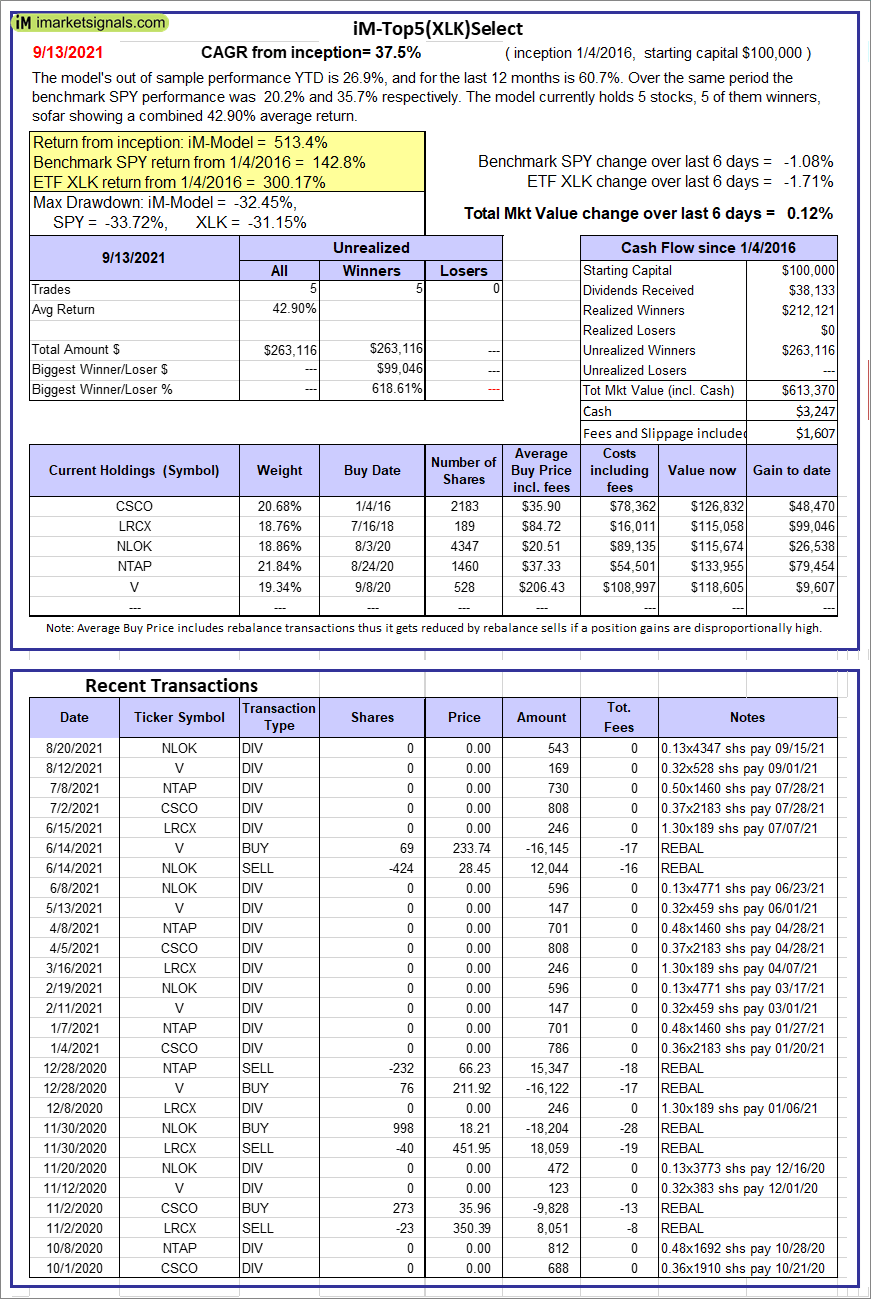 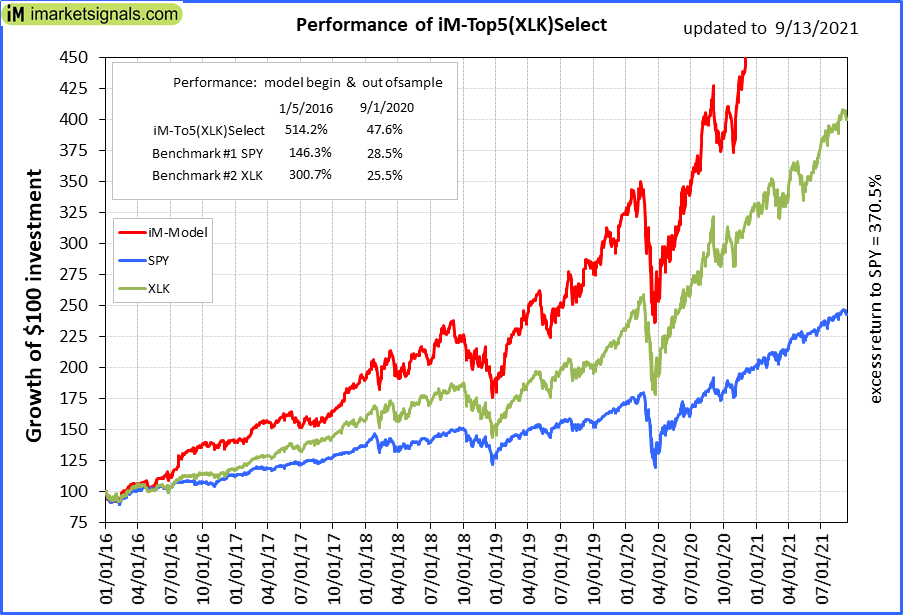 |
iM-Top5(XLK)Select: Since inception, on 1/5/2016, the model gained 513.37% while the benchmark SPY gained 142.84% over the same period. Over the previous week the market value of iM-Top5(XLK)Select gained 0.12% at a time when SPY gained -1.08%. A starting capital of $100,000 at inception on 1/5/2016 would have grown to $613,370 which includes $3,247 cash and excludes $1,607 spent on fees and slippage. |
 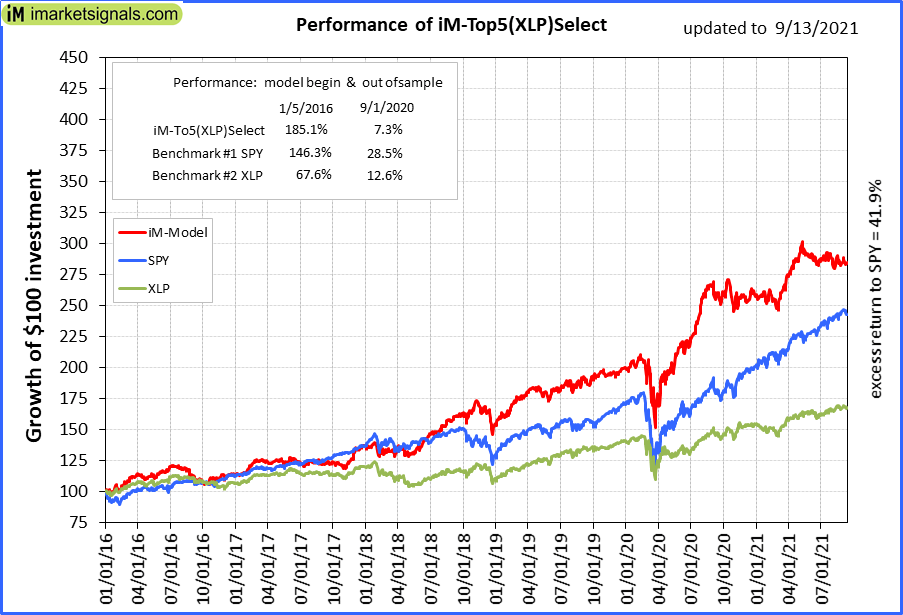 |
iM-Top5(XLP)Select: Since inception, on 1/5/2016, the model gained 184.78% while the benchmark SPY gained 142.84% over the same period. Over the previous week the market value of iM-Top5(XLP)Select gained 0.63% at a time when SPY gained -1.08%. A starting capital of $100,000 at inception on 1/5/2016 would have grown to $284,780 which includes $9 cash and excludes $1,393 spent on fees and slippage. |
 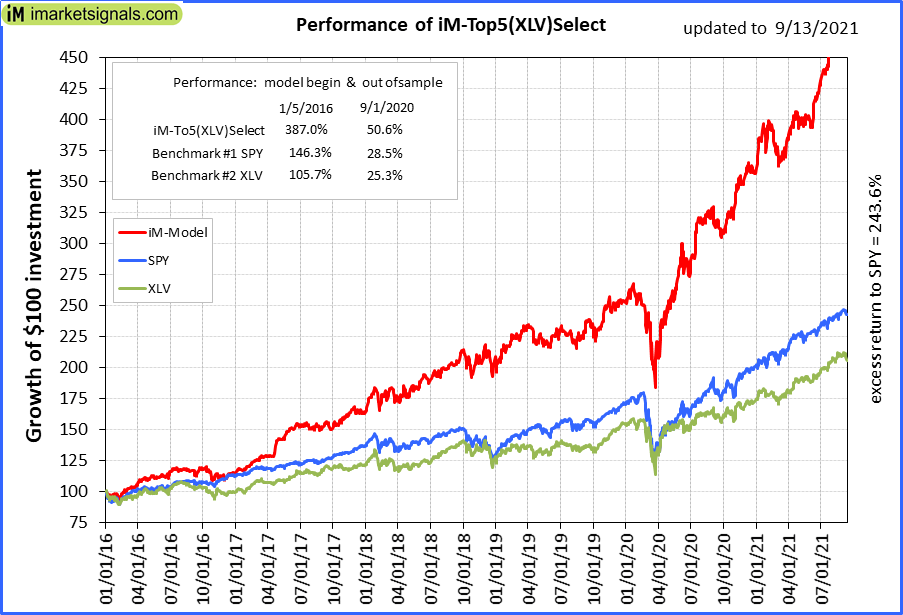 |
iM-Top5(XLV)Select: Since inception, on 1/5/2016, the model gained 386.41% while the benchmark SPY gained 142.84% over the same period. Over the previous week the market value of iM-Top5(XLV)Select gained -2.47% at a time when SPY gained -1.08%. A starting capital of $100,000 at inception on 1/5/2016 would have grown to $487,359 which includes -$1,959 cash and excludes $5,482 spent on fees and slippage. |
 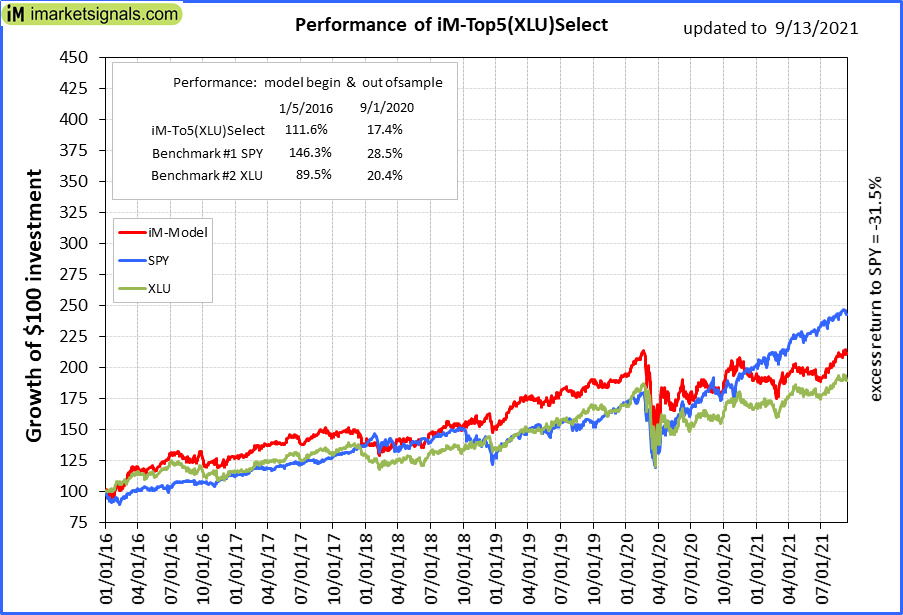 |
iM-Top5(XLU)Select: Since inception, on 1/5/2016, the model gained 111.36% while the benchmark SPY gained 142.84% over the same period. Over the previous week the market value of iM-Top5(XLU)Select gained 0.29% at a time when SPY gained -1.08%. A starting capital of $100,000 at inception on 1/5/2016 would have grown to $211,355 which includes $1,338 cash and excludes $7,786 spent on fees and slippage. |
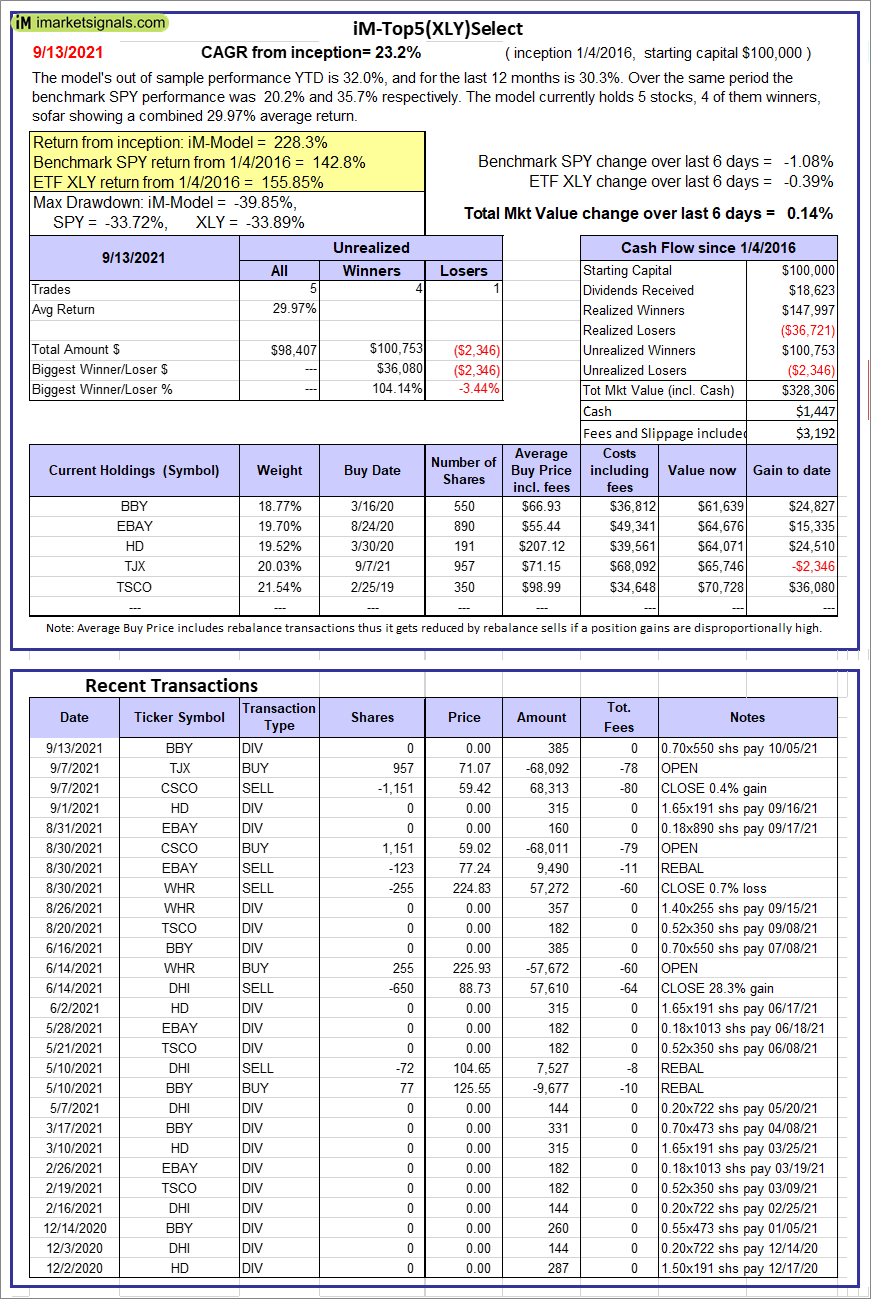 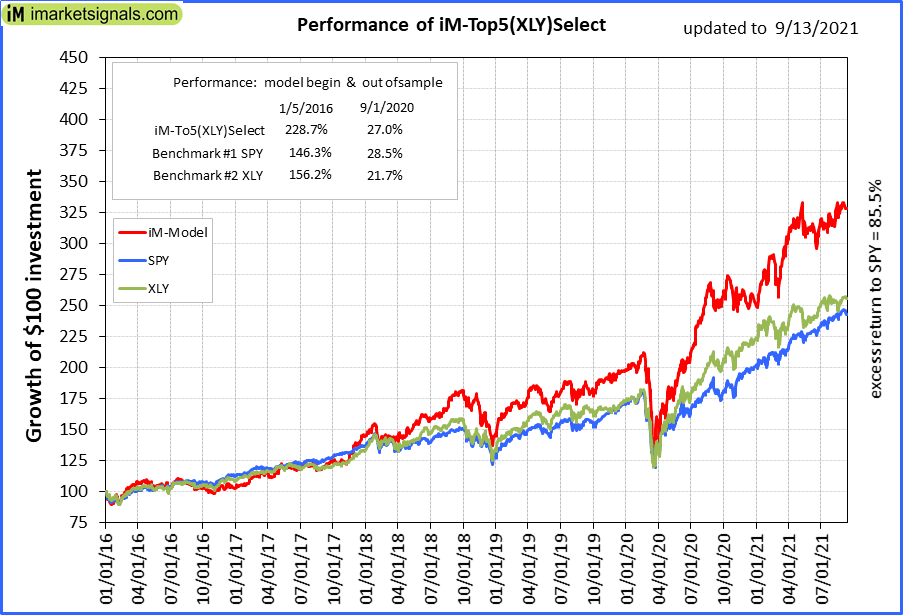 |
iM-Top5(XLY)Select: Since inception, on 1/5/2016, the model gained 228.31% while the benchmark SPY gained 142.84% over the same period. Over the previous week the market value of iM-Top5(XLY)Select gained 0.14% at a time when SPY gained -1.08%. A starting capital of $100,000 at inception on 1/5/2016 would have grown to $328,306 which includes $1,447 cash and excludes $3,192 spent on fees and slippage. |
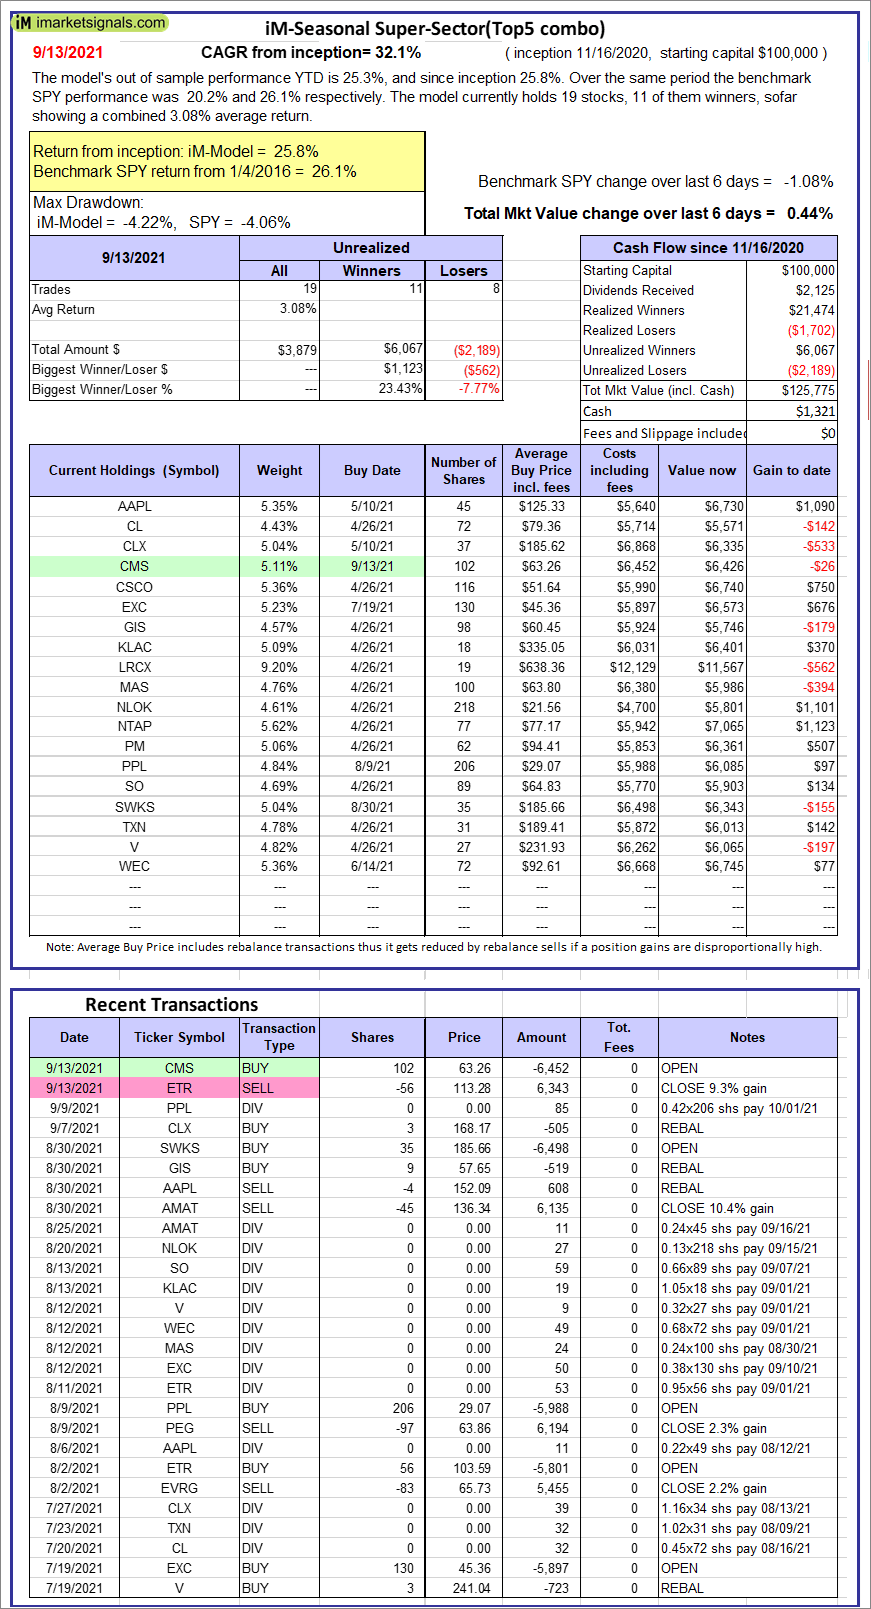 |
iM-Seasonal Super-Sectors (Top5 combo) : Since inception, on 11/17/2020, the model gained 25.78% while the benchmark SPY gained 26.06% over the same period. Over the previous week the market value of iM-Seasonal Super-Sectors (Top5 combo) gained 0.44% at a time when SPY gained -1.08%. A starting capital of $100,000 at inception on 11/17/2020 would have grown to $125,775 which includes $1,321 cash and excludes $00 spent on fees and slippage. |
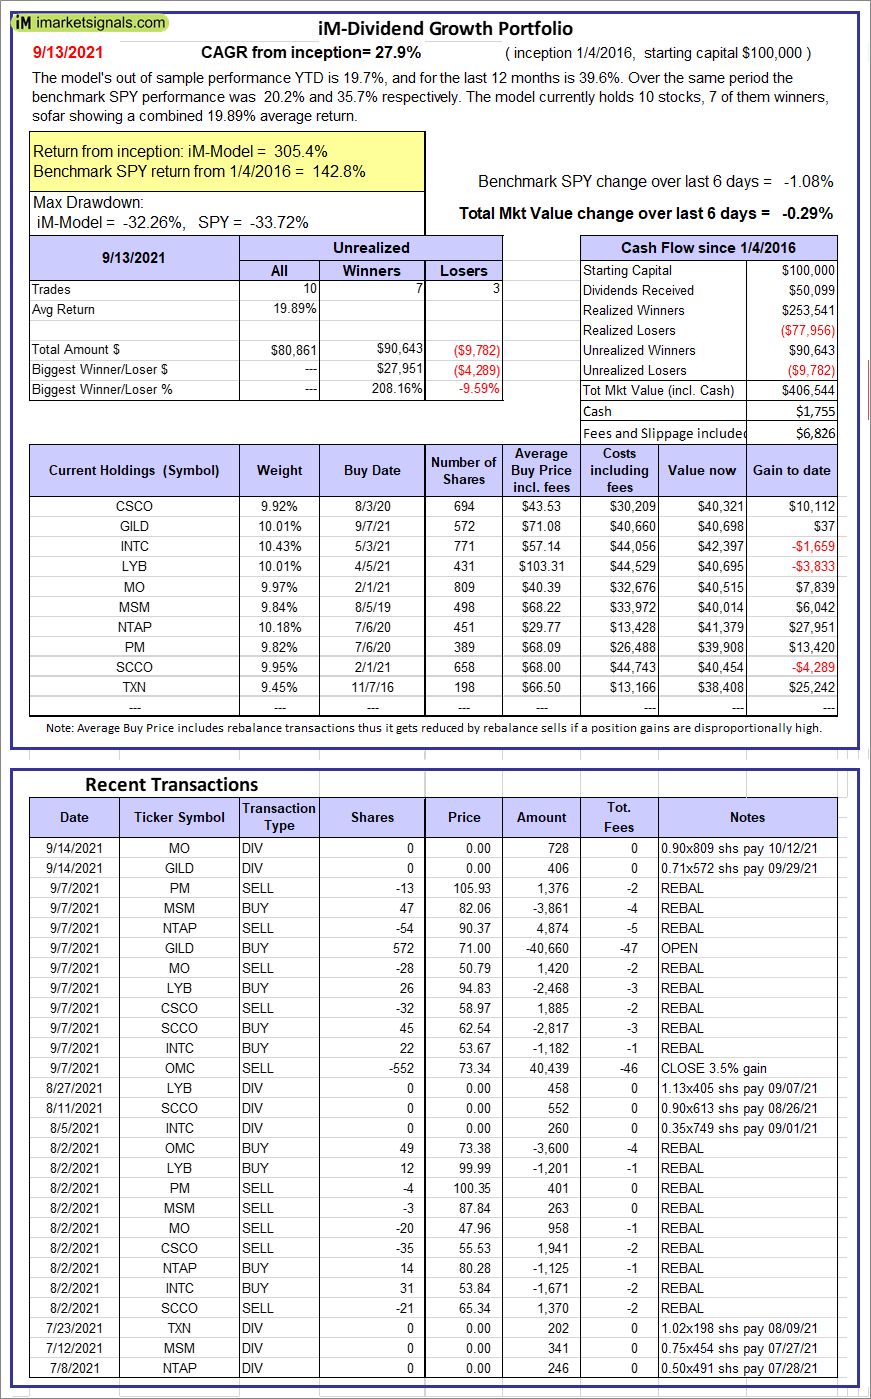 |
iM-Dividend Growth Portfolio: The model’s out of sample performance YTD is 19.7%, and for the last 12 months is 39.6%. Over the same period the benchmark SPY performance was 20.2% and 35.7% respectively. Over the previous week the market value of the iM-Dividend Growth Portfolio gained -0.29% at a time when SPY gained -1.08%. A starting capital of $100,000 at inception on 6/30/2016 would have grown to $406,544 which includes $1,755 cash and excludes $6,826 spent on fees and slippage. |
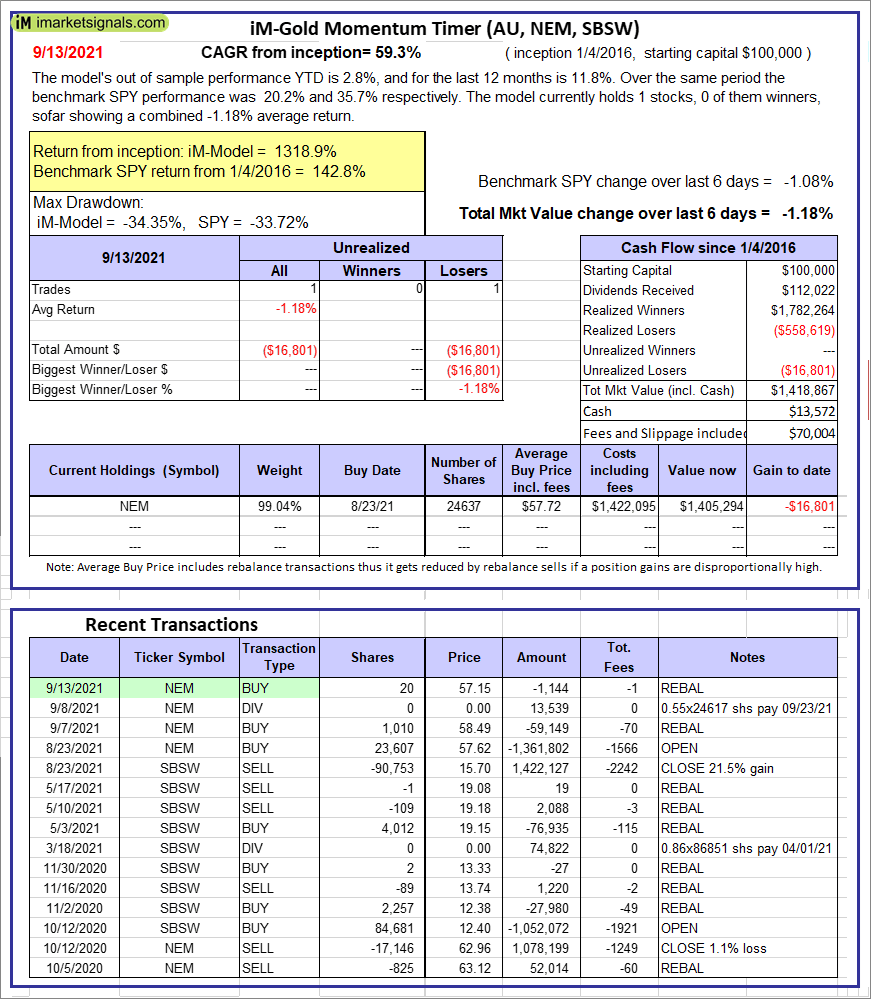 |
iM-Gold Momentum Timer (AU, NEM, SBSW): The model’s out of sample performance YTD is 2.8%, and for the last 12 months is 11.8%. Over the same period the benchmark SPY performance was 20.2% and 35.7% respectively. Over the previous week the market value of iM-Gold Momentum Timer (AU, NEM, SBSW) gained -1.18% at a time when SPY gained -1.08%. A starting capital of $100,000 at inception on 6/30/2016 would have grown to $13,572 which includes $70,004 cash and excludes Gain to date spent on fees and slippage. |
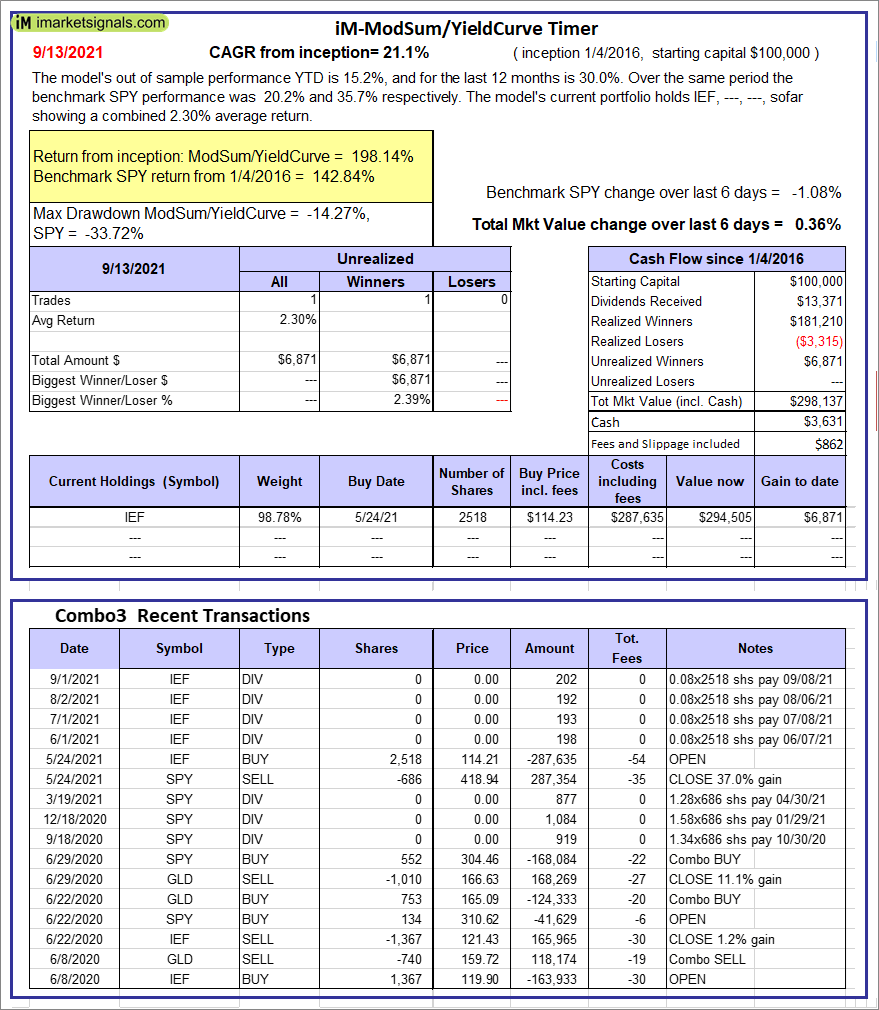 |
iM-ModSum/YieldCurve Timer: The model’s out of sample performance YTD is 15.2%, and for the last 12 months is 30.0%. Over the same period the benchmark SPY performance was 20.2% and 35.7% respectively. Over the previous week the market value of iM-PortSum/YieldCurve Timer gained 0.36% at a time when SPY gained -1.08%. A starting capital of $100,000 at inception on 1/1/2016 would have grown to $298,137 which includes $3,631 cash and excludes $862 spent on fees and slippage. |
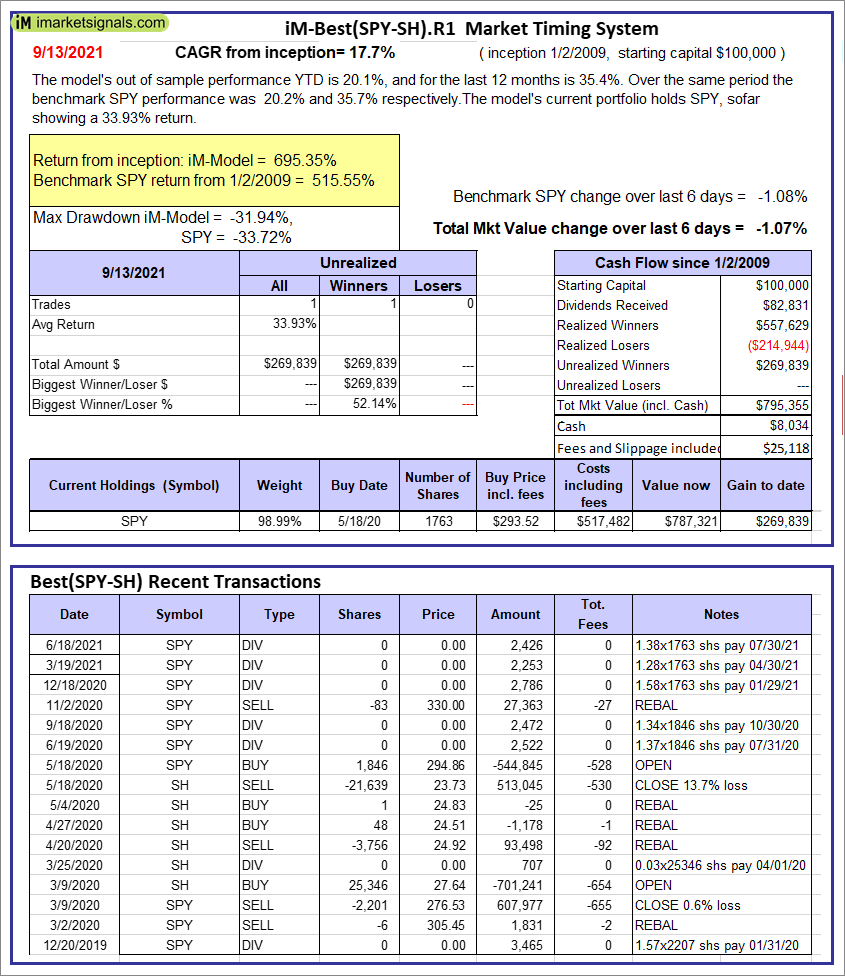 |
iM-Best(SPY-SH).R1: The model’s out of sample performance YTD is 20.1%, and for the last 12 months is 35.4%. Over the same period the benchmark SPY performance was 20.2% and 35.7% respectively. Over the previous week the market value of Best(SPY-SH) gained -1.07% at a time when SPY gained -1.08%. A starting capital of $100,000 at inception on 1/2/2009 would have grown to $795,355 which includes $8,034 cash and excludes $25,118 spent on fees and slippage. |
 |
iM-Combo3.R1: The model’s out of sample performance YTD is 12.6%, and for the last 12 months is 27.5%. Over the same period the benchmark SPY performance was 20.2% and 35.7% respectively. Over the previous week the market value of iM-Combo3.R1 gained -1.65% at a time when SPY gained -1.08%. A starting capital of $100,000 at inception on 2/3/2014 would have grown to $193,429 which includes $3,592 cash and excludes $7,165 spent on fees and slippage. |
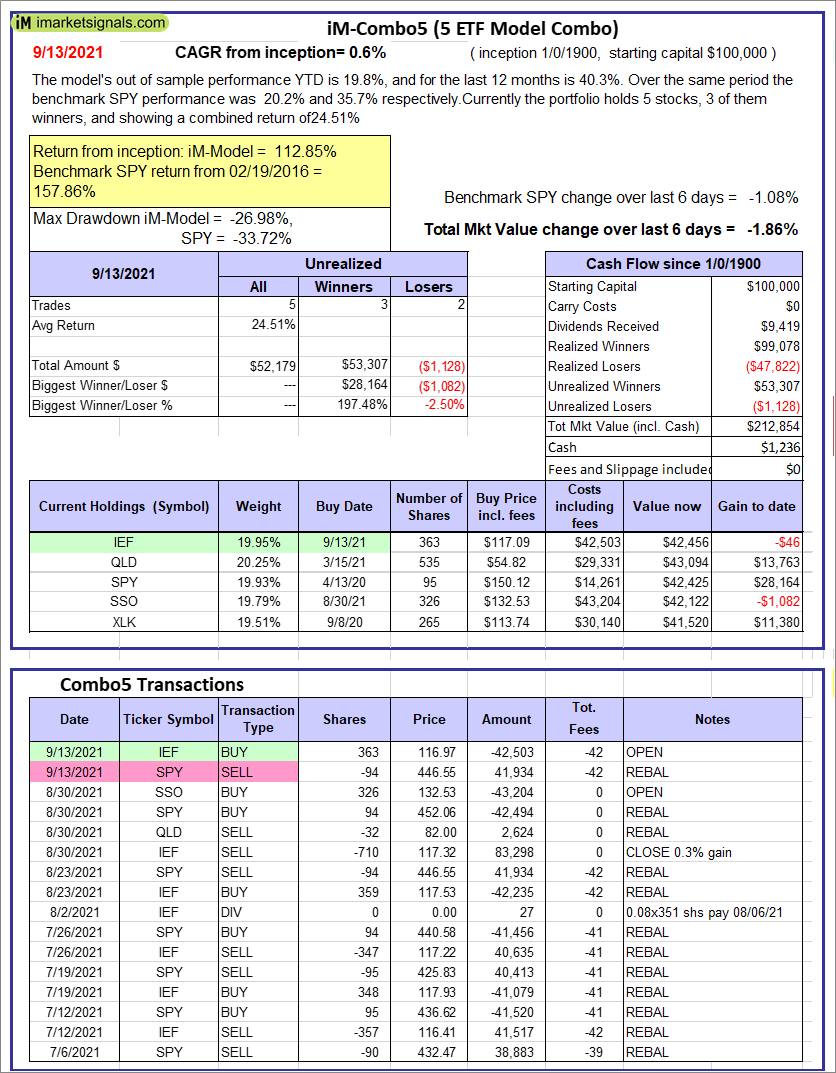 |
iM-Combo5: The model’s out of sample performance YTD is 19.8%, and for the last 12 months is 40.3%. Over the same period the benchmark SPY performance was 20.2% and 35.7% respectively. Over the previous week the market value of iM-Combo5 gained -1.86% at a time when SPY gained -1.08%. A starting capital of $100,000 at inception on 2/22/2016 would have grown to $212,854 which includes $1,236 cash and excludes $0 spent on fees and slippage. |
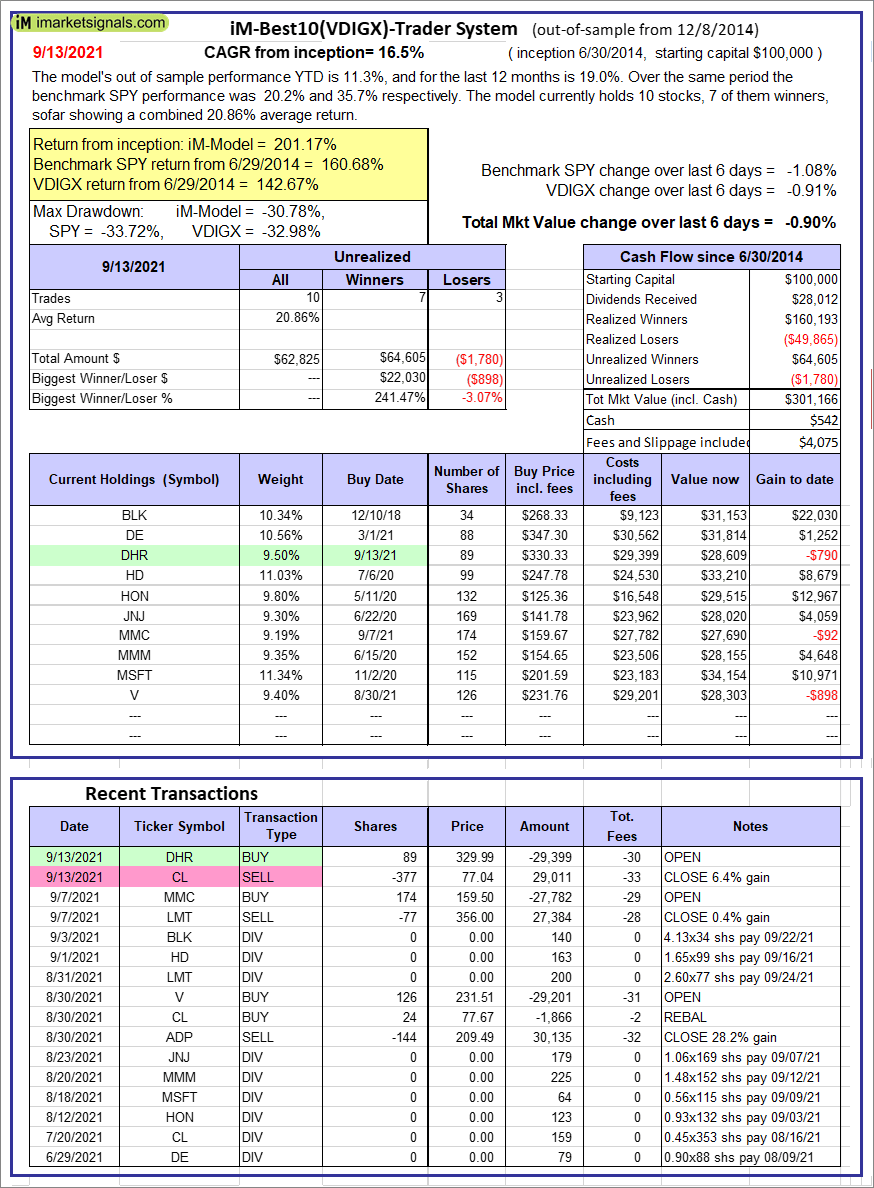  |
iM-Best10(VDIGX)-Trader: The model’s out of sample performance YTD is 11.3%, and for the last 12 months is 19.0%. Over the same period the benchmark SPY performance was 20.2% and 35.7% respectively. Since inception, on 7/1/2014, the model gained 201.17% while the benchmark SPY gained 160.68% and VDIGX gained 142.67% over the same period. Over the previous week the market value of iM-Best10(VDIGX) gained -0.90% at a time when SPY gained -1.08%. A starting capital of $100,000 at inception on 7/1/2014 would have grown to $301,166 which includes $542 cash and excludes $4,075 spent on fees and slippage. |
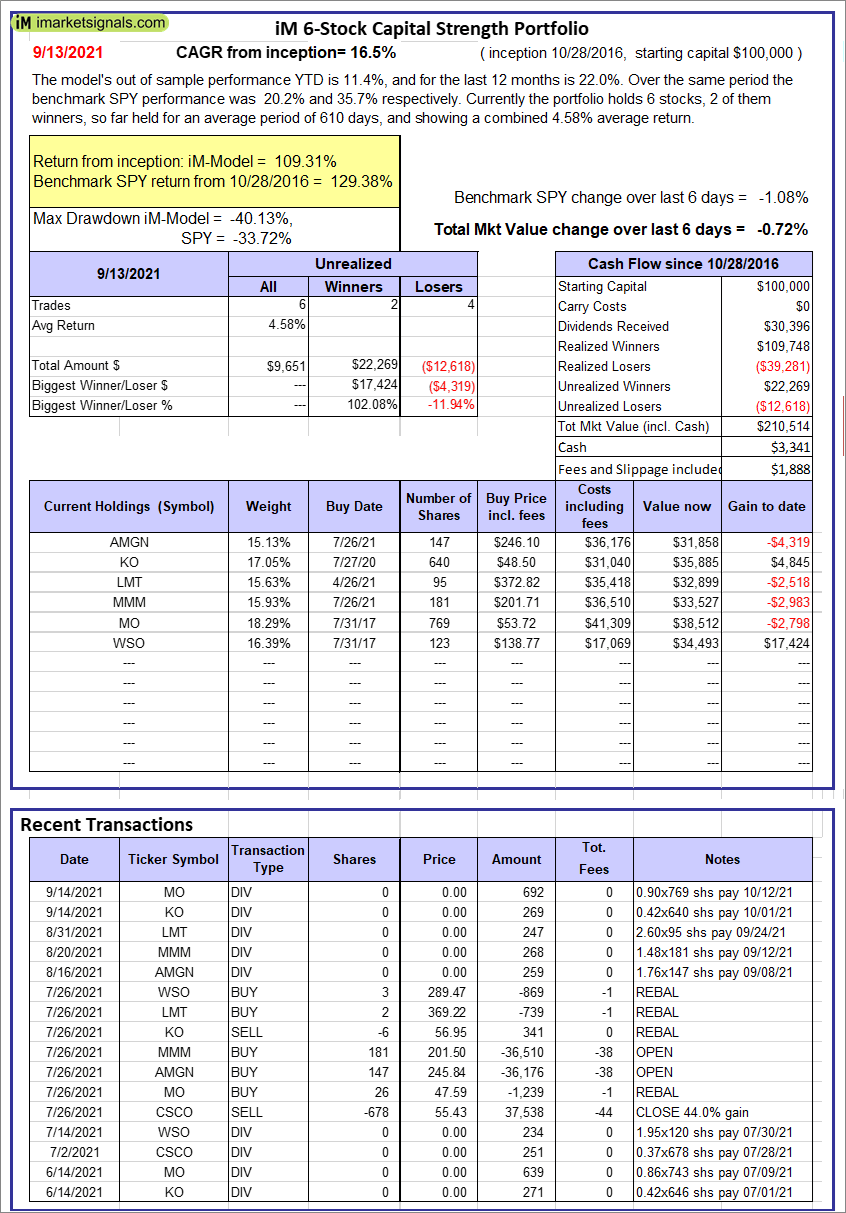 |
iM 6-Stock Capital Strength Portfolio: The model’s out of sample performance YTD is 11.4%, and for the last 12 months is 22.0%. Over the same period the benchmark SPY performance was 20.2% and 35.7% respectively. Over the previous week the market value of the iM 6-Stock Capital Strength Portfolio gained -0.72% at a time when SPY gained -1.08%. A starting capital of $100,000 at inception on 10/28/2016 would have grown to $210,514 which includes $3,341 cash and excludes $1,888 spent on fees and slippage. |
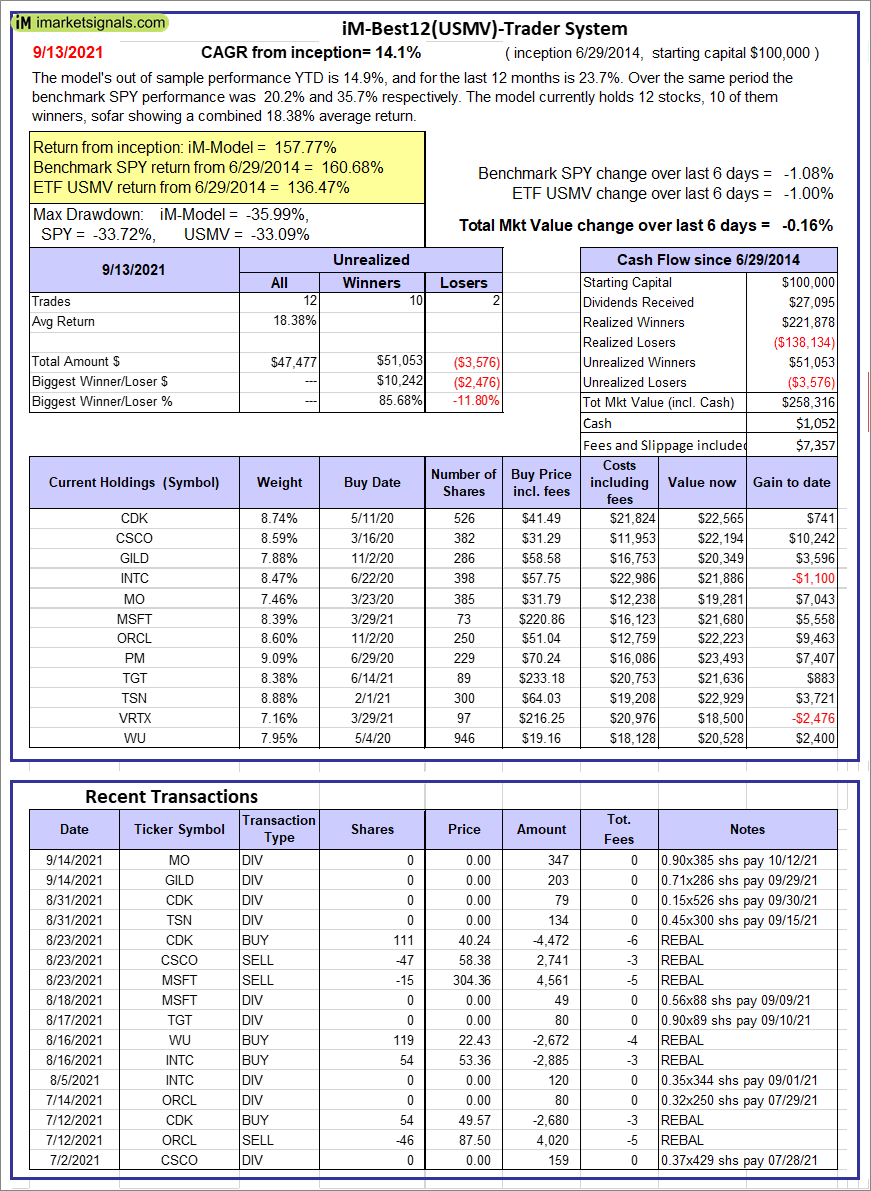 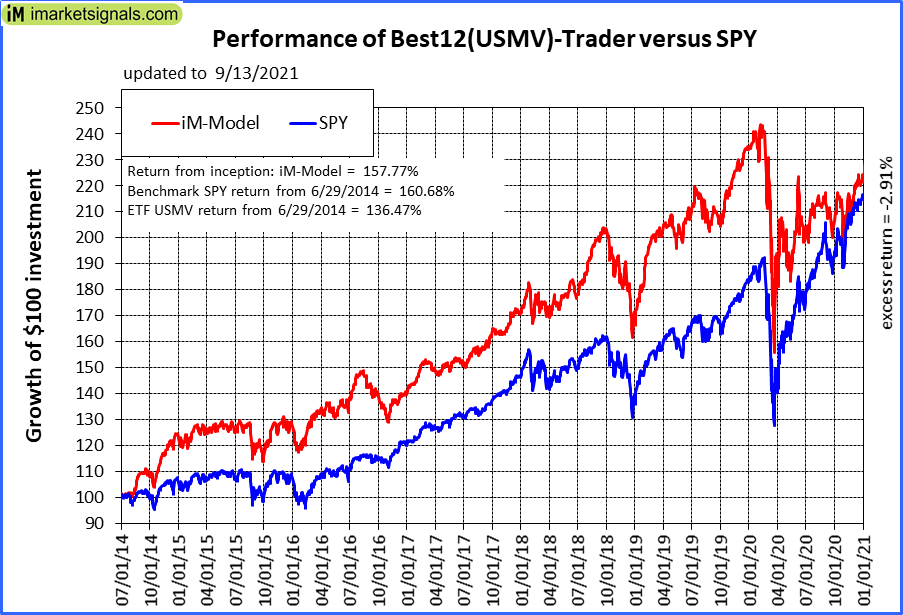 |
iM-Best12(USMV)-Trader: The model’s out of sample performance YTD is 14.9%, and for the last 12 months is 23.7%. Over the same period the benchmark SPY performance was 20.2% and 35.7% respectively. Since inception, on 6/30/2014, the model gained 157.77% while the benchmark SPY gained 160.68% and the ETF USMV gained 136.47% over the same period. Over the previous week the market value of iM-Best12(USMV)-Trader gained -0.16% at a time when SPY gained -1.08%. A starting capital of $100,000 at inception on 6/30/2014 would have grown to $258,316 which includes $1,052 cash and excludes $7,357 spent on fees and slippage. |
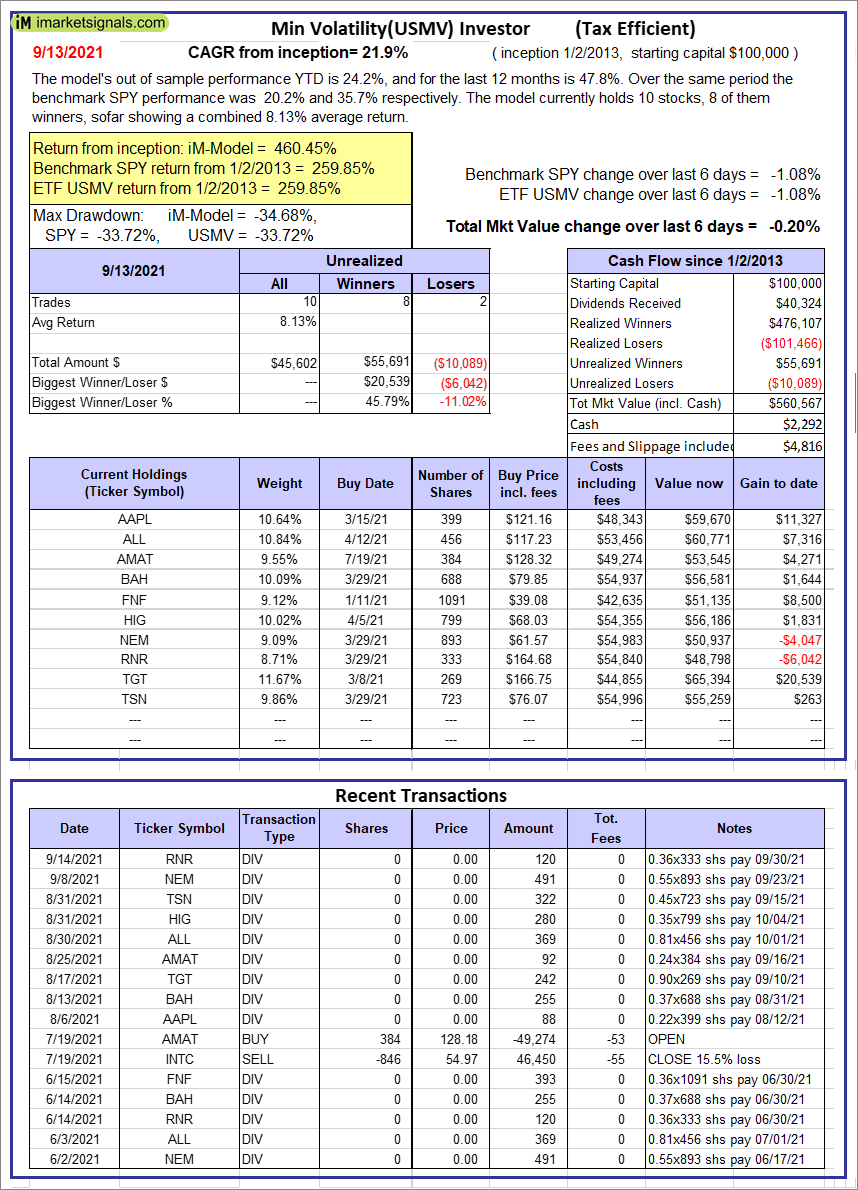  |
iM-Min Volatility(USMV) Investor (Tax Efficient): The model’s out of sample performance YTD is 24.2%, and for the last 12 months is 47.8%. Over the same period the benchmark SPY performance was 20.2% and 35.7% respectively. Since inception, on 1/3/2013, the model gained 460.45% while the benchmark SPY gained 259.85% and the ETF USMV gained 259.85% over the same period. Over the previous week the market value of iM-Best12(USMV)Q1 gained -0.20% at a time when SPY gained -1.08%. A starting capital of $100,000 at inception on 1/3/2013 would have grown to $560,567 which includes $2,292 cash and excludes $4,816 spent on fees and slippage. |
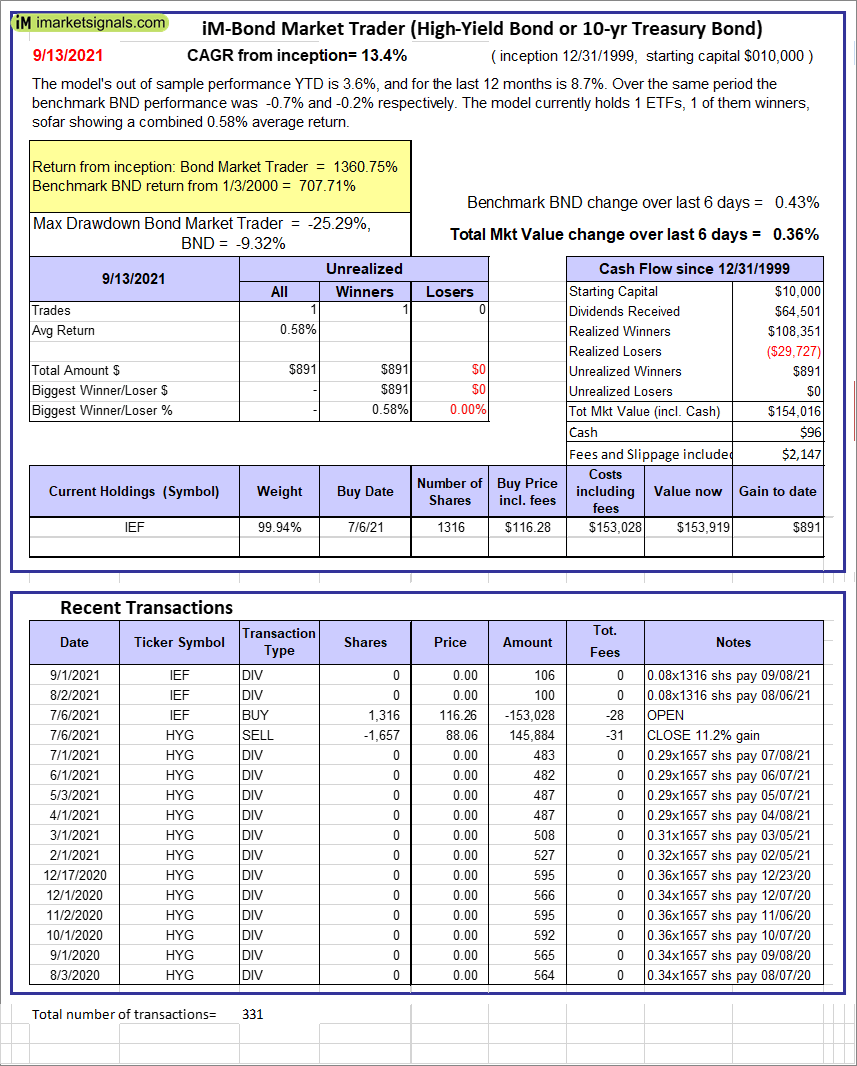 |
iM-Bond Market Trader (High-Yield Bond or 10-yr Treasury Bond): The model’s out of sample performance YTD is 3.6%, and for the last 12 months is 8.7%. Over the same period the benchmark BND performance was -0.7% and -0.2% respectively. Over the previous week the market value of the iM-Bond Market Trader (High-Yield Bond or 10-yr Treasury Bond) gained 0.36% at a time when BND gained 0.43%. A starting capital of $10,000 at inception on 1/3/2000 would have grown to $154,016 which includes $96 cash and excludes $2,147 spent on fees and slippage. |
|
|
iM-ModSum/YieldCurve Timer: The model’s out of sample performance YTD is 15.2%, and for the last 12 months is 30.0%. Over the same period the benchmark SPY performance was 20.2% and 35.7% respectively. Over the previous week the market value of iM-PortSum/YieldCurve Timer gained 0.36% at a time when SPY gained -1.08%. A starting capital of $100,000 at inception on 1/1/2016 would have grown to $298,137 which includes $3,631 cash and excludes $862 spent on fees and slippage. |
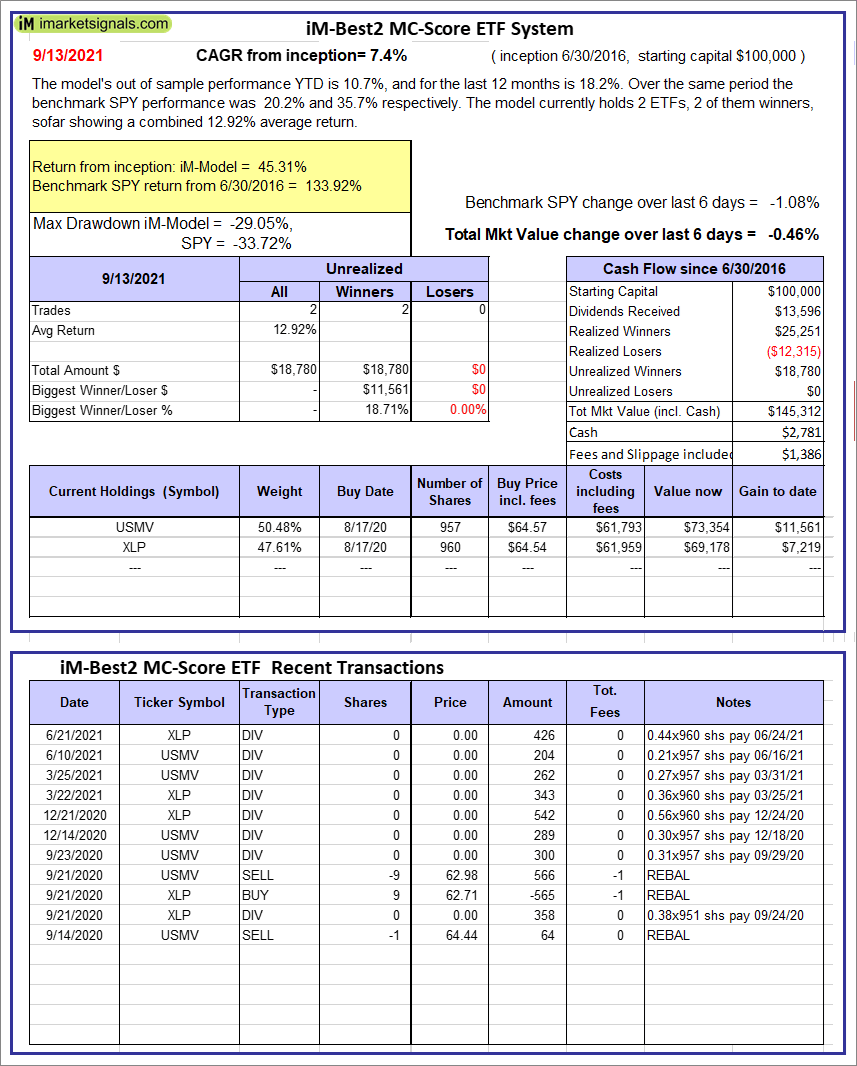 |
iM-Best2 MC-Score ETF System: The model’s out of sample performance YTD is 10.7%, and for the last 12 months is 18.2%. Over the same period the benchmark SPY performance was 20.2% and 35.7% respectively. Over the previous week the market value of the iM-Best2 MC-Score ETF System gained -0.46% at a time when SPY gained -1.08%. A starting capital of $100,000 at inception on 6/30/2016 would have grown to $145,312 which includes $2,781 cash and excludes $1,386 spent on fees and slippage. |
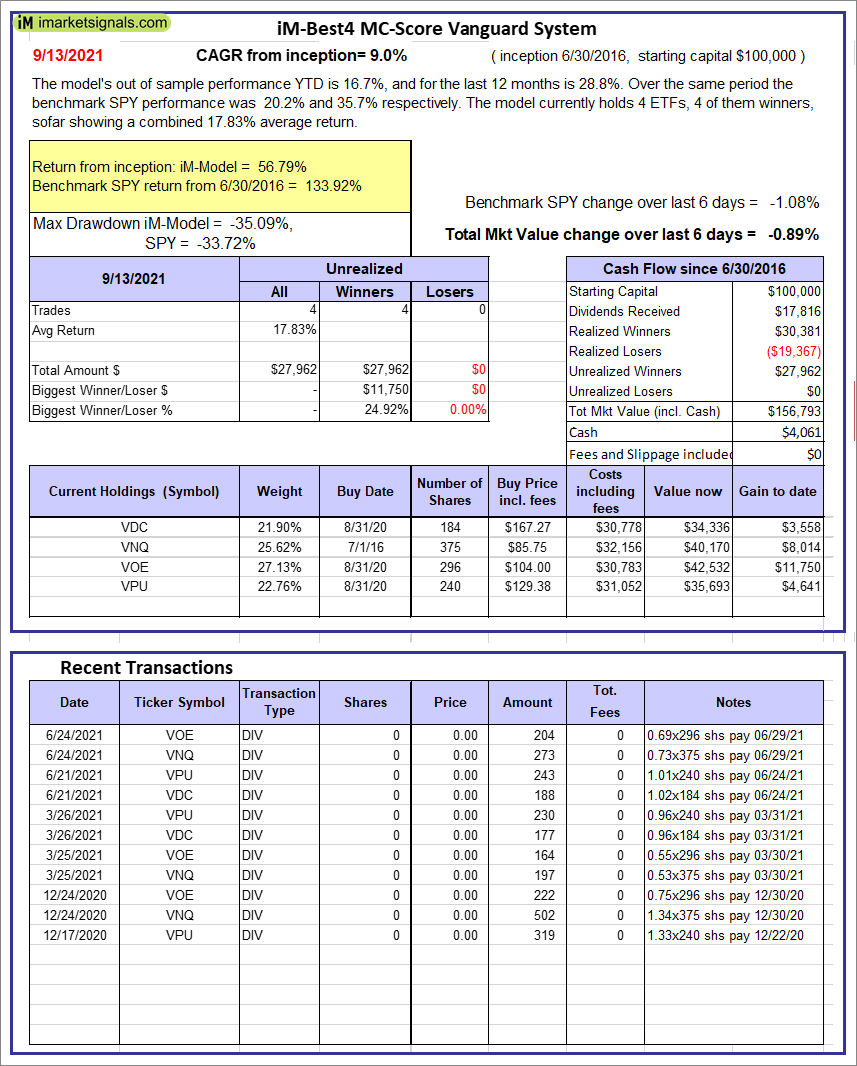 |
iM-Best4 MC-Score Vanguard System: The model’s out of sample performance YTD is 16.7%, and for the last 12 months is 28.8%. Over the same period the benchmark SPY performance was 20.2% and 35.7% respectively. Over the previous week the market value of the iM-Best4 MC-Score Vanguard System gained -0.89% at a time when SPY gained -1.08%. A starting capital of $100,000 at inception on 6/30/2016 would have grown to $156,793 which includes $4,061 cash and excludes $00 spent on fees and slippage. |
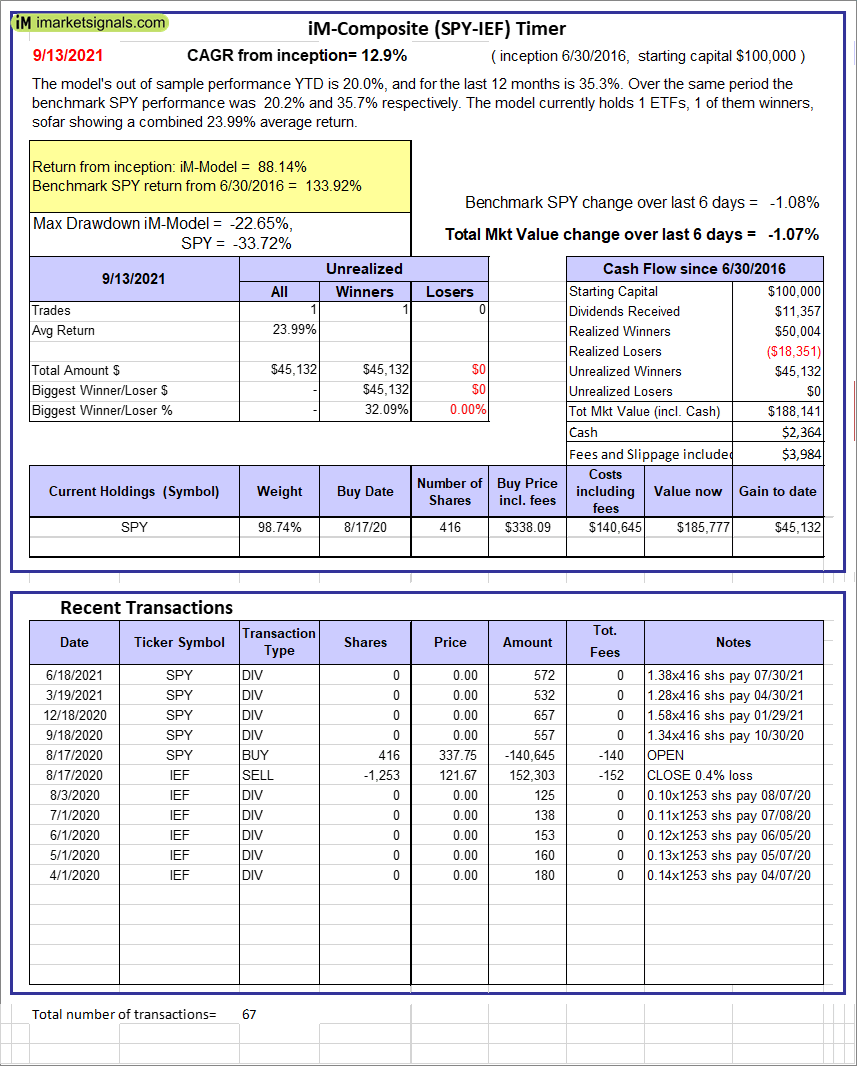 |
iM-Composite (SPY-IEF) Timer: The model’s out of sample performance YTD is 20.0%, and for the last 12 months is 35.3%. Over the same period the benchmark SPY performance was 20.2% and 35.7% respectively. Over the previous week the market value of the iM-Composite (SPY-IEF) Timer gained -1.07% at a time when SPY gained -1.08%. A starting capital of $100,000 at inception on 6/30/2016 would have grown to $188,141 which includes $2,364 cash and excludes $3,984 spent on fees and slippage. |
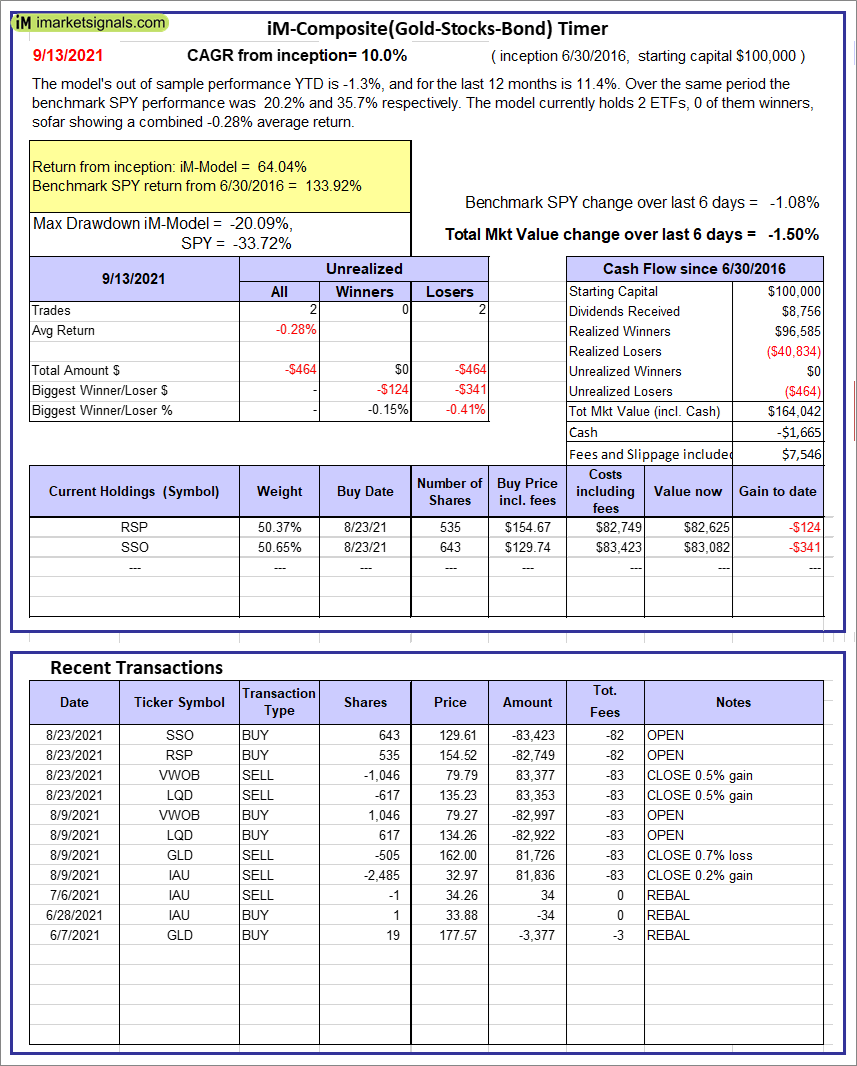 |
iM-Composite(Gold-Stocks-Bond) Timer: The model’s out of sample performance YTD is -1.3%, and for the last 12 months is 11.4%. Over the same period the benchmark SPY performance was 20.2% and 35.7% respectively. Over the previous week the market value of the iM-Composite(Gold-Stocks-Bond) Timer gained -1.50% at a time when SPY gained -1.08%. A starting capital of $100,000 at inception on 6/30/2016 would have grown to $164,042 which includes -$1,665 cash and excludes $7,546 spent on fees and slippage. |
iM-Best Reports – 9/13/21
Posted in pmp SPY-SH
Leave a Reply
You must be logged in to post a comment.