  |
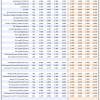
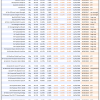
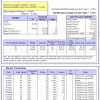
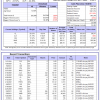
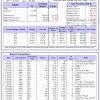
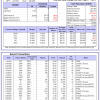
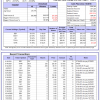
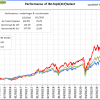
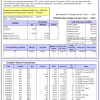
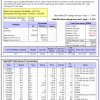
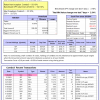
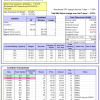
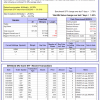
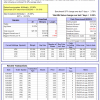
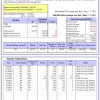
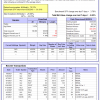
Out of sample performance summary of our models for the past 1, 2, 4 and 13 week periods. The active active return indicates how the models over- or underperformed the benchmark ETF SPY. Also the YTD, and the 1-, 3-, 5- and 10-year annualized returns are shown in the second table |
|
|
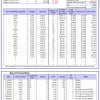
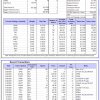
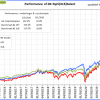
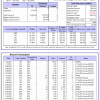
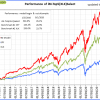
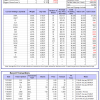
iM-FlipSaver 60:40 | 20:80 – 2017: The model’s out of sample performance YTD is 12.5%, and for the last 12 months is 24.1%. Over the same period the benchmark E60B40 performance was 10.6% and 22.0% respectively. Over the previous week the market value of iM-FlipSaver 80:20 | 20:80 gained 2.85% at a time when SPY gained 2.10%. A starting capital of $100,000 at inception on 7/16/2015 would have grown to $155,278 which includes $992 cash and excludes $1,784 spent on fees and slippage. |
|
|
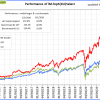
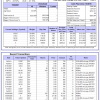
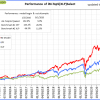
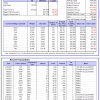
iM-FlipSaver 70:30 | 20:80 – 2017: The model’s out of sample performance YTD is 13.9%, and for the last 12 months is 26.9%. Over the same period the benchmark E60B40 performance was 10.6% and 22.0% respectively. Over the previous week the market value of iM-FlipSaver 70:30 | 20:80 gained 3.14% at a time when SPY gained 2.10%. A starting capital of $100,000 at inception on 7/15/2015 would have grown to $159,616 which includes $638 cash and excludes $1,919 spent on fees and slippage. |
|
|
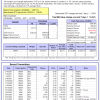
iM-FlipSaver 80:20 | 20:80 – 2017: The model’s out of sample performance YTD is 15.2%, and for the last 12 months is 29.7%. Over the same period the benchmark E60B40 performance was 10.6% and 22.0% respectively. Over the previous week the market value of iM-FlipSaver 80:20 | 20:80 gained 3.41% at a time when SPY gained 2.10%. A starting capital of $100,000 at inception on 1/2/2017 would have grown to $163,842 which includes $692 cash and excludes $2,047 spent on fees and slippage. |
|
|
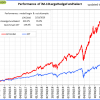
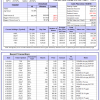
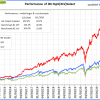
iM-5HedgeFundSelect: Since inception, on 1/5/2016, the model gained 456.97% while the benchmark SPY gained 139.82% over the same period. Over the previous week the market value of iM-5HedgeFundSelect gained 3.63% at a time when SPY gained 3.78%. A starting capital of $25,000 at inception on 1/5/2016 would have grown to $139,242 which includes -$608 cash and excludes $1,410 spent on fees and slippage. |
|
|
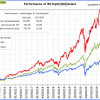
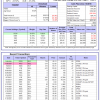
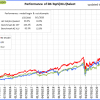
iM-10LargeHedgeFundSelect: Since inception, on 1/5/2016, the model gained 438.23% while the benchmark SPY gained 139.82% over the same period. Over the previous week the market value of iM-10LargeHedgeFundSelect gained 5.17% at a time when SPY gained 3.78%. A starting capital of $25,000 at inception on 1/5/2016 would have grown to $134,558 which includes $722 cash and excludes $812 spent on fees and slippage. |
|
|
iM-Top5(QQQ)Select: Since inception, on 1/5/2016, the model gained 530.07% while the benchmark SPY gained 139.82% over the same period. Over the previous week the market value of iM-Top5(QQQ)Select gained 5.99% at a time when SPY gained 3.78%. A starting capital of $100,000 at inception on 1/5/2016 would have grown to $630,072 which includes $3,917 cash and excludes $7,782 spent on fees and slippage. |
|
|
iM-Top5(XLB)Select: Since inception, on 1/5/2016, the model gained 122.99% while the benchmark SPY gained 139.82% over the same period. Over the previous week the market value of iM-Top5(XLB)Select gained 4.46% at a time when SPY gained 3.78%. A starting capital of $100,000 at inception on 1/5/2016 would have grown to $222,993 which includes $212 cash and excludes $6,398 spent on fees and slippage. |
|
|
iM-Top5(XLI)Select: Since inception, on 1/5/2016, the model gained 272.17% while the benchmark SPY gained 139.82% over the same period. Over the previous week the market value of iM-Top5(XLI)Select gained 2.23% at a time when SPY gained 3.78%. A starting capital of $100,000 at inception on 1/5/2016 would have grown to $372,174 which includes $608 cash and excludes $3,428 spent on fees and slippage. |
|
|
iM-Top5(XLK)Select: Since inception, on 1/5/2016, the model gained 503.11% while the benchmark SPY gained 139.82% over the same period. Over the previous week the market value of iM-Top5(XLK)Select gained 3.42% at a time when SPY gained 3.78%. A starting capital of $100,000 at inception on 1/5/2016 would have grown to $603,106 which includes $2,535 cash and excludes $1,607 spent on fees and slippage. |
|
|
iM-Top5(XLP)Select: Since inception, on 1/5/2016, the model gained 191.71% while the benchmark SPY gained 139.82% over the same period. Over the previous week the market value of iM-Top5(XLP)Select gained -0.22% at a time when SPY gained 3.78%. A starting capital of $100,000 at inception on 1/5/2016 would have grown to $292,107 which includes $1,456 cash and excludes $1,391 spent on fees and slippage. |
|
|
iM-Top5(XLV)Select: Since inception, on 1/5/2016, the model gained 358.81% while the benchmark SPY gained 139.82% over the same period. Over the previous week the market value of iM-Top5(XLV)Select gained 4.21% at a time when SPY gained 3.78%. A starting capital of $100,000 at inception on 1/5/2016 would have grown to $458,807 which includes $915 cash and excludes $5,263 spent on fees and slippage. |
|
|
iM-Top5(XLU)Select: Since inception, on 1/5/2016, the model gained 99.21% while the benchmark SPY gained 139.82% over the same period. Over the previous week the market value of iM-Top5(XLU)Select gained 1.49% at a time when SPY gained 3.78%. A starting capital of $100,000 at inception on 1/5/2016 would have grown to $199,212 which includes $1,803 cash and excludes $7,506 spent on fees and slippage. |
|
|
iM-Top5(XLY)Select: Since inception, on 1/5/2016, the model gained 223.67% while the benchmark SPY gained 139.82% over the same period. Over the previous week the market value of iM-Top5(XLY)Select gained 4.90% at a time when SPY gained 3.78%. A starting capital of $100,000 at inception on 1/5/2016 would have grown to $323,667 which includes $1,075 cash and excludes $2,884 spent on fees and slippage. |
|
|
iM-Seasonal Super-Sectors (Top5 combo) : Since inception, on 11/17/2020, the model gained 23.60% while the benchmark SPY gained 24.49% over the same period. Over the previous week the market value of iM-Seasonal Super-Sectors (Top5 combo) gained 2.63% at a time when SPY gained 3.78%. A starting capital of $100,000 at inception on 11/17/2020 would have grown to $123,639 which includes $1,950 cash and excludes $00 spent on fees and slippage. |
|
|
iM-Dividend Growth Portfolio: The model’s out of sample performance YTD is 17.3%, and for the last 12 months is 44.8%. Over the same period the benchmark SPY performance was 18.7% and 39.5% respectively. Over the previous week the market value of the iM-Dividend Growth Portfolio gained 2.07% at a time when SPY gained 3.78%. A starting capital of $100,000 at inception on 6/30/2016 would have grown to $397,266 which includes $3,010 cash and excludes $6,696 spent on fees and slippage. |
|
|
iM-Gold Momentum Timer (AU, NEM, SBSW): The model’s out of sample performance YTD is 10.1%, and for the last 12 months is 11.7%. Over the same period the benchmark SPY performance was 18.7% and 39.5% respectively. Over the previous week the market value of iM-Gold Momentum Timer (AU, NEM, SBSW) gained 10.34% at a time when SPY gained 3.78%. A starting capital of $100,000 at inception on 6/30/2016 would have grown to $01 which includes $66,124 cash and excludes Gain to date spent on fees and slippage. |
|
|
iM-ModSum/YieldCurve Timer: The model’s out of sample performance YTD is 15.3%, and for the last 12 months is 35.3%. Over the same period the benchmark SPY performance was 18.7% and 39.5% respectively. Over the previous week the market value of iM-PortSum/YieldCurve Timer gained -0.69% at a time when SPY gained 3.78%. A starting capital of $100,000 at inception on 1/1/2016 would have grown to $298,196 which includes $3,237 cash and excludes $862 spent on fees and slippage. |
|
|
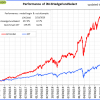
iM-Best(SPY-SH).R1: The model’s out of sample performance YTD is 18.6%, and for the last 12 months is 39.5%. Over the same period the benchmark SPY performance was 18.7% and 39.5% respectively. Over the previous week the market value of Best(SPY-SH) gained 3.74% at a time when SPY gained 3.78%. A starting capital of $100,000 at inception on 1/2/2009 would have grown to $785,552 which includes $8,034 cash and excludes $25,118 spent on fees and slippage. |
|
|
iM-Combo3.R1: The model’s out of sample performance YTD is 12.6%, and for the last 12 months is 31.2%. Over the same period the benchmark SPY performance was 18.7% and 39.5% respectively. Over the previous week the market value of iM-Combo3.R1 gained 2.34% at a time when SPY gained 3.78%. A starting capital of $100,000 at inception on 2/3/2014 would have grown to $193,387 which includes $7,936 cash and excludes $7,039 spent on fees and slippage. |
|
|
iM-Combo5: The model’s out of sample performance YTD is 18.9%, and for the last 12 months is 45.9%. Over the same period the benchmark SPY performance was 18.7% and 39.5% respectively. Over the previous week the market value of iM-Combo5 gained 2.83% at a time when SPY gained 3.78%. A starting capital of $100,000 at inception on 2/22/2016 would have grown to $211,183 which includes $1,856 cash and excludes $0 spent on fees and slippage. |
|
|
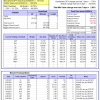
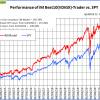
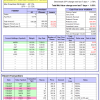
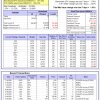
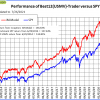
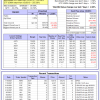
iM-Best10(VDIGX)-Trader: The model’s out of sample performance YTD is 13.0%, and for the last 12 months is 25.0%. Over the same period the benchmark SPY performance was 18.7% and 39.5% respectively. Since inception, on 7/1/2014, the model gained 205.79% while the benchmark SPY gained 157.44% and VDIGX gained -100.00% over the same period. Over the previous week the market value of iM-Best10(VDIGX) gained 2.85% at a time when SPY gained 3.78%. A starting capital of $100,000 at inception on 7/1/2014 would have grown to $305,792 which includes $1,166 cash and excludes $3,890 spent on fees and slippage. |
|
|
iM 6-Stock Capital Strength Portfolio: The model’s out of sample performance YTD is 15.7%, and for the last 12 months is 36.8%. Over the same period the benchmark SPY performance was 18.7% and 39.5% respectively. Over the previous week the market value of the iM 6-Stock Capital Strength Portfolio gained 1.69% at a time when SPY gained 3.78%. A starting capital of $100,000 at inception on 10/28/2016 would have grown to $217,655 which includes $1,607 cash and excludes $1,888 spent on fees and slippage. |
|
|
iM-Best12(USMV)-Trader: The model’s out of sample performance YTD is 14.4%, and for the last 12 months is 22.7%. Over the same period the benchmark SPY performance was 18.7% and 39.5% respectively. Since inception, on 6/30/2014, the model gained 156.63% while the benchmark SPY gained 157.44% and the ETF USMV gained 134.81% over the same period. Over the previous week the market value of iM-Best12(USMV)-Trader gained 1.93% at a time when SPY gained 3.78%. A starting capital of $100,000 at inception on 6/30/2014 would have grown to $256,632 which includes $2,769 cash and excludes $7,336 spent on fees and slippage. |
|
|
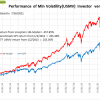
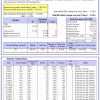
iM-Min Volatility(USMV) Investor (Tax Efficient): The model’s out of sample performance YTD is 23.6%, and for the last 12 months is 51.7%. Over the same period the benchmark SPY performance was 18.7% and 39.5% respectively. Since inception, on 1/3/2013, the model gained 457.85% while the benchmark SPY gained 255.36% and the ETF USMV gained 255.36% over the same period. Over the previous week the market value of iM-Best12(USMV)Q1 gained 2.85% at a time when SPY gained 3.78%. A starting capital of $100,000 at inception on 1/3/2013 would have grown to $557,846 which includes $33 cash and excludes $4,816 spent on fees and slippage. |
|
|
iM-Bond Market Trader (High-Yield Bond or 10-yr Treasury Bond): The model’s out of sample performance YTD is 3.6%, and for the last 12 months is 9.4%. Over the same period the benchmark BND performance was -1.0% and -0.9% respectively. Over the previous week the market value of the iM-Bond Market Trader (High-Yield Bond or 10-yr Treasury Bond) gained -0.70% at a time when BND gained -0.38%. A starting capital of $10,000 at inception on 1/3/2000 would have grown to $154,047 which includes -$110 cash and excludes $2,147 spent on fees and slippage. |
|
|
iM-ModSum/YieldCurve Timer: The model’s out of sample performance YTD is 15.3%, and for the last 12 months is 35.3%. Over the same period the benchmark SPY performance was 18.7% and 39.5% respectively. Over the previous week the market value of iM-PortSum/YieldCurve Timer gained -0.69% at a time when SPY gained 3.78%. A starting capital of $100,000 at inception on 1/1/2016 would have grown to $298,196 which includes $3,237 cash and excludes $862 spent on fees and slippage. |
|
|
iM-Best2 MC-Score ETF System: The model’s out of sample performance YTD is 9.9%, and for the last 12 months is 19.6%. Over the same period the benchmark SPY performance was 18.7% and 39.5% respectively. Over the previous week the market value of the iM-Best2 MC-Score ETF System gained 1.50% at a time when SPY gained 3.78%. A starting capital of $100,000 at inception on 6/30/2016 would have grown to $144,277 which includes $2,781 cash and excludes $1,386 spent on fees and slippage. |
|
|
iM-Best4 MC-Score Vanguard System: The model’s out of sample performance YTD is 14.6%, and for the last 12 months is 27.4%. Over the same period the benchmark SPY performance was 18.7% and 39.5% respectively. Over the previous week the market value of the iM-Best4 MC-Score Vanguard System gained 2.08% at a time when SPY gained 3.78%. A starting capital of $100,000 at inception on 6/30/2016 would have grown to $153,961 which includes $4,061 cash and excludes $00 spent on fees and slippage. |
|
|
iM-Composite (SPY-IEF) Timer: The model’s out of sample performance YTD is 18.5%, and for the last 12 months is 31.3%. Over the same period the benchmark SPY performance was 18.7% and 39.5% respectively. Over the previous week the market value of the iM-Composite (SPY-IEF) Timer gained 3.73% at a time when SPY gained 3.78%. A starting capital of $100,000 at inception on 6/30/2016 would have grown to $185,828 which includes $2,364 cash and excludes $3,984 spent on fees and slippage. |
|
|
iM-Composite(Gold-Stocks-Bond) Timer: The model’s out of sample performance YTD is 2.3%, and for the last 12 months is 15.1%. Over the same period the benchmark SPY performance was 18.7% and 39.5% respectively. Over the previous week the market value of the iM-Composite(Gold-Stocks-Bond) Timer gained -0.82% at a time when SPY gained 3.78%. A starting capital of $100,000 at inception on 6/30/2016 would have grown to $170,115 which includes $133 cash and excludes $6,883 spent on fees and slippage. |


Leave a Reply
You must be logged in to post a comment.