
  |
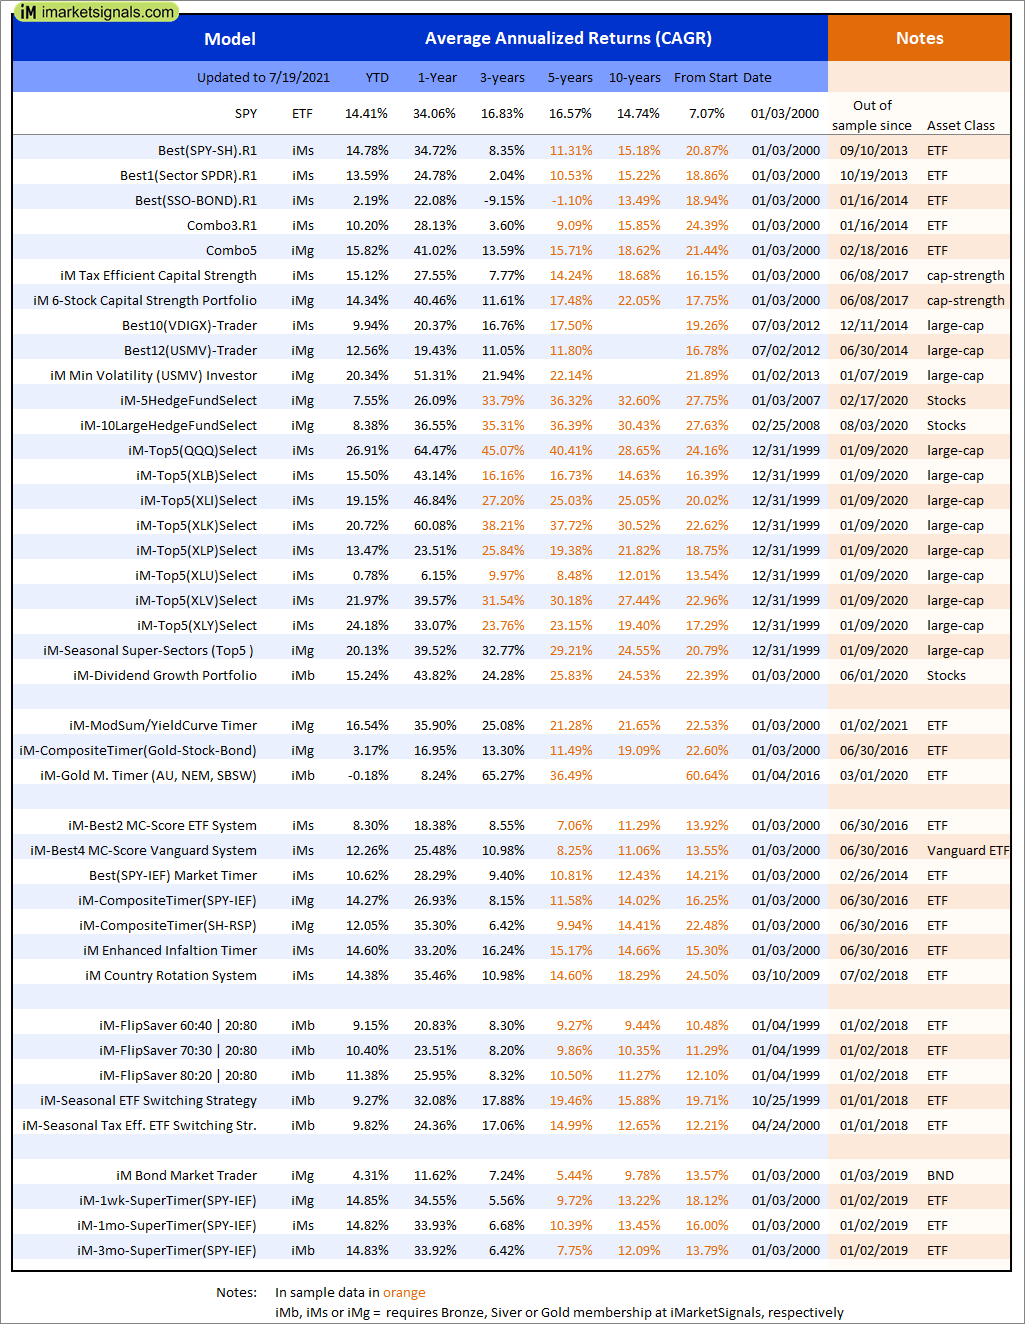
Out of sample performance summary of our models for the past 1, 2, 4 and 13 week periods. The active active return indicates how the models over- or underperformed the benchmark ETF SPY. Also the YTD, and the 1-, 3-, 5- and 10-year annualized returns are shown in the second table |
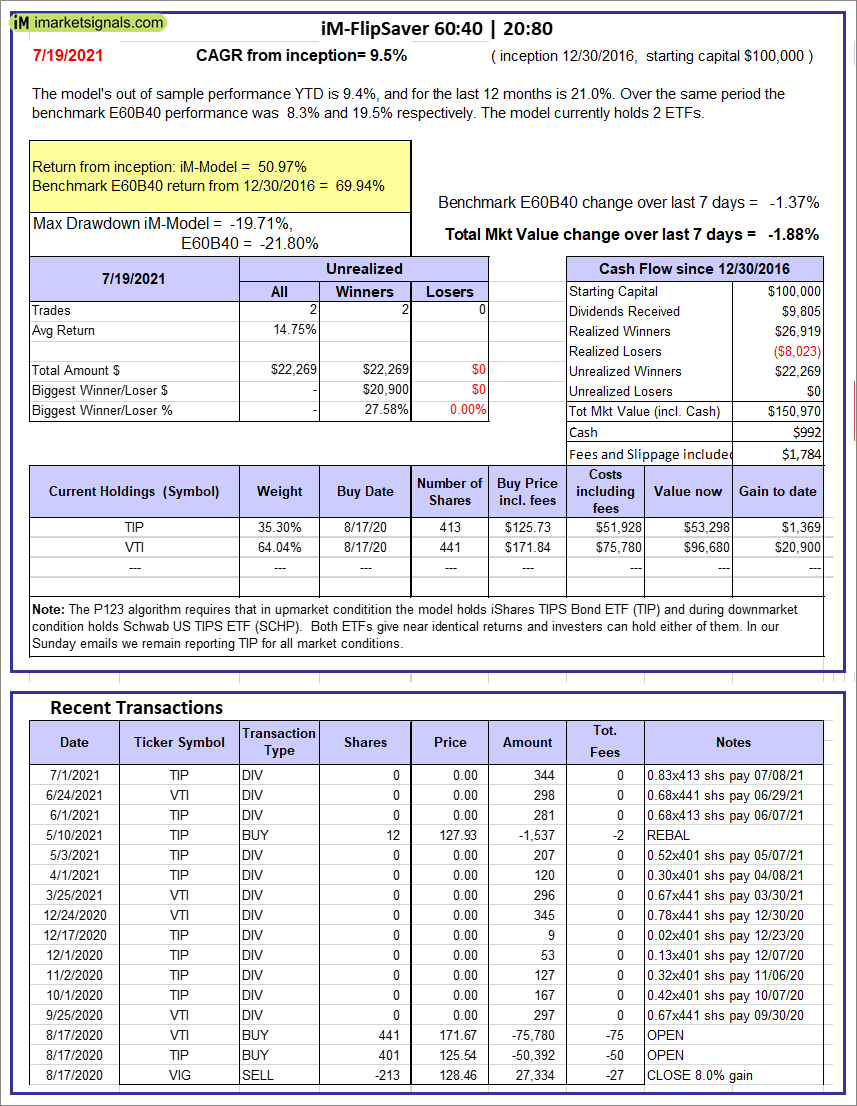 |
iM-FlipSaver 60:40 | 20:80 – 2017: The model’s out of sample performance YTD is 9.4%, and for the last 12 months is 21.0%. Over the same period the benchmark E60B40 performance was 8.3% and 19.5% respectively. Over the previous week the market value of iM-FlipSaver 80:20 | 20:80 gained -1.88% at a time when SPY gained -1.37%. A starting capital of $100,000 at inception on 7/16/2015 would have grown to $150,970 which includes $992 cash and excludes $1,784 spent on fees and slippage. |
 |
iM-FlipSaver 70:30 | 20:80 – 2017: The model’s out of sample performance YTD is 10.4%, and for the last 12 months is 23.5%. Over the same period the benchmark E60B40 performance was 8.3% and 19.5% respectively. Over the previous week the market value of iM-FlipSaver 70:30 | 20:80 gained -2.22% at a time when SPY gained -1.37%. A starting capital of $100,000 at inception on 7/15/2015 would have grown to $154,759 which includes $638 cash and excludes $1,919 spent on fees and slippage. |
 |
iM-FlipSaver 80:20 | 20:80 – 2017: The model’s out of sample performance YTD is 11.4%, and for the last 12 months is 25.9%. Over the same period the benchmark E60B40 performance was 8.3% and 19.5% respectively. Over the previous week the market value of iM-FlipSaver 80:20 | 20:80 gained -2.55% at a time when SPY gained -1.37%. A starting capital of $100,000 at inception on 1/2/2017 would have grown to $158,441 which includes $692 cash and excludes $2,047 spent on fees and slippage. |
 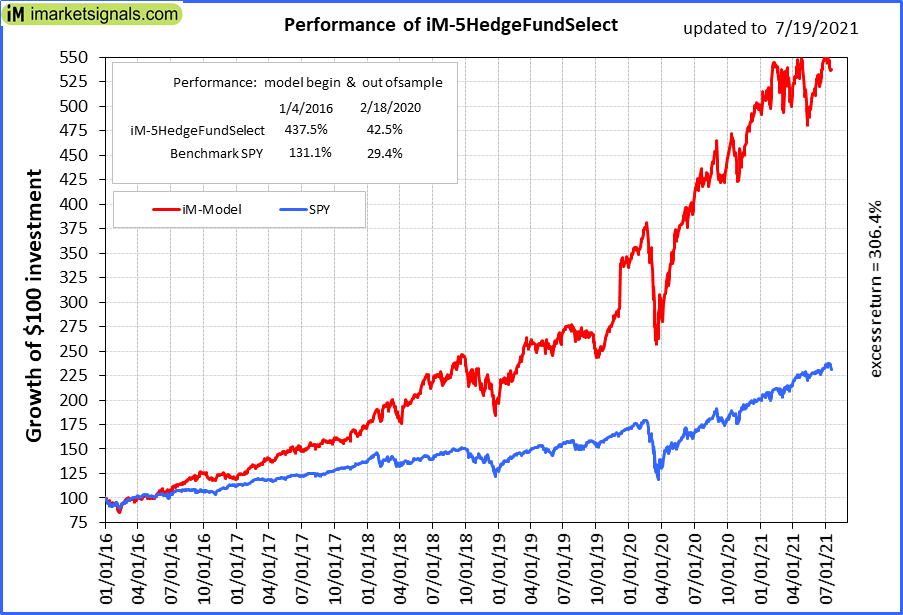 |
iM-5HedgeFundSelect: Since inception, on 1/5/2016, the model gained 437.48% while the benchmark SPY gained 131.09% over the same period. Over the previous week the market value of iM-5HedgeFundSelect gained -1.77% at a time when SPY gained -2.77%. A starting capital of $25,000 at inception on 1/5/2016 would have grown to $134,371 which includes -$608 cash and excludes $1,410 spent on fees and slippage. |
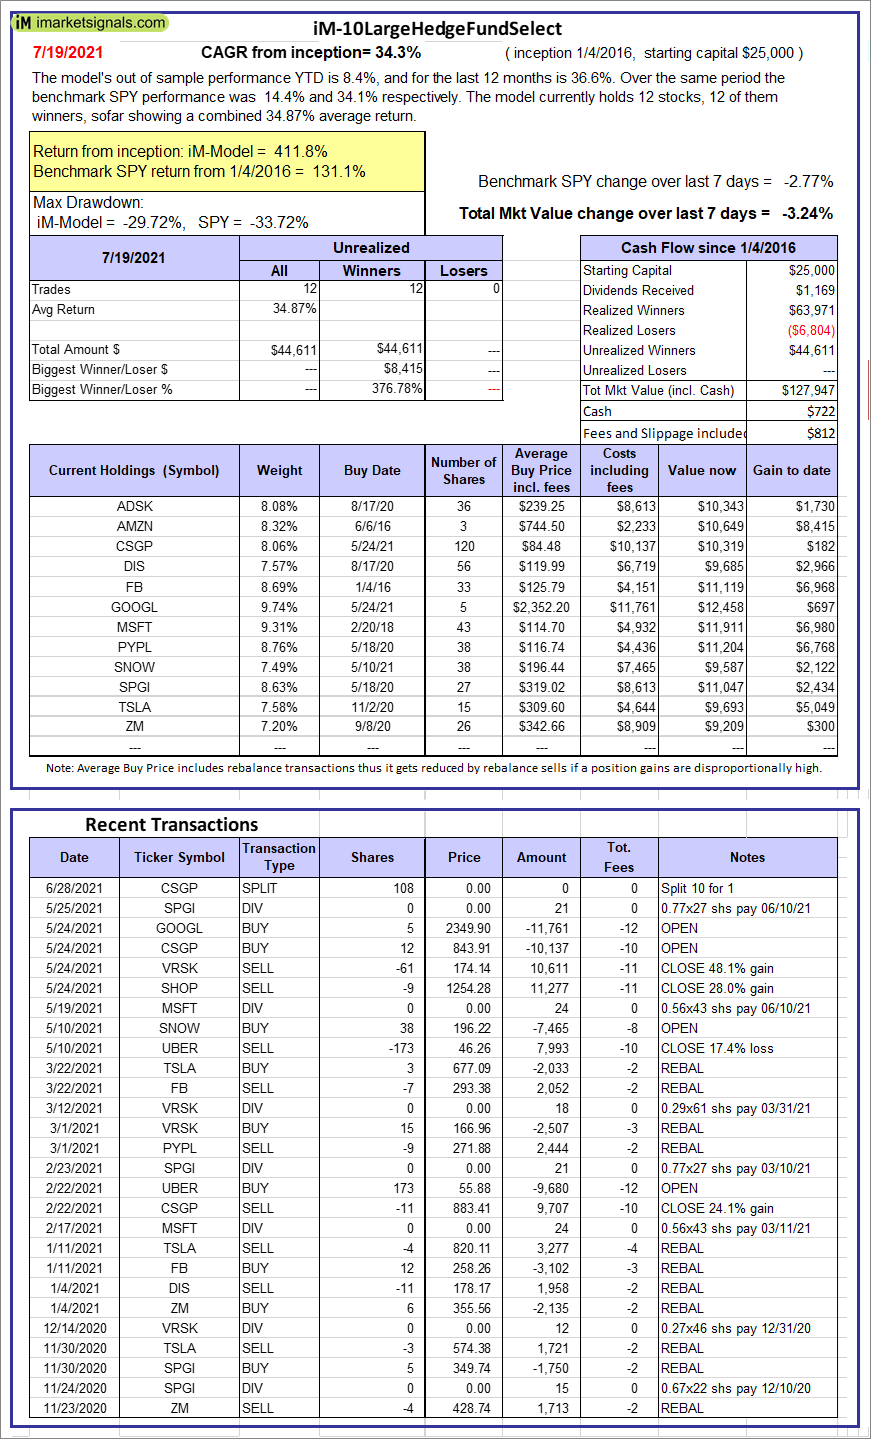 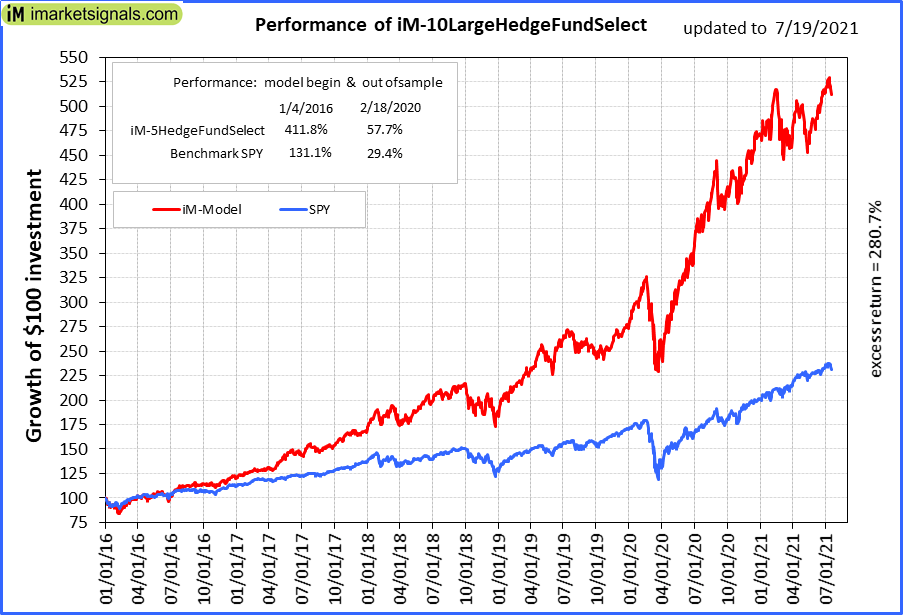 |
iM-10LargeHedgeFundSelect: Since inception, on 1/5/2016, the model gained 411.79% while the benchmark SPY gained 131.09% over the same period. Over the previous week the market value of iM-10LargeHedgeFundSelect gained -3.24% at a time when SPY gained -2.77%. A starting capital of $25,000 at inception on 1/5/2016 would have grown to $127,947 which includes $722 cash and excludes $812 spent on fees and slippage. |
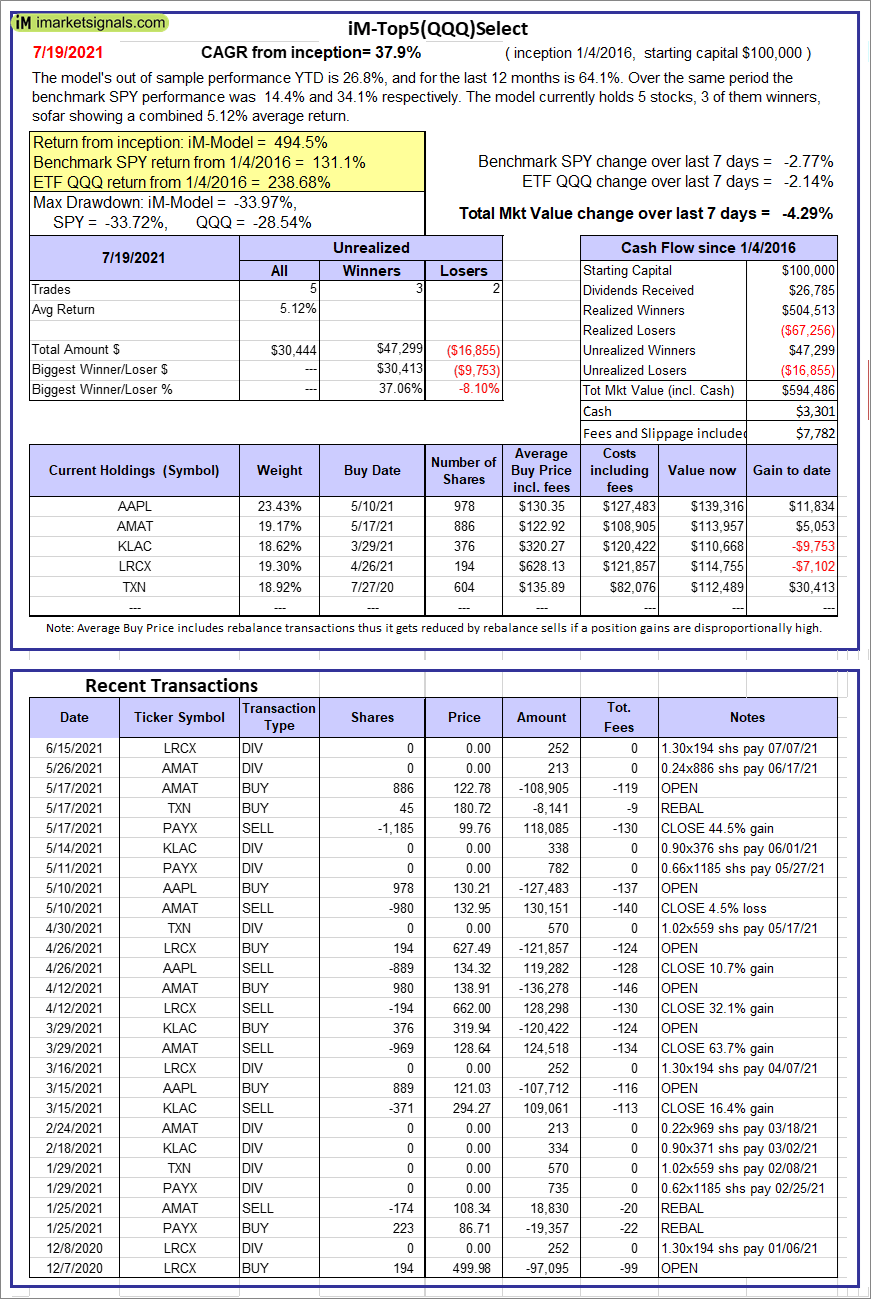 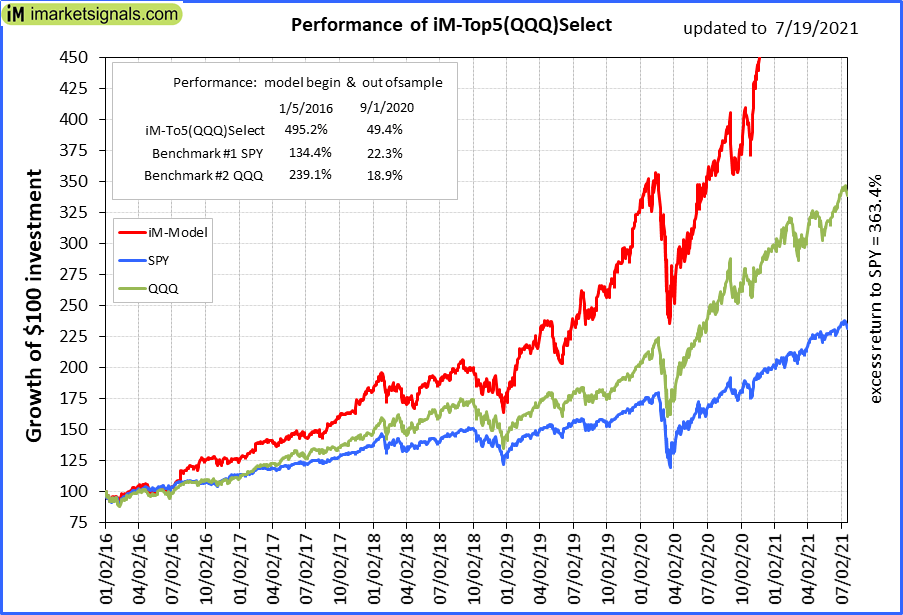 |
iM-Top5(QQQ)Select: Since inception, on 1/5/2016, the model gained 494.49% while the benchmark SPY gained 131.09% over the same period. Over the previous week the market value of iM-Top5(QQQ)Select gained -4.29% at a time when SPY gained -2.77%. A starting capital of $100,000 at inception on 1/5/2016 would have grown to $594,486 which includes $3,301 cash and excludes $7,782 spent on fees and slippage. |
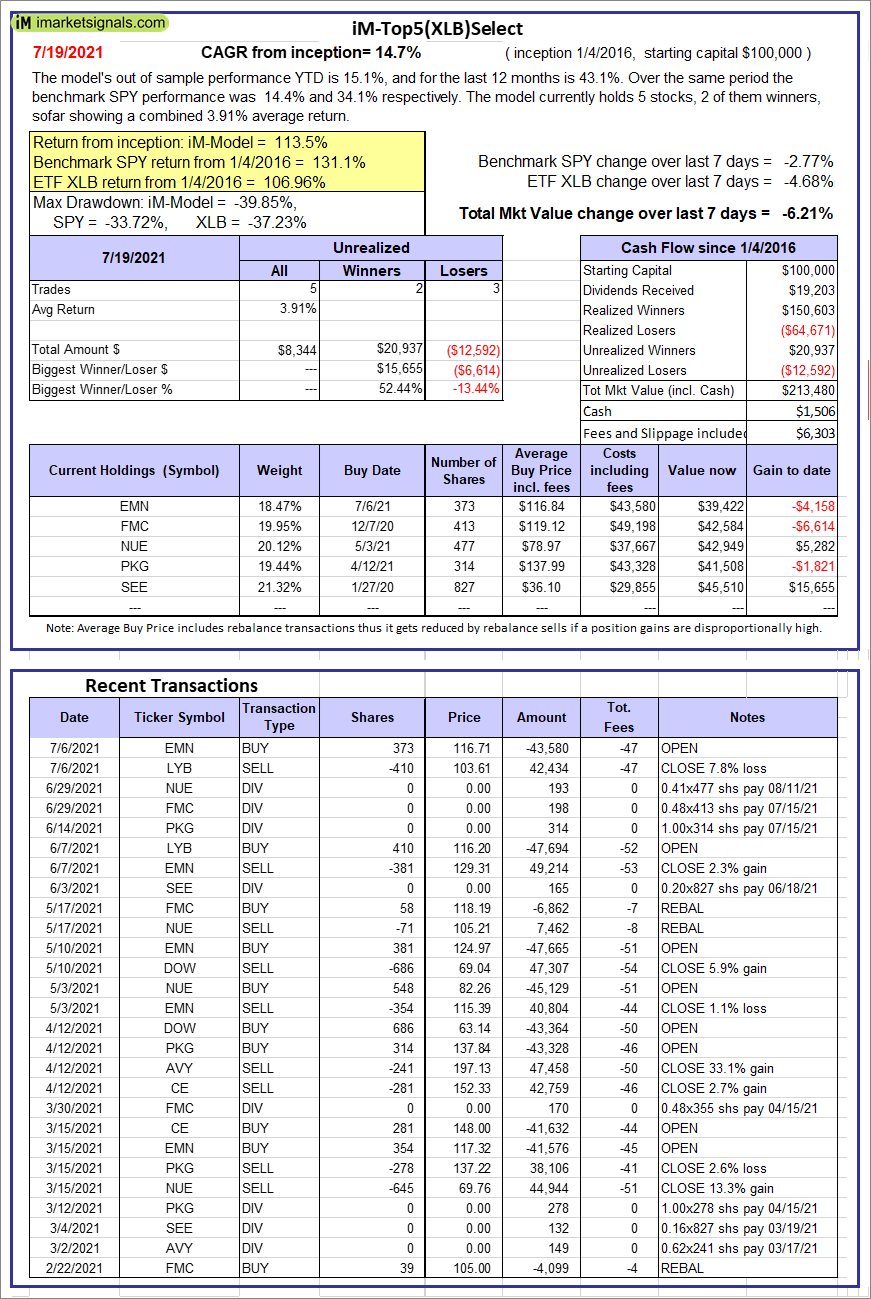 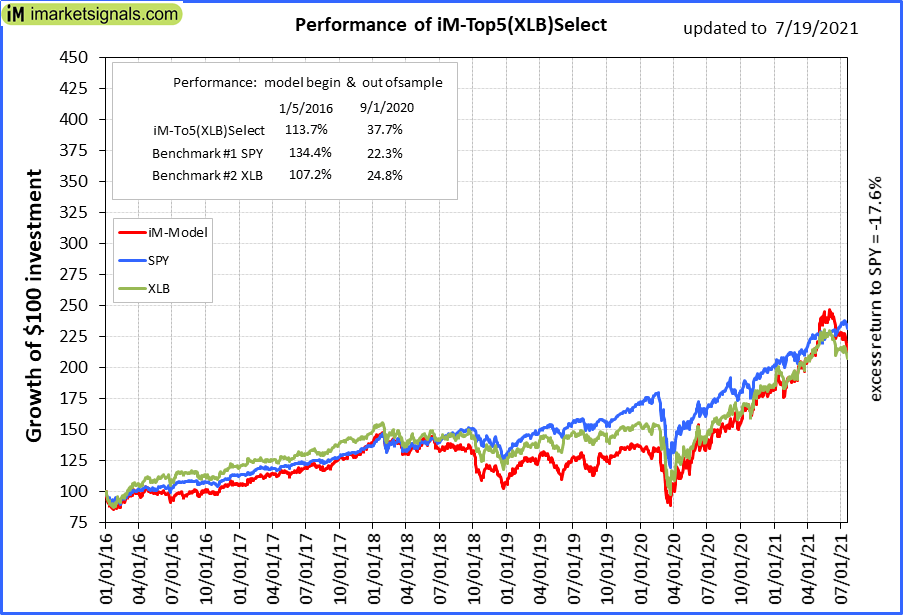 |
iM-Top5(XLB)Select: Since inception, on 1/5/2016, the model gained 113.48% while the benchmark SPY gained 131.09% over the same period. Over the previous week the market value of iM-Top5(XLB)Select gained -6.21% at a time when SPY gained -2.77%. A starting capital of $100,000 at inception on 1/5/2016 would have grown to $213,480 which includes $1,506 cash and excludes $6,303 spent on fees and slippage. |
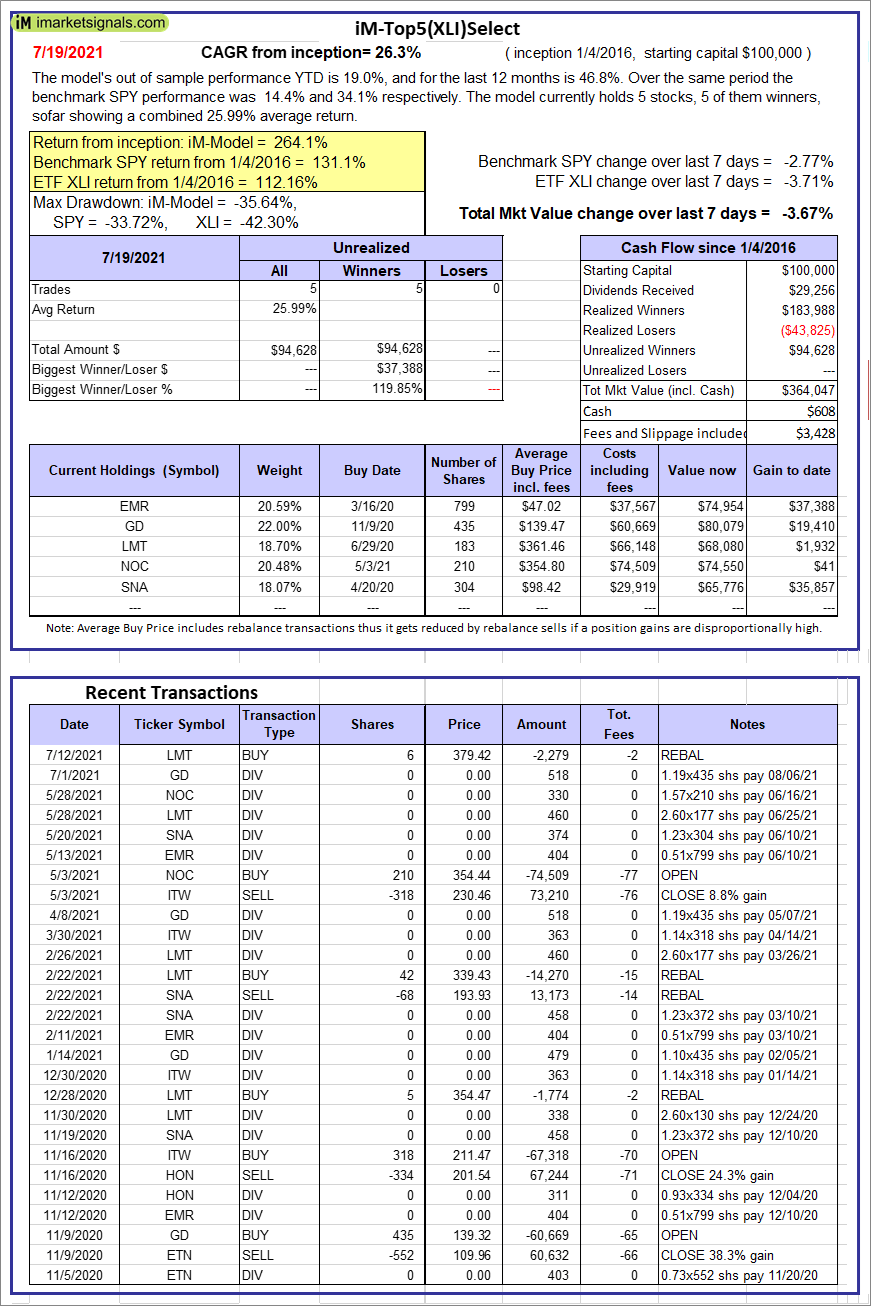 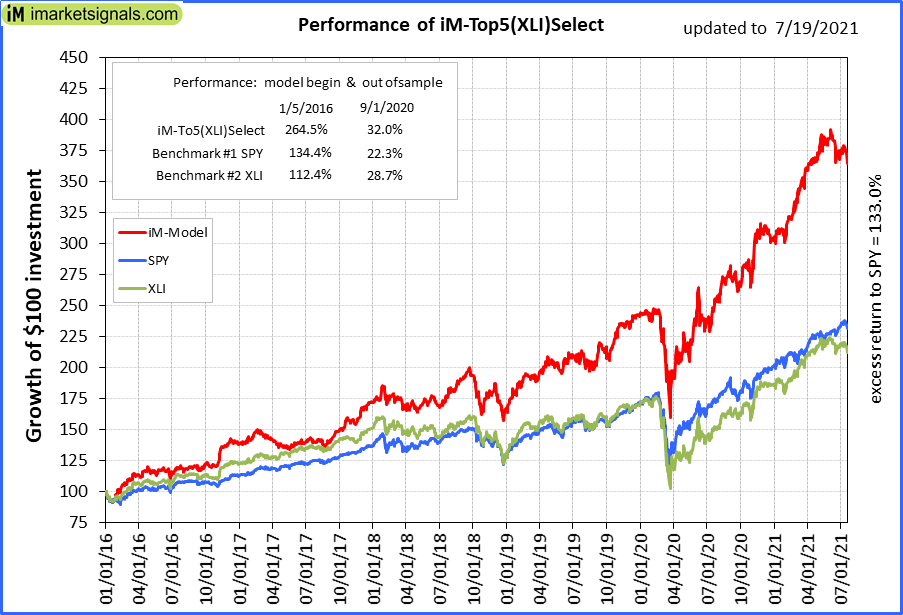 |
iM-Top5(XLI)Select: Since inception, on 1/5/2016, the model gained 264.05% while the benchmark SPY gained 131.09% over the same period. Over the previous week the market value of iM-Top5(XLI)Select gained -3.67% at a time when SPY gained -2.77%. A starting capital of $100,000 at inception on 1/5/2016 would have grown to $364,047 which includes $608 cash and excludes $3,428 spent on fees and slippage. |
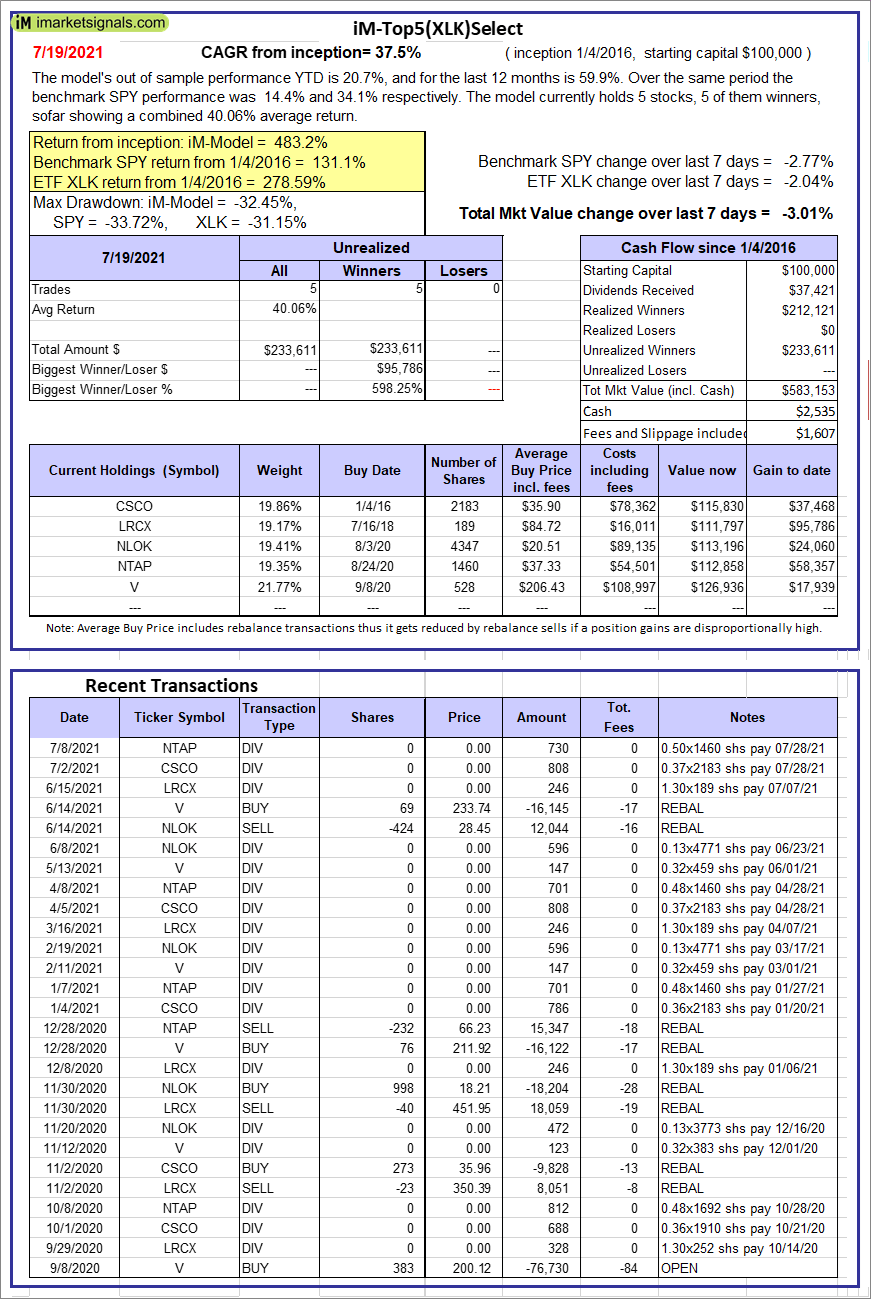 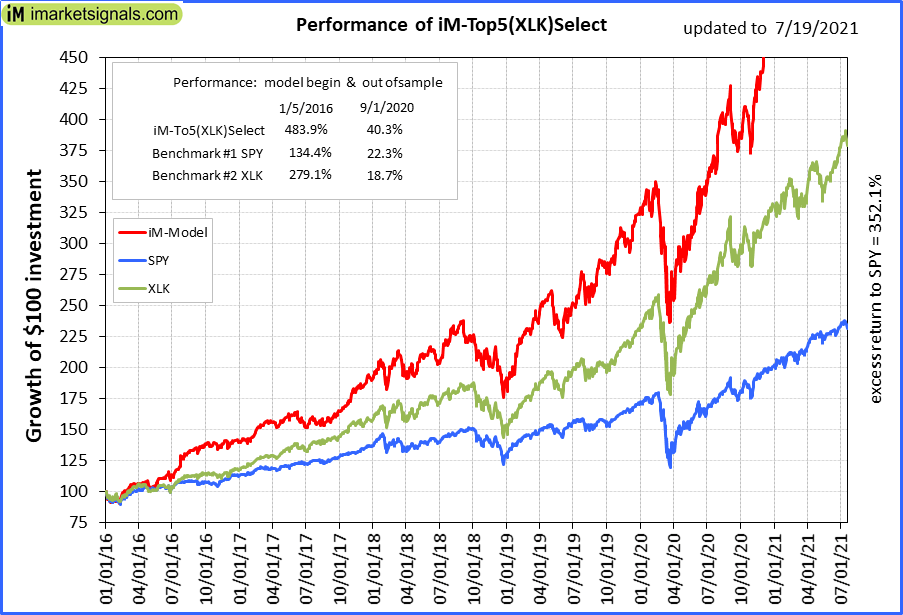 |
iM-Top5(XLK)Select: Since inception, on 1/5/2016, the model gained 483.15% while the benchmark SPY gained 131.09% over the same period. Over the previous week the market value of iM-Top5(XLK)Select gained -3.01% at a time when SPY gained -2.77%. A starting capital of $100,000 at inception on 1/5/2016 would have grown to $583,153 which includes $2,535 cash and excludes $1,607 spent on fees and slippage. |
  |
iM-Top5(XLP)Select: Since inception, on 1/5/2016, the model gained 192.36% while the benchmark SPY gained 131.09% over the same period. Over the previous week the market value of iM-Top5(XLP)Select gained 1.65% at a time when SPY gained -2.77%. A starting capital of $100,000 at inception on 1/5/2016 would have grown to $292,672 which includes $1,059 cash and excludes $1,391 spent on fees and slippage. |
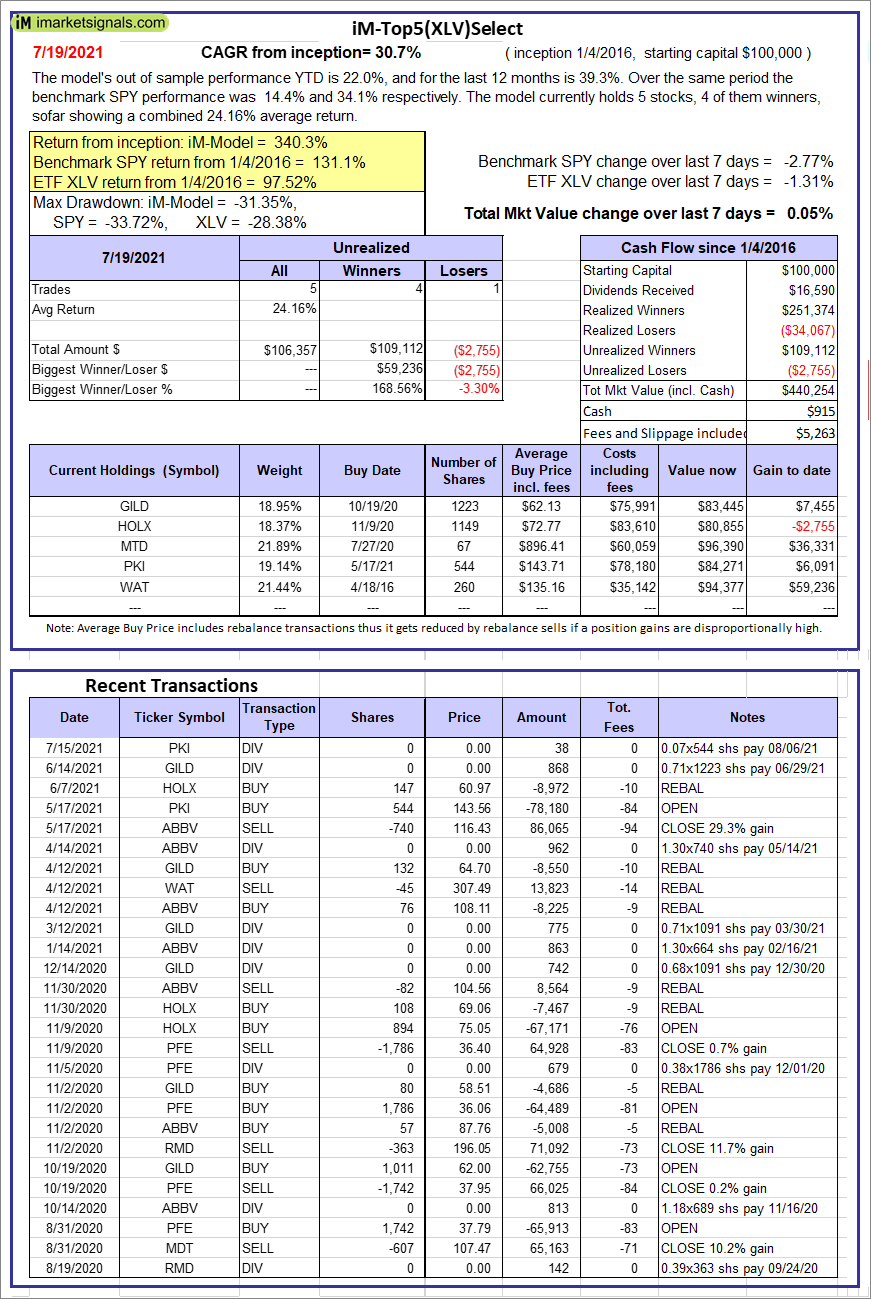 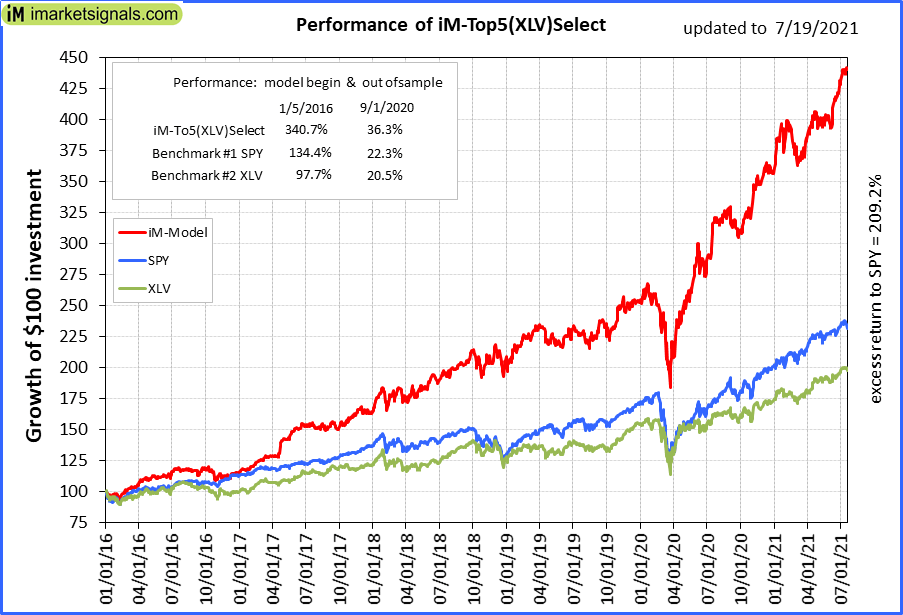 |
iM-Top5(XLV)Select: Since inception, on 1/5/2016, the model gained 340.25% while the benchmark SPY gained 131.09% over the same period. Over the previous week the market value of iM-Top5(XLV)Select gained 0.05% at a time when SPY gained -2.77%. A starting capital of $100,000 at inception on 1/5/2016 would have grown to $440,254 which includes $915 cash and excludes $5,263 spent on fees and slippage. |
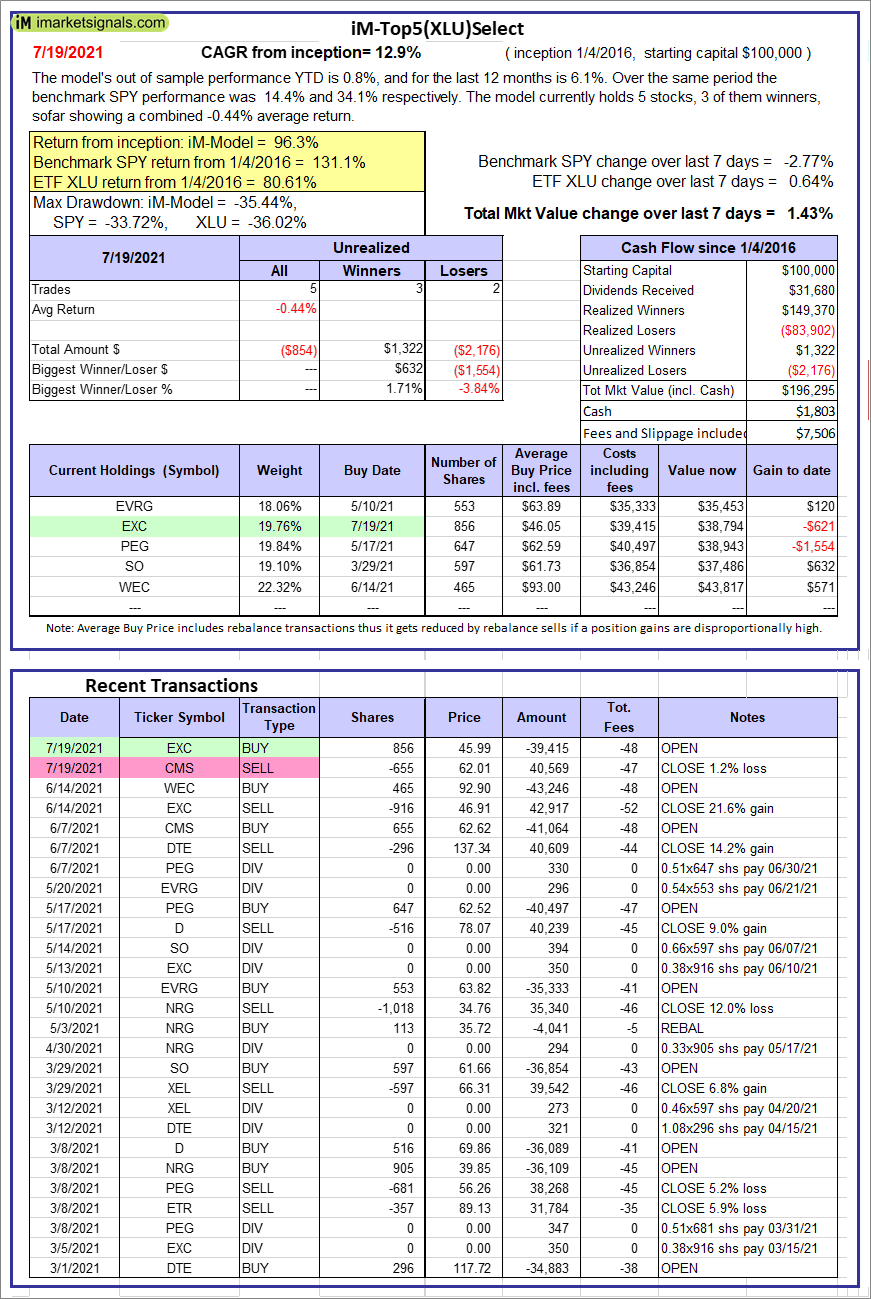 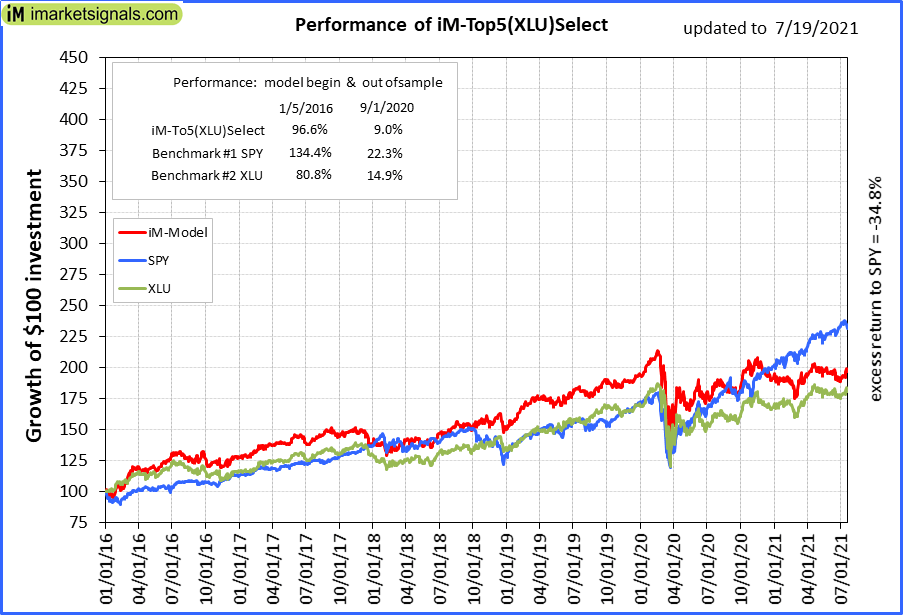 |
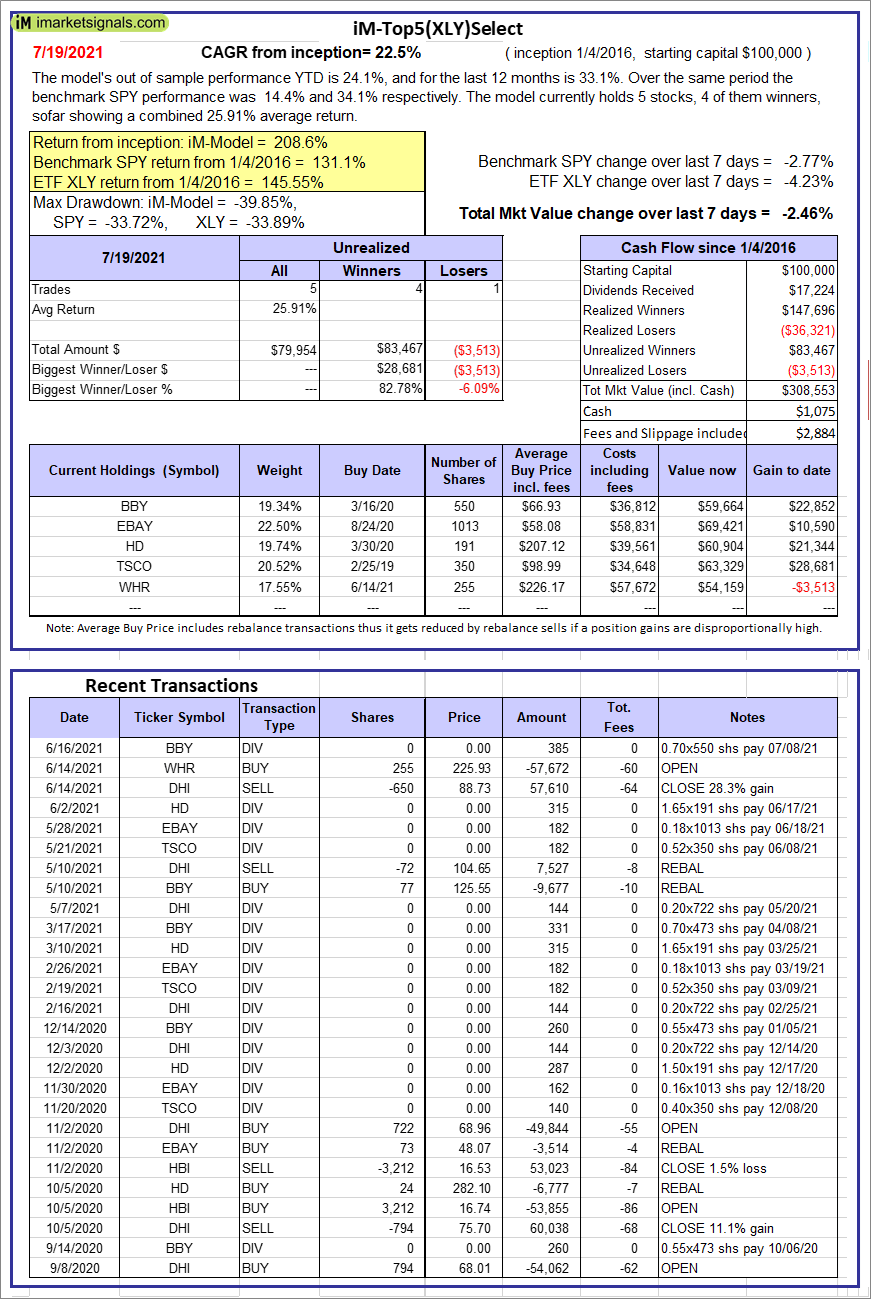
iM-Top5(XLU)Select: Since inception, on 1/5/2016, the model gained 96.29% while the benchmark SPY gained 131.09% over the same period. Over the previous week the market value of iM-Top5(XLU)Select gained 1.43% at a time when SPY gained -2.77%. A starting capital of $100,000 at inception on 1/5/2016 would have grown to $196,295 which includes $1,803 cash and excludes $7,506 spent on fees and slippage. |
 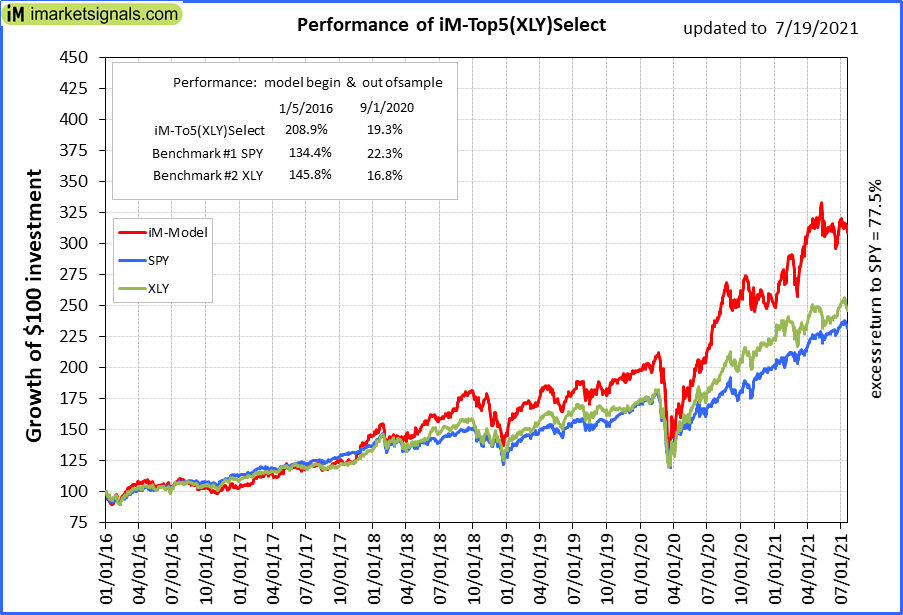 |
iM-Top5(XLY)Select: Since inception, on 1/5/2016, the model gained 208.55% while the benchmark SPY gained 131.09% over the same period. Over the previous week the market value of iM-Top5(XLY)Select gained -2.46% at a time when SPY gained -2.77%. A starting capital of $100,000 at inception on 1/5/2016 would have grown to $308,553 which includes $1,075 cash and excludes $2,884 spent on fees and slippage. |
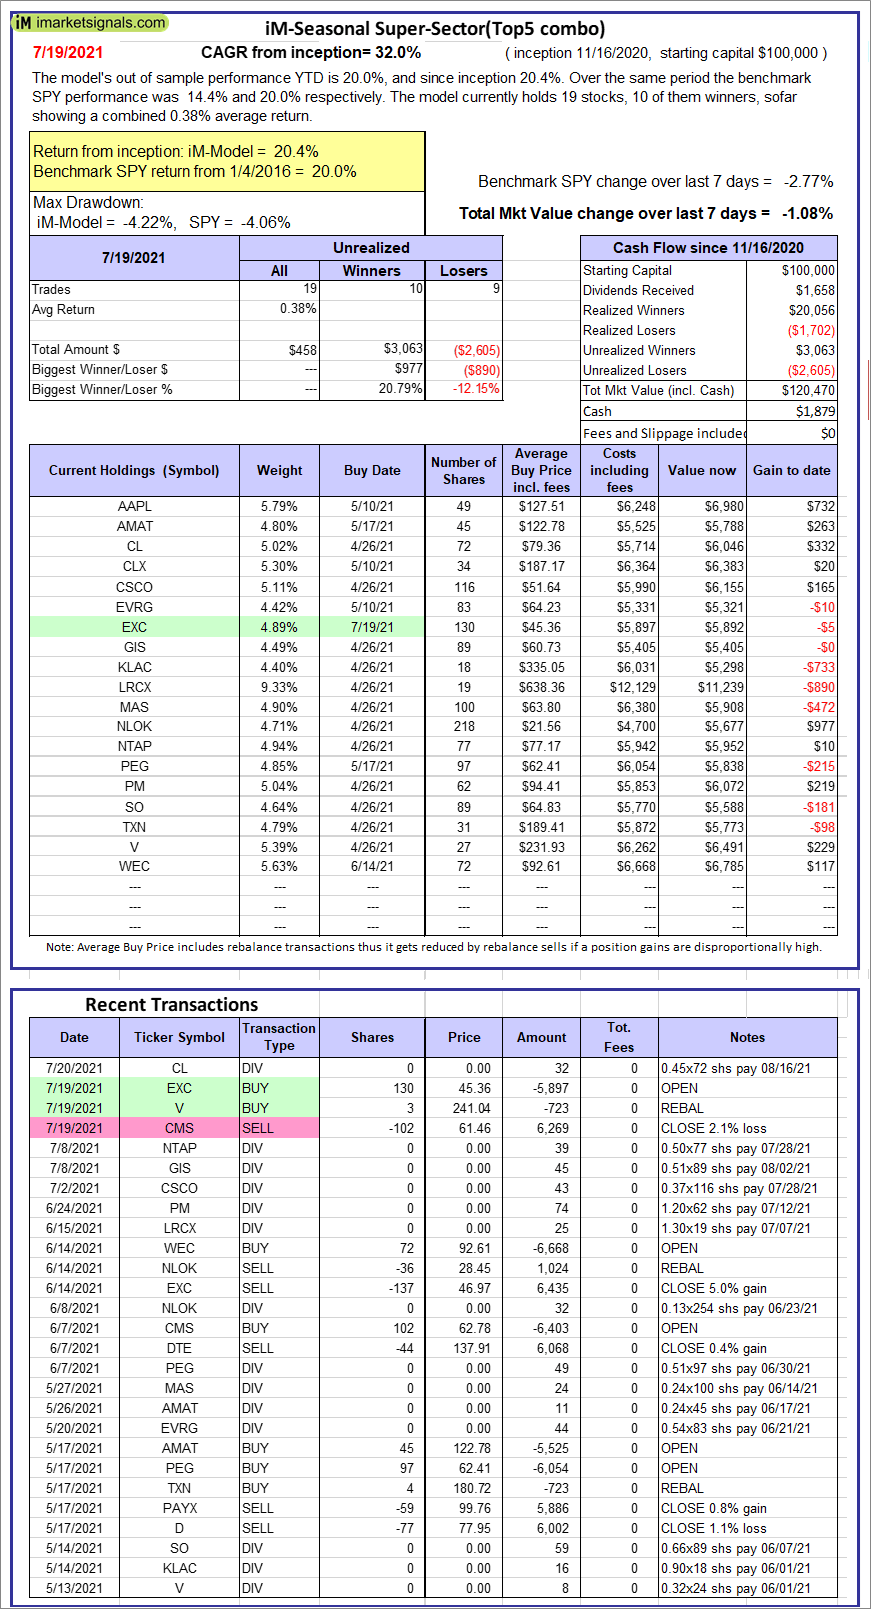 |
iM-Seasonal Super-Sectors (Top5 combo) : Since inception, on 11/17/2020, the model gained 20.44% while the benchmark SPY gained 19.96% over the same period. Over the previous week the market value of iM-Seasonal Super-Sectors (Top5 combo) gained -1.08% at a time when SPY gained -2.77%. A starting capital of $100,000 at inception on 11/17/2020 would have grown to $120,470 which includes $1,879 cash and excludes $00 spent on fees and slippage. |
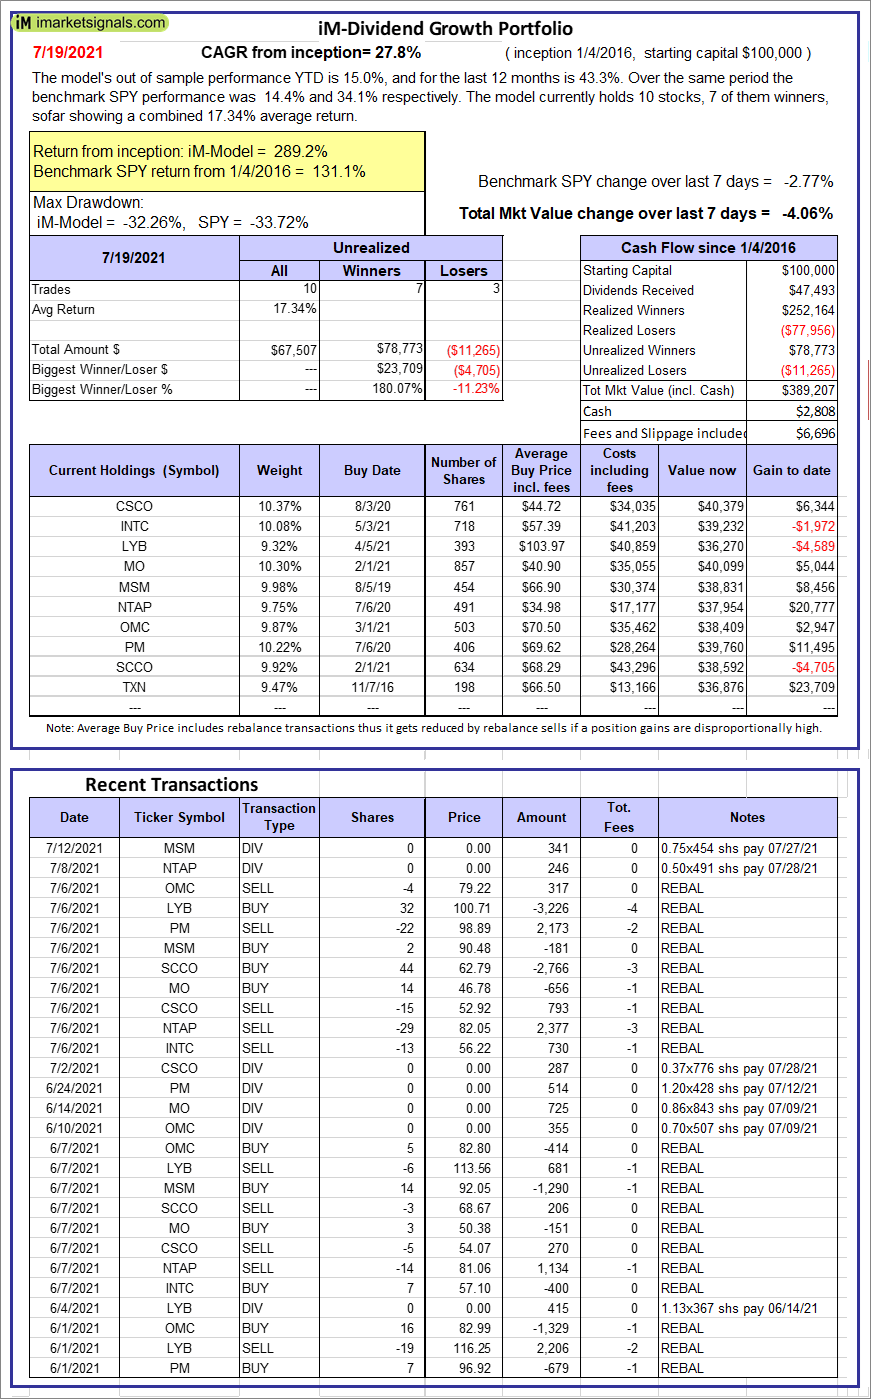 |
iM-Dividend Growth Portfolio: The model’s out of sample performance YTD is 15.0%, and for the last 12 months is 43.3%. Over the same period the benchmark SPY performance was 14.4% and 34.1% respectively. Over the previous week the market value of the iM-Dividend Growth Portfolio gained -4.06% at a time when SPY gained -2.77%. A starting capital of $100,000 at inception on 6/30/2016 would have grown to $389,207 which includes $2,808 cash and excludes $6,696 spent on fees and slippage. |
 |
iM-Gold Momentum Timer (AU, NEM, SBSW): The model’s out of sample performance YTD is -0.2%, and for the last 12 months is 8.2%. Over the same period the benchmark SPY performance was 14.4% and 34.1% respectively. Over the previous week the market value of iM-Gold Momentum Timer (AU, NEM, SBSW) gained -10.02% at a time when SPY gained -2.77%. A starting capital of $100,000 at inception on 6/30/2016 would have grown to $01 which includes $66,124 cash and excludes Gain to date spent on fees and slippage. |
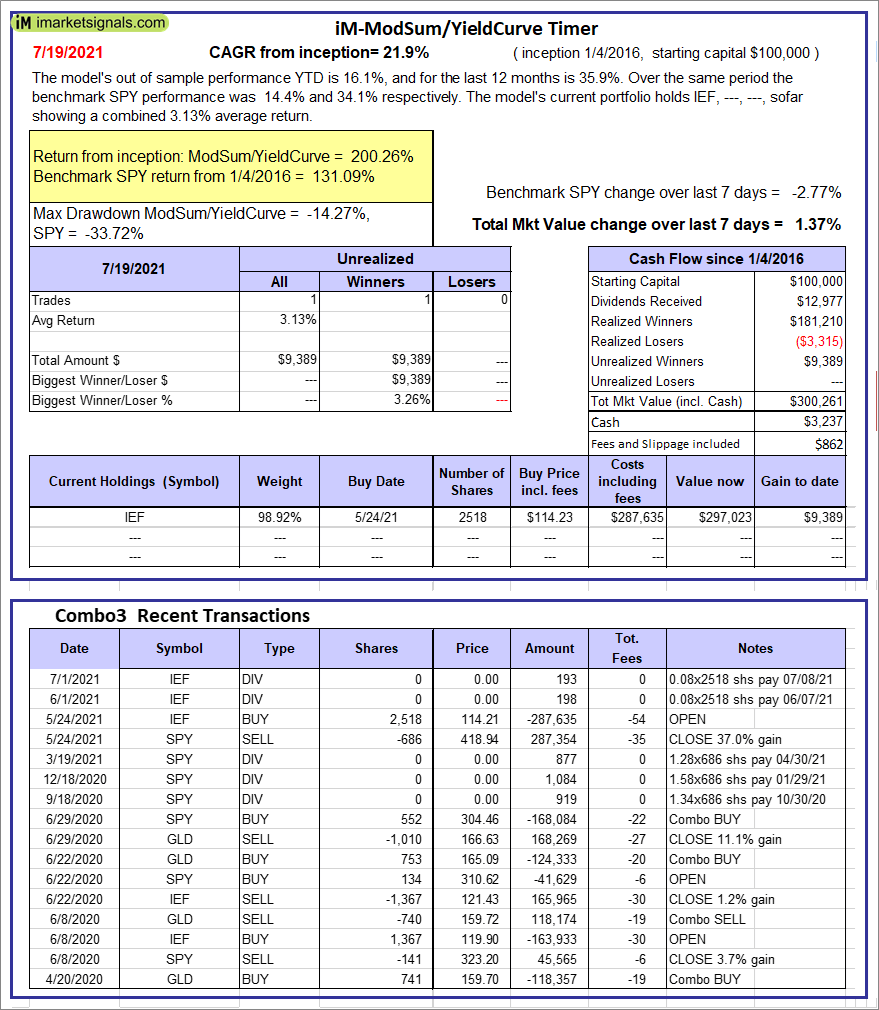 |
iM-ModSum/YieldCurve Timer: The model’s out of sample performance YTD is 16.1%, and for the last 12 months is 35.9%. Over the same period the benchmark SPY performance was 14.4% and 34.1% respectively. Over the previous week the market value of iM-PortSum/YieldCurve Timer gained 1.37% at a time when SPY gained -2.77%. A starting capital of $100,000 at inception on 1/1/2016 would have grown to $300,261 which includes $3,237 cash and excludes $862 spent on fees and slippage. |
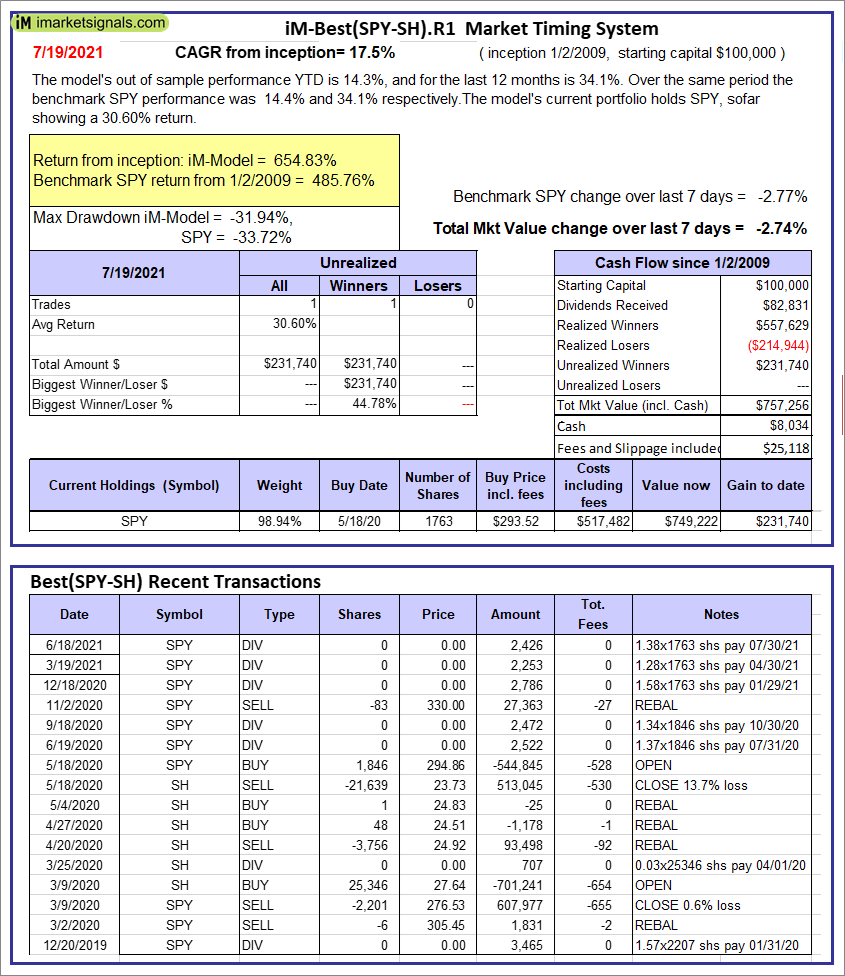 |
iM-Best(SPY-SH).R1: The model’s out of sample performance YTD is 14.3%, and for the last 12 months is 34.1%. Over the same period the benchmark SPY performance was 14.4% and 34.1% respectively. Over the previous week the market value of Best(SPY-SH) gained -2.74% at a time when SPY gained -2.77%. A starting capital of $100,000 at inception on 1/2/2009 would have grown to $757,256 which includes $8,034 cash and excludes $25,118 spent on fees and slippage. |
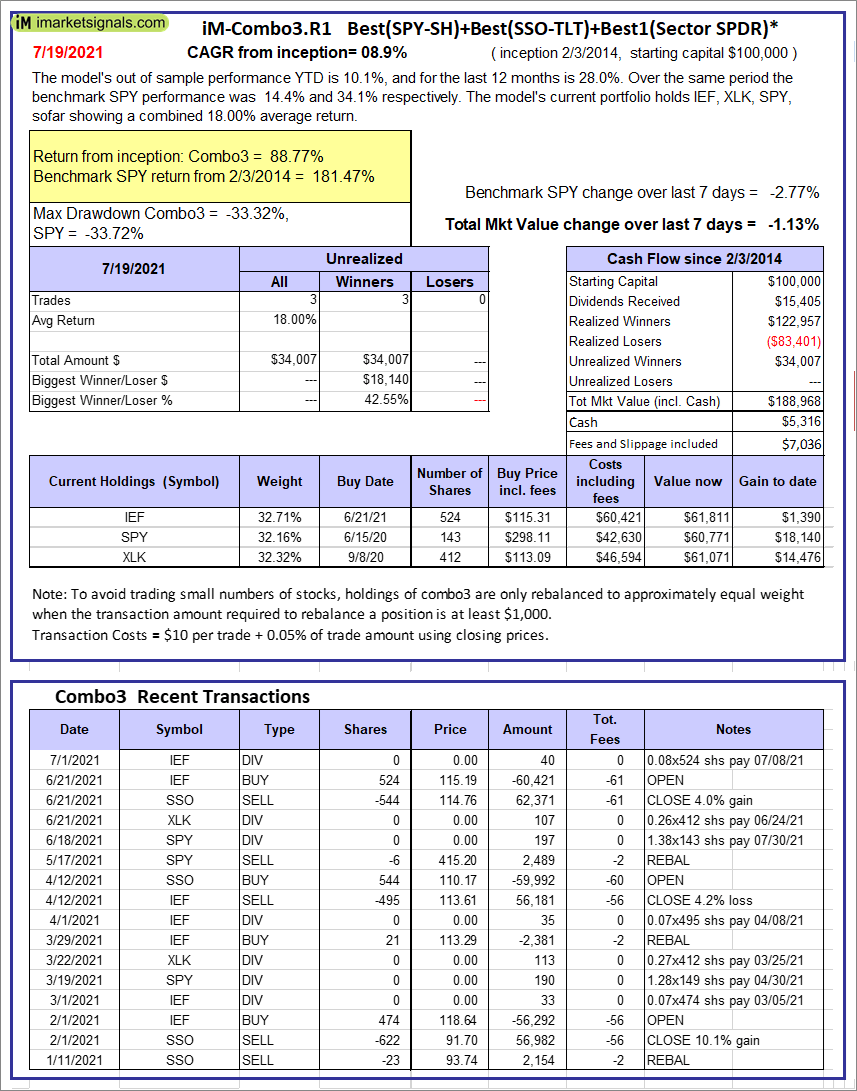 |
iM-Combo3.R1: The model’s out of sample performance YTD is 10.1%, and for the last 12 months is 28.0%. Over the same period the benchmark SPY performance was 14.4% and 34.1% respectively. Over the previous week the market value of iM-Combo3.R1 gained -1.13% at a time when SPY gained -2.77%. A starting capital of $100,000 at inception on 2/3/2014 would have grown to $188,968 which includes $5,316 cash and excludes $7,036 spent on fees and slippage. |
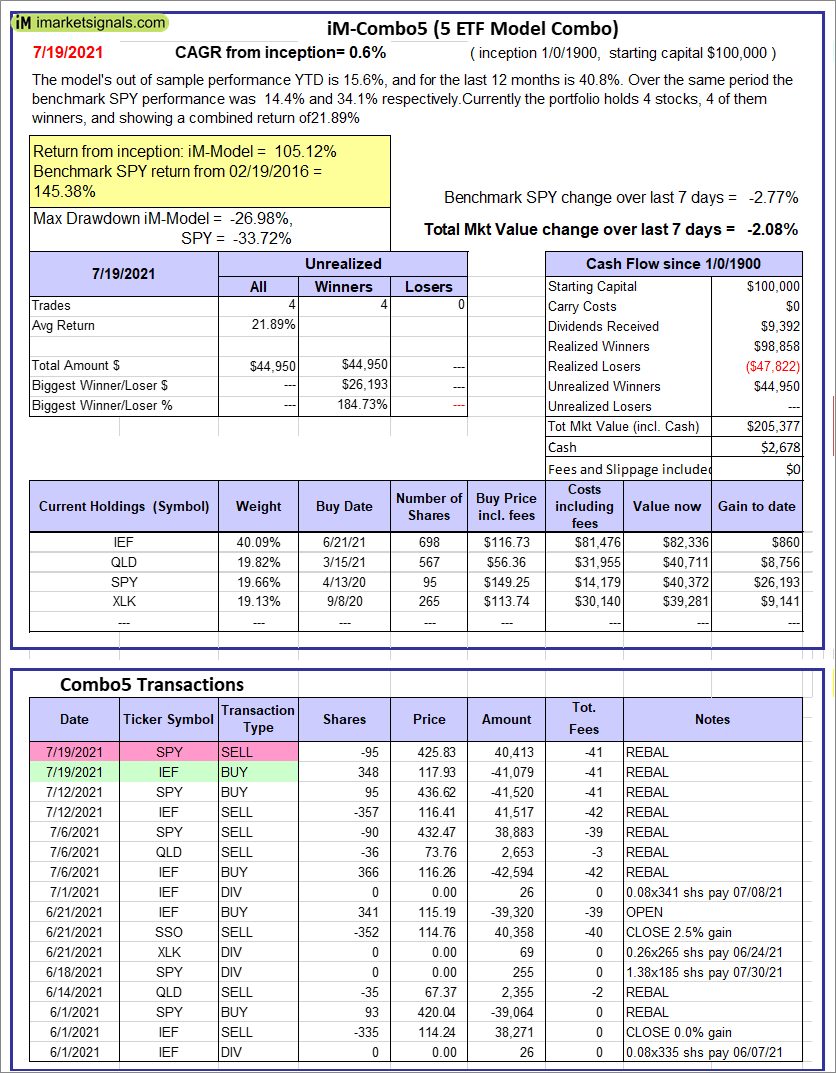 |
iM-Combo5: The model’s out of sample performance YTD is 15.6%, and for the last 12 months is 40.8%. Over the same period the benchmark SPY performance was 14.4% and 34.1% respectively. Over the previous week the market value of iM-Combo5 gained -2.08% at a time when SPY gained -2.77%. A starting capital of $100,000 at inception on 2/22/2016 would have grown to $205,377 which includes $2,678 cash and excludes $0 spent on fees and slippage. |
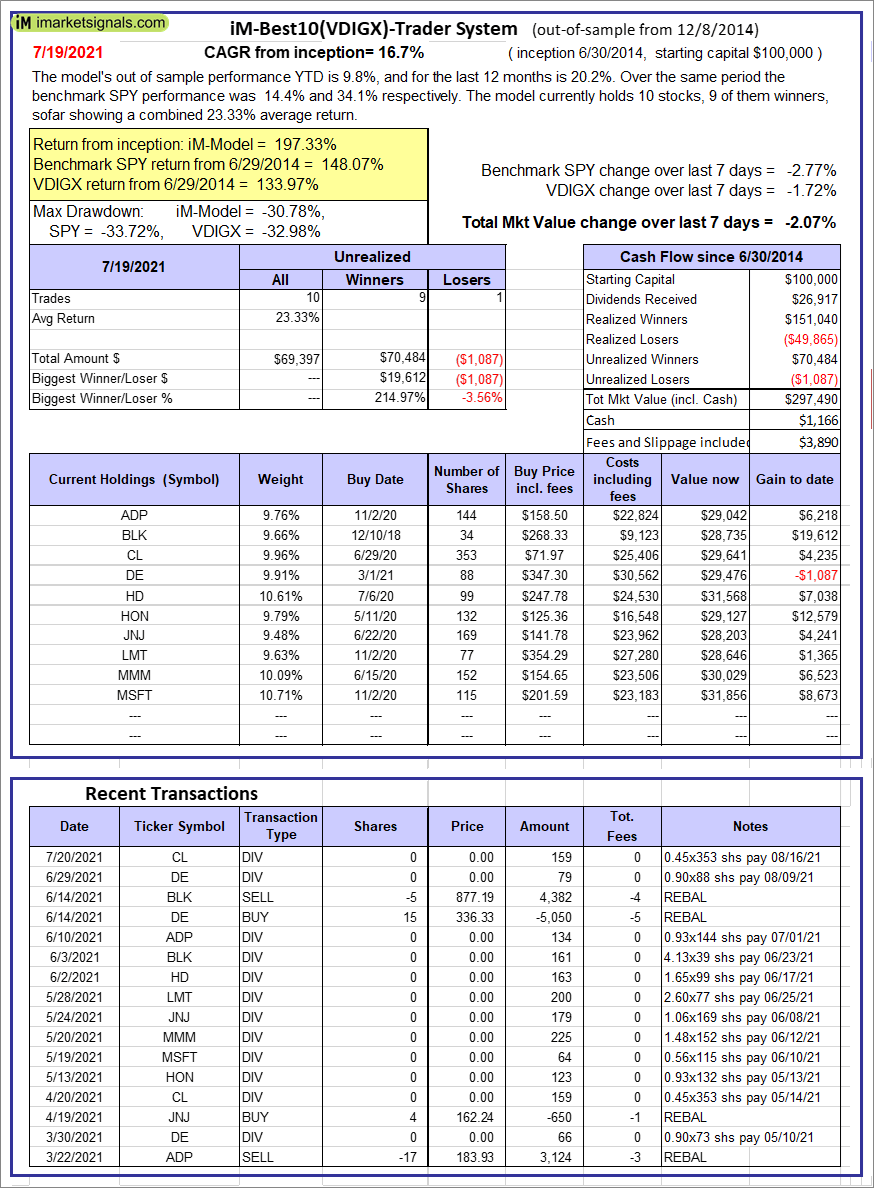 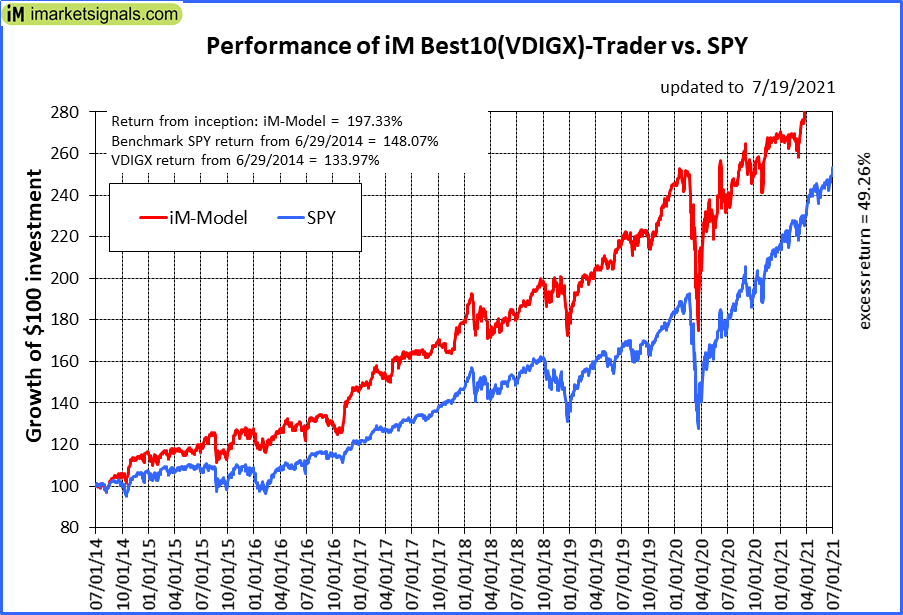 |
iM-Best10(VDIGX)-Trader: The model’s out of sample performance YTD is 9.8%, and for the last 12 months is 20.2%. Over the same period the benchmark SPY performance was 14.4% and 34.1% respectively. Since inception, on 7/1/2014, the model gained 197.33% while the benchmark SPY gained 148.07% and VDIGX gained 133.97% over the same period. Over the previous week the market value of iM-Best10(VDIGX) gained -2.07% at a time when SPY gained -2.77%. A starting capital of $100,000 at inception on 7/1/2014 would have grown to $297,490 which includes $1,166 cash and excludes $3,890 spent on fees and slippage. |
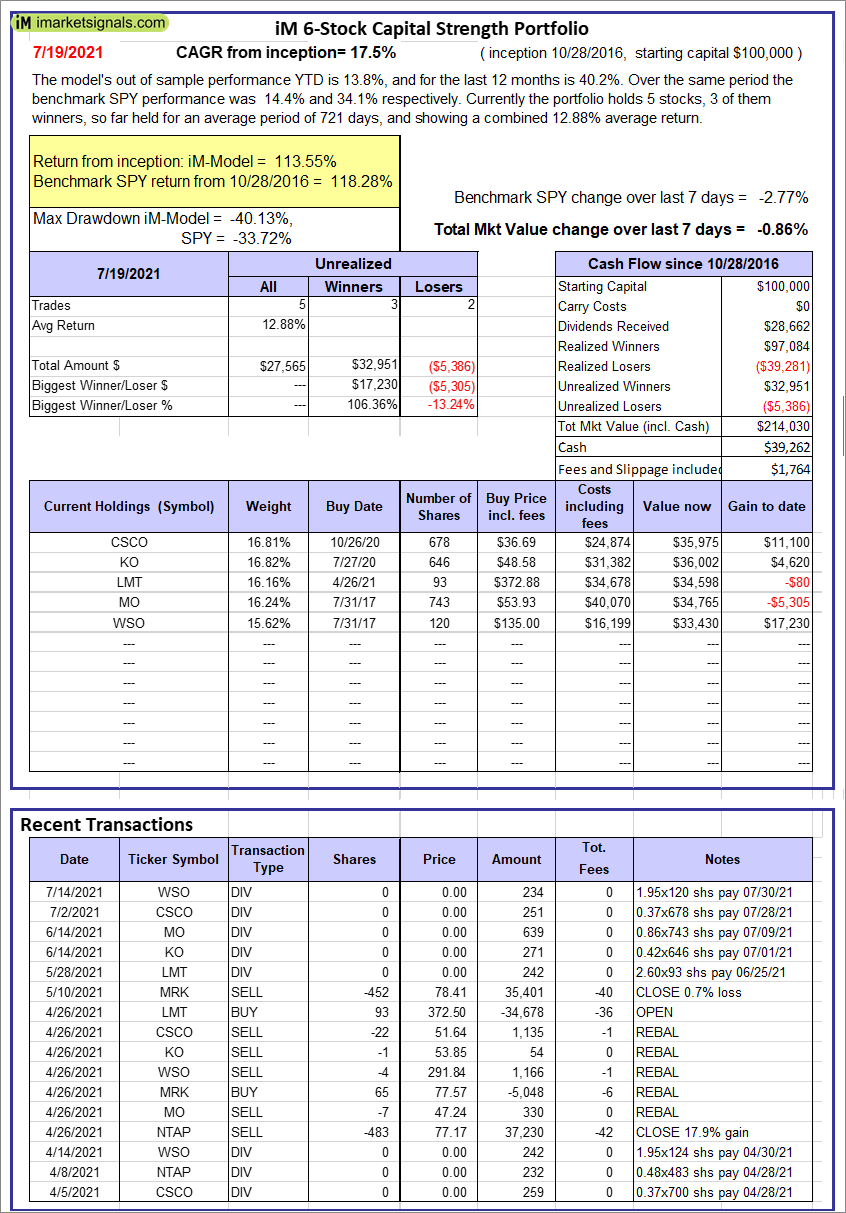 |
iM 6-Stock Capital Strength Portfolio: The model’s out of sample performance YTD is 13.8%, and for the last 12 months is 40.2%. Over the same period the benchmark SPY performance was 14.4% and 34.1% respectively. Over the previous week the market value of the iM 6-Stock Capital Strength Portfolio gained -0.86% at a time when SPY gained -2.77%. A starting capital of $100,000 at inception on 10/28/2016 would have grown to $214,030 which includes $39,262 cash and excludes $1,764 spent on fees and slippage. |
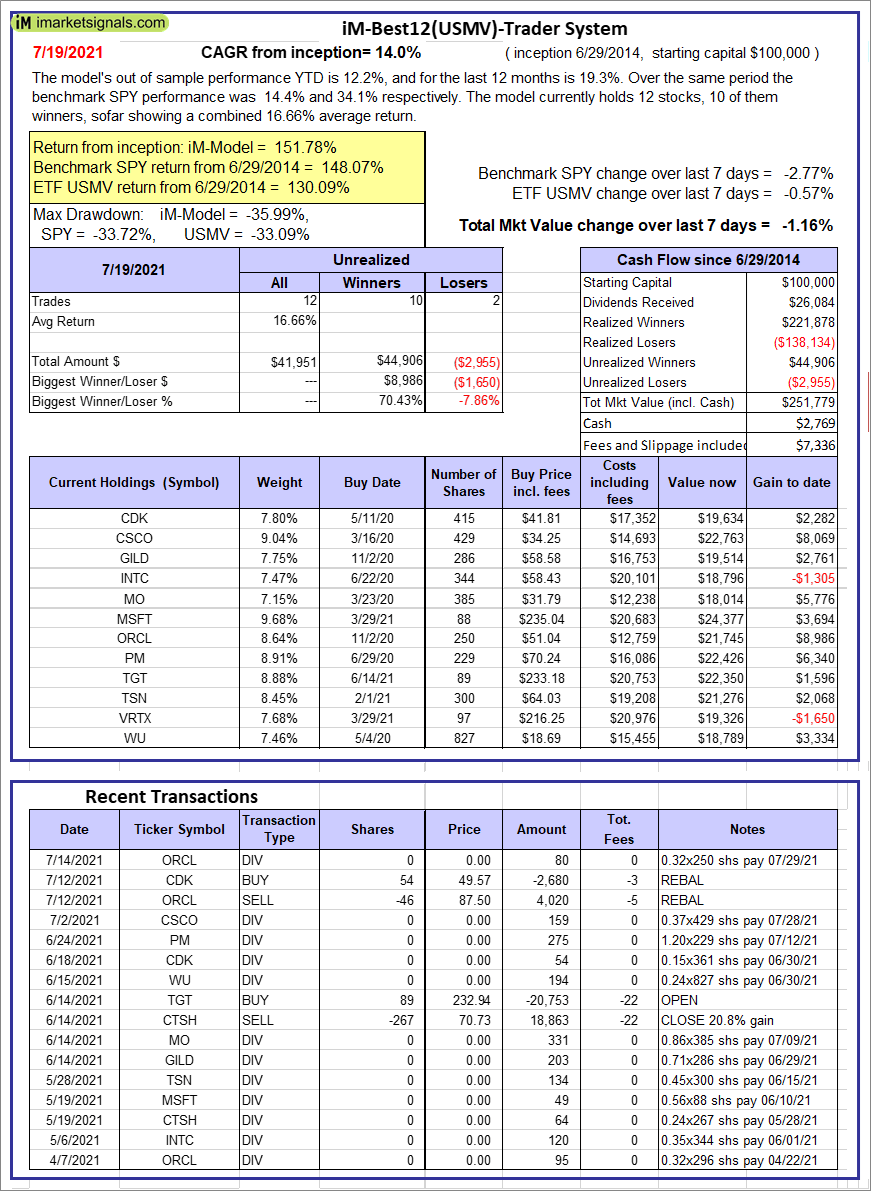 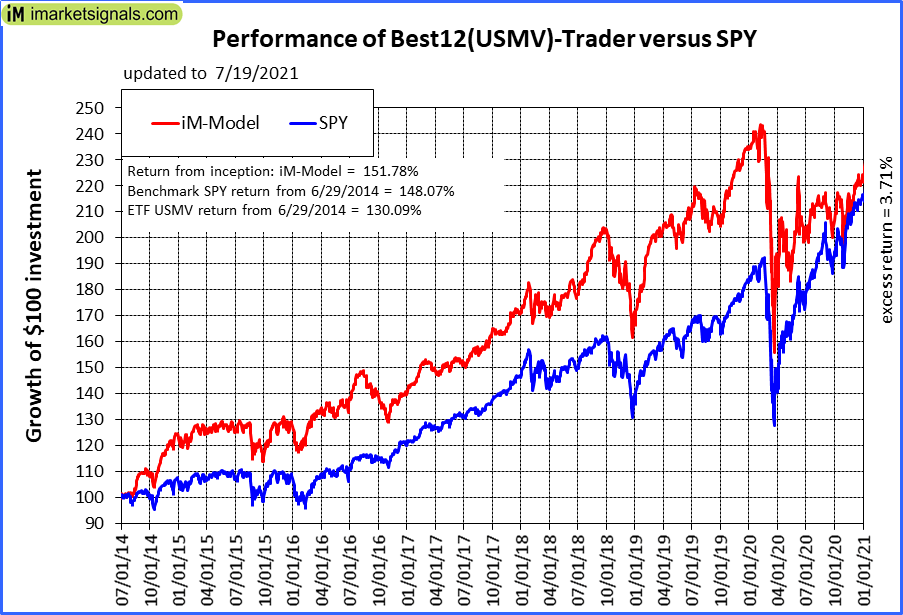 |
iM-Best12(USMV)-Trader: The model’s out of sample performance YTD is 12.2%, and for the last 12 months is 19.3%. Over the same period the benchmark SPY performance was 14.4% and 34.1% respectively. Since inception, on 6/30/2014, the model gained 151.78% while the benchmark SPY gained 148.07% and the ETF USMV gained 130.09% over the same period. Over the previous week the market value of iM-Best12(USMV)-Trader gained -1.16% at a time when SPY gained -2.77%. A starting capital of $100,000 at inception on 6/30/2014 would have grown to $251,779 which includes $2,769 cash and excludes $7,336 spent on fees and slippage. |
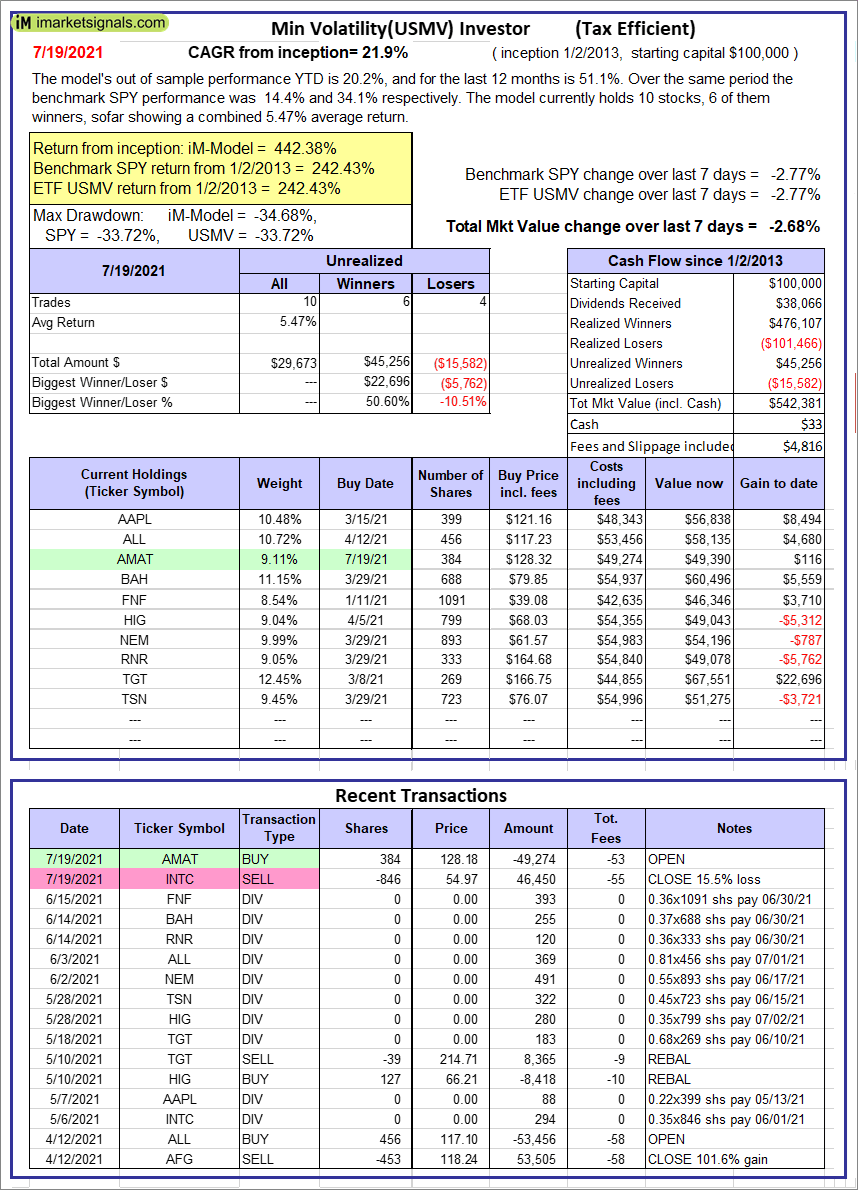  |
iM-Min Volatility(USMV) Investor (Tax Efficient): The model’s out of sample performance YTD is 20.2%, and for the last 12 months is 51.1%. Over the same period the benchmark SPY performance was 14.4% and 34.1% respectively. Since inception, on 1/3/2013, the model gained 442.38% while the benchmark SPY gained 242.43% and the ETF USMV gained 242.43% over the same period. Over the previous week the market value of iM-Best12(USMV)Q1 gained -2.68% at a time when SPY gained -2.77%. A starting capital of $100,000 at inception on 1/3/2013 would have grown to $542,381 which includes $33 cash and excludes $4,816 spent on fees and slippage. |
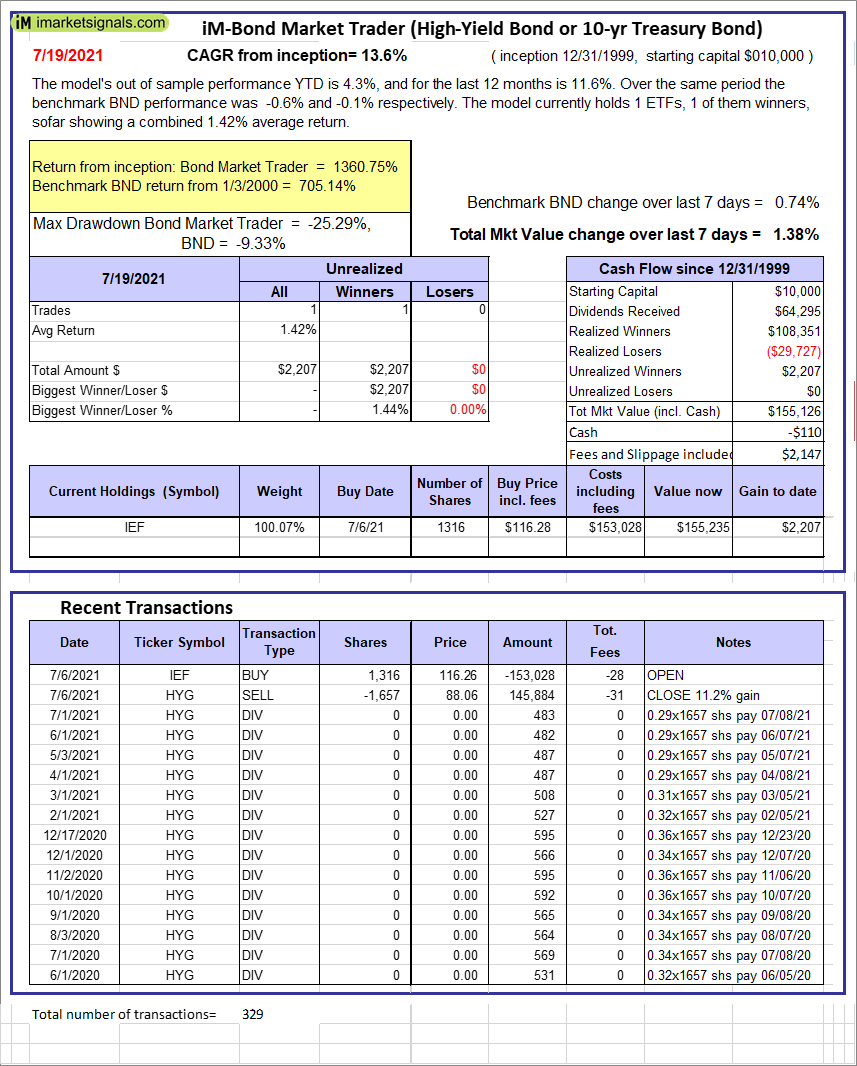 |
iM-Bond Market Trader (High-Yield Bond or 10-yr Treasury Bond): The model’s out of sample performance YTD is 4.3%, and for the last 12 months is 11.6%. Over the same period the benchmark BND performance was -0.6% and -0.1% respectively. Over the previous week the market value of the iM-Bond Market Trader (High-Yield Bond or 10-yr Treasury Bond) gained 1.38% at a time when BND gained 0.74%. A starting capital of $10,000 at inception on 1/3/2000 would have grown to $155,126 which includes -$110 cash and excludes $2,147 spent on fees and slippage. |
|
|
iM-ModSum/YieldCurve Timer: The model’s out of sample performance YTD is 16.1%, and for the last 12 months is 35.9%. Over the same period the benchmark SPY performance was 14.4% and 34.1% respectively. Over the previous week the market value of iM-PortSum/YieldCurve Timer gained 1.37% at a time when SPY gained -2.77%. A starting capital of $100,000 at inception on 1/1/2016 would have grown to $300,261 which includes $3,237 cash and excludes $862 spent on fees and slippage. |
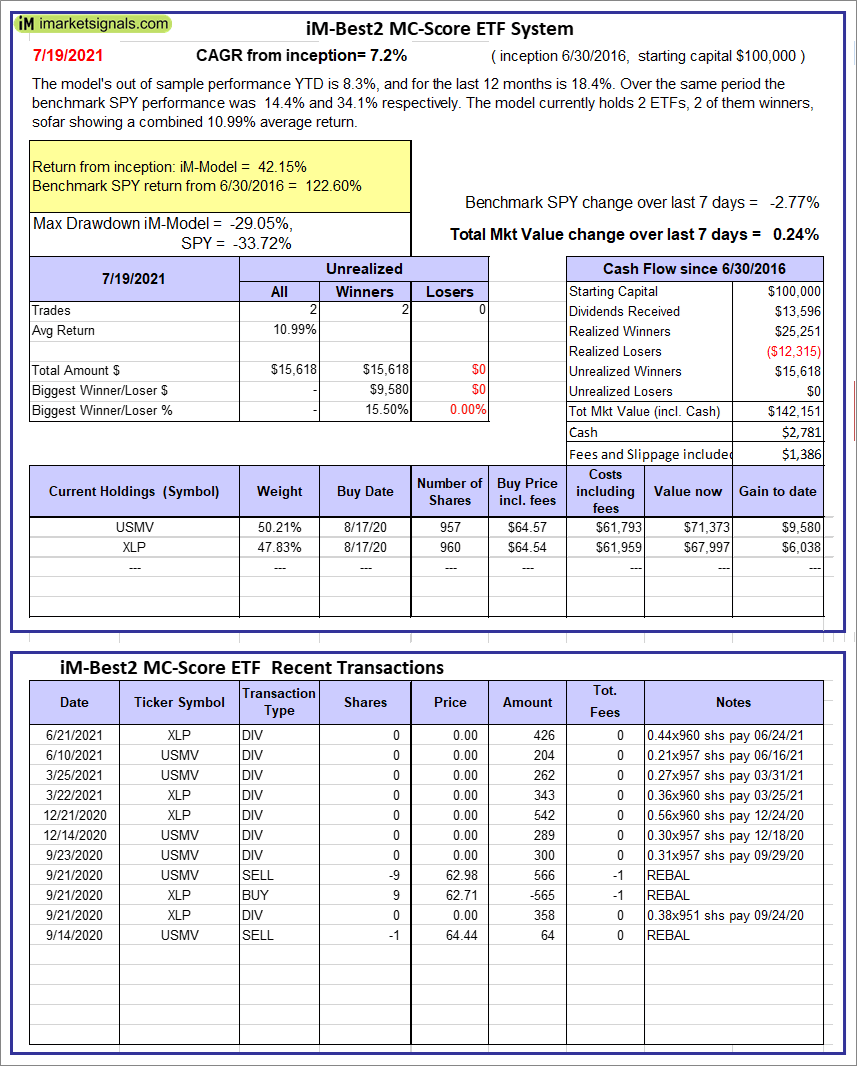 |
iM-Best2 MC-Score ETF System: The model’s out of sample performance YTD is 8.3%, and for the last 12 months is 18.4%. Over the same period the benchmark SPY performance was 14.4% and 34.1% respectively. Over the previous week the market value of the iM-Best2 MC-Score ETF System gained 0.24% at a time when SPY gained -2.77%. A starting capital of $100,000 at inception on 6/30/2016 would have grown to $142,151 which includes $2,781 cash and excludes $1,386 spent on fees and slippage. |
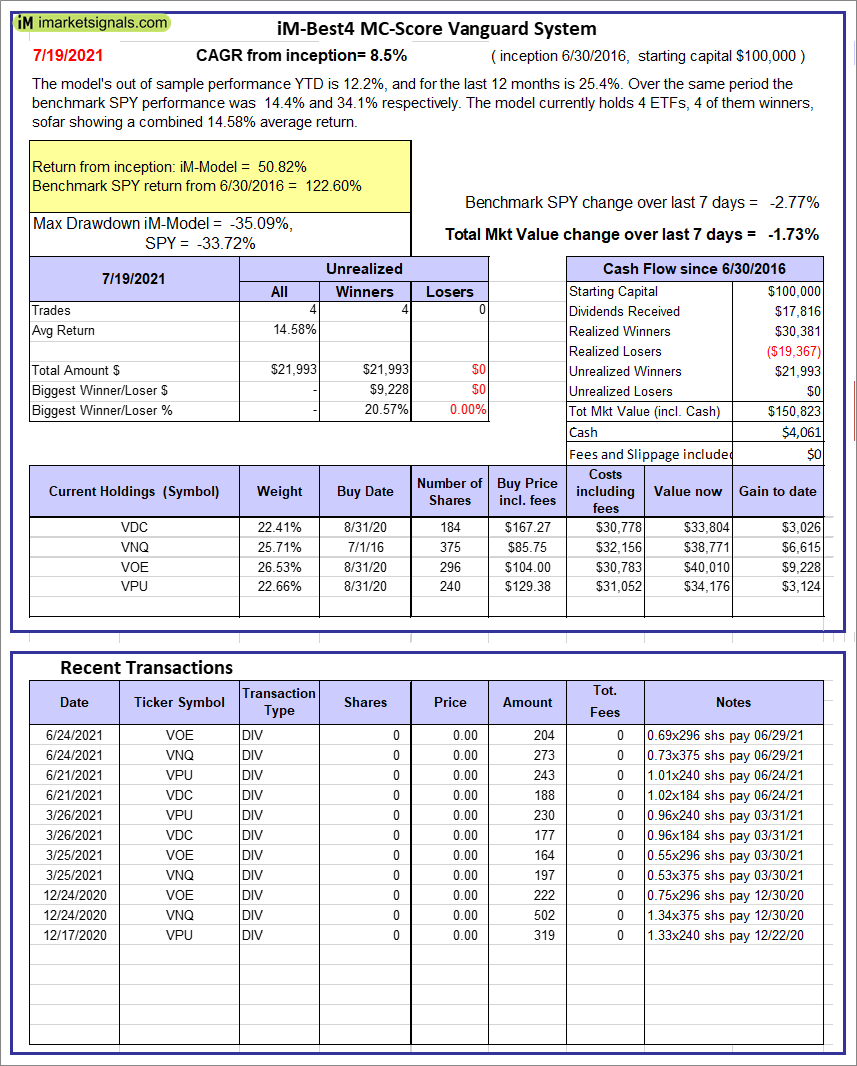 |
iM-Best4 MC-Score Vanguard System: The model’s out of sample performance YTD is 12.2%, and for the last 12 months is 25.4%. Over the same period the benchmark SPY performance was 14.4% and 34.1% respectively. Over the previous week the market value of the iM-Best4 MC-Score Vanguard System gained -1.73% at a time when SPY gained -2.77%. A starting capital of $100,000 at inception on 6/30/2016 would have grown to $150,823 which includes $4,061 cash and excludes $00 spent on fees and slippage. |
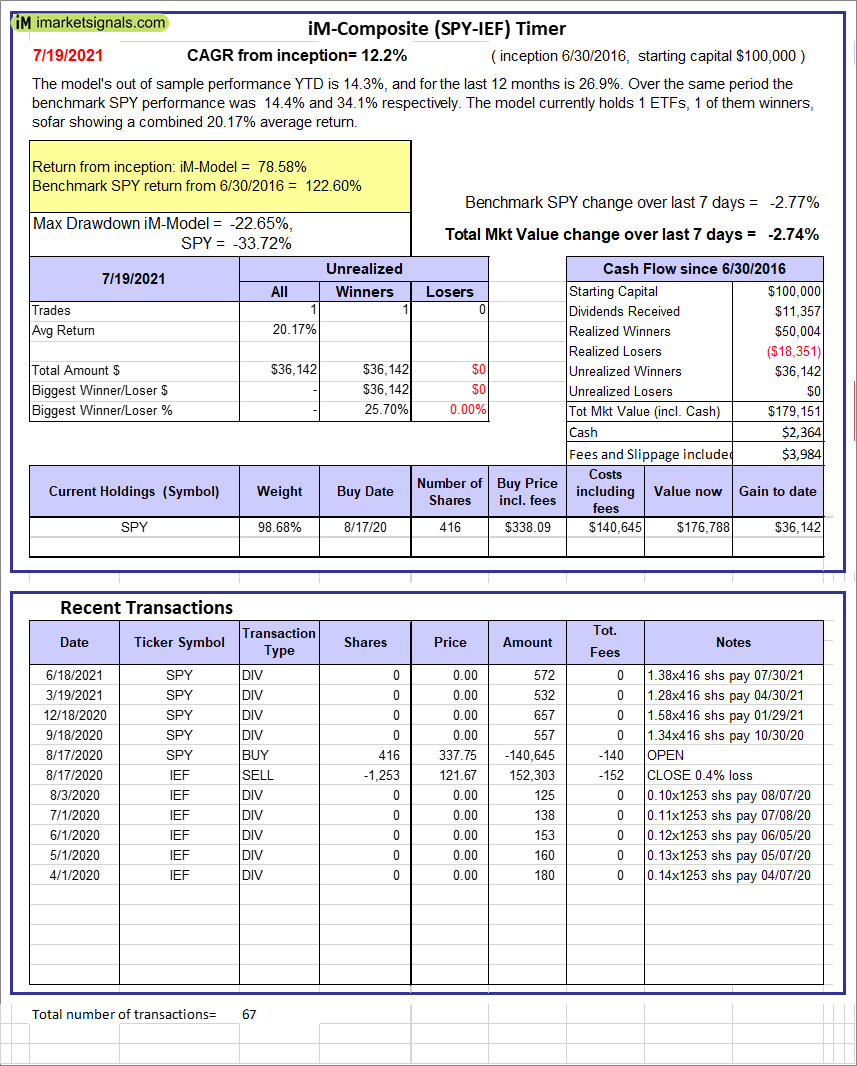 |
iM-Composite (SPY-IEF) Timer: The model’s out of sample performance YTD is 14.3%, and for the last 12 months is 26.9%. Over the same period the benchmark SPY performance was 14.4% and 34.1% respectively. Over the previous week the market value of the iM-Composite (SPY-IEF) Timer gained -2.74% at a time when SPY gained -2.77%. A starting capital of $100,000 at inception on 6/30/2016 would have grown to $179,151 which includes $2,364 cash and excludes $3,984 spent on fees and slippage. |
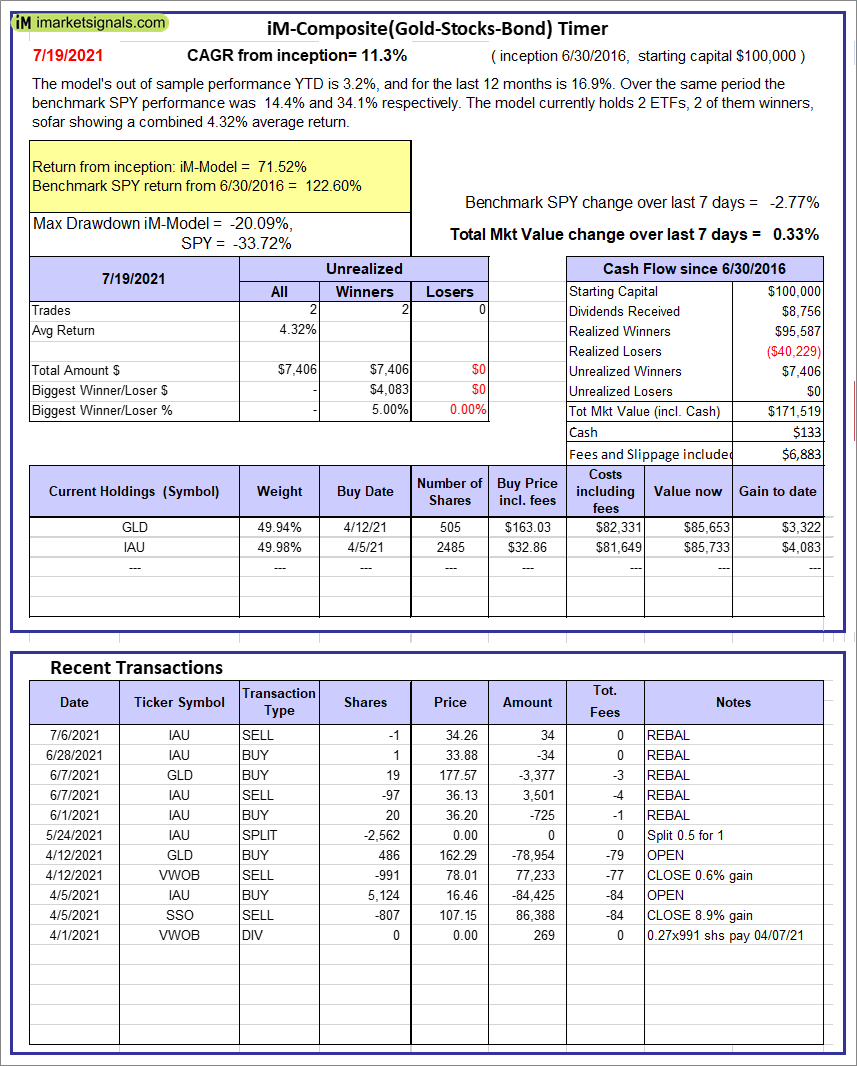 |
iM-Composite(Gold-Stocks-Bond) Timer: The model’s out of sample performance YTD is 3.2%, and for the last 12 months is 16.9%. Over the same period the benchmark SPY performance was 14.4% and 34.1% respectively. Over the previous week the market value of the iM-Composite(Gold-Stocks-Bond) Timer gained 0.33% at a time when SPY gained -2.77%. A starting capital of $100,000 at inception on 6/30/2016 would have grown to $171,519 which includes $133 cash and excludes $6,883 spent on fees and slippage. |
iM-Best Reports – 7/19/21
Posted in pmp SPY-SH
Leave a Reply
You must be logged in to post a comment.