
  |
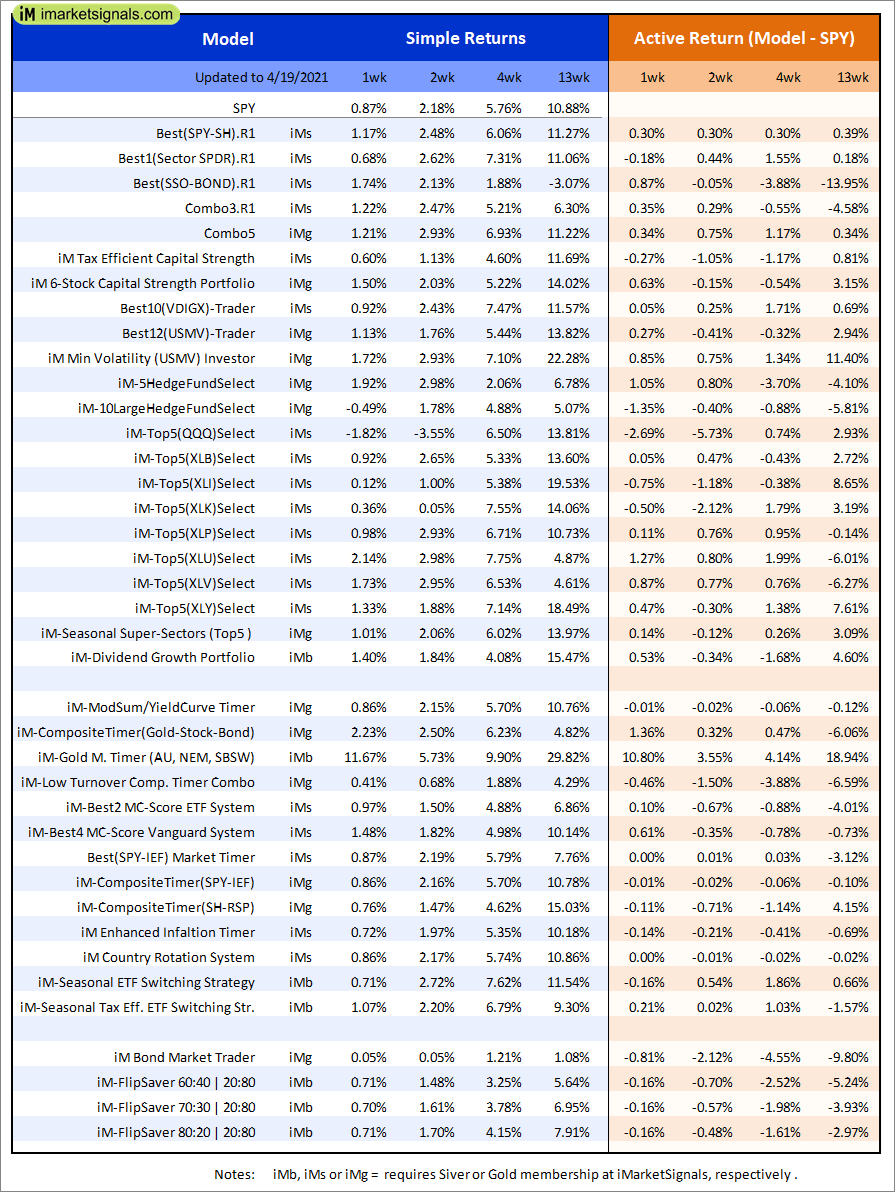
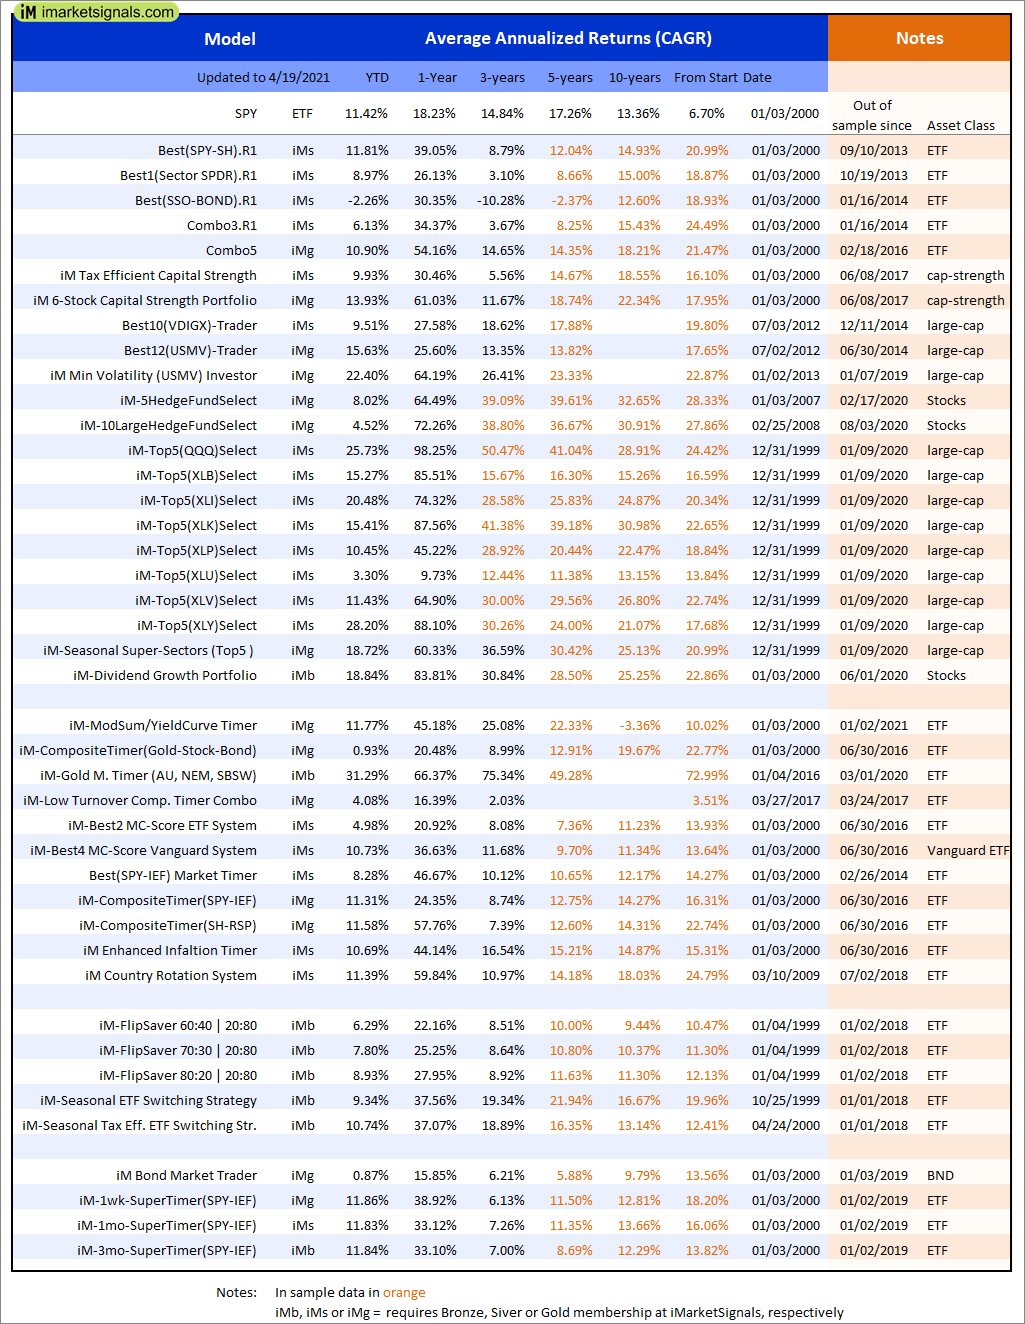
Out of sample performance summary of our models for the past 1, 2, 4 and 13 week periods. The active active return indicates how the models over- or underperformed the benchmark ETF SPY. Also the YTD, and the 1-, 3-, 5- and 10-year annualized returns are shown in the second table |
 |
iM-FlipSaver 60:40 | 20:80 – 2017: The model’s out of sample performance YTD is 6.6%, and for the last 12 months is 22.5%. Over the same period the benchmark E60B40 performance was 5.5% and 26.4% respectively. Over the previous week the market value of iM-FlipSaver 80:20 | 20:80 gained 0.70% at a time when SPY gained 0.63%. A starting capital of $100,000 at inception on 7/16/2015 would have grown to $147,166 which includes $1,399 cash and excludes $1,783 spent on fees and slippage. |
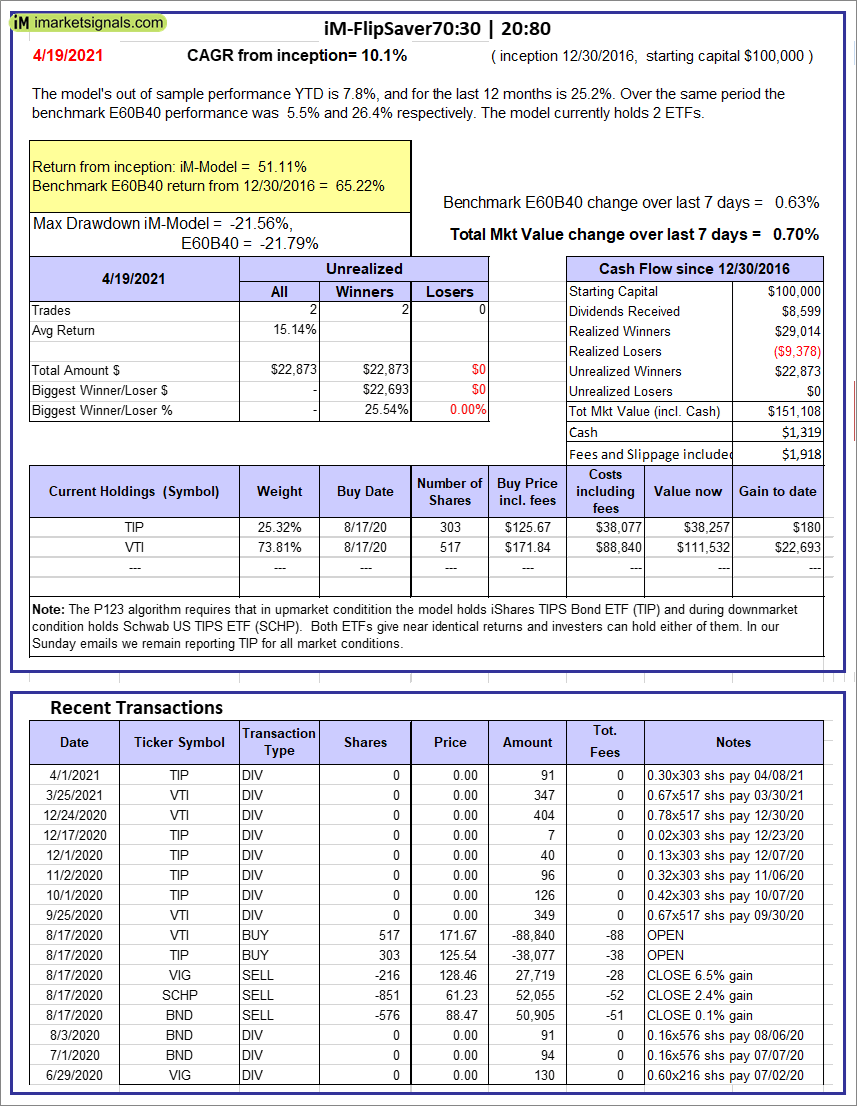 |
iM-FlipSaver 70:30 | 20:80 – 2017: The model’s out of sample performance YTD is 7.8%, and for the last 12 months is 25.2%. Over the same period the benchmark E60B40 performance was 5.5% and 26.4% respectively. Over the previous week the market value of iM-FlipSaver 70:30 | 20:80 gained 0.70% at a time when SPY gained 0.63%. A starting capital of $100,000 at inception on 7/15/2015 would have grown to $151,108 which includes $1,319 cash and excludes $1,918 spent on fees and slippage. |
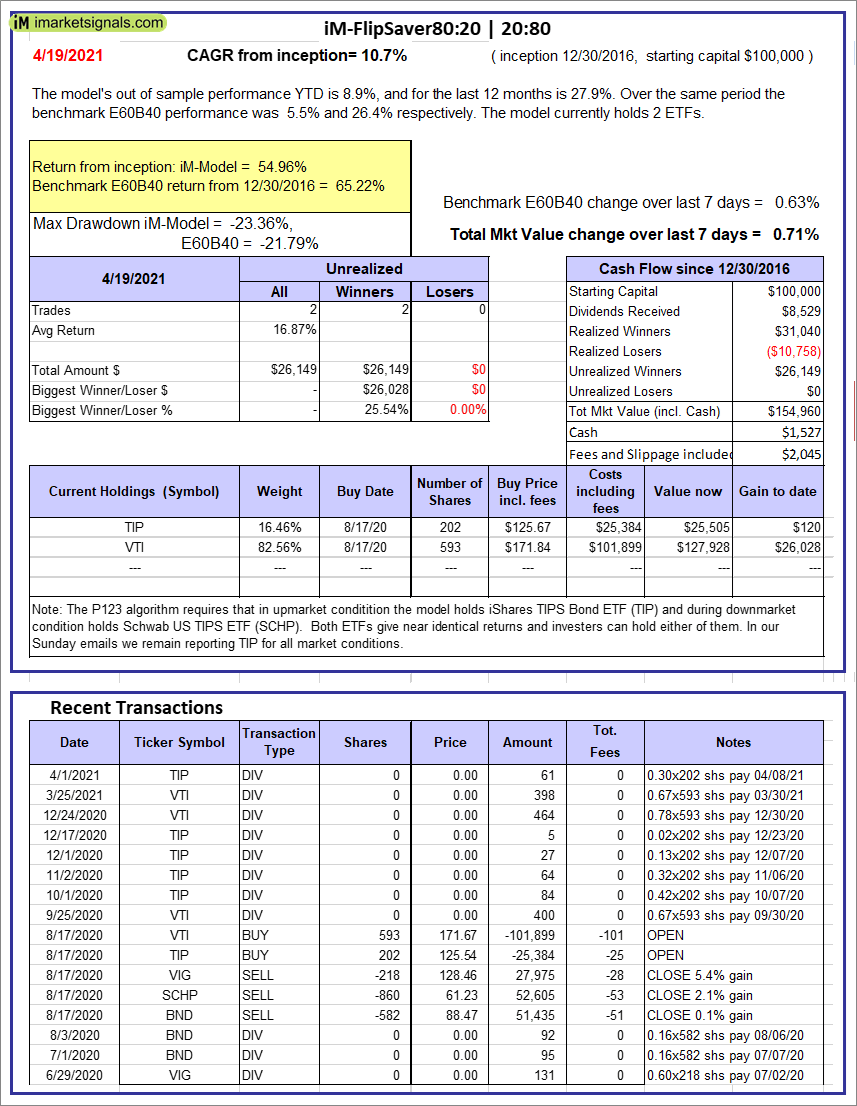 |
iM-FlipSaver 80:20 | 20:80 – 2017: The model’s out of sample performance YTD is 8.9%, and for the last 12 months is 27.9%. Over the same period the benchmark E60B40 performance was 5.5% and 26.4% respectively. Over the previous week the market value of iM-FlipSaver 80:20 | 20:80 gained 0.71% at a time when SPY gained 0.63%. A starting capital of $100,000 at inception on 1/2/2017 would have grown to $154,960 which includes $1,527 cash and excludes $2,045 spent on fees and slippage. |
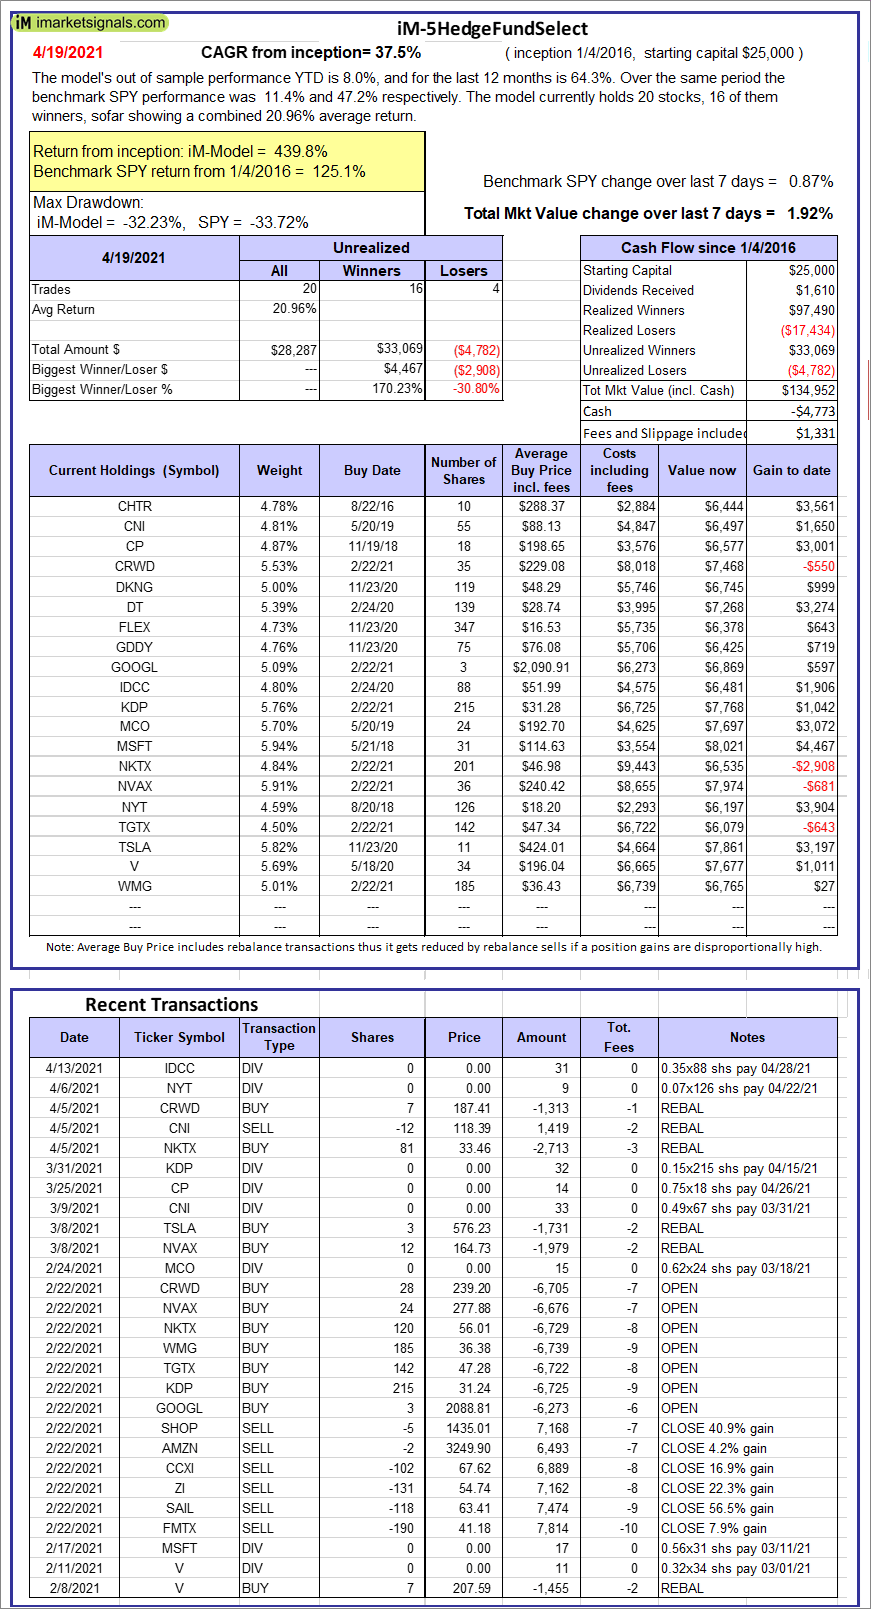  |
iM-5HedgeFundSelect: Since inception, on 1/5/2016, the model gained 439.81% while the benchmark SPY gained 125.05% over the same period. Over the previous week the market value of iM-5HedgeFundSelect gained 1.92% at a time when SPY gained 0.87%. A starting capital of $25,000 at inception on 1/5/2016 would have grown to $134,952 which includes -$4,773 cash and excludes $1,331 spent on fees and slippage. |
 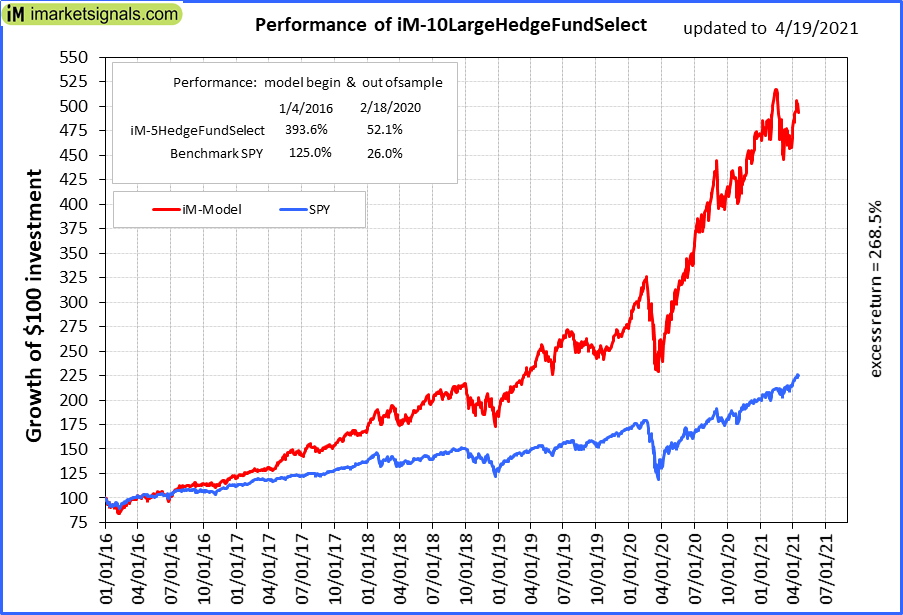 |
iM-10LargeHedgeFundSelect: Since inception, on 1/5/2016, the model gained 393.56% while the benchmark SPY gained 125.05% over the same period. Over the previous week the market value of iM-10LargeHedgeFundSelect gained -0.49% at a time when SPY gained 0.87%. A starting capital of $25,000 at inception on 1/5/2016 would have grown to $123,390 which includes $158 cash and excludes $750 spent on fees and slippage. |
 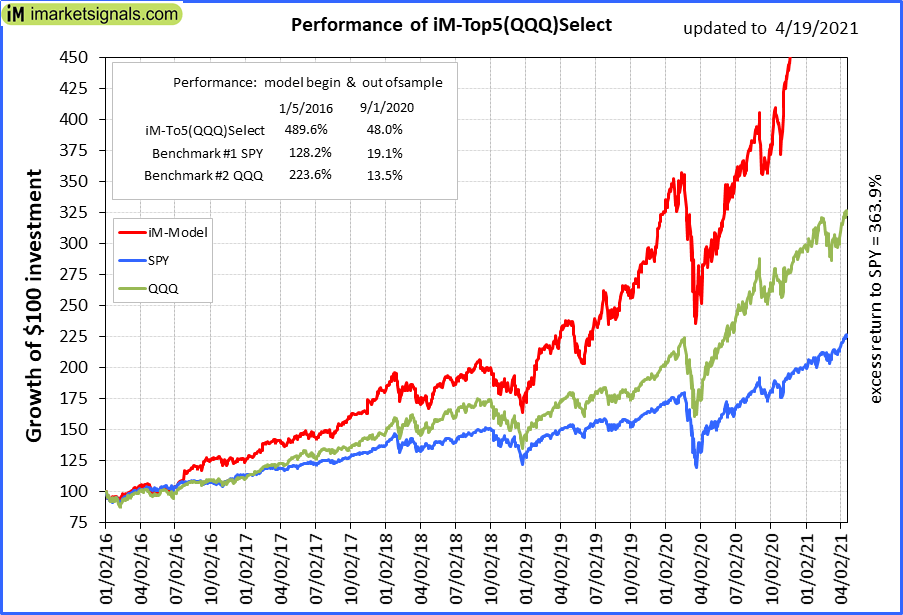 |
iM-Top5(QQQ)Select: Since inception, on 1/5/2016, the model gained 488.96% while the benchmark SPY gained 125.05% over the same period. Over the previous week the market value of iM-Top5(QQQ)Select gained 0.36% at a time when SPY gained 0.87%. A starting capital of $100,000 at inception on 1/5/2016 would have grown to $588,964 which includes $12 cash and excludes $6,995 spent on fees and slippage. |
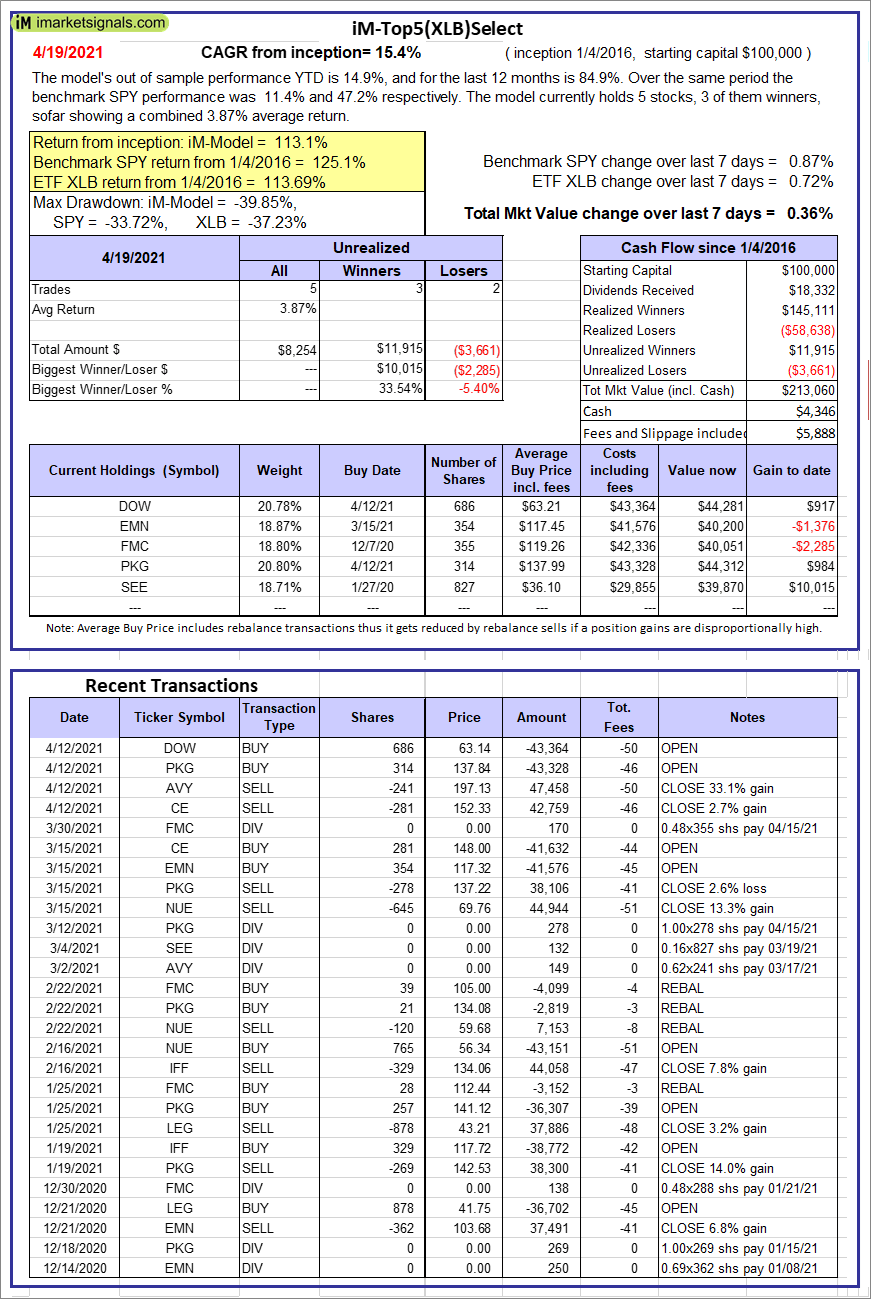 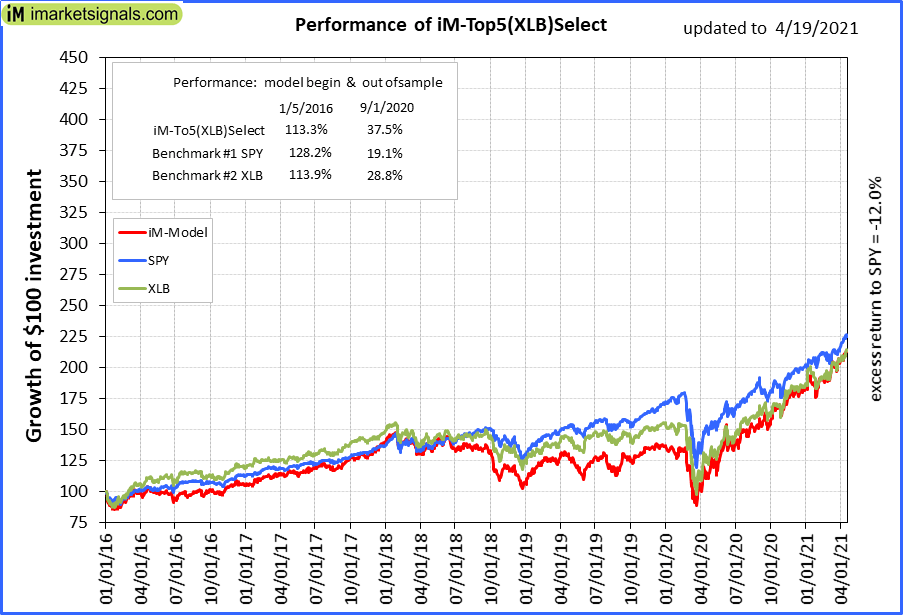 |
iM-Top5(XLB)Select: Since inception, on 1/5/2016, the model gained 113.06% while the benchmark SPY gained 125.05% over the same period. Over the previous week the market value of iM-Top5(XLB)Select gained 0.36% at a time when SPY gained 0.87%. A starting capital of $100,000 at inception on 1/5/2016 would have grown to $213,060 which includes $4,346 cash and excludes $5,888 spent on fees and slippage. |
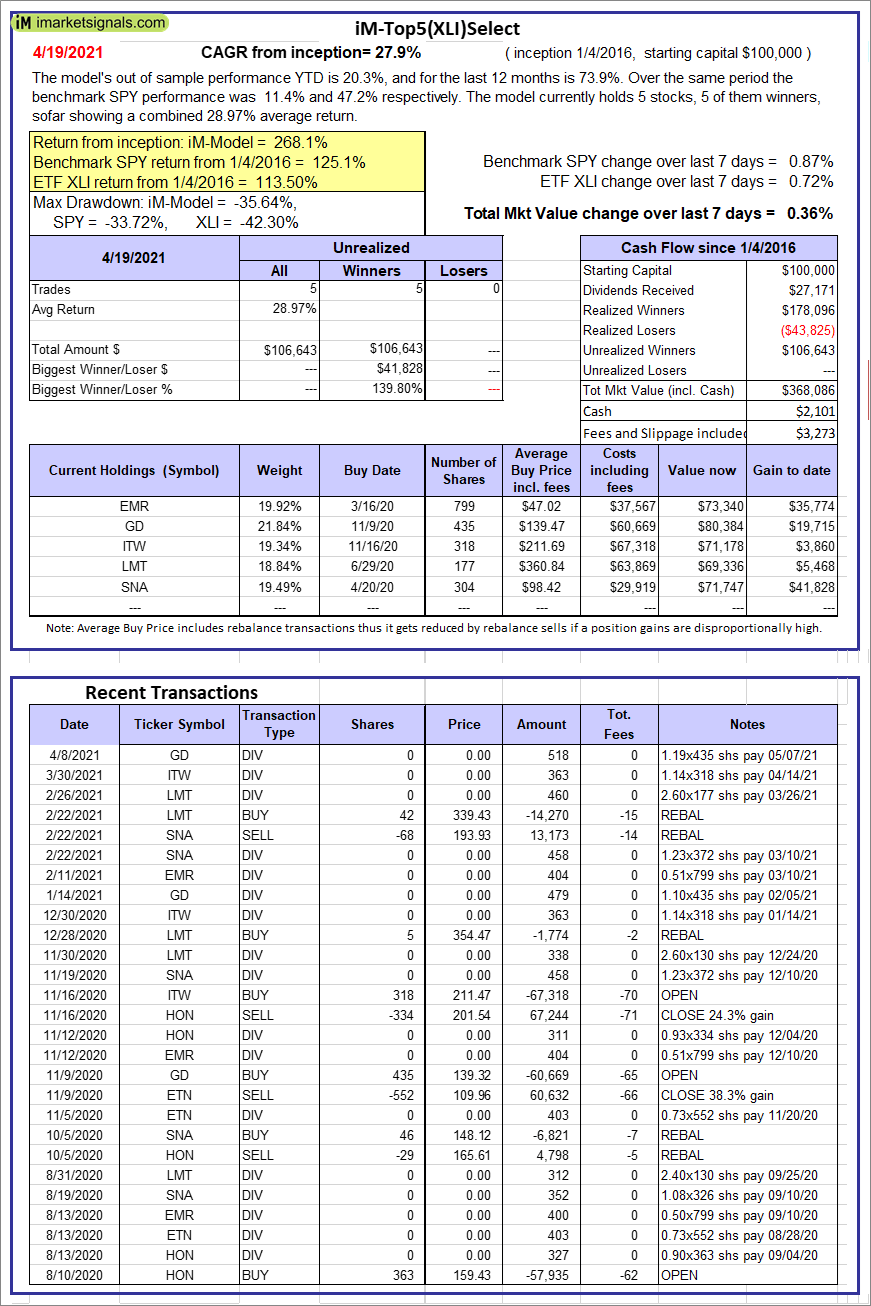 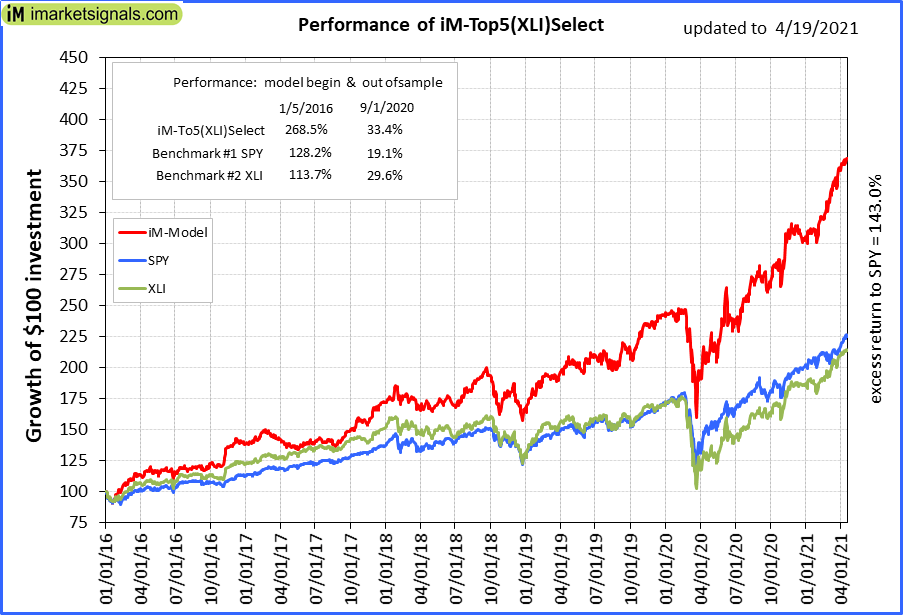 |
iM-Top5(XLI)Select: Since inception, on 1/5/2016, the model gained 268.09% while the benchmark SPY gained 125.05% over the same period. Over the previous week the market value of iM-Top5(XLI)Select gained 0.36% at a time when SPY gained 0.87%. A starting capital of $100,000 at inception on 1/5/2016 would have grown to $368,086 which includes $2,101 cash and excludes $3,273 spent on fees and slippage. |
  |
iM-Top5(XLK)Select: Since inception, on 1/5/2016, the model gained 457.51% while the benchmark SPY gained 125.05% over the same period. Over the previous week the market value of iM-Top5(XLK)Select gained 0.36% at a time when SPY gained 0.87%. A starting capital of $100,000 at inception on 1/5/2016 would have grown to $557,505 which includes $4,109 cash and excludes $1,573 spent on fees and slippage. |
 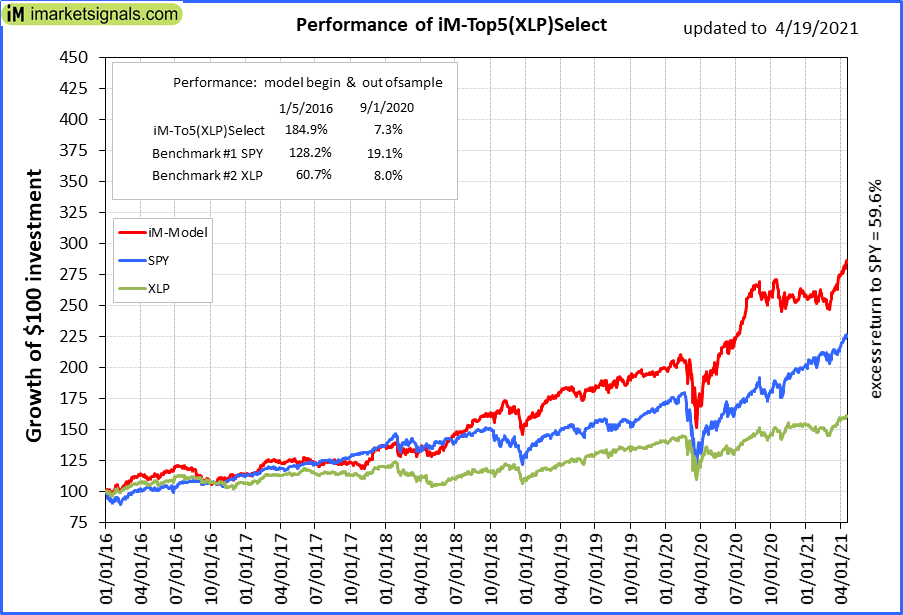 |
iM-Top5(XLP)Select: Since inception, on 1/5/2016, the model gained 184.60% while the benchmark SPY gained 125.05% over the same period. Over the previous week the market value of iM-Top5(XLP)Select gained 0.97% at a time when SPY gained 0.87%. A starting capital of $100,000 at inception on 1/5/2016 would have grown to $284,911 which includes $817 cash and excludes $1,257 spent on fees and slippage. |
 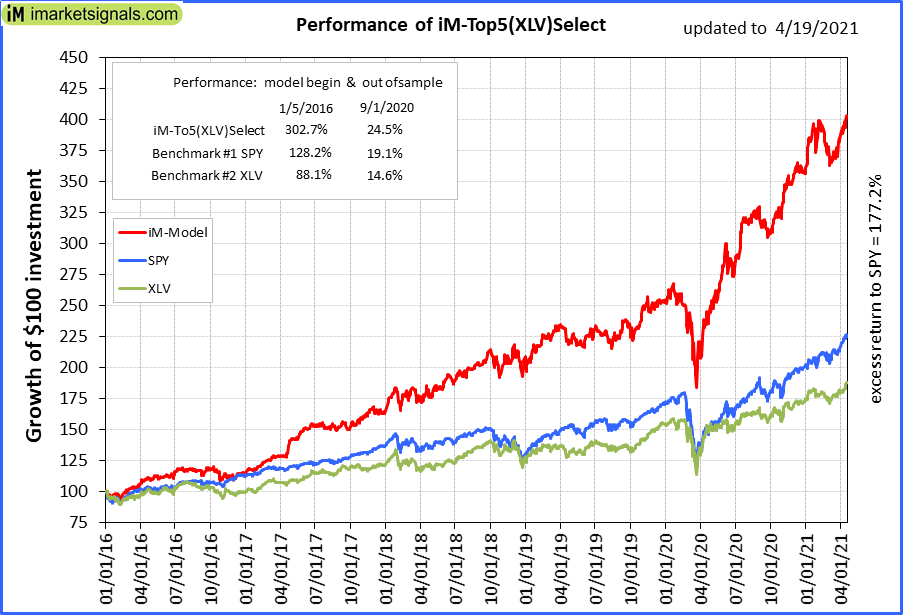 |
iM-Top5(XLV)Select: Since inception, on 1/5/2016, the model gained 302.23% while the benchmark SPY gained 125.05% over the same period. Over the previous week the market value of iM-Top5(XLV)Select gained 0.36% at a time when SPY gained 0.87%. A starting capital of $100,000 at inception on 1/5/2016 would have grown to $402,227 which includes $1,096 cash and excludes $5,075 spent on fees and slippage. |
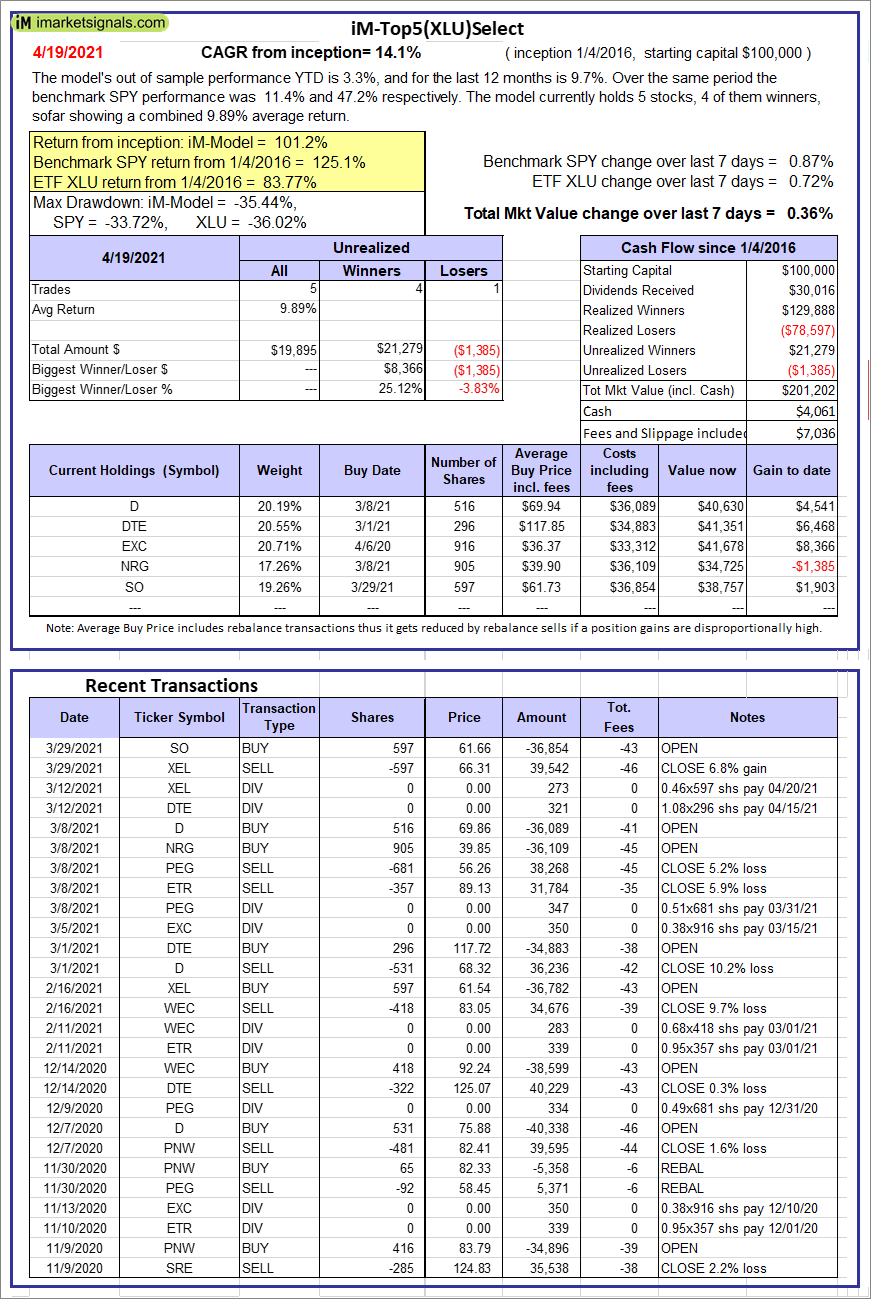 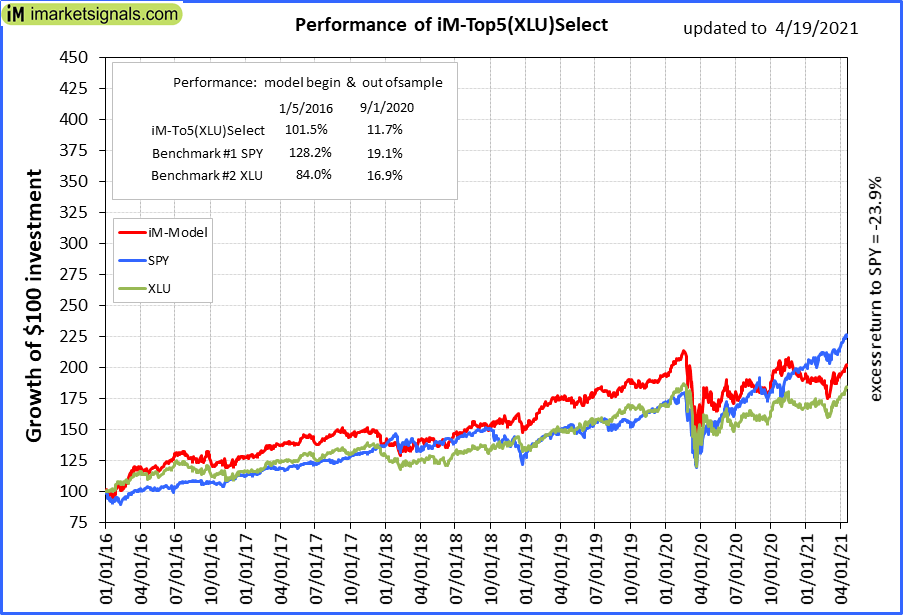 |
iM-Top5(XLU)Select: Since inception, on 1/5/2016, the model gained 101.20% while the benchmark SPY gained 125.05% over the same period. Over the previous week the market value of iM-Top5(XLU)Select gained 0.36% at a time when SPY gained 0.87%. A starting capital of $100,000 at inception on 1/5/2016 would have grown to $201,202 which includes $4,061 cash and excludes $7,036 spent on fees and slippage. |
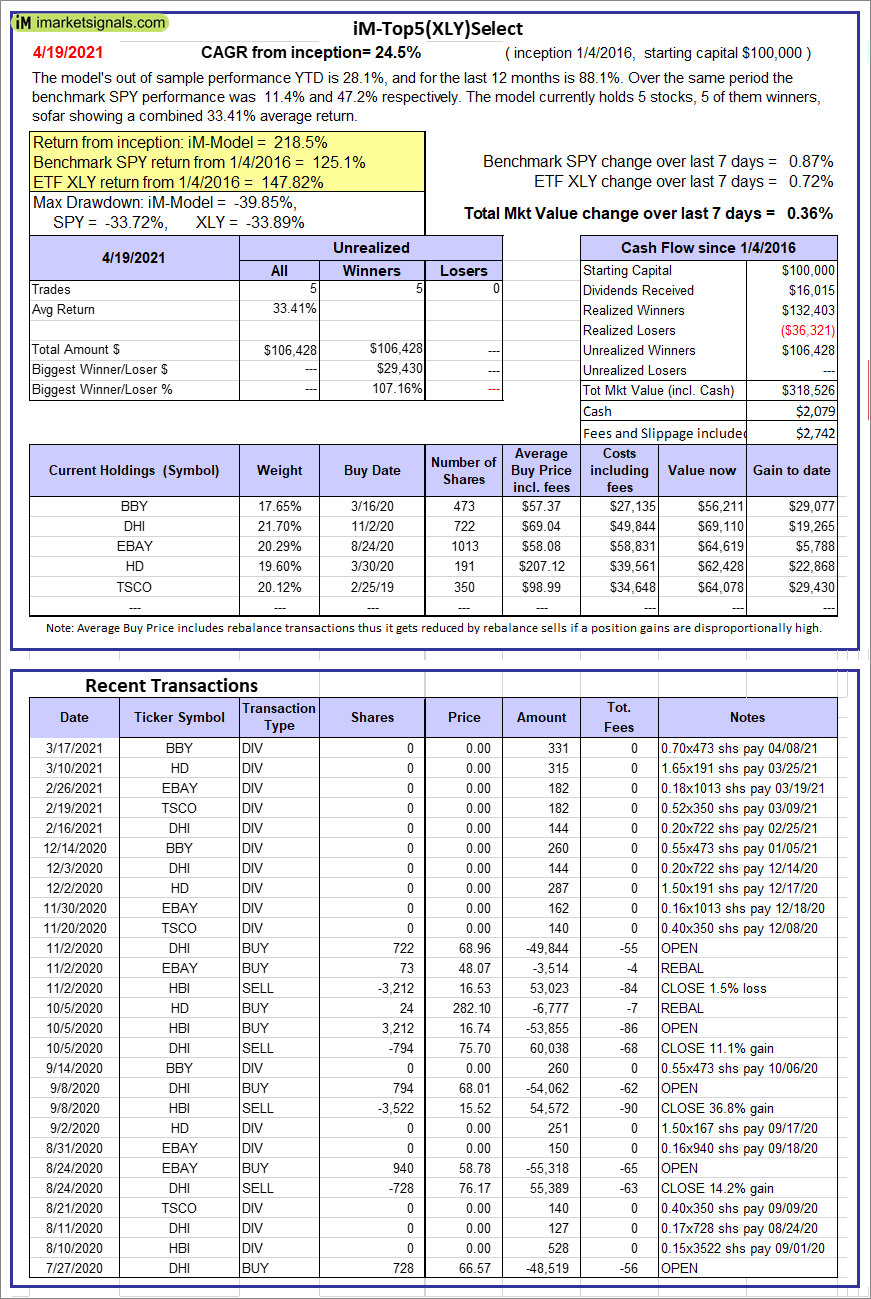 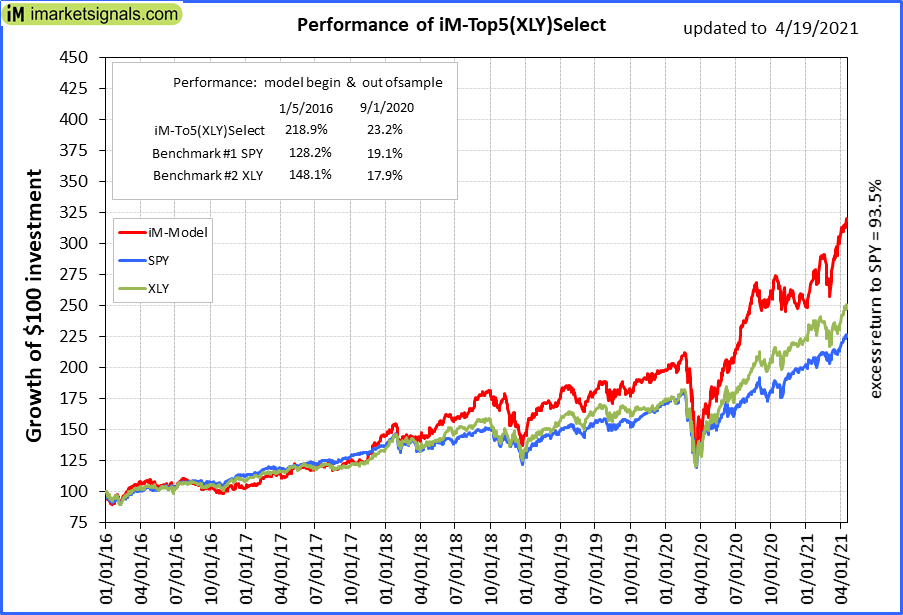 |
iM-Top5(XLY)Select: Since inception, on 1/5/2016, the model gained 218.53% while the benchmark SPY gained 125.05% over the same period. Over the previous week the market value of iM-Top5(XLY)Select gained 0.36% at a time when SPY gained 0.87%. A starting capital of $100,000 at inception on 1/5/2016 would have grown to $318,526 which includes $2,079 cash and excludes $2,742 spent on fees and slippage. |
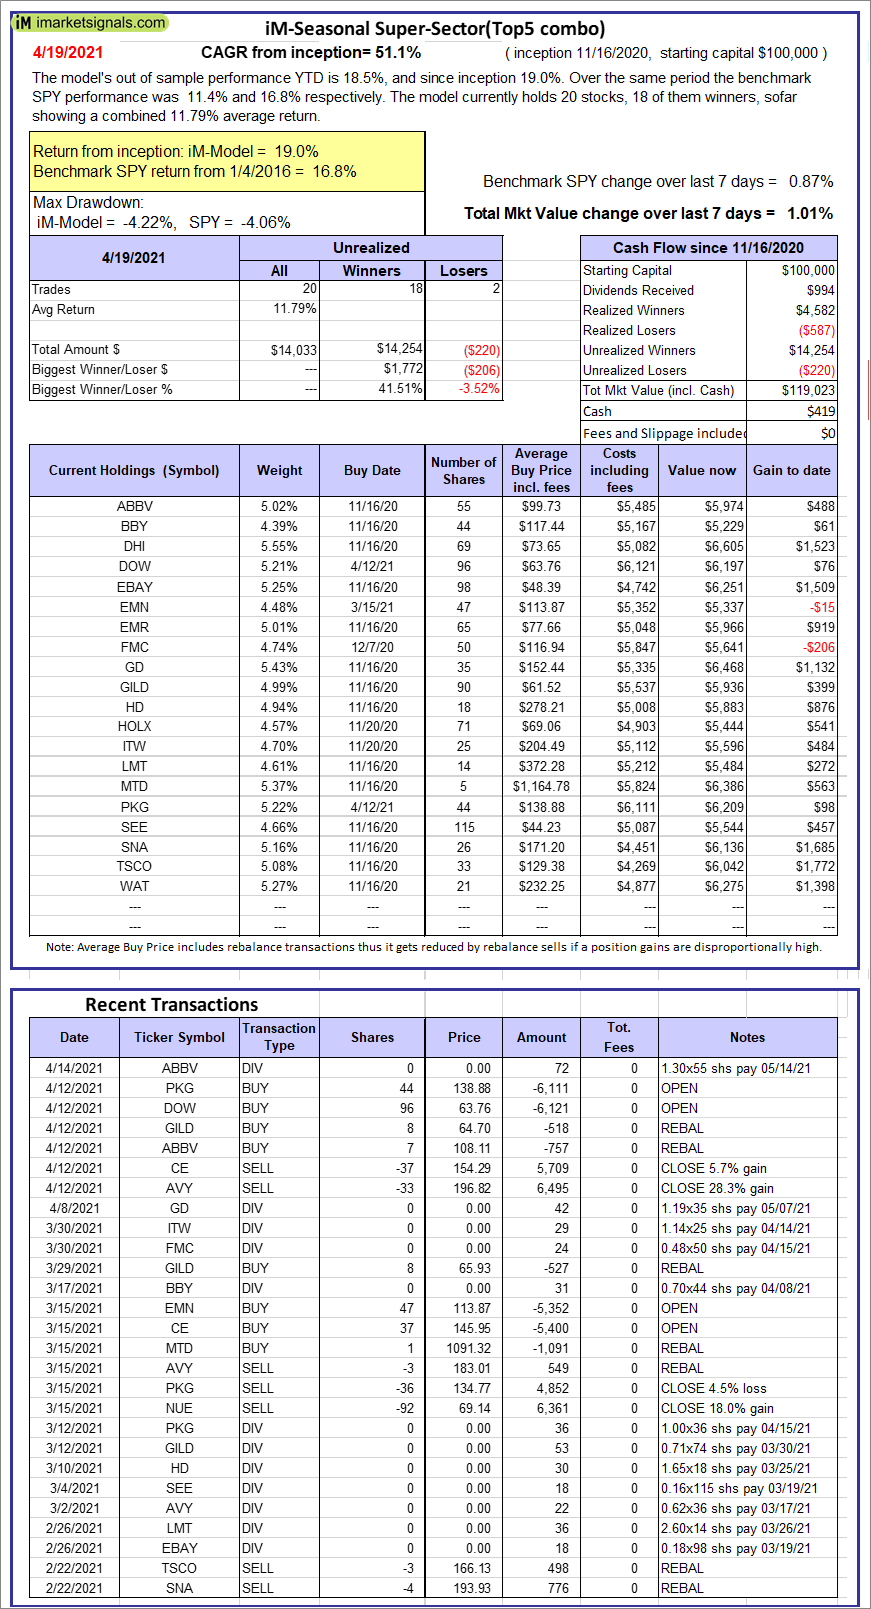 |
iM-Seasonal Super-Sectors (Top5 combo) : Since inception, on 11/17/2020, the model gained 19.02% while the benchmark SPY gained 16.82% over the same period. Over the previous week the market value of iM-Seasonal Super-Sectors (Top5 combo) gained 1.01% at a time when SPY gained 0.87%. A starting capital of $100,000 at inception on 11/17/2020 would have grown to $119,023 which includes $419 cash and excludes $00 spent on fees and slippage. |
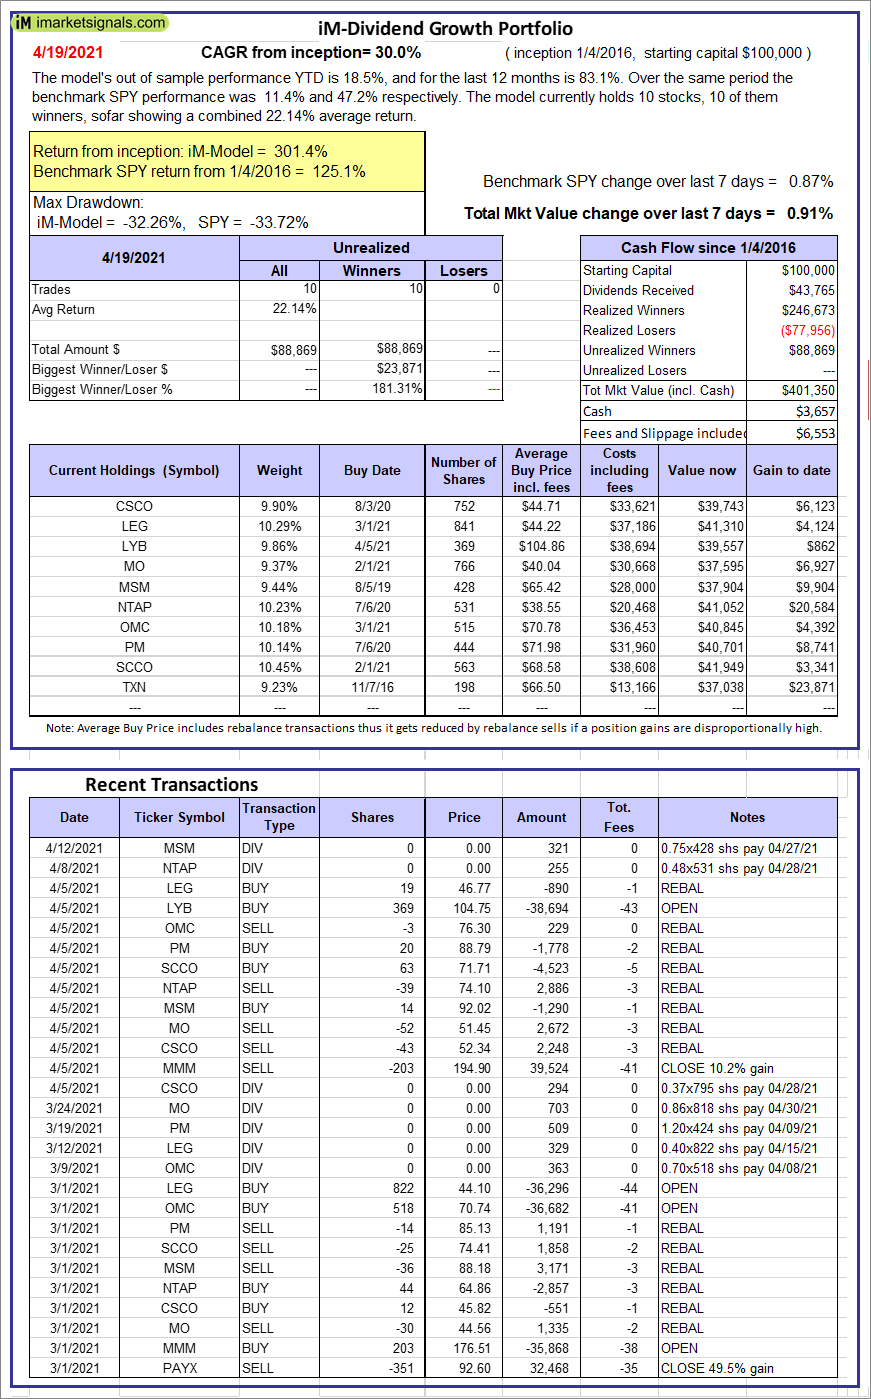 |
iM-Dividend Growth Portfolio: The model’s out of sample performance YTD is 18.5%, and for the last 12 months is 83.1%. Over the same period the benchmark SPY performance was 11.4% and 47.2% respectively. Over the previous week the market value of the iM-Dividend Growth Portfolio gained 0.91% at a time when SPY gained 0.87%. A starting capital of $100,000 at inception on 6/30/2016 would have grown to $401,350 which includes $3,657 cash and excludes $6,553 spent on fees and slippage. |
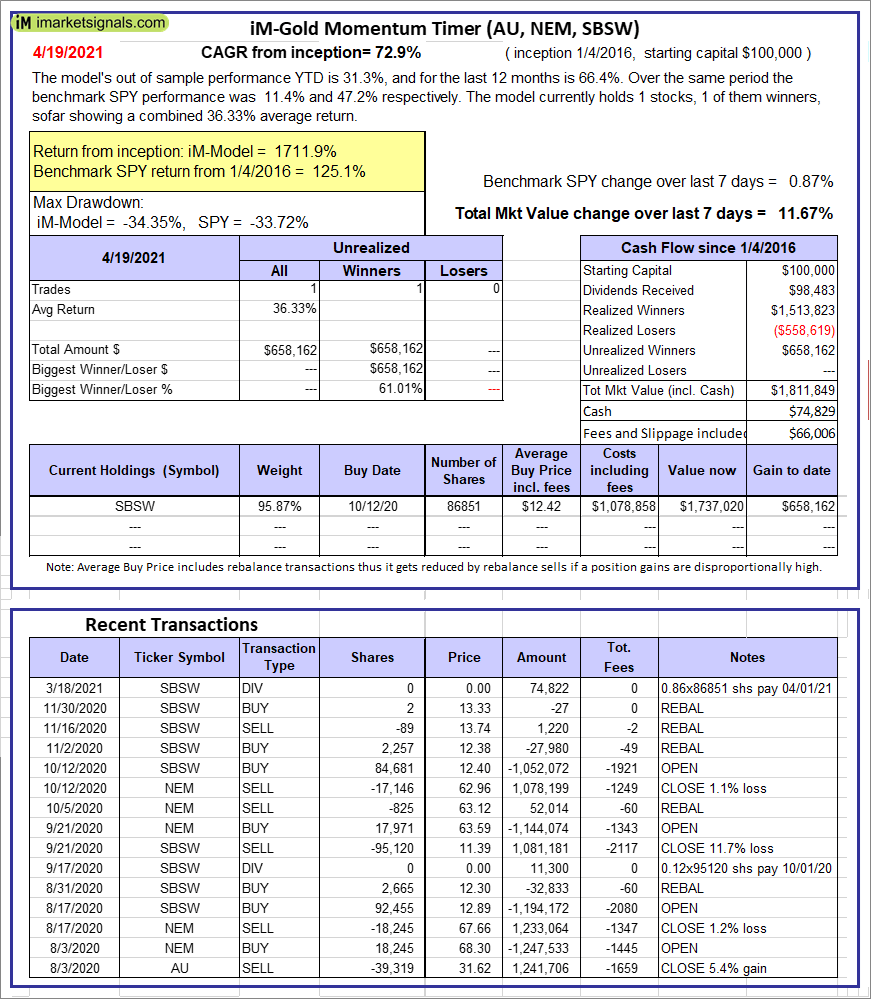 |
iM-Gold Momentum Timer (AU, NEM, SBSW): The model’s out of sample performance YTD is 31.3%, and for the last 12 months is 66.4%. Over the same period the benchmark SPY performance was 11.4% and 47.2% respectively. Over the previous week the market value of iM-Gold Momentum Timer (AU, NEM, SBSW) gained 11.67% at a time when SPY gained 0.87%. A starting capital of $100,000 at inception on 6/30/2016 would have grown to $74,829 which includes $66,006 cash and excludes Gain to date spent on fees and slippage. |
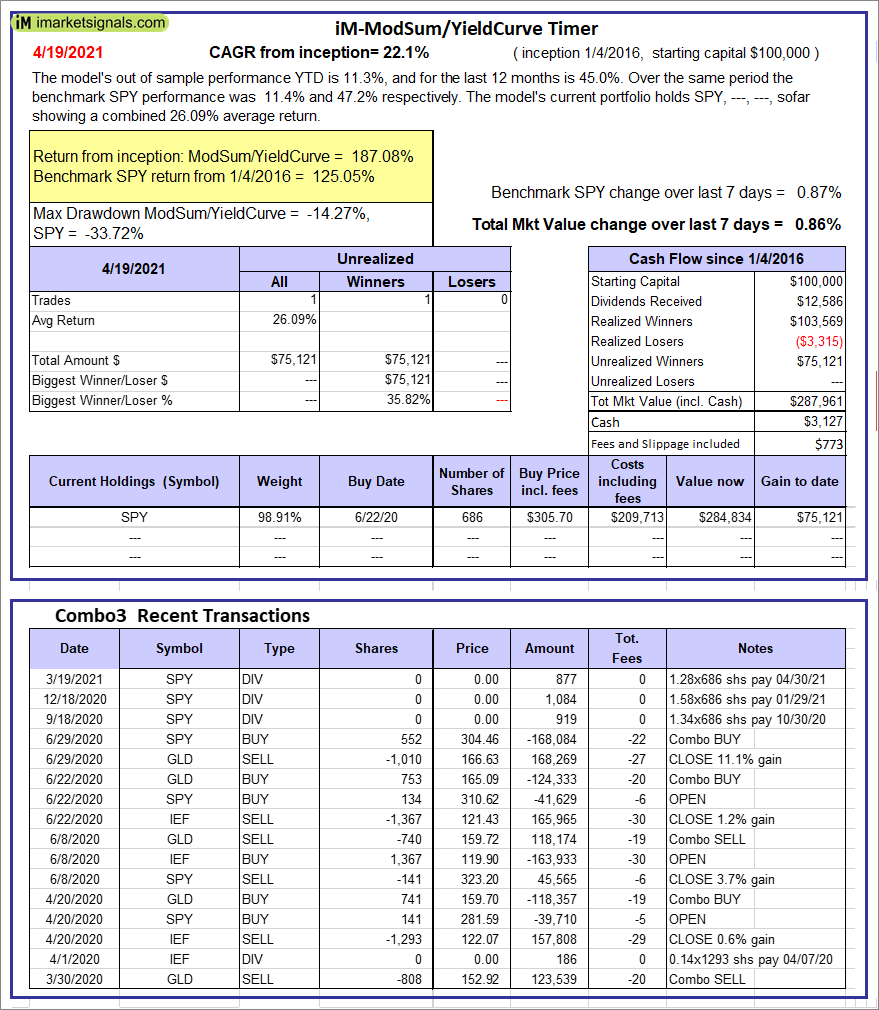 |
iM-ModSum/YieldCurve Timer: The model’s out of sample performance YTD is 11.3%, and for the last 12 months is 45.0%. Over the same period the benchmark SPY performance was 11.4% and 47.2% respectively. Over the previous week the market value of iM-PortSum/YieldCurve Timer gained 0.86% at a time when SPY gained 0.87%. A starting capital of $100,000 at inception on 1/1/2016 would have grown to $287,961 which includes $3,127 cash and excludes $773 spent on fees and slippage. |
 |
iM-Best(SPY-SH).R1: The model’s out of sample performance YTD is 11.3%, and for the last 12 months is 39.1%. Over the same period the benchmark SPY performance was 11.4% and 47.2% respectively. Over the previous week the market value of Best(SPY-SH) gained 0.86% at a time when SPY gained 0.87%. A starting capital of $100,000 at inception on 1/2/2009 would have grown to $737,623 which includes $5,608 cash and excludes $25,118 spent on fees and slippage. |
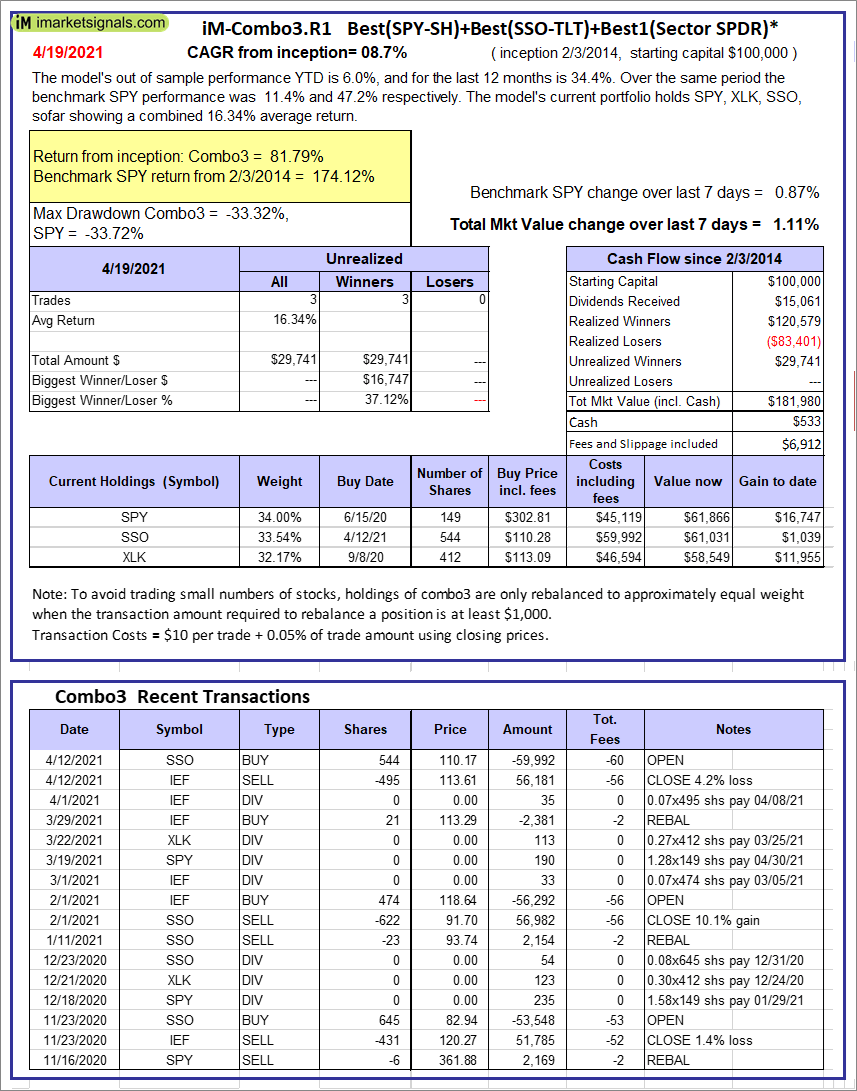 |
iM-Combo3.R1: The model’s out of sample performance YTD is 6.0%, and for the last 12 months is 34.4%. Over the same period the benchmark SPY performance was 11.4% and 47.2% respectively. Over the previous week the market value of iM-Combo3.R1 gained 1.11% at a time when SPY gained 0.87%. A starting capital of $100,000 at inception on 2/3/2014 would have grown to $181,980 which includes $533 cash and excludes $6,912 spent on fees and slippage. |
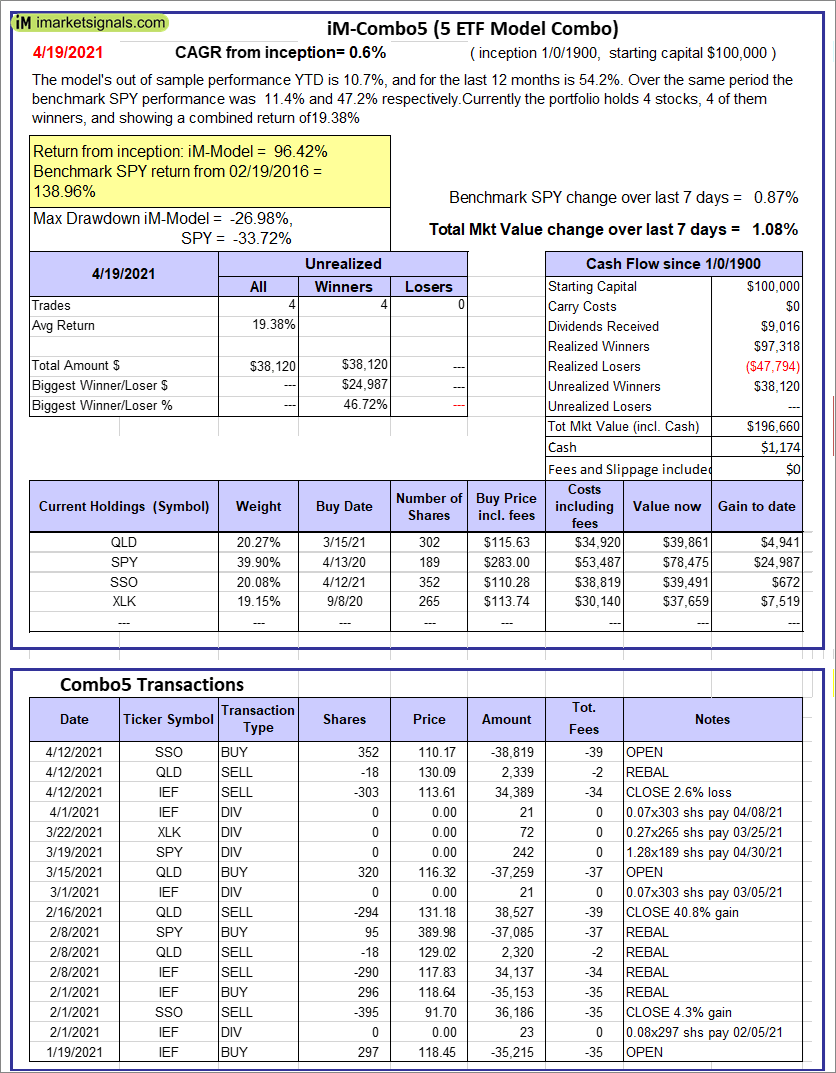 |
iM-Combo5: The model’s out of sample performance YTD is 10.7%, and for the last 12 months is 54.2%. Over the same period the benchmark SPY performance was 11.4% and 47.2% respectively. Over the previous week the market value of iM-Combo5 gained 1.08% at a time when SPY gained 0.87%. A starting capital of $100,000 at inception on 2/22/2016 would have grown to $196,660 which includes $1,174 cash and excludes $0 spent on fees and slippage. |
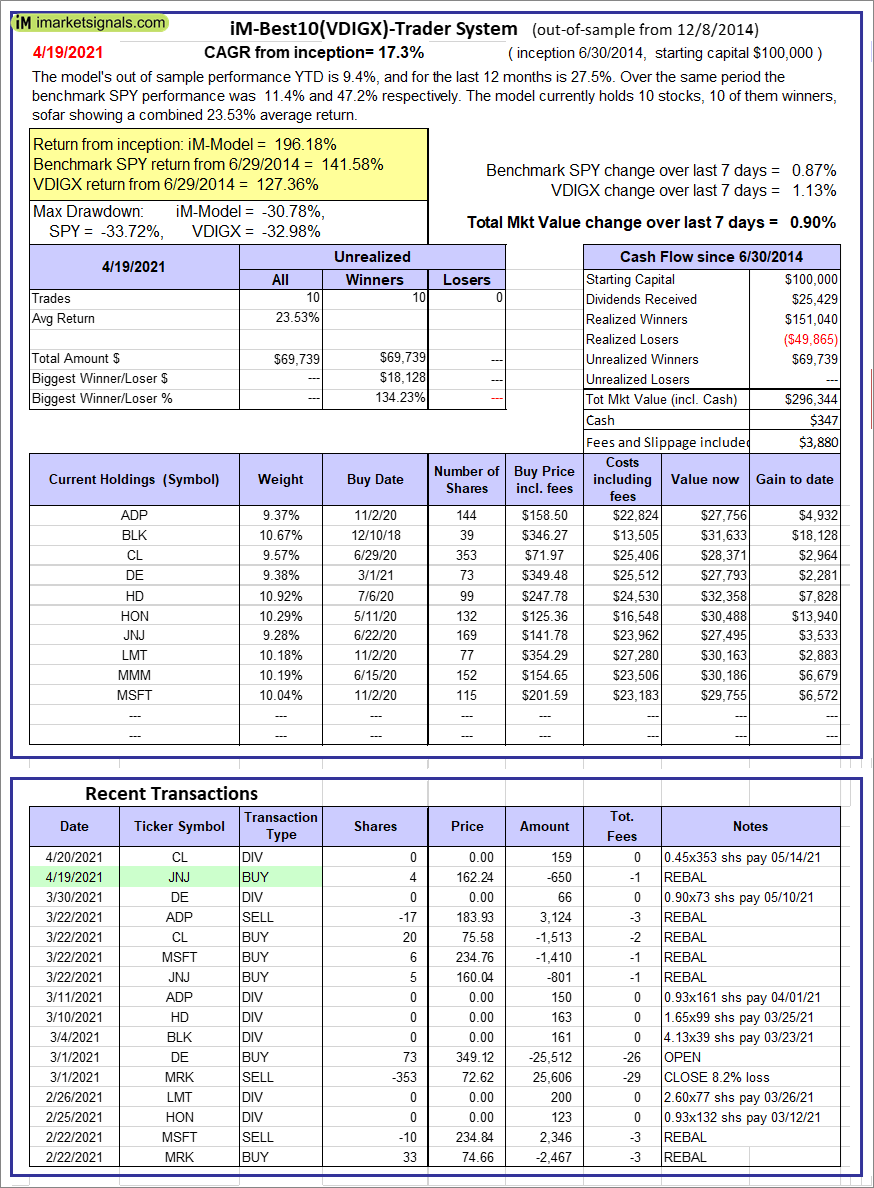 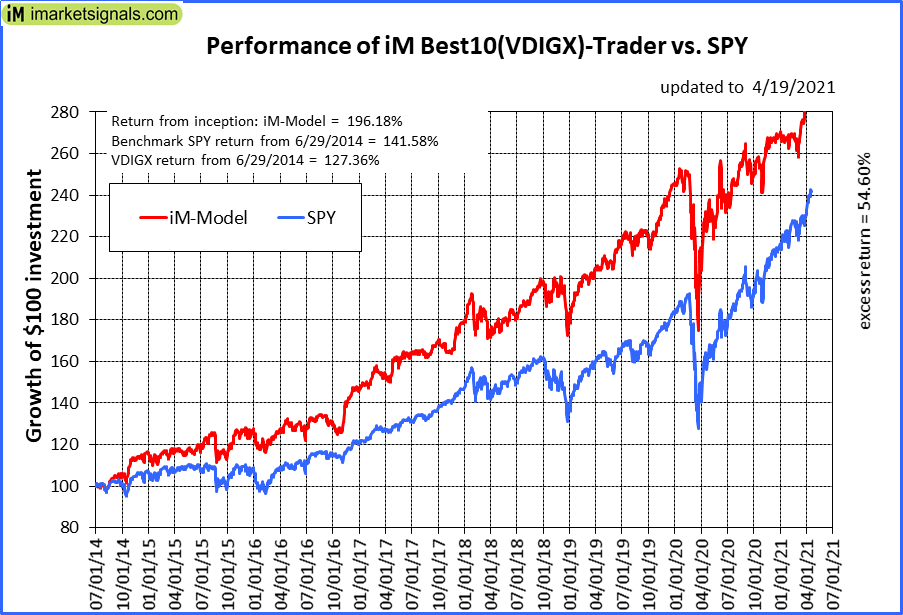 |
iM-Best10(VDIGX)-Trader: The model’s out of sample performance YTD is 9.4%, and for the last 12 months is 27.5%. Over the same period the benchmark SPY performance was 11.4% and 47.2% respectively. Since inception, on 7/1/2014, the model gained 196.18% while the benchmark SPY gained 141.58% and VDIGX gained 127.36% over the same period. Over the previous week the market value of iM-Best10(VDIGX) gained 0.90% at a time when SPY gained 0.87%. A starting capital of $100,000 at inception on 7/1/2014 would have grown to $296,344 which includes $347 cash and excludes $3,880 spent on fees and slippage. |
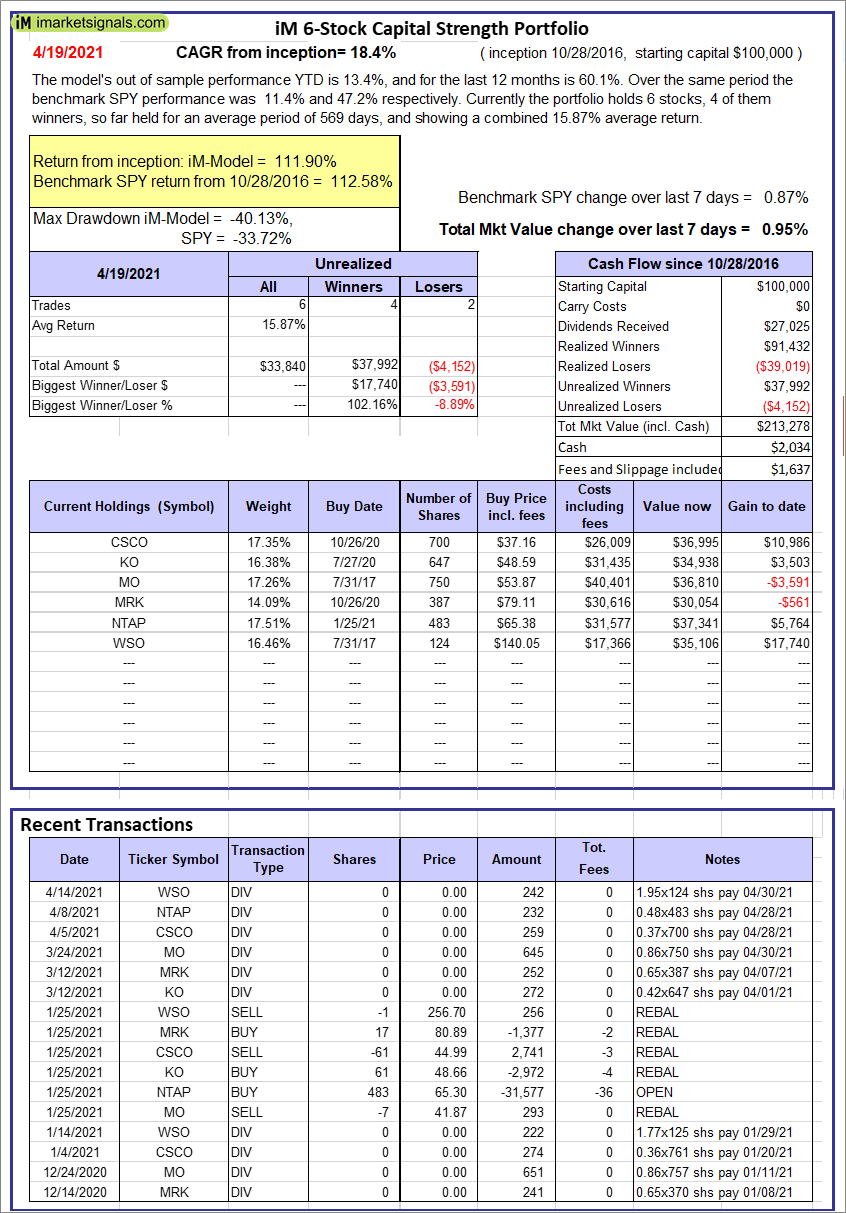 |
iM 6-Stock Capital Strength Portfolio: The model’s out of sample performance YTD is 13.4%, and for the last 12 months is 60.1%. Over the same period the benchmark SPY performance was 11.4% and 47.2% respectively. Over the previous week the market value of the iM 6-Stock Capital Strength Portfolio gained 0.95% at a time when SPY gained 0.87%. A starting capital of $100,000 at inception on 10/28/2016 would have grown to $213,278 which includes $2,034 cash and excludes $1,637 spent on fees and slippage. |
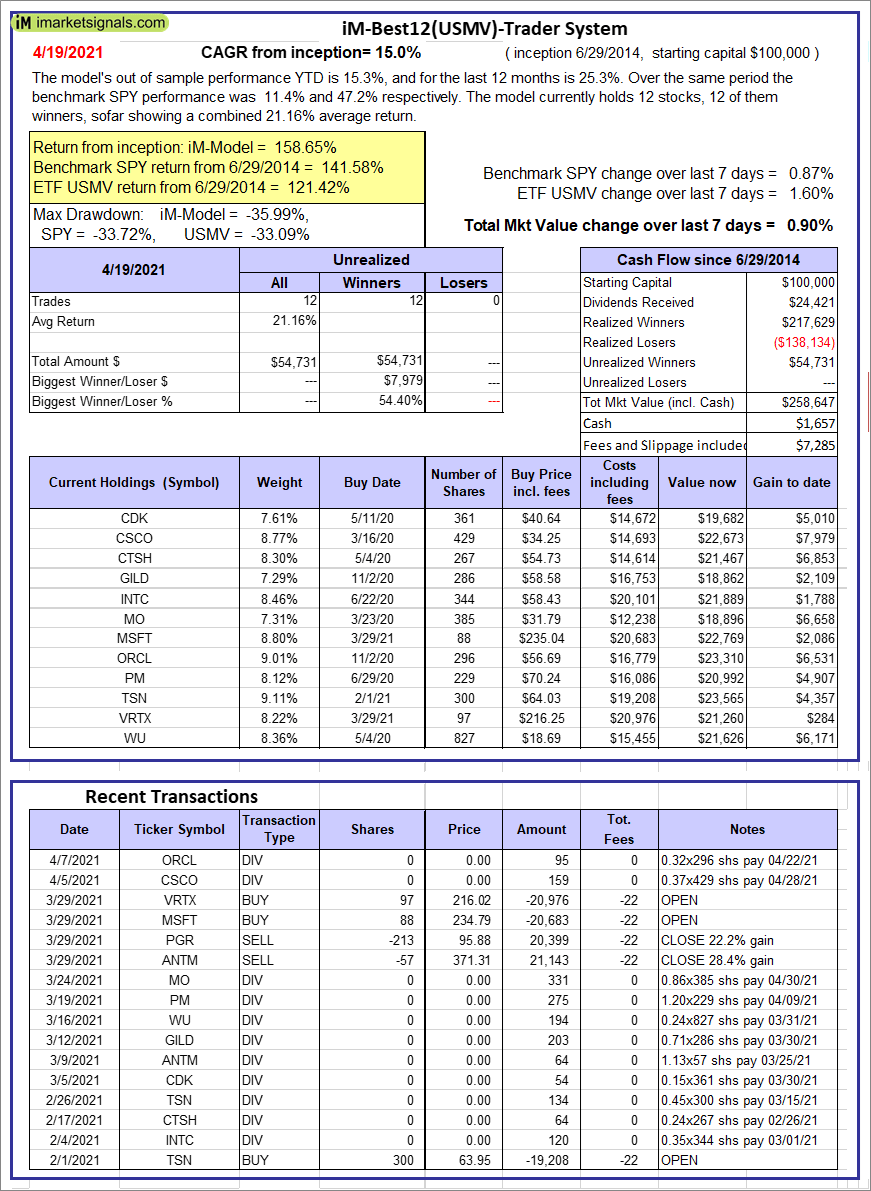 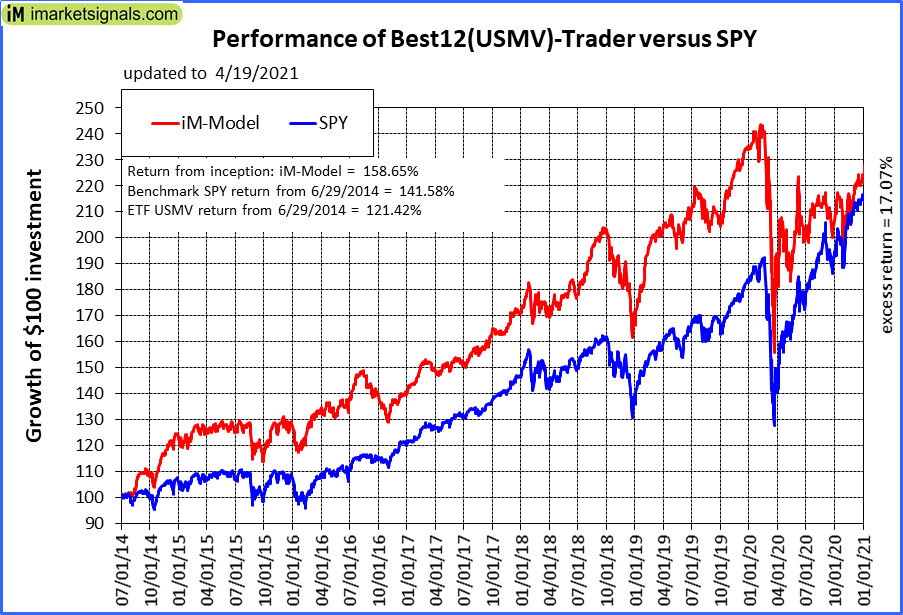 |
iM-Best12(USMV)-Trader: The model’s out of sample performance YTD is 15.3%, and for the last 12 months is 25.3%. Over the same period the benchmark SPY performance was 11.4% and 47.2% respectively. Since inception, on 6/30/2014, the model gained 158.65% while the benchmark SPY gained 141.58% and the ETF USMV gained 121.42% over the same period. Over the previous week the market value of iM-Best12(USMV)-Trader gained 0.90% at a time when SPY gained 0.87%. A starting capital of $100,000 at inception on 6/30/2014 would have grown to $258,647 which includes $1,657 cash and excludes $7,285 spent on fees and slippage. |
 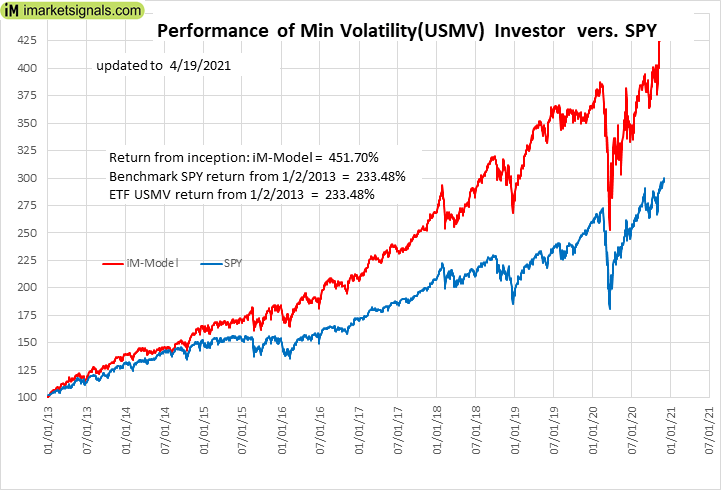 |
iM-Min Volatility(USMV) Investor (Tax Efficient): The model’s out of sample performance YTD is 22.2%, and for the last 12 months is 64.0%. Over the same period the benchmark SPY performance was 11.4% and 47.2% respectively. Since inception, on 1/3/2013, the model gained 451.70% while the benchmark SPY gained 233.48% and the ETF USMV gained 233.48% over the same period. Over the previous week the market value of iM-Best12(USMV)Q1 gained 1.72% at a time when SPY gained 0.87%. A starting capital of $100,000 at inception on 1/3/2013 would have grown to $551,699 which includes $117 cash and excludes $4,689 spent on fees and slippage. |
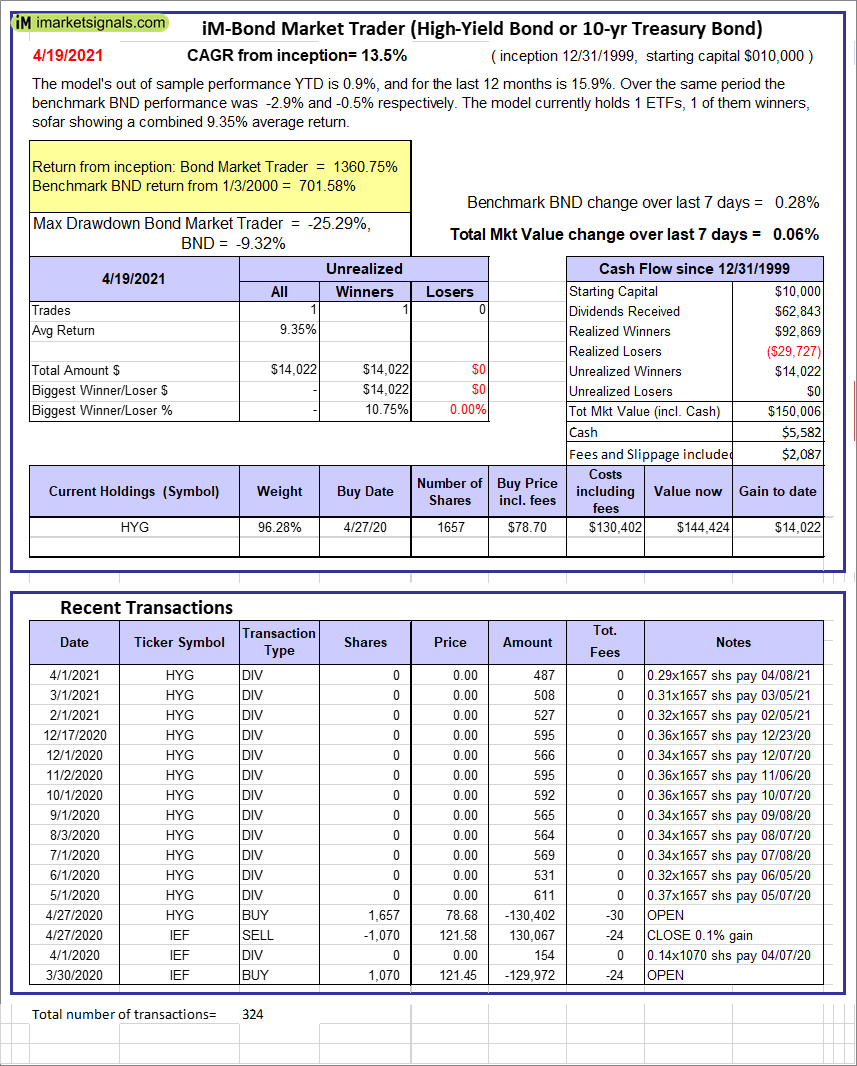 |
iM-Bond Market Trader (High-Yield Bond or 10-yr Treasury Bond): The model’s out of sample performance YTD is 0.9%, and for the last 12 months is 15.9%. Over the same period the benchmark BND performance was -2.9% and -0.5% respectively. Over the previous week the market value of the iM-Bond Market Trader (High-Yield Bond or 10-yr Treasury Bond) gained 0.06% at a time when BND gained 0.28%. A starting capital of $10,000 at inception on 1/3/2000 would have grown to $150,006 which includes $5,582 cash and excludes $2,087 spent on fees and slippage. |
|
|
iM-ModSum/YieldCurve Timer: The model’s out of sample performance YTD is 11.3%, and for the last 12 months is 45.0%. Over the same period the benchmark SPY performance was 11.4% and 47.2% respectively. Over the previous week the market value of iM-PortSum/YieldCurve Timer gained 0.86% at a time when SPY gained 0.87%. A starting capital of $100,000 at inception on 1/1/2016 would have grown to $287,961 which includes $3,127 cash and excludes $773 spent on fees and slippage. |
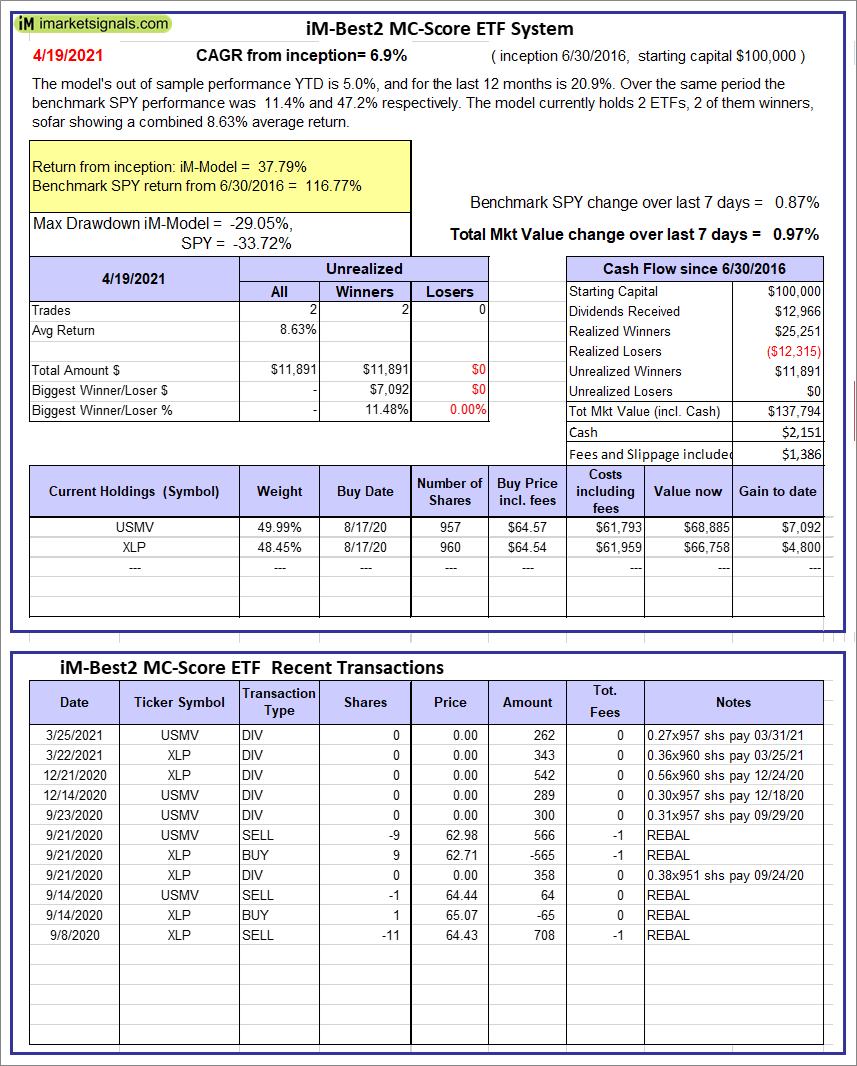 |
iM-Best2 MC-Score ETF System: The model’s out of sample performance YTD is 5.0%, and for the last 12 months is 20.9%. Over the same period the benchmark SPY performance was 11.4% and 47.2% respectively. Over the previous week the market value of the iM-Best2 MC-Score ETF System gained 0.97% at a time when SPY gained 0.87%. A starting capital of $100,000 at inception on 6/30/2016 would have grown to $137,794 which includes $2,151 cash and excludes $1,386 spent on fees and slippage. |
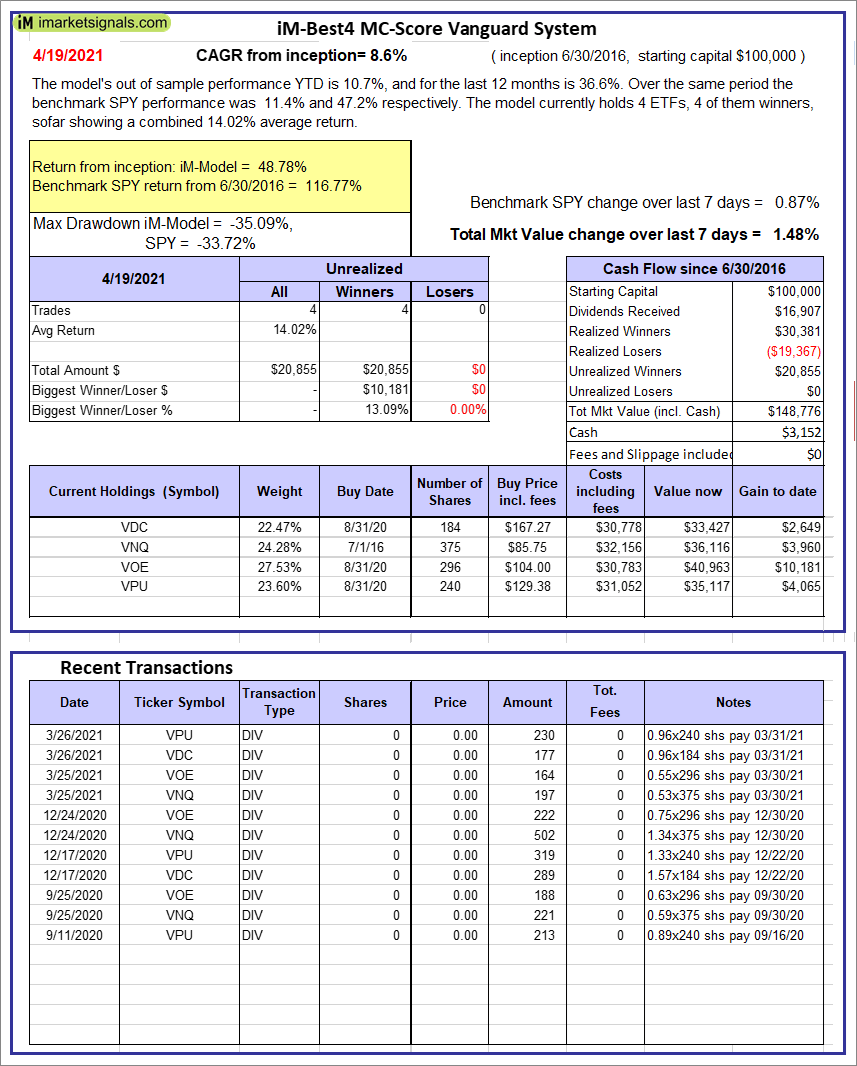 |
iM-Best4 MC-Score Vanguard System: The model’s out of sample performance YTD is 10.7%, and for the last 12 months is 36.6%. Over the same period the benchmark SPY performance was 11.4% and 47.2% respectively. Over the previous week the market value of the iM-Best4 MC-Score Vanguard System gained 1.48% at a time when SPY gained 0.87%. A starting capital of $100,000 at inception on 6/30/2016 would have grown to $148,776 which includes $3,152 cash and excludes $00 spent on fees and slippage. |
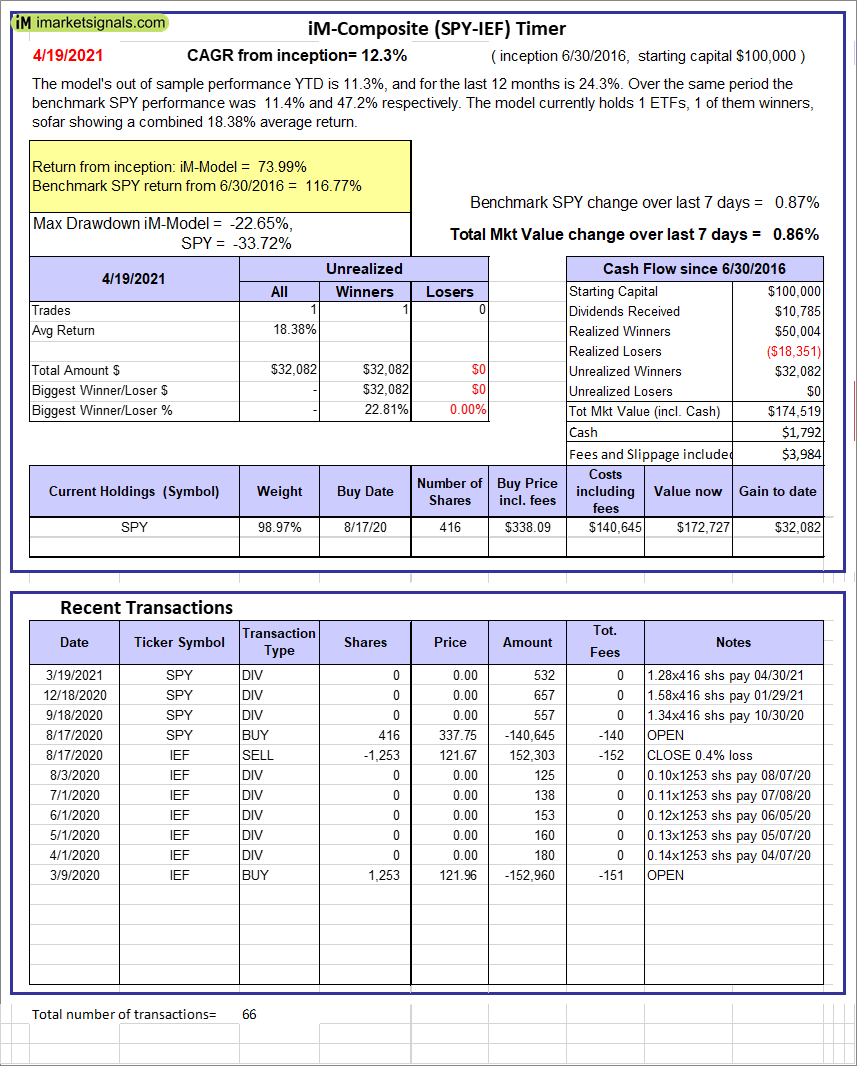 |
iM-Composite (SPY-IEF) Timer: The model’s out of sample performance YTD is 11.3%, and for the last 12 months is 24.3%. Over the same period the benchmark SPY performance was 11.4% and 47.2% respectively. Over the previous week the market value of the iM-Composite (SPY-IEF) Timer gained 0.86% at a time when SPY gained 0.87%. A starting capital of $100,000 at inception on 6/30/2016 would have grown to $174,519 which includes $1,792 cash and excludes $3,984 spent on fees and slippage. |
 |
iM-Composite(Gold-Stocks-Bond) Timer: The model’s out of sample performance YTD is 0.9%, and for the last 12 months is 20.5%. Over the same period the benchmark SPY performance was 11.4% and 47.2% respectively. Over the previous week the market value of the iM-Composite(Gold-Stocks-Bond) Timer gained 2.22% at a time when SPY gained 0.87%. A starting capital of $100,000 at inception on 6/30/2016 would have grown to $167,798 which includes $734 cash and excludes $6,875 spent on fees and slippage. |
iM-Best Reports – 4/20/21
Posted in pmp SPY-SH
Leave a Reply
You must be logged in to post a comment.