
  |
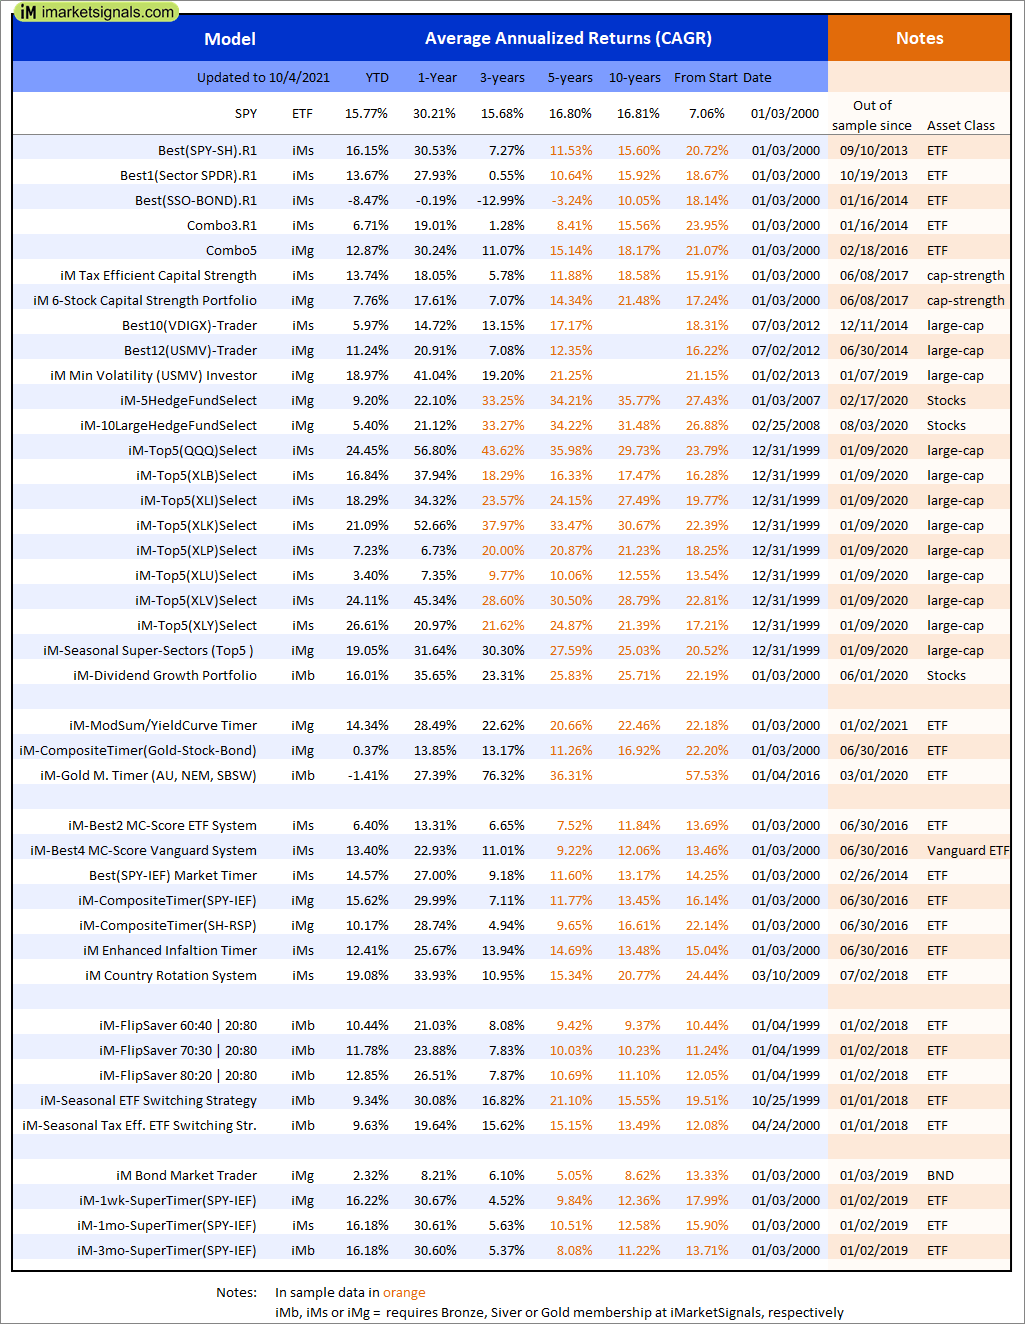
Out of sample performance summary of our models for the past 1, 2, 4 and 13 week periods. The active active return indicates how the models over- or underperformed the benchmark ETF SPY. Also the YTD, and the 1-, 3-, 5- and 10-year annualized returns are shown in the second table |
 |
iM-FlipSaver 60:40 | 20:80 – 2017: The model’s out of sample performance YTD is 10.7%, and for the last 12 months is 21.1%. Over the same period the benchmark E60B40 performance was 8.7% and 17.1% respectively. Over the previous week the market value of iM-FlipSaver 80:20 | 20:80 gained -2.00% at a time when SPY gained -1.97%. A starting capital of $100,000 at inception on 7/16/2015 would have grown to $152,732 which includes $506 cash and excludes $1,786 spent on fees and slippage. |
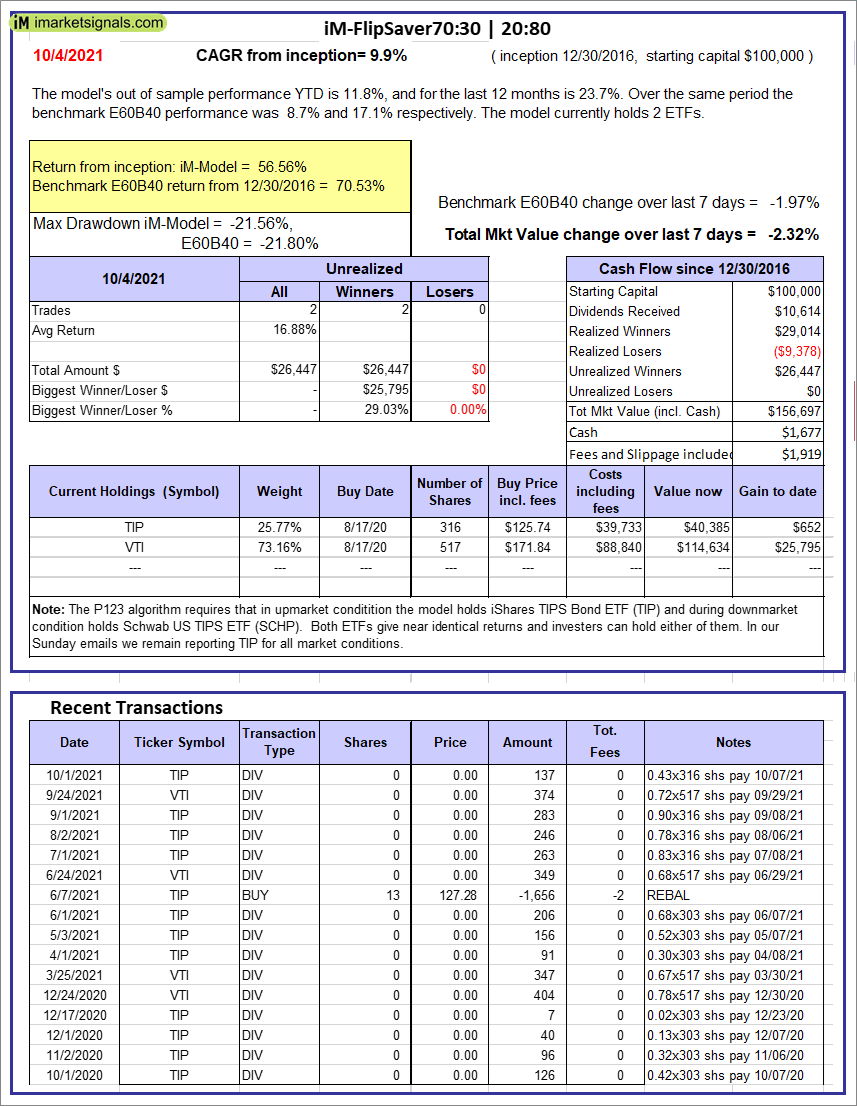 |
iM-FlipSaver 70:30 | 20:80 – 2017: The model’s out of sample performance YTD is 11.8%, and for the last 12 months is 23.7%. Over the same period the benchmark E60B40 performance was 8.7% and 17.1% respectively. Over the previous week the market value of iM-FlipSaver 70:30 | 20:80 gained -2.32% at a time when SPY gained -1.97%. A starting capital of $100,000 at inception on 7/15/2015 would have grown to $156,697 which includes $1,677 cash and excludes $1,919 spent on fees and slippage. |
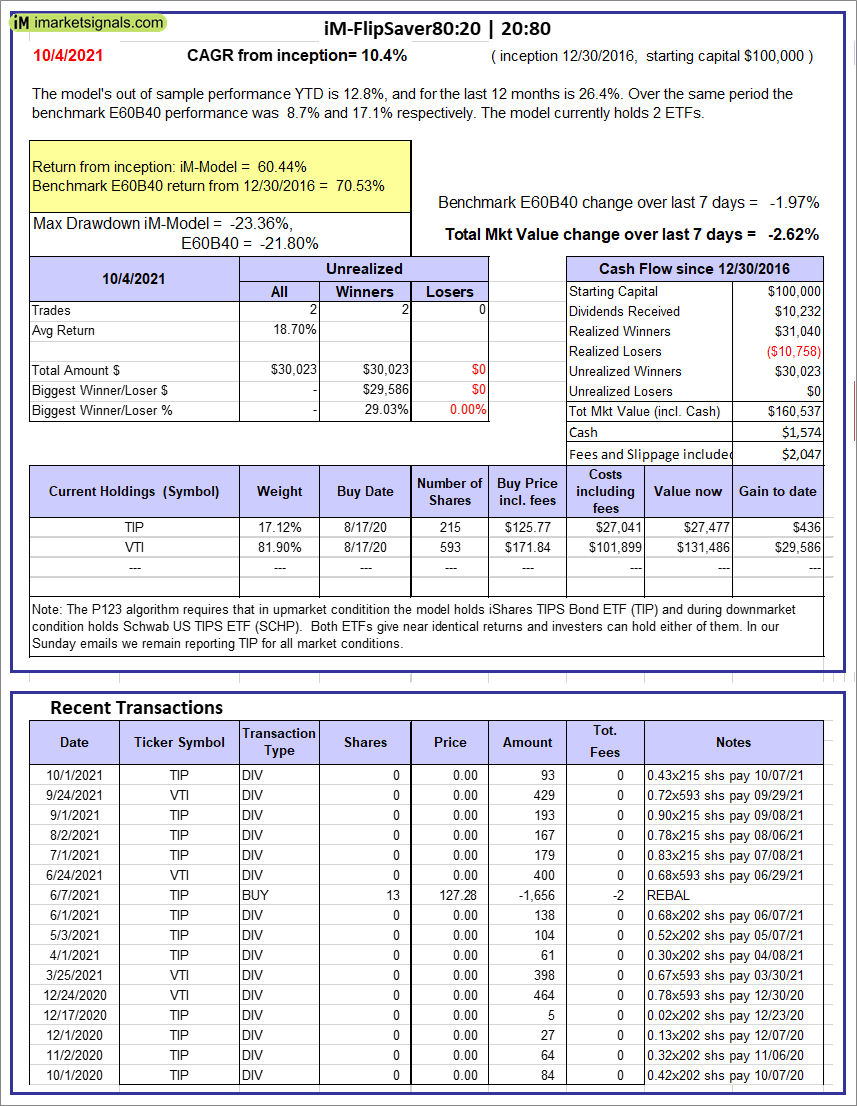 |
iM-FlipSaver 80:20 | 20:80 – 2017: The model’s out of sample performance YTD is 12.8%, and for the last 12 months is 26.4%. Over the same period the benchmark E60B40 performance was 8.7% and 17.1% respectively. Over the previous week the market value of iM-FlipSaver 80:20 | 20:80 gained -2.62% at a time when SPY gained -1.97%. A starting capital of $100,000 at inception on 1/2/2017 would have grown to $160,537 which includes $1,574 cash and excludes $2,047 spent on fees and slippage. |
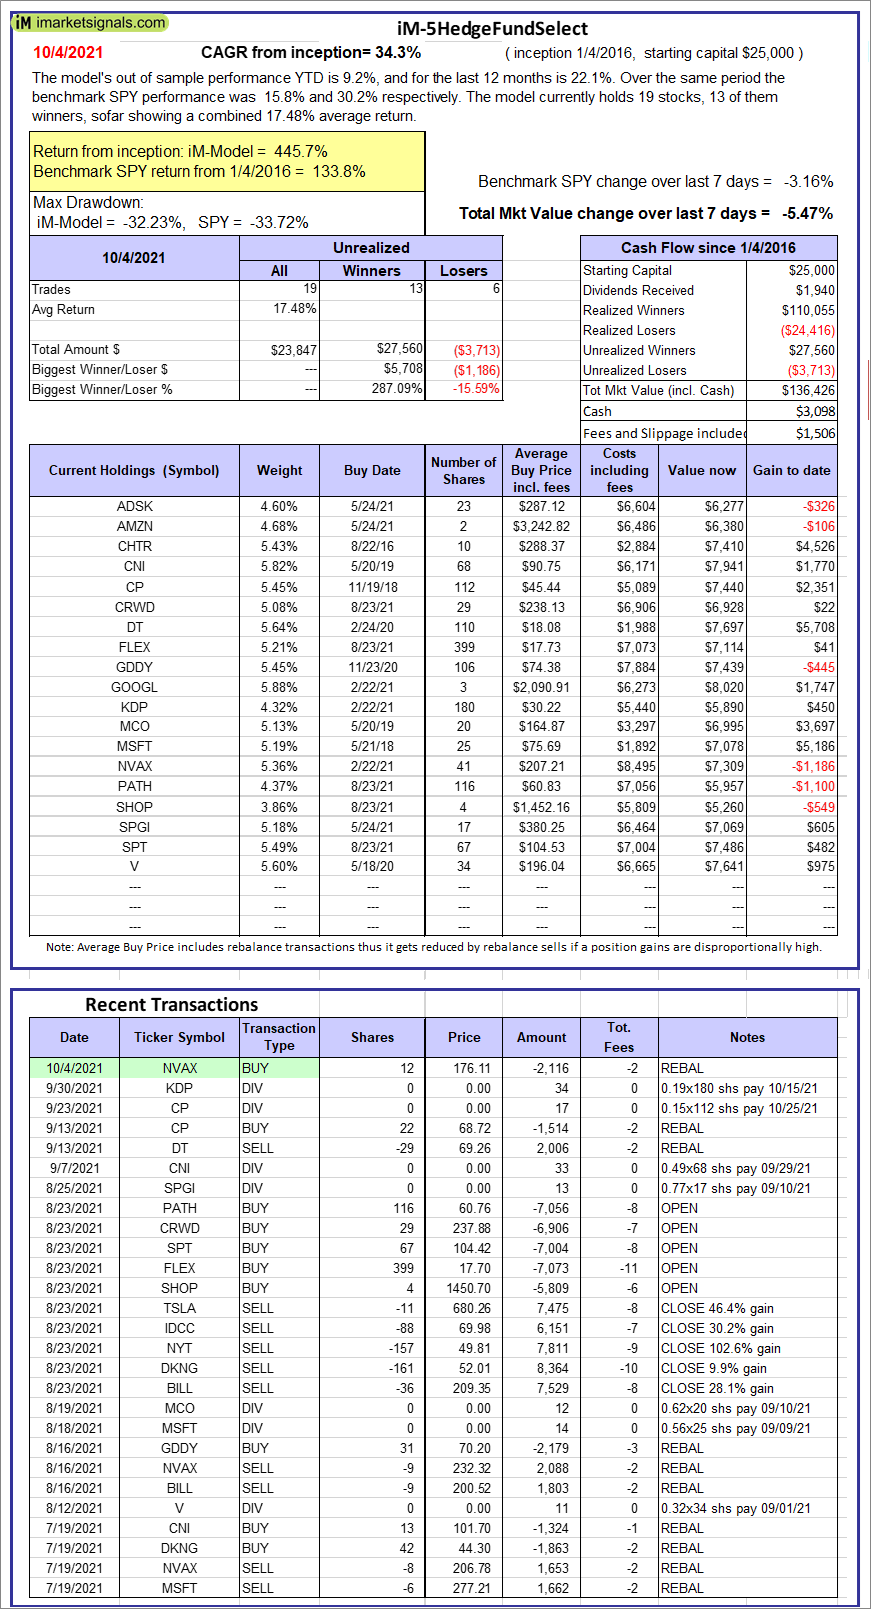 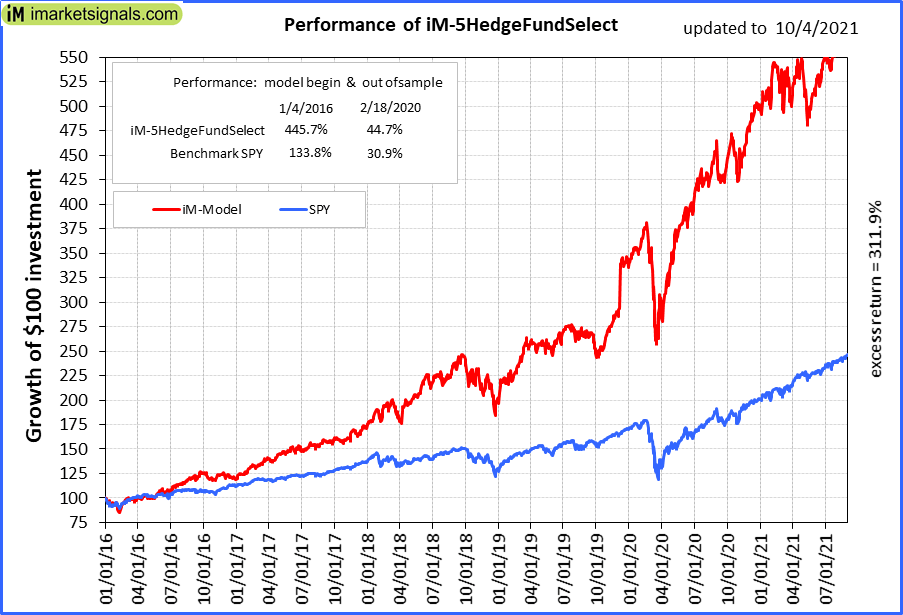 |
iM-5HedgeFundSelect: Since inception, on 1/5/2016, the model gained 445.70% while the benchmark SPY gained 133.83% over the same period. Over the previous week the market value of iM-5HedgeFundSelect gained -5.47% at a time when SPY gained -3.16%. A starting capital of $25,000 at inception on 1/5/2016 would have grown to $136,426 which includes $3,098 cash and excludes $1,506 spent on fees and slippage. |
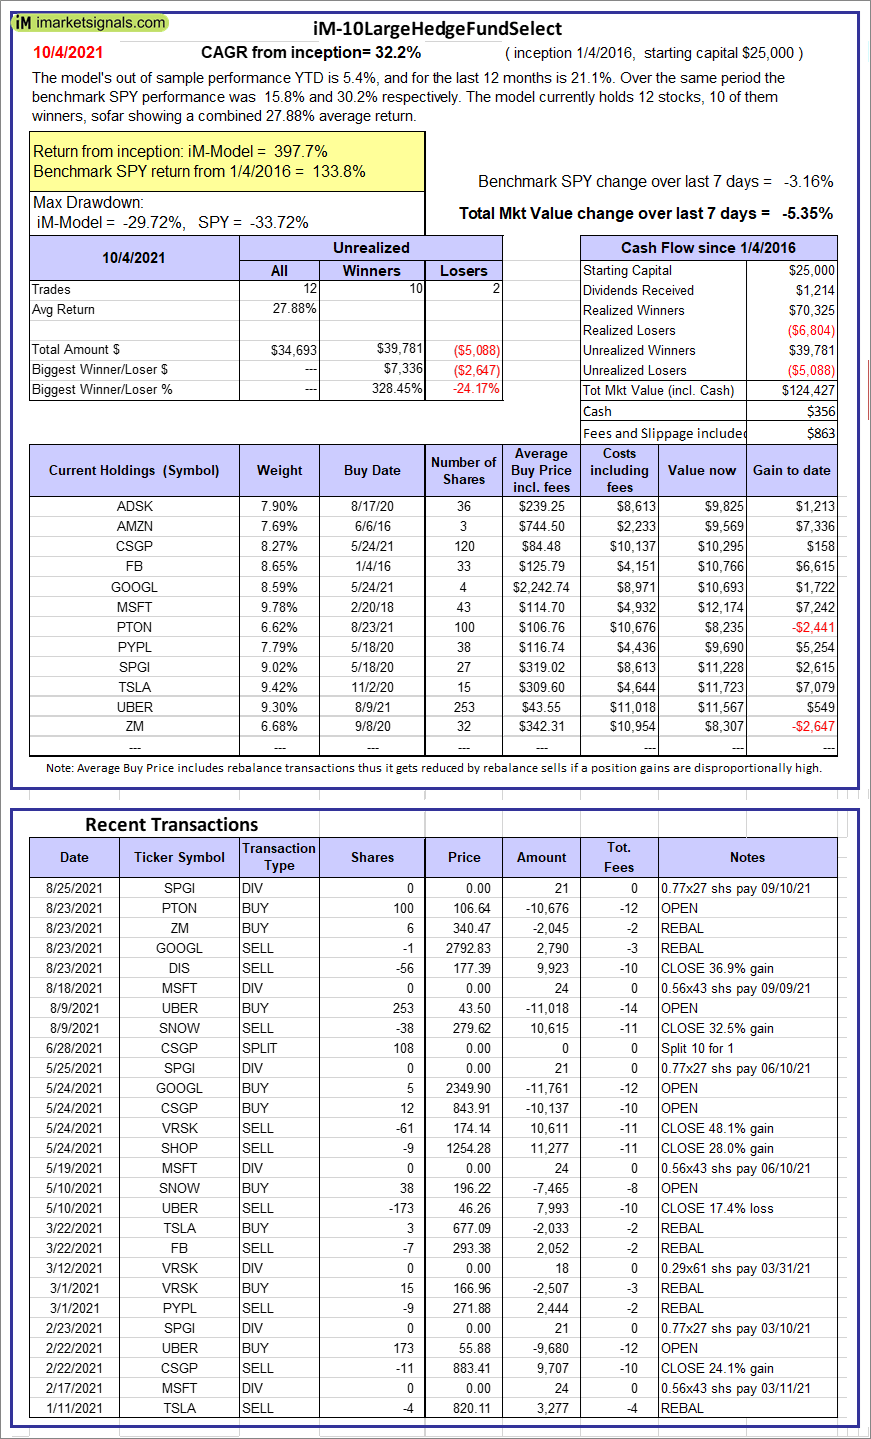 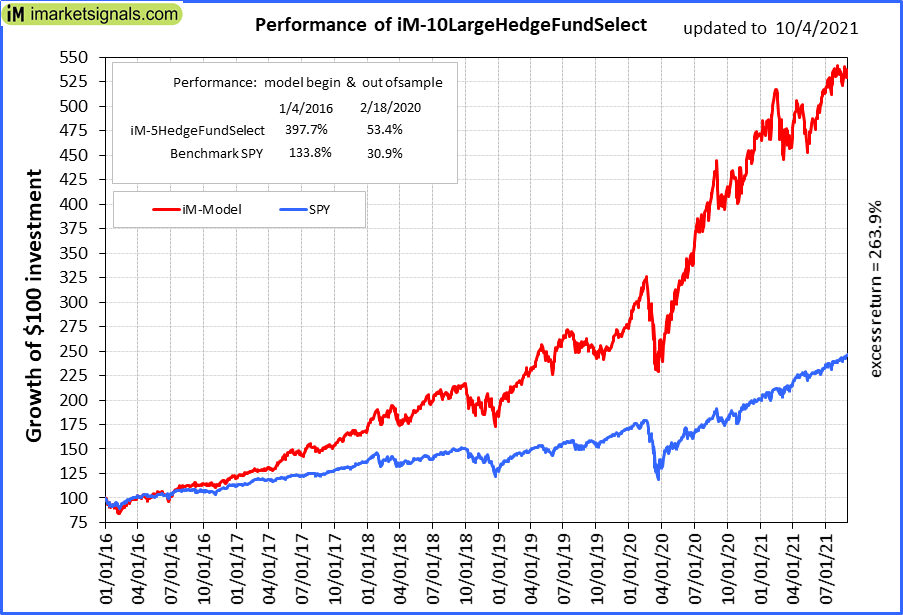 |
iM-10LargeHedgeFundSelect: Since inception, on 1/5/2016, the model gained 397.71% while the benchmark SPY gained 133.83% over the same period. Over the previous week the market value of iM-10LargeHedgeFundSelect gained -5.35% at a time when SPY gained -3.16%. A starting capital of $25,000 at inception on 1/5/2016 would have grown to $124,427 which includes $356 cash and excludes $863 spent on fees and slippage. |
 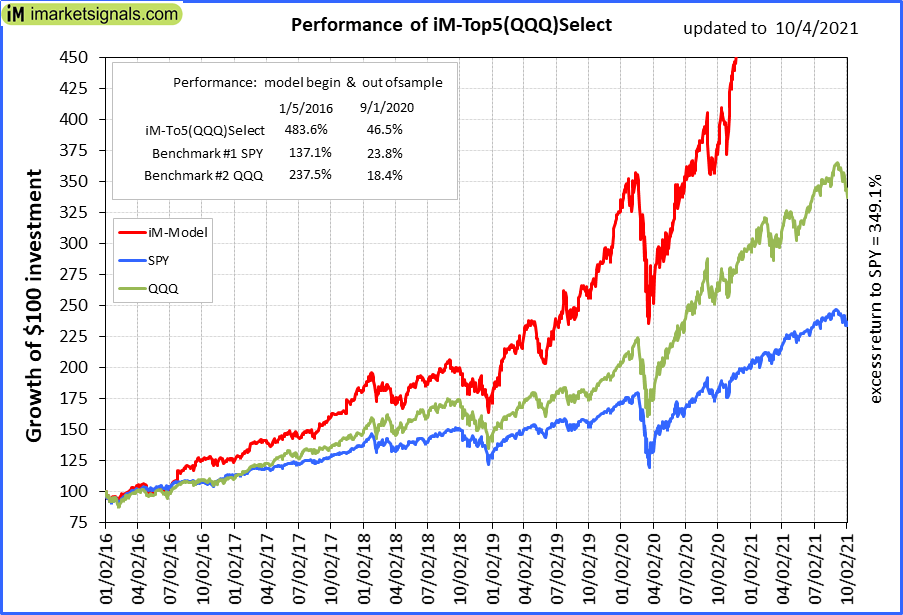 |
iM-Top5(QQQ)Select: Since inception, on 1/5/2016, the model gained 482.97% while the benchmark SPY gained 133.83% over the same period. Over the previous week the market value of iM-Top5(QQQ)Select gained -8.45% at a time when SPY gained -3.16%. A starting capital of $100,000 at inception on 1/5/2016 would have grown to $582,974 which includes -$527 cash and excludes $8,335 spent on fees and slippage. |
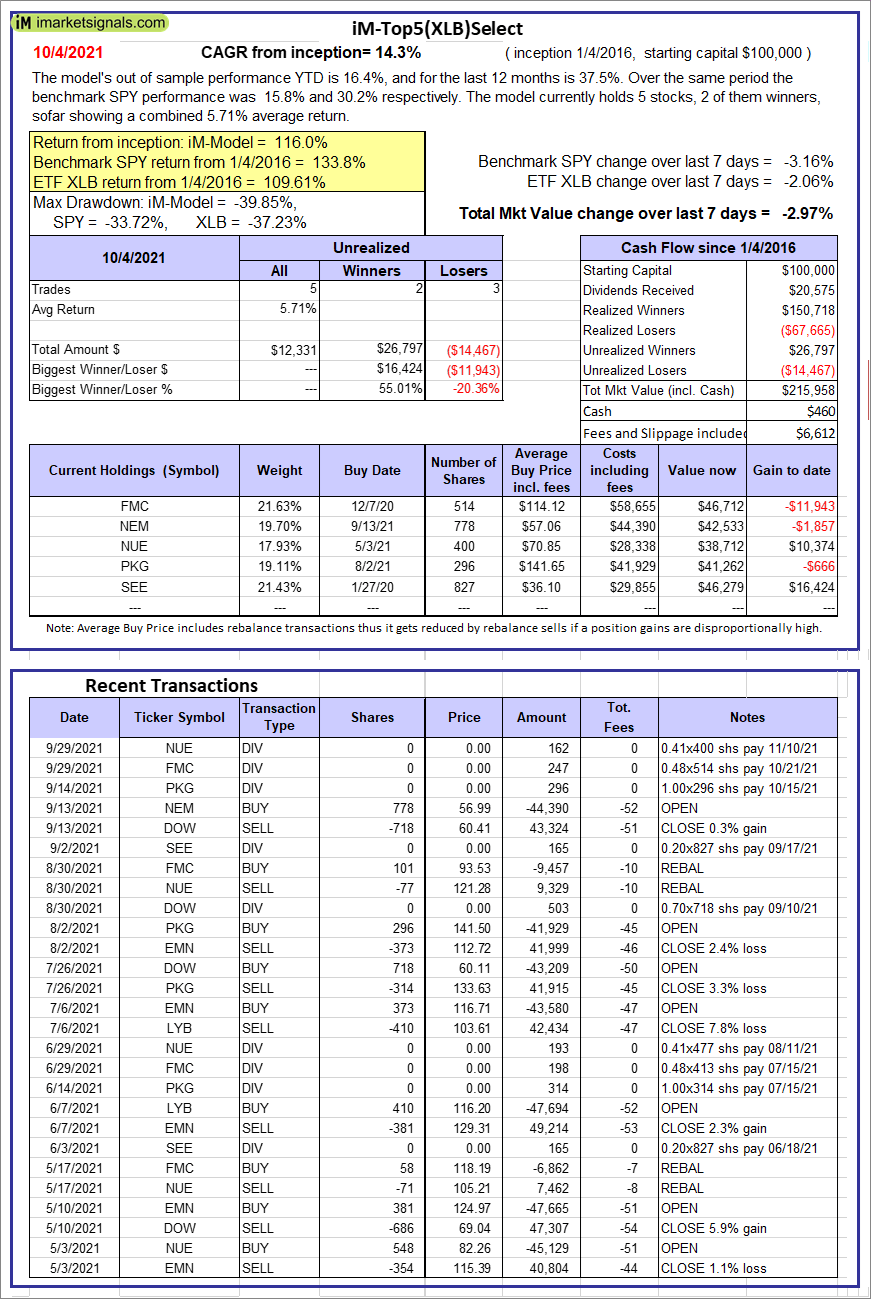 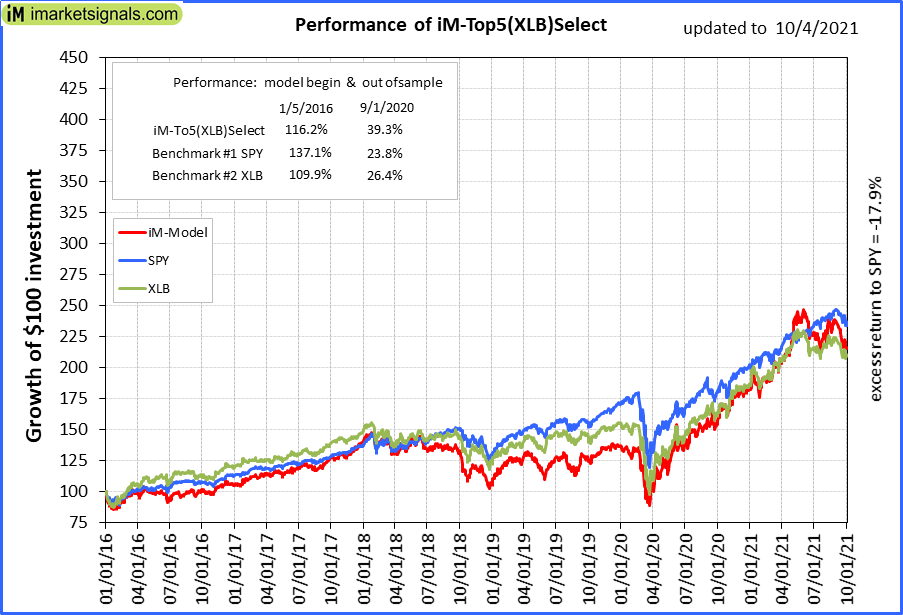 |
iM-Top5(XLB)Select: Since inception, on 1/5/2016, the model gained 115.96% while the benchmark SPY gained 133.83% over the same period. Over the previous week the market value of iM-Top5(XLB)Select gained -2.97% at a time when SPY gained -3.16%. A starting capital of $100,000 at inception on 1/5/2016 would have grown to $215,958 which includes $460 cash and excludes $6,612 spent on fees and slippage. |
  |
iM-Top5(XLI)Select: Since inception, on 1/5/2016, the model gained 261.41% while the benchmark SPY gained 133.83% over the same period. Over the previous week the market value of iM-Top5(XLI)Select gained -2.24% at a time when SPY gained -3.16%. A starting capital of $100,000 at inception on 1/5/2016 would have grown to $361,414 which includes $1,761 cash and excludes $3,785 spent on fees and slippage. |
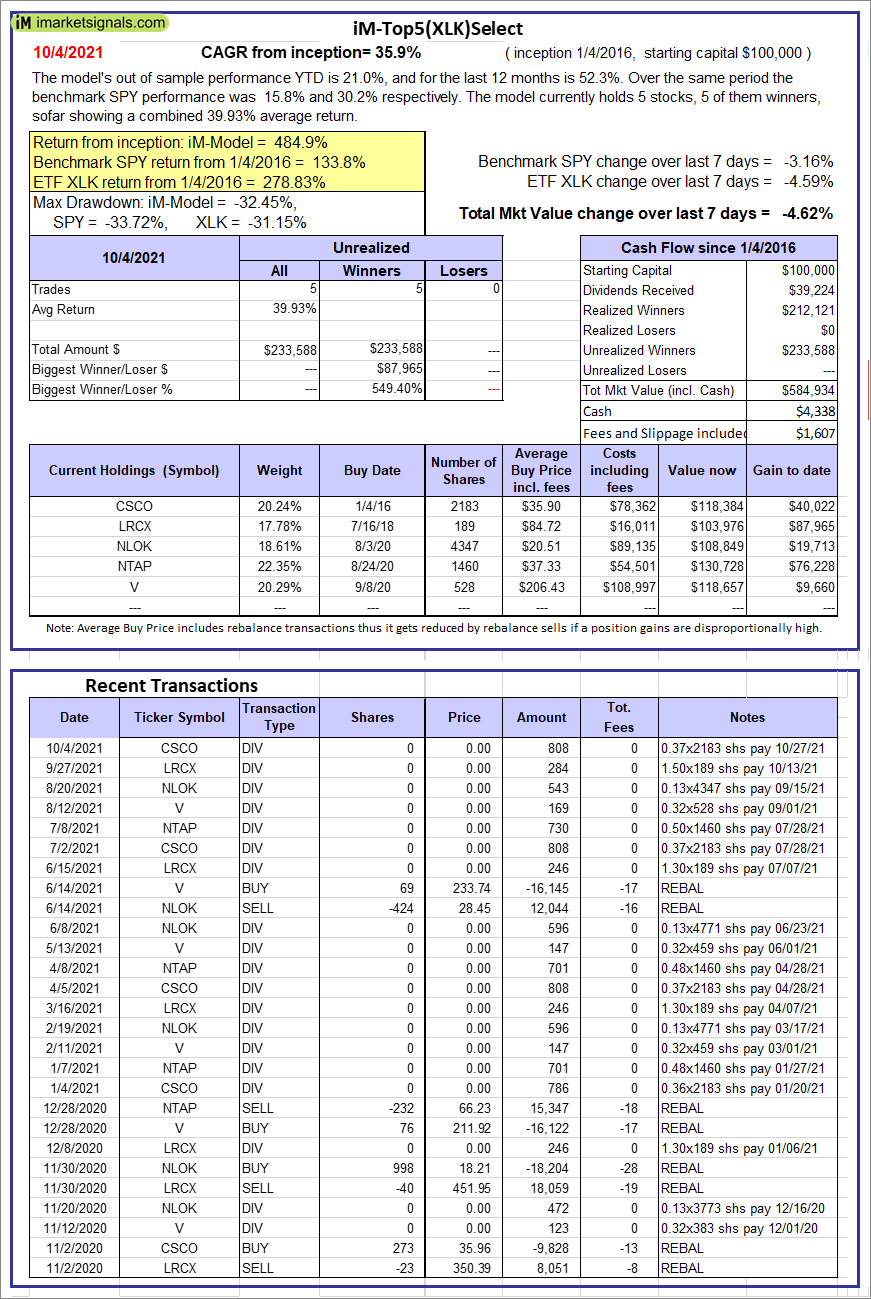 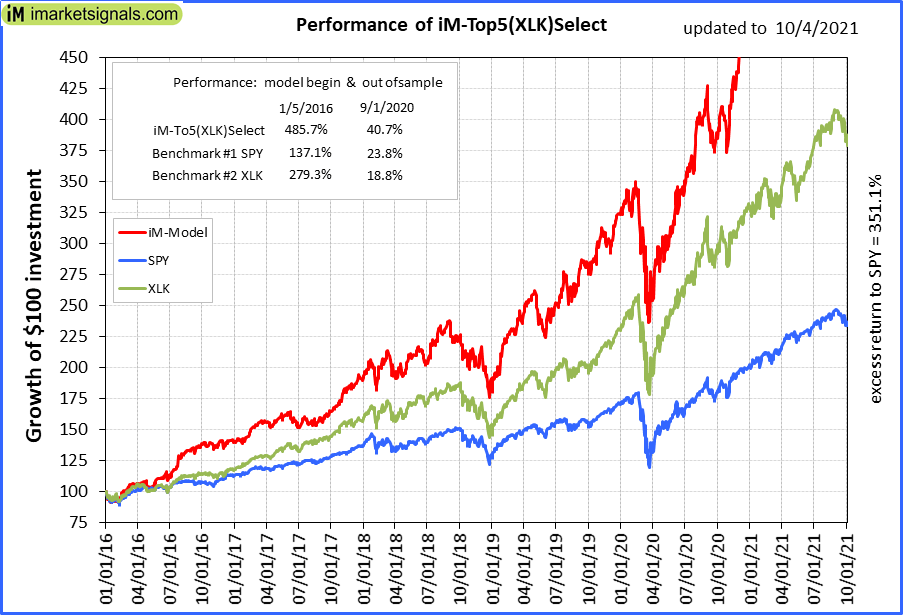 |
iM-Top5(XLK)Select: Since inception, on 1/5/2016, the model gained 484.93% while the benchmark SPY gained 133.83% over the same period. Over the previous week the market value of iM-Top5(XLK)Select gained -4.62% at a time when SPY gained -3.16%. A starting capital of $100,000 at inception on 1/5/2016 would have grown to $584,934 which includes $4,338 cash and excludes $1,607 spent on fees and slippage. |
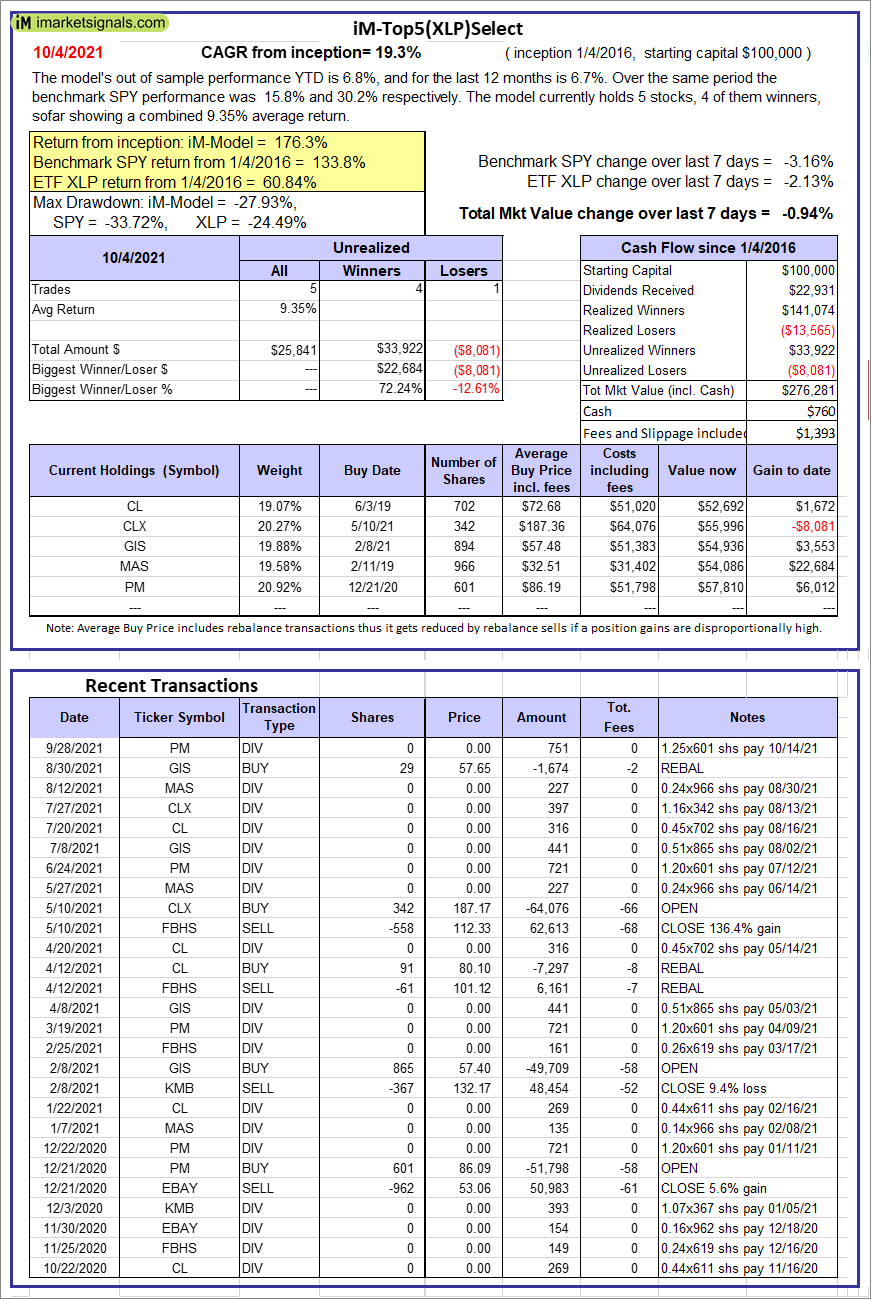 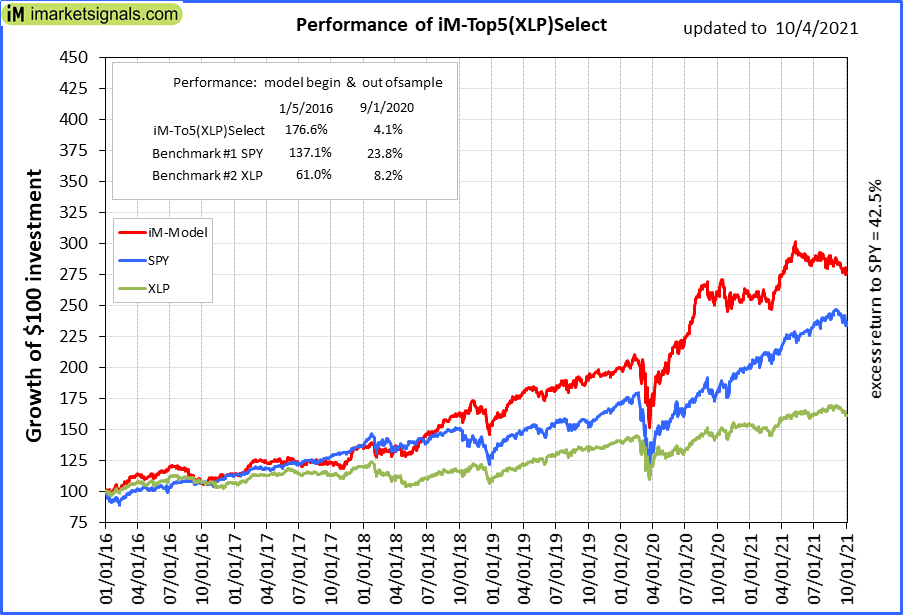 |
iM-Top5(XLP)Select: Since inception, on 1/5/2016, the model gained 176.28% while the benchmark SPY gained 133.83% over the same period. Over the previous week the market value of iM-Top5(XLP)Select gained -0.94% at a time when SPY gained -3.16%. A starting capital of $100,000 at inception on 1/5/2016 would have grown to $276,281 which includes $760 cash and excludes $1,393 spent on fees and slippage. |
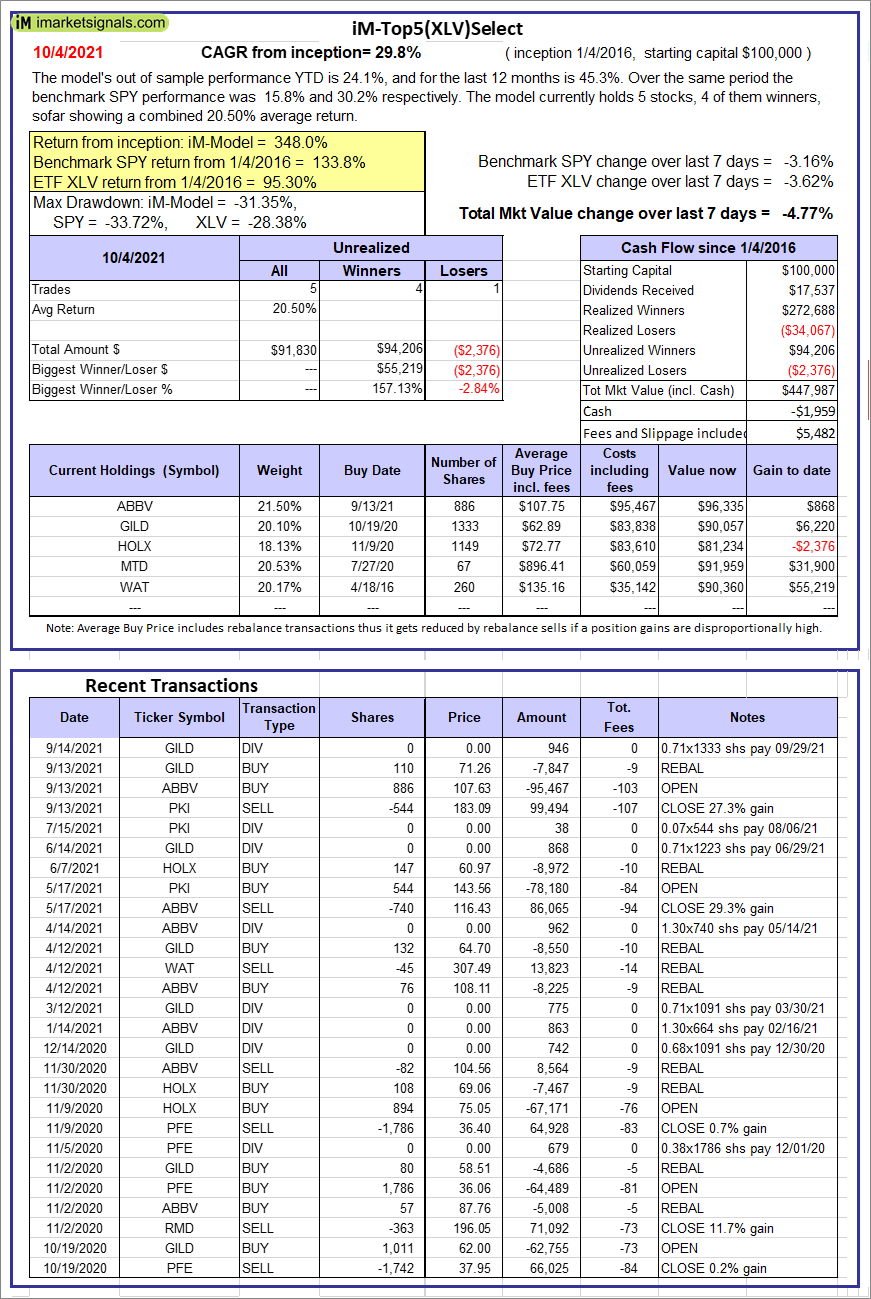 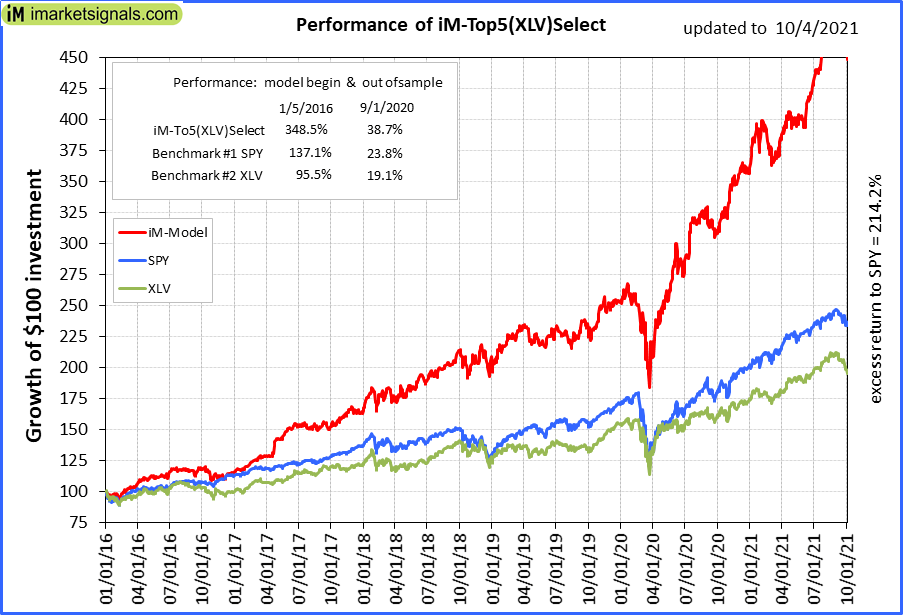 |
iM-Top5(XLV)Select: Since inception, on 1/5/2016, the model gained 347.99% while the benchmark SPY gained 133.83% over the same period. Over the previous week the market value of iM-Top5(XLV)Select gained -4.77% at a time when SPY gained -3.16%. A starting capital of $100,000 at inception on 1/5/2016 would have grown to $447,987 which includes -$1,959 cash and excludes $5,482 spent on fees and slippage. |
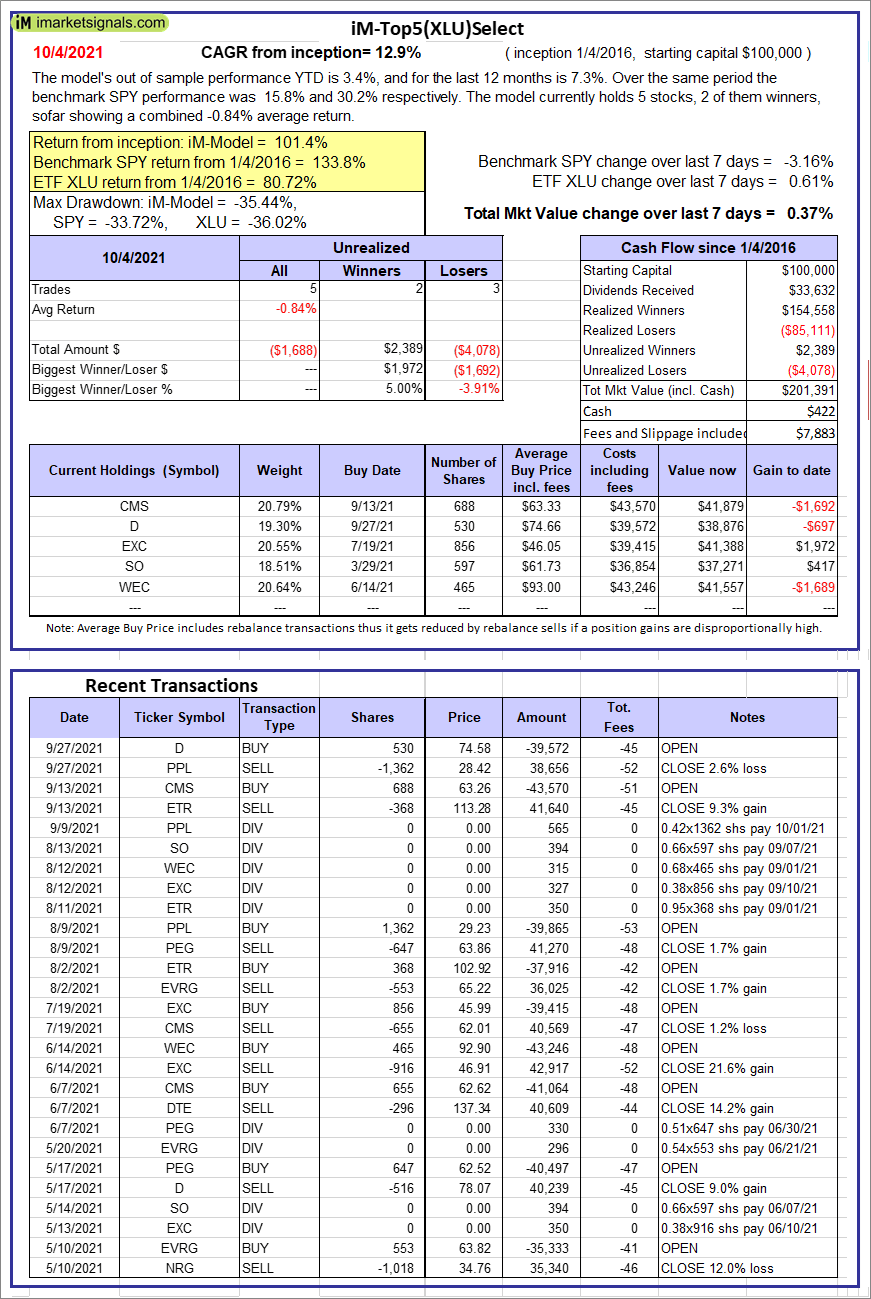 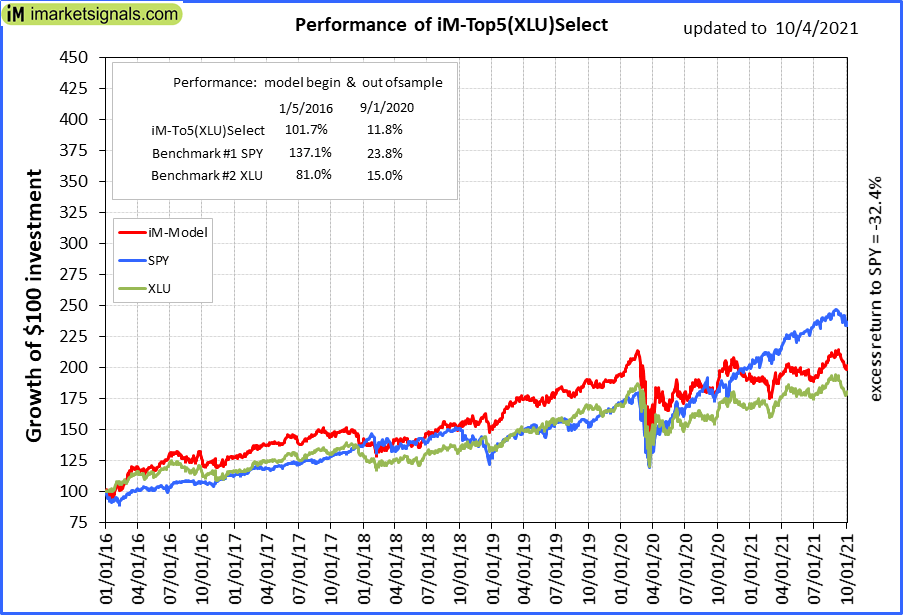 |
iM-Top5(XLU)Select: Since inception, on 1/5/2016, the model gained 101.39% while the benchmark SPY gained 133.83% over the same period. Over the previous week the market value of iM-Top5(XLU)Select gained 0.37% at a time when SPY gained -3.16%. A starting capital of $100,000 at inception on 1/5/2016 would have grown to $201,391 which includes $422 cash and excludes $7,883 spent on fees and slippage. |
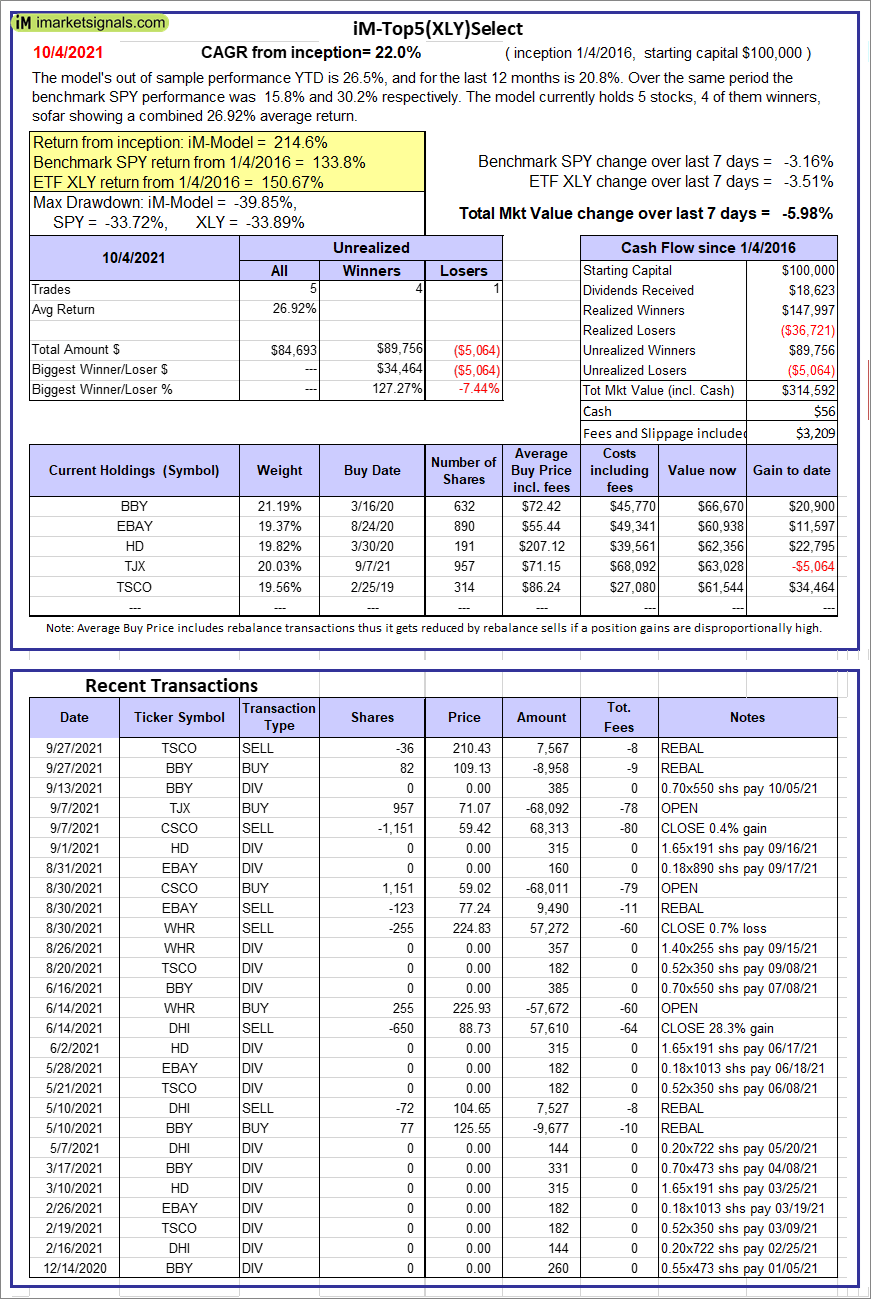 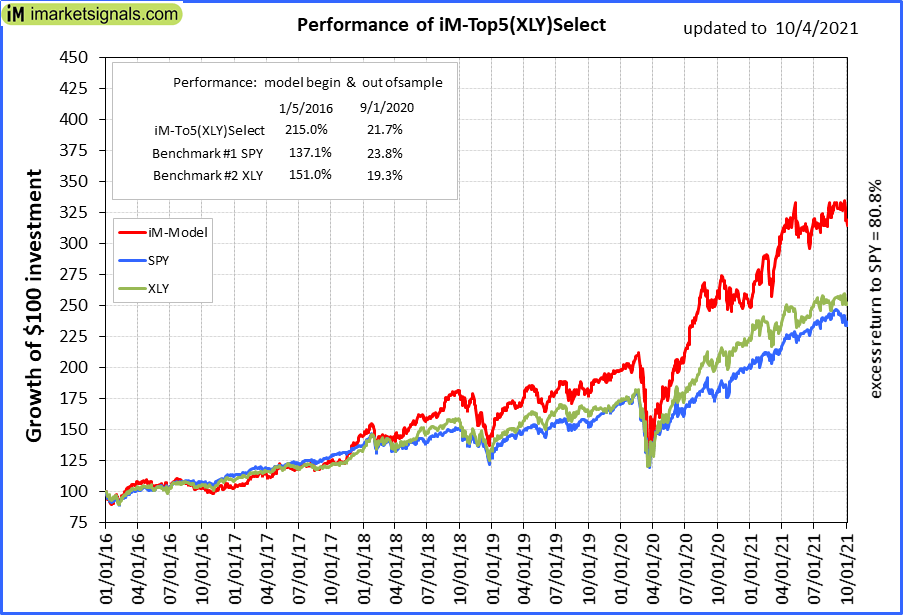 |
iM-Top5(XLY)Select: Since inception, on 1/5/2016, the model gained 214.59% while the benchmark SPY gained 133.83% over the same period. Over the previous week the market value of iM-Top5(XLY)Select gained -5.98% at a time when SPY gained -3.16%. A starting capital of $100,000 at inception on 1/5/2016 would have grown to $314,592 which includes $56 cash and excludes $3,209 spent on fees and slippage. |
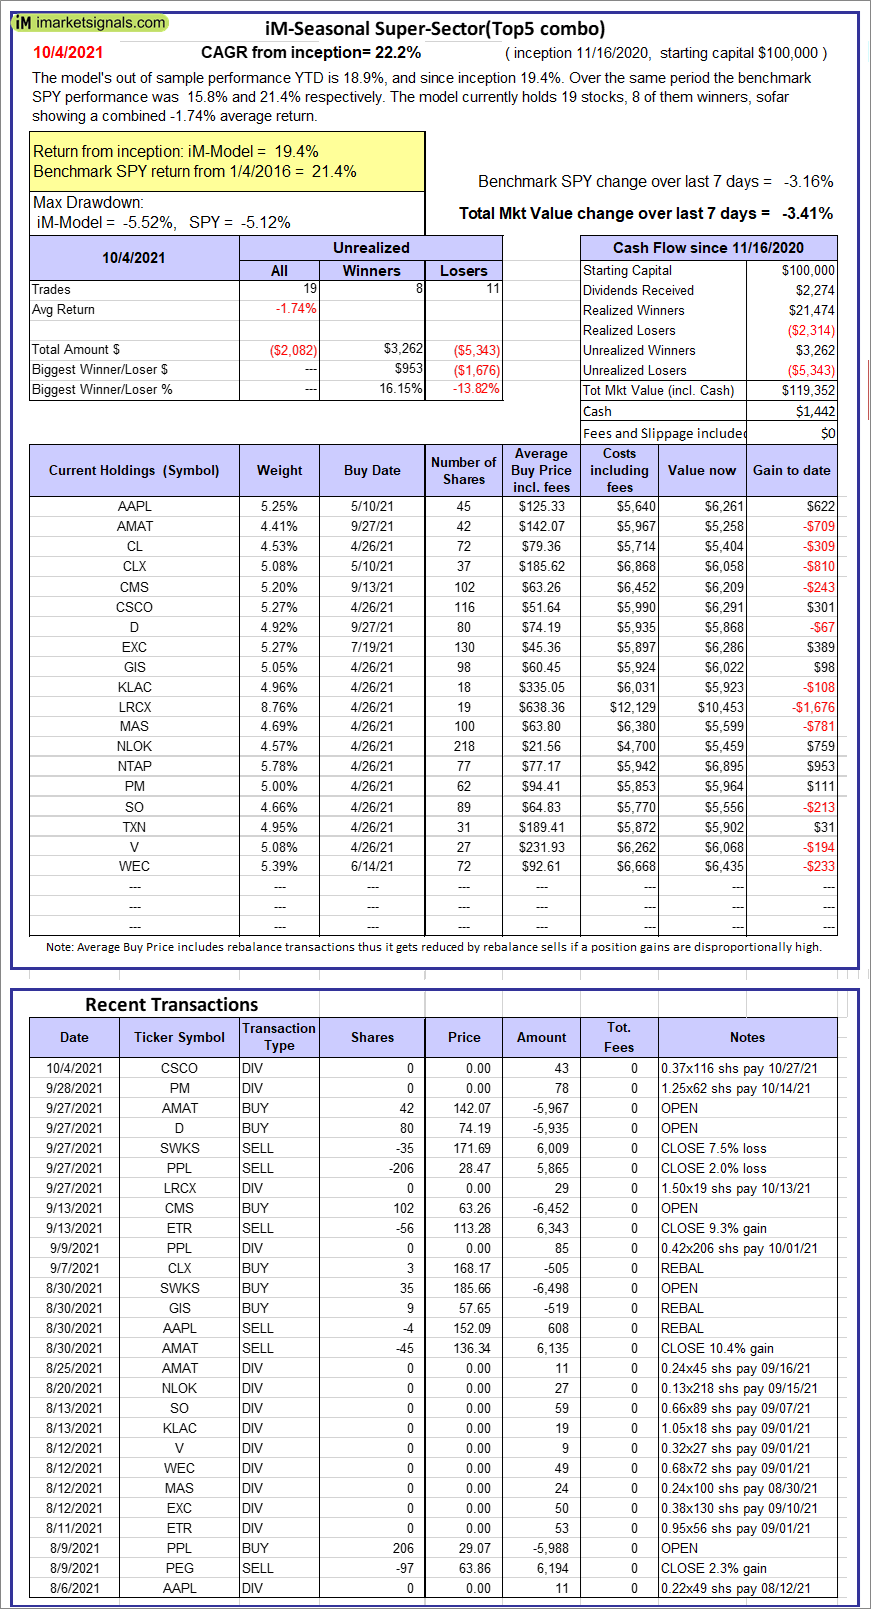 |
iM-Seasonal Super-Sectors (Top5 combo) : Since inception, on 11/17/2020, the model gained 19.35% while the benchmark SPY gained 21.38% over the same period. Over the previous week the market value of iM-Seasonal Super-Sectors (Top5 combo) gained -3.41% at a time when SPY gained -3.16%. A starting capital of $100,000 at inception on 11/17/2020 would have grown to $119,352 which includes $1,442 cash and excludes $00 spent on fees and slippage. |
 |
iM-Dividend Growth Portfolio: The model’s out of sample performance YTD is 15.7%, and for the last 12 months is 35.3%. Over the same period the benchmark SPY performance was 15.8% and 30.2% respectively. Over the previous week the market value of the iM-Dividend Growth Portfolio gained -3.38% at a time when SPY gained -3.16%. A starting capital of $100,000 at inception on 6/30/2016 would have grown to $391,824 which includes $2,479 cash and excludes $7,008 spent on fees and slippage. |
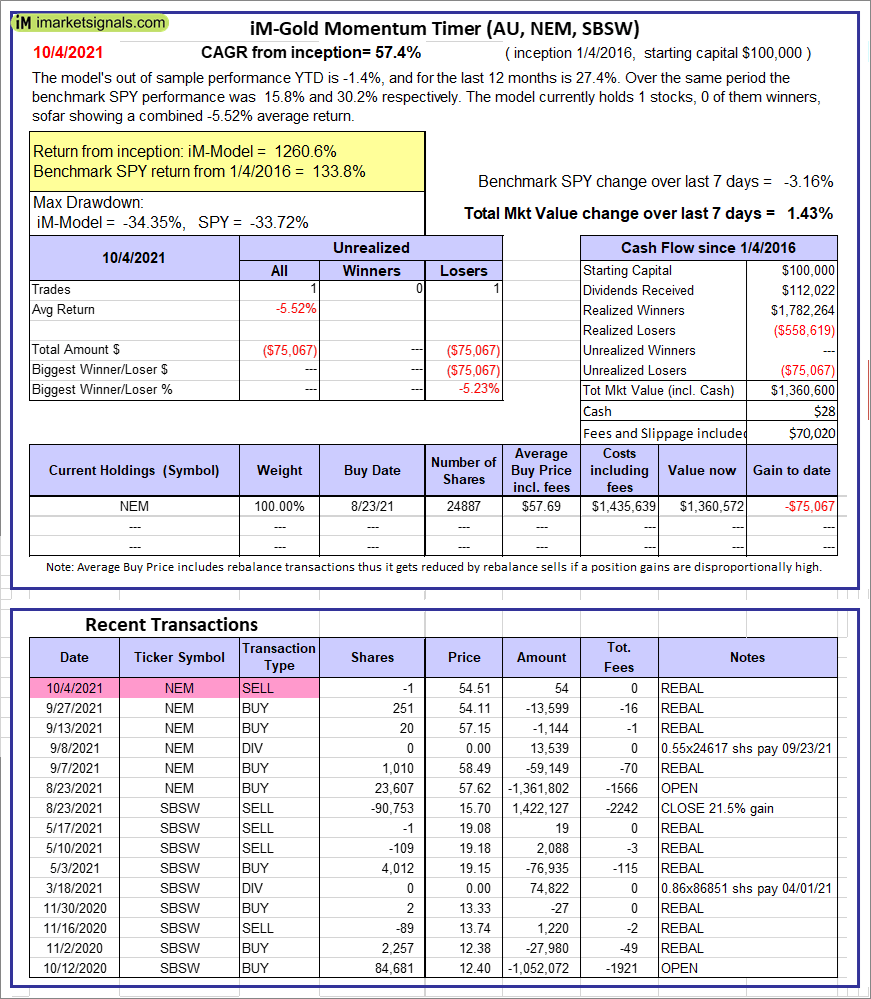 |
iM-Gold Momentum Timer (AU, NEM, SBSW): The model’s out of sample performance YTD is -1.4%, and for the last 12 months is 27.4%. Over the same period the benchmark SPY performance was 15.8% and 30.2% respectively. Over the previous week the market value of iM-Gold Momentum Timer (AU, NEM, SBSW) gained 1.43% at a time when SPY gained -3.16%. A starting capital of $100,000 at inception on 6/30/2016 would have grown to $28 which includes $70,020 cash and excludes Gain to date spent on fees and slippage. |
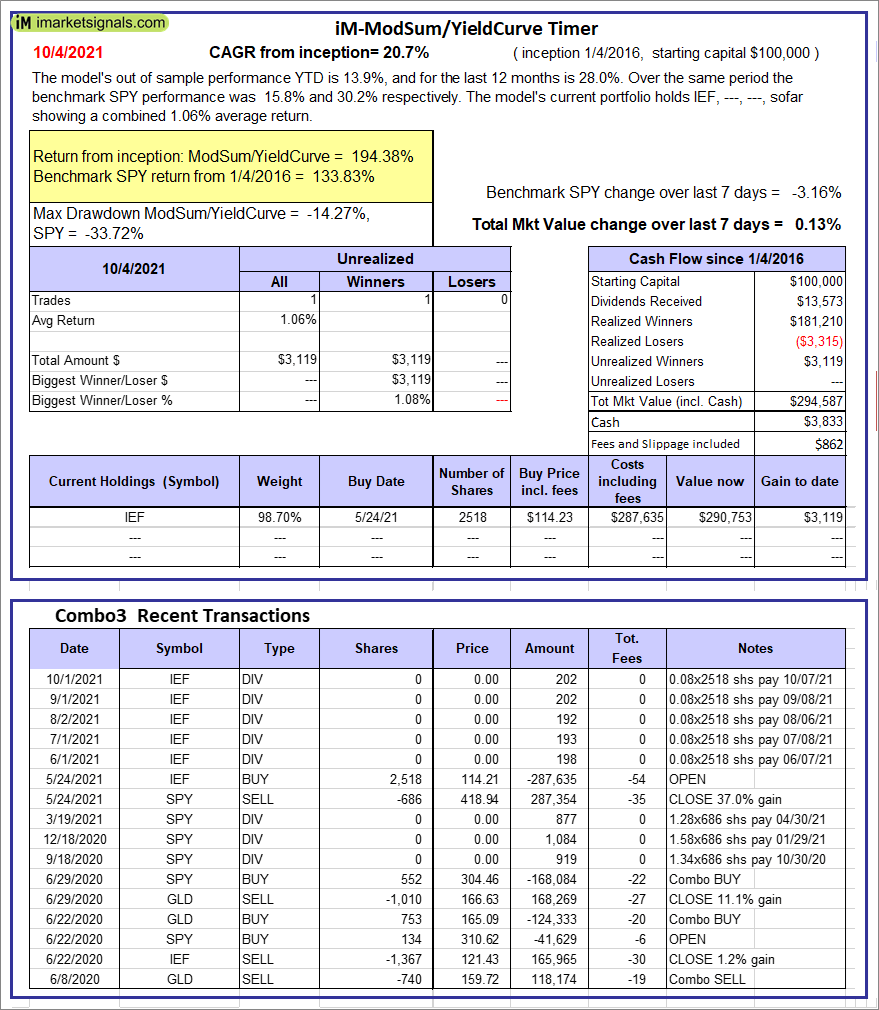 |
iM-ModSum/YieldCurve Timer: The model’s out of sample performance YTD is 13.9%, and for the last 12 months is 28.0%. Over the same period the benchmark SPY performance was 15.8% and 30.2% respectively. Over the previous week the market value of iM-PortSum/YieldCurve Timer gained 0.13% at a time when SPY gained -3.16%. A starting capital of $100,000 at inception on 1/1/2016 would have grown to $294,587 which includes $3,833 cash and excludes $862 spent on fees and slippage. |
 |
iM-Best(SPY-SH).R1: The model’s out of sample performance YTD is 15.7%, and for the last 12 months is 30.0%. Over the same period the benchmark SPY performance was 15.8% and 30.2% respectively. Over the previous week the market value of Best(SPY-SH) gained -3.12% at a time when SPY gained -3.16%. A starting capital of $100,000 at inception on 1/2/2009 would have grown to $766,244 which includes $10,552 cash and excludes $25,118 spent on fees and slippage. |
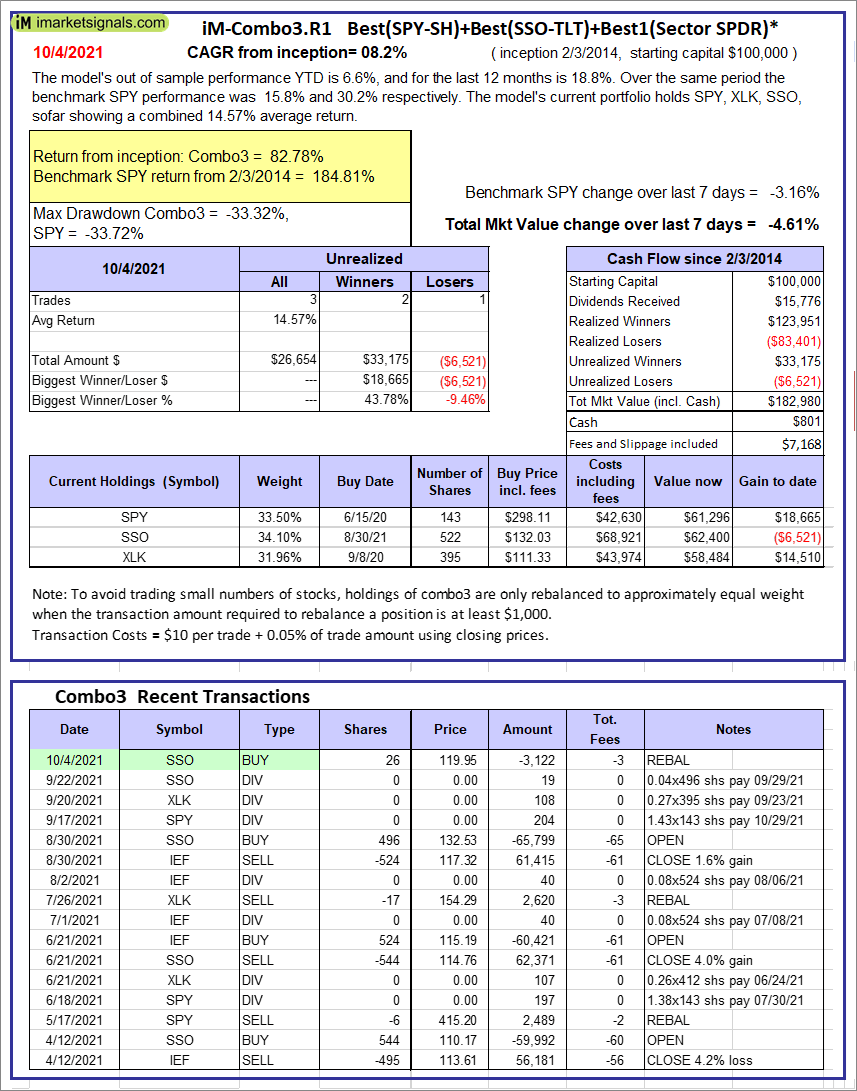 |
iM-Combo3.R1: The model’s out of sample performance YTD is 6.6%, and for the last 12 months is 18.8%. Over the same period the benchmark SPY performance was 15.8% and 30.2% respectively. Over the previous week the market value of iM-Combo3.R1 gained -4.61% at a time when SPY gained -3.16%. A starting capital of $100,000 at inception on 2/3/2014 would have grown to $182,980 which includes $801 cash and excludes $7,168 spent on fees and slippage. |
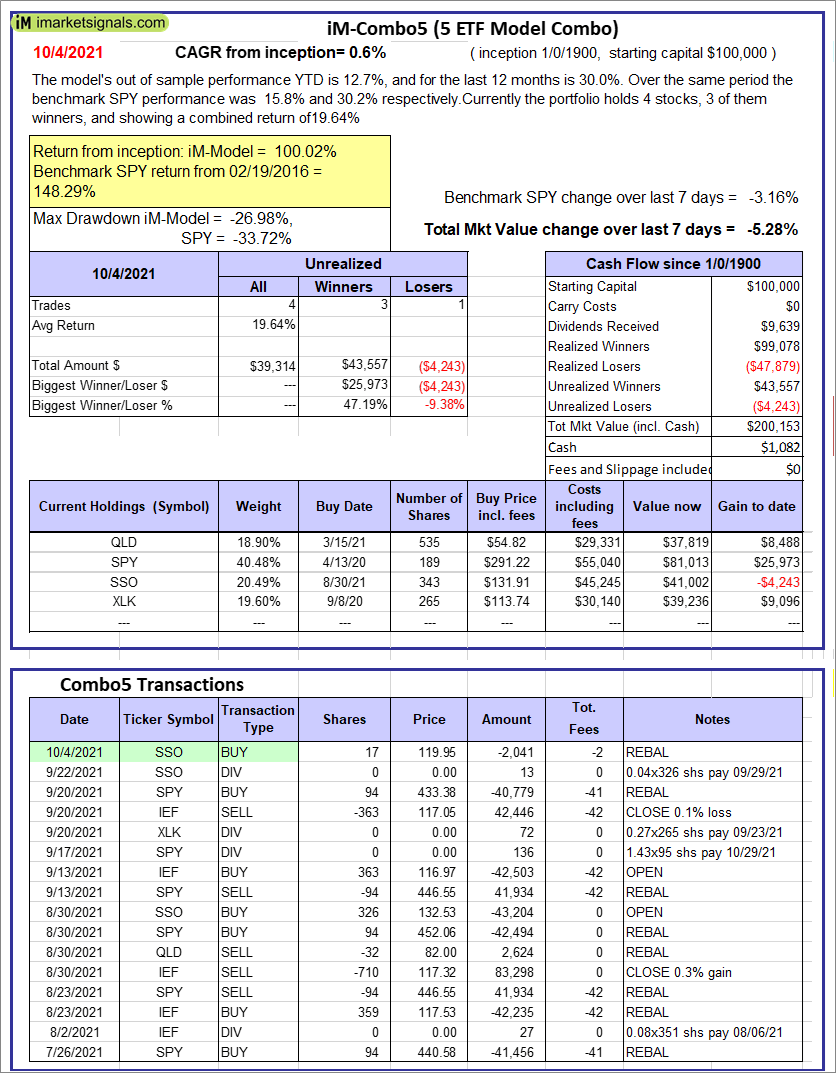 |
iM-Combo5: The model’s out of sample performance YTD is 12.7%, and for the last 12 months is 30.0%. Over the same period the benchmark SPY performance was 15.8% and 30.2% respectively. Over the previous week the market value of iM-Combo5 gained -5.28% at a time when SPY gained -3.16%. A starting capital of $100,000 at inception on 2/22/2016 would have grown to $200,153 which includes $1,082 cash and excludes $0 spent on fees and slippage. |
 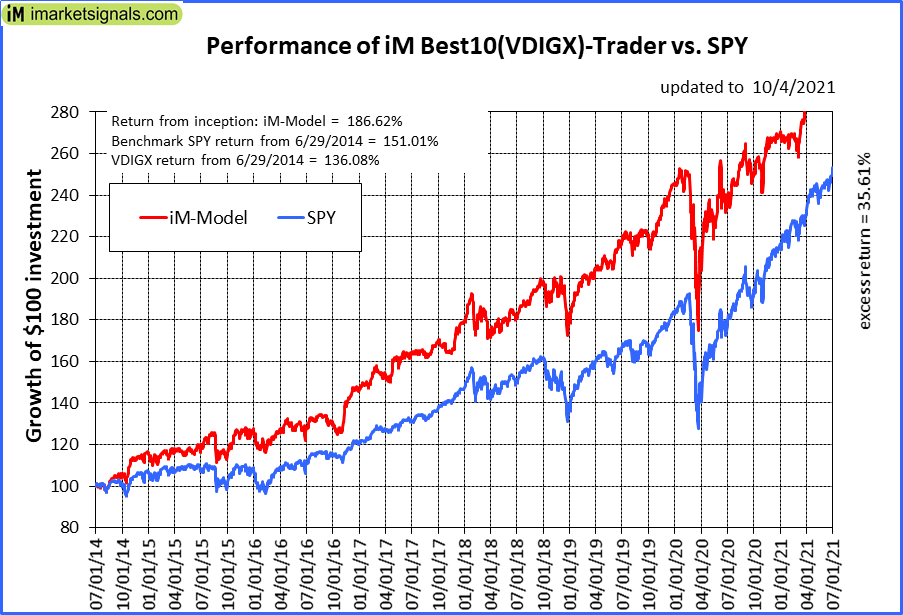 |
iM-Best10(VDIGX)-Trader: The model’s out of sample performance YTD is 5.9%, and for the last 12 months is 14.6%. Over the same period the benchmark SPY performance was 15.8% and 30.2% respectively. Since inception, on 7/1/2014, the model gained 186.62% while the benchmark SPY gained 151.01% and VDIGX gained 136.08% over the same period. Over the previous week the market value of iM-Best10(VDIGX) gained -3.57% at a time when SPY gained -3.16%. A starting capital of $100,000 at inception on 7/1/2014 would have grown to $286,617 which includes $654 cash and excludes $4,075 spent on fees and slippage. |
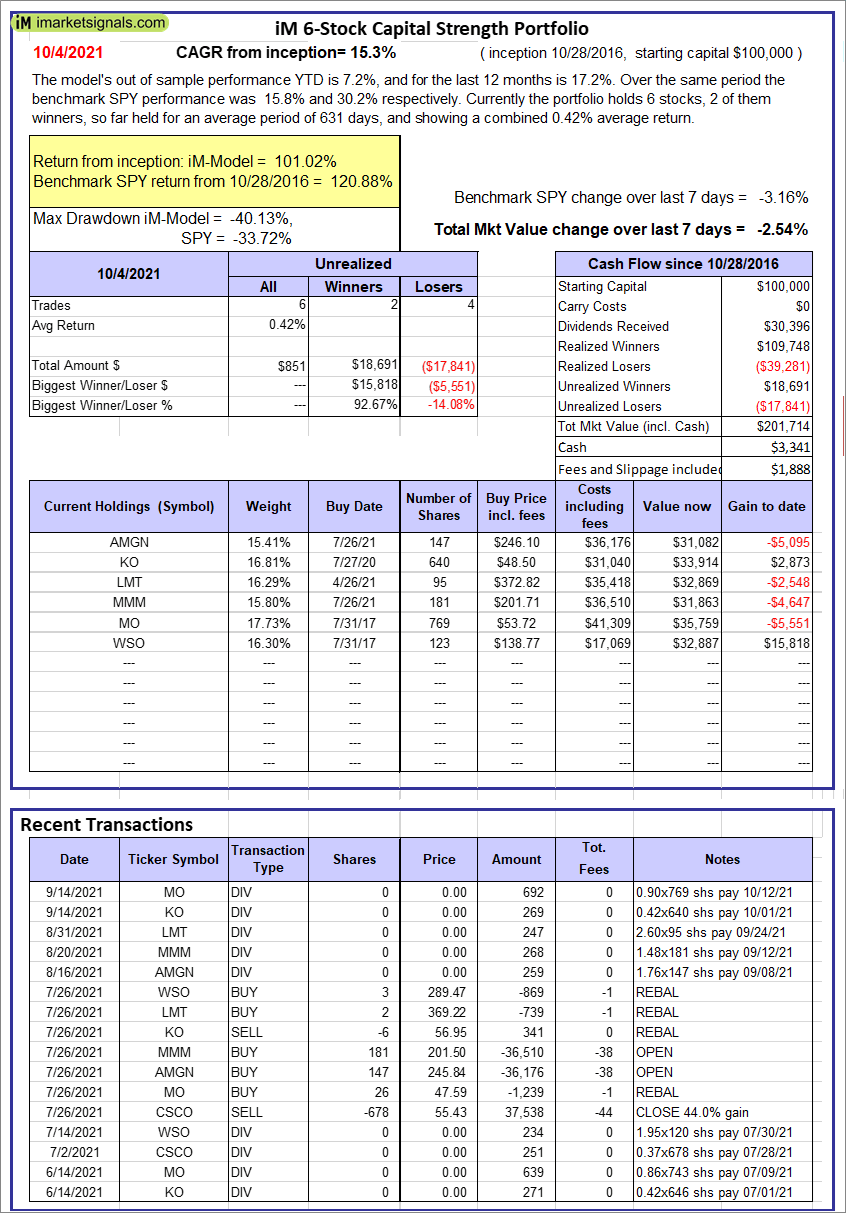 |
iM 6-Stock Capital Strength Portfolio: The model’s out of sample performance YTD is 7.2%, and for the last 12 months is 17.2%. Over the same period the benchmark SPY performance was 15.8% and 30.2% respectively. Over the previous week the market value of the iM 6-Stock Capital Strength Portfolio gained -2.54% at a time when SPY gained -3.16%. A starting capital of $100,000 at inception on 10/28/2016 would have grown to $201,714 which includes $3,341 cash and excludes $1,888 spent on fees and slippage. |
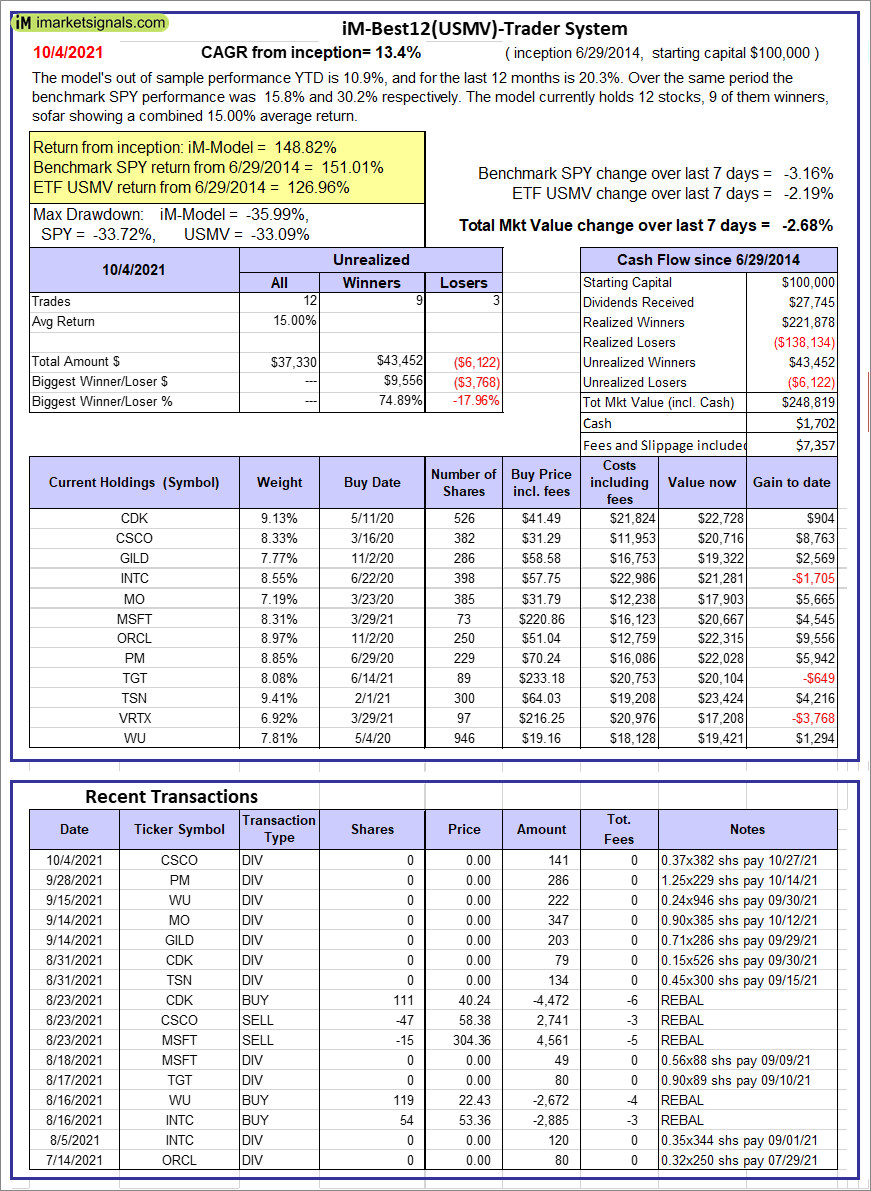 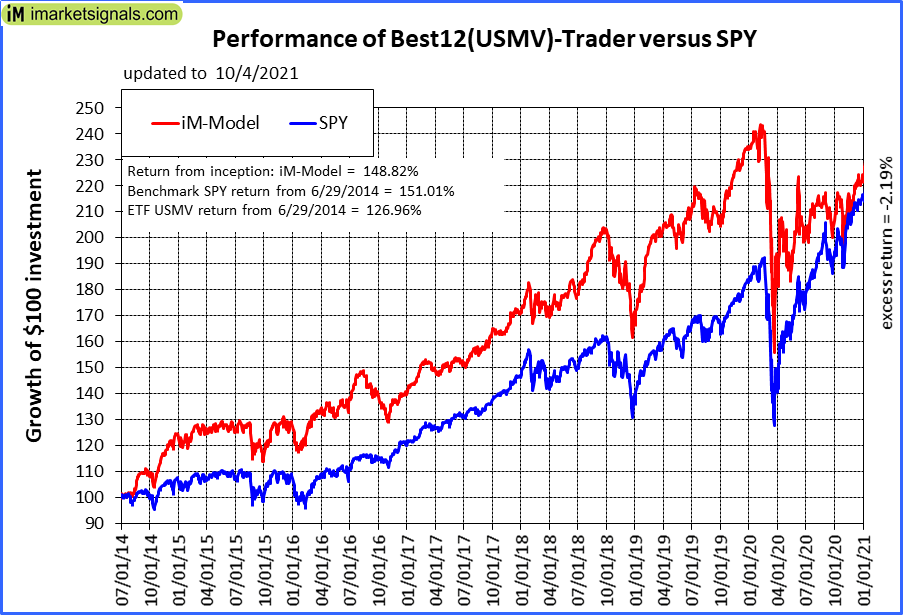 |
iM-Best12(USMV)-Trader: The model’s out of sample performance YTD is 10.9%, and for the last 12 months is 20.3%. Over the same period the benchmark SPY performance was 15.8% and 30.2% respectively. Since inception, on 6/30/2014, the model gained 148.82% while the benchmark SPY gained 151.01% and the ETF USMV gained 126.96% over the same period. Over the previous week the market value of iM-Best12(USMV)-Trader gained -2.68% at a time when SPY gained -3.16%. A starting capital of $100,000 at inception on 6/30/2014 would have grown to $248,819 which includes $1,702 cash and excludes $7,357 spent on fees and slippage. |
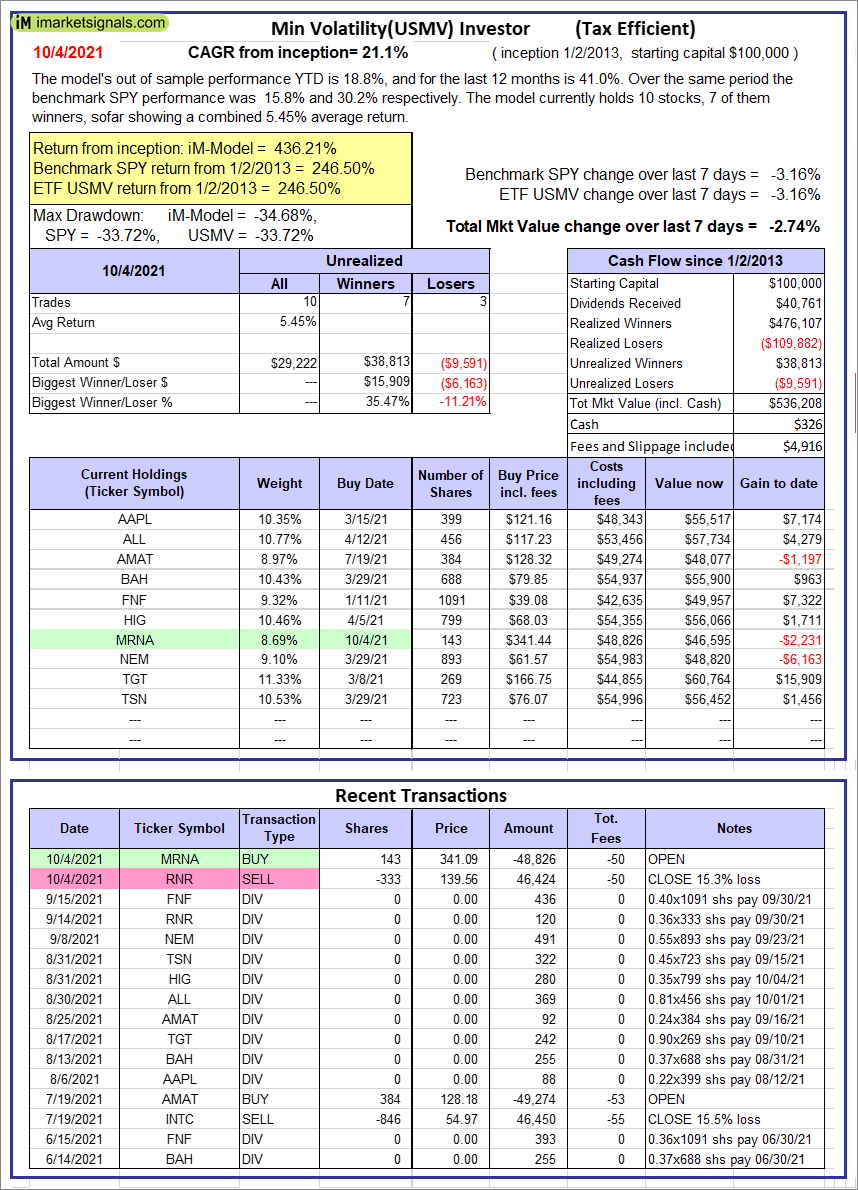  |
iM-Min Volatility(USMV) Investor (Tax Efficient): The model’s out of sample performance YTD is 18.8%, and for the last 12 months is 41.0%. Over the same period the benchmark SPY performance was 15.8% and 30.2% respectively. Since inception, on 1/3/2013, the model gained 436.21% while the benchmark SPY gained 246.50% and the ETF USMV gained 246.50% over the same period. Over the previous week the market value of iM-Best12(USMV)Q1 gained -2.74% at a time when SPY gained -3.16%. A starting capital of $100,000 at inception on 1/3/2013 would have grown to $536,208 which includes $326 cash and excludes $4,916 spent on fees and slippage. |
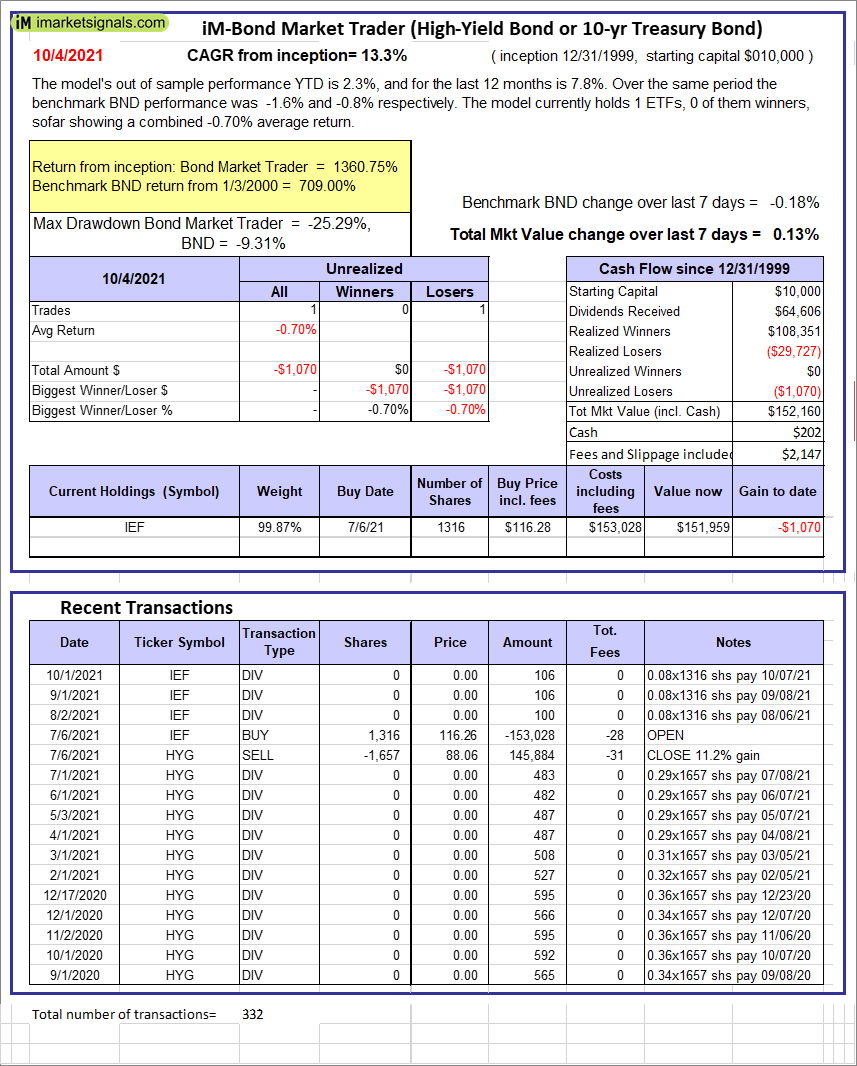 |
iM-Bond Market Trader (High-Yield Bond or 10-yr Treasury Bond): The model’s out of sample performance YTD is 2.3%, and for the last 12 months is 7.8%. Over the same period the benchmark BND performance was -1.6% and -0.8% respectively. Over the previous week the market value of the iM-Bond Market Trader (High-Yield Bond or 10-yr Treasury Bond) gained 0.13% at a time when BND gained -0.18%. A starting capital of $10,000 at inception on 1/3/2000 would have grown to $152,160 which includes $202 cash and excludes $2,147 spent on fees and slippage. |
|
|
iM-ModSum/YieldCurve Timer: The model’s out of sample performance YTD is 13.9%, and for the last 12 months is 28.0%. Over the same period the benchmark SPY performance was 15.8% and 30.2% respectively. Over the previous week the market value of iM-PortSum/YieldCurve Timer gained 0.13% at a time when SPY gained -3.16%. A starting capital of $100,000 at inception on 1/1/2016 would have grown to $294,587 which includes $3,833 cash and excludes $862 spent on fees and slippage. |
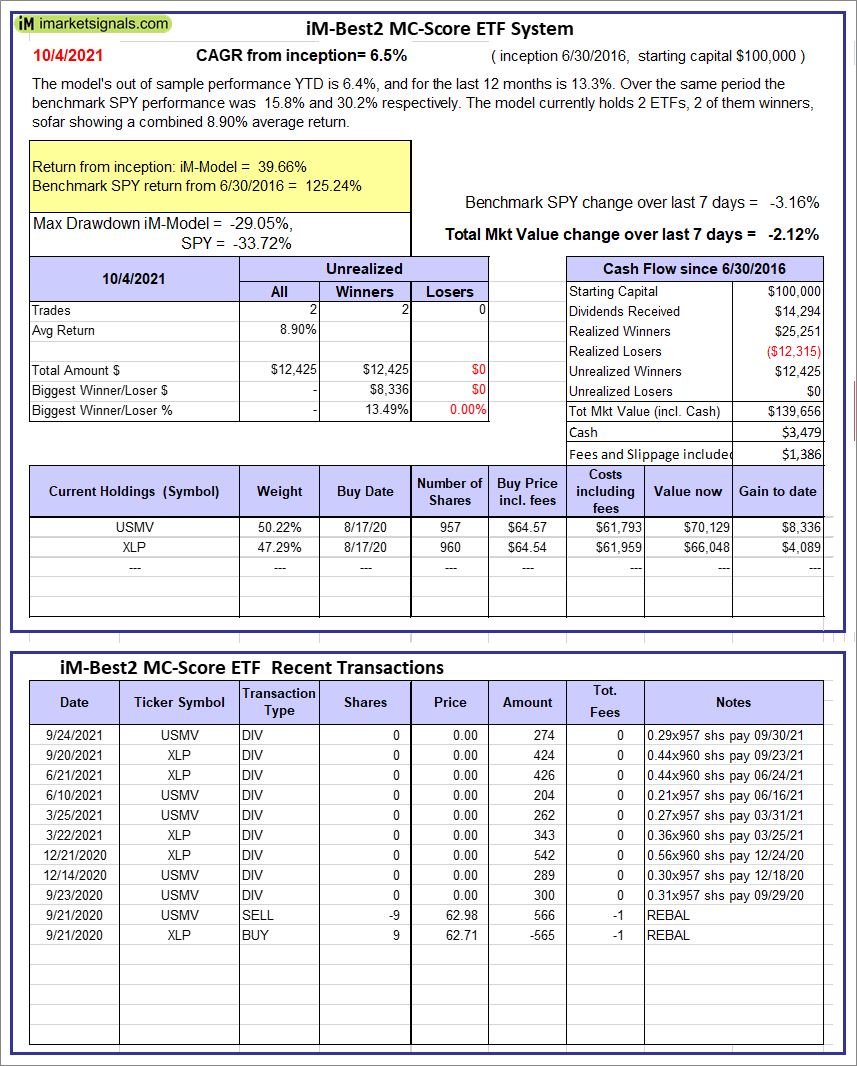 |
iM-Best2 MC-Score ETF System: The model’s out of sample performance YTD is 6.4%, and for the last 12 months is 13.3%. Over the same period the benchmark SPY performance was 15.8% and 30.2% respectively. Over the previous week the market value of the iM-Best2 MC-Score ETF System gained -2.12% at a time when SPY gained -3.16%. A starting capital of $100,000 at inception on 6/30/2016 would have grown to $139,656 which includes $3,479 cash and excludes $1,386 spent on fees and slippage. |
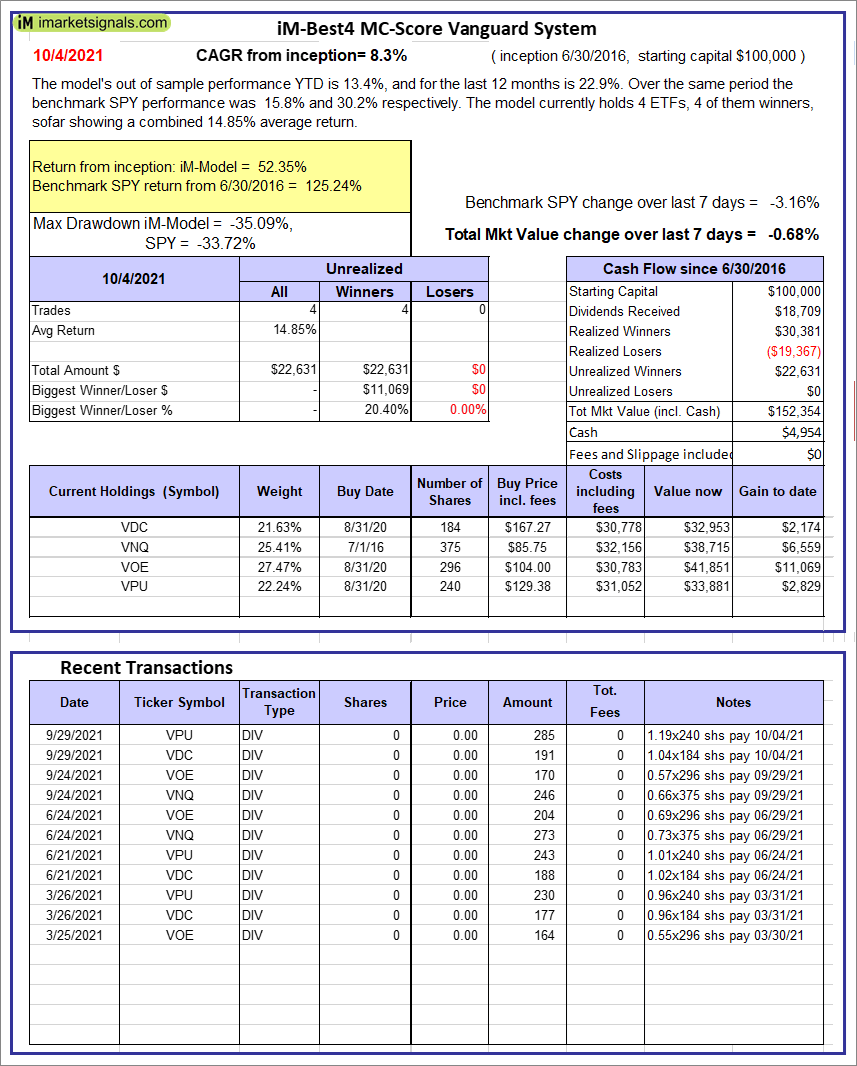 |
iM-Best4 MC-Score Vanguard System: The model’s out of sample performance YTD is 13.4%, and for the last 12 months is 22.9%. Over the same period the benchmark SPY performance was 15.8% and 30.2% respectively. Over the previous week the market value of the iM-Best4 MC-Score Vanguard System gained -0.68% at a time when SPY gained -3.16%. A starting capital of $100,000 at inception on 6/30/2016 would have grown to $152,354 which includes $4,954 cash and excludes $00 spent on fees and slippage. |
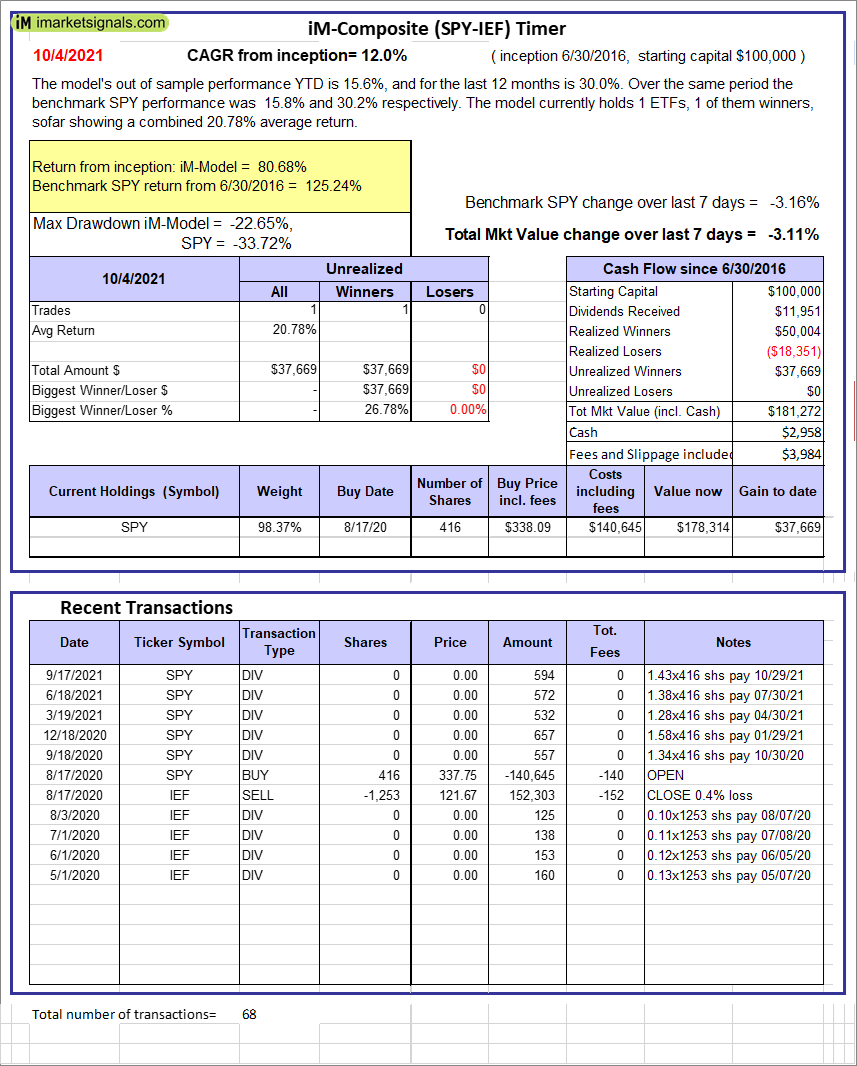 |
iM-Composite (SPY-IEF) Timer: The model’s out of sample performance YTD is 15.6%, and for the last 12 months is 30.0%. Over the same period the benchmark SPY performance was 15.8% and 30.2% respectively. Over the previous week the market value of the iM-Composite (SPY-IEF) Timer gained -3.11% at a time when SPY gained -3.16%. A starting capital of $100,000 at inception on 6/30/2016 would have grown to $181,272 which includes $2,958 cash and excludes $3,984 spent on fees and slippage. |
 |
iM-Composite(Gold-Stocks-Bond) Timer: The model’s out of sample performance YTD is -6.0%, and for the last 12 months is 6.6%. Over the same period the benchmark SPY performance was 15.8% and 30.2% respectively. Over the previous week the market value of the iM-Composite(Gold-Stocks-Bond) Timer gained -4.31% at a time when SPY gained -3.16%. A starting capital of $100,000 at inception on 6/30/2016 would have grown to $156,242 which includes -$1,343 cash and excludes $7,546 spent on fees and slippage. |
iM-Best Reports – 10/4/21
Posted in pmp SPY-SH
Leave a Reply
You must be logged in to post a comment.