
  |
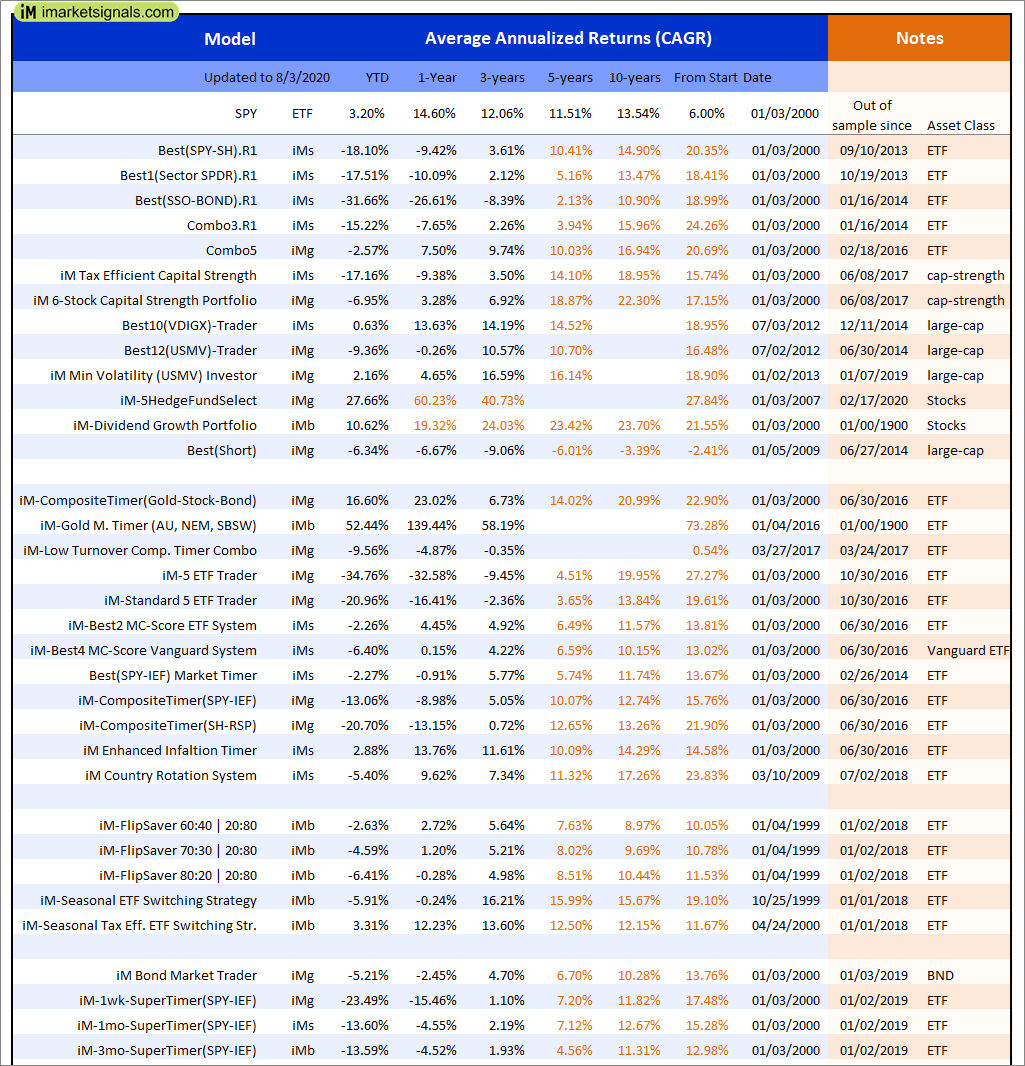
Out of sample performance summary of our models for the past 1, 2, 4 and 13 week periods. The active active return indicates how the models over- or underperformed the benchmark ETF SPY. Also the YTD, and the 1-, 3-, 5- and 10-year annualized returns are shown in the second table |
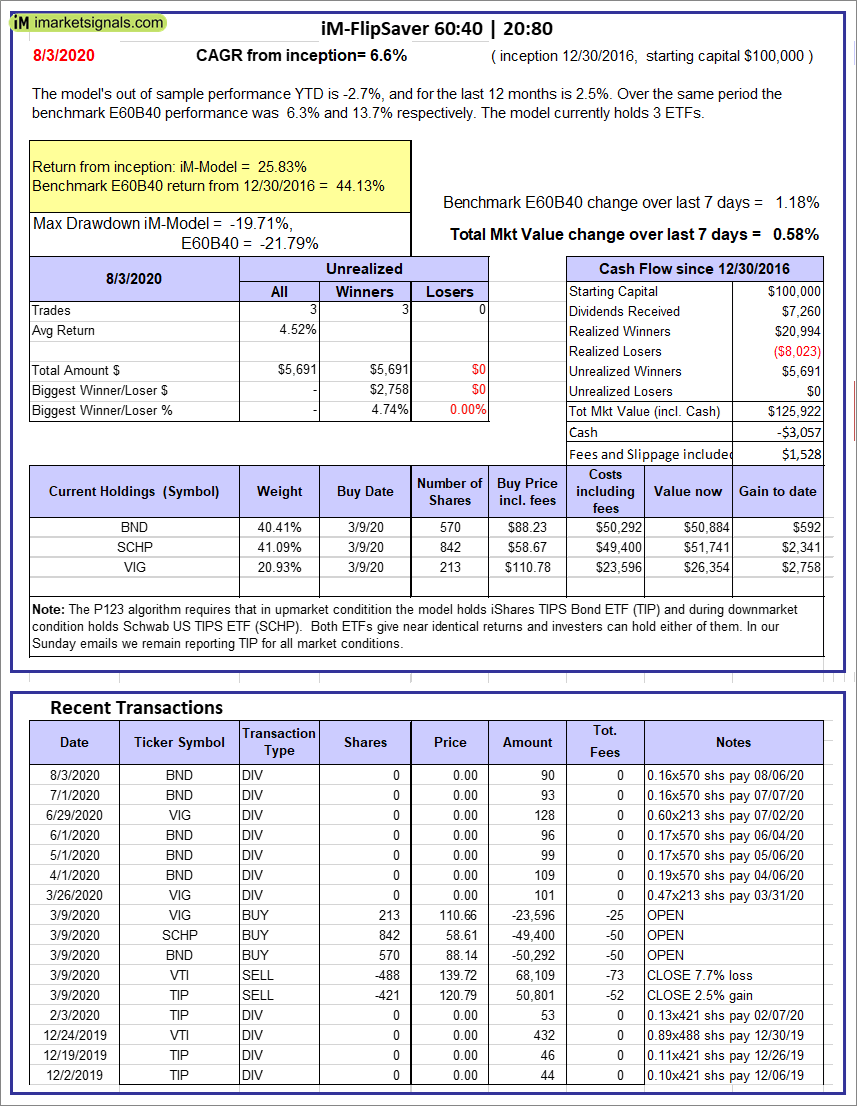 |
iM-FlipSaver 60:40 | 20:80 – 2017: The model’s out of sample performance YTD is -2.7%, and for the last 12 months is 2.5%. Over the same period the benchmark E60B40 performance was 6.3% and 13.7% respectively. Over the previous week the market value of iM-FlipSaver 80:20 | 20:80 gained 0.58% at a time when SPY gained 1.18%. A starting capital of $100,000 at inception on 7/16/2015 would have grown to $125,922 which includes -$3,057 cash and excludes $1,528 spent on fees and slippage. |
 |
iM-FlipSaver 70:30 | 20:80 – 2017: The model’s out of sample performance YTD is -4.6%, and for the last 12 months is 1.1%. Over the same period the benchmark E60B40 performance was 6.3% and 13.7% respectively. Over the previous week the market value of iM-FlipSaver 70:30 | 20:80 gained 0.59% at a time when SPY gained 1.18%. A starting capital of $100,000 at inception on 7/15/2015 would have grown to $126,535 which includes -$3,904 cash and excludes $1,661 spent on fees and slippage. |
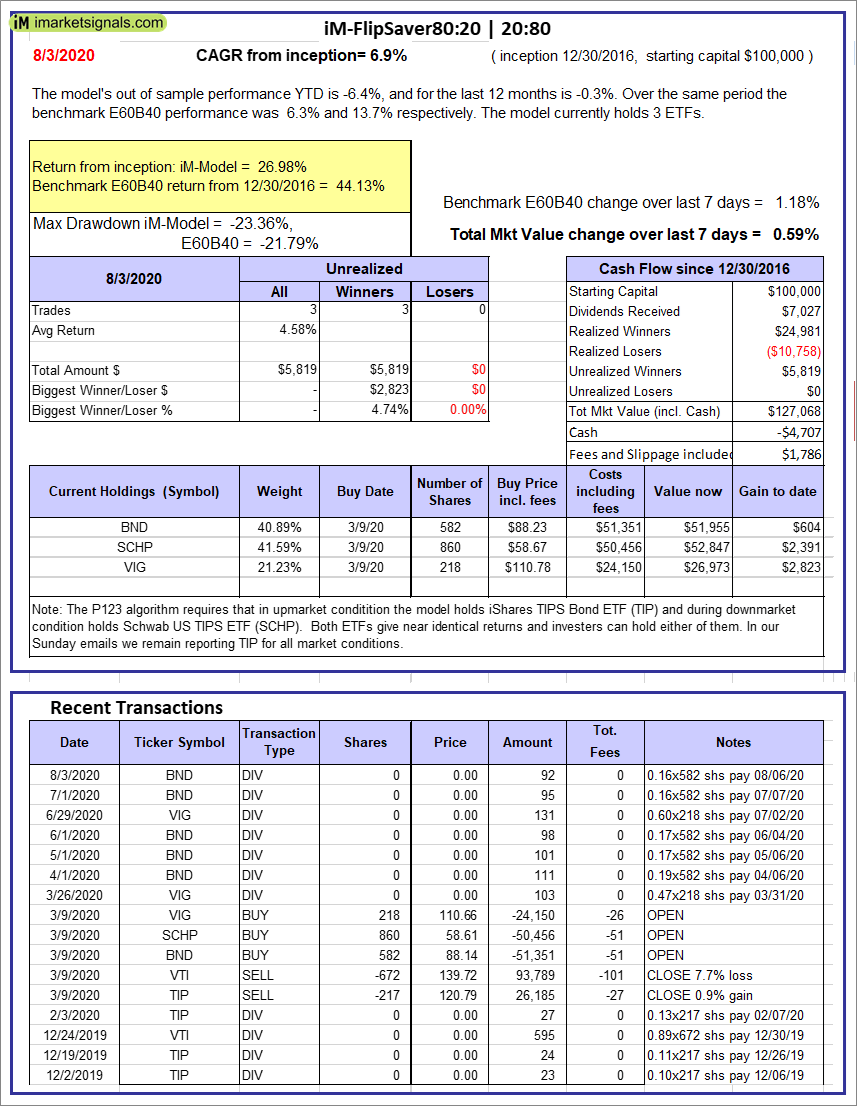 |
iM-FlipSaver 80:20 | 20:80 – 2017: The model’s out of sample performance YTD is -6.4%, and for the last 12 months is -0.3%. Over the same period the benchmark E60B40 performance was 6.3% and 13.7% respectively. Over the previous week the market value of iM-FlipSaver 80:20 | 20:80 gained 0.59% at a time when SPY gained 1.18%. A starting capital of $100,000 at inception on 1/2/2017 would have grown to $127,068 which includes -$4,707 cash and excludes $1,786 spent on fees and slippage. |
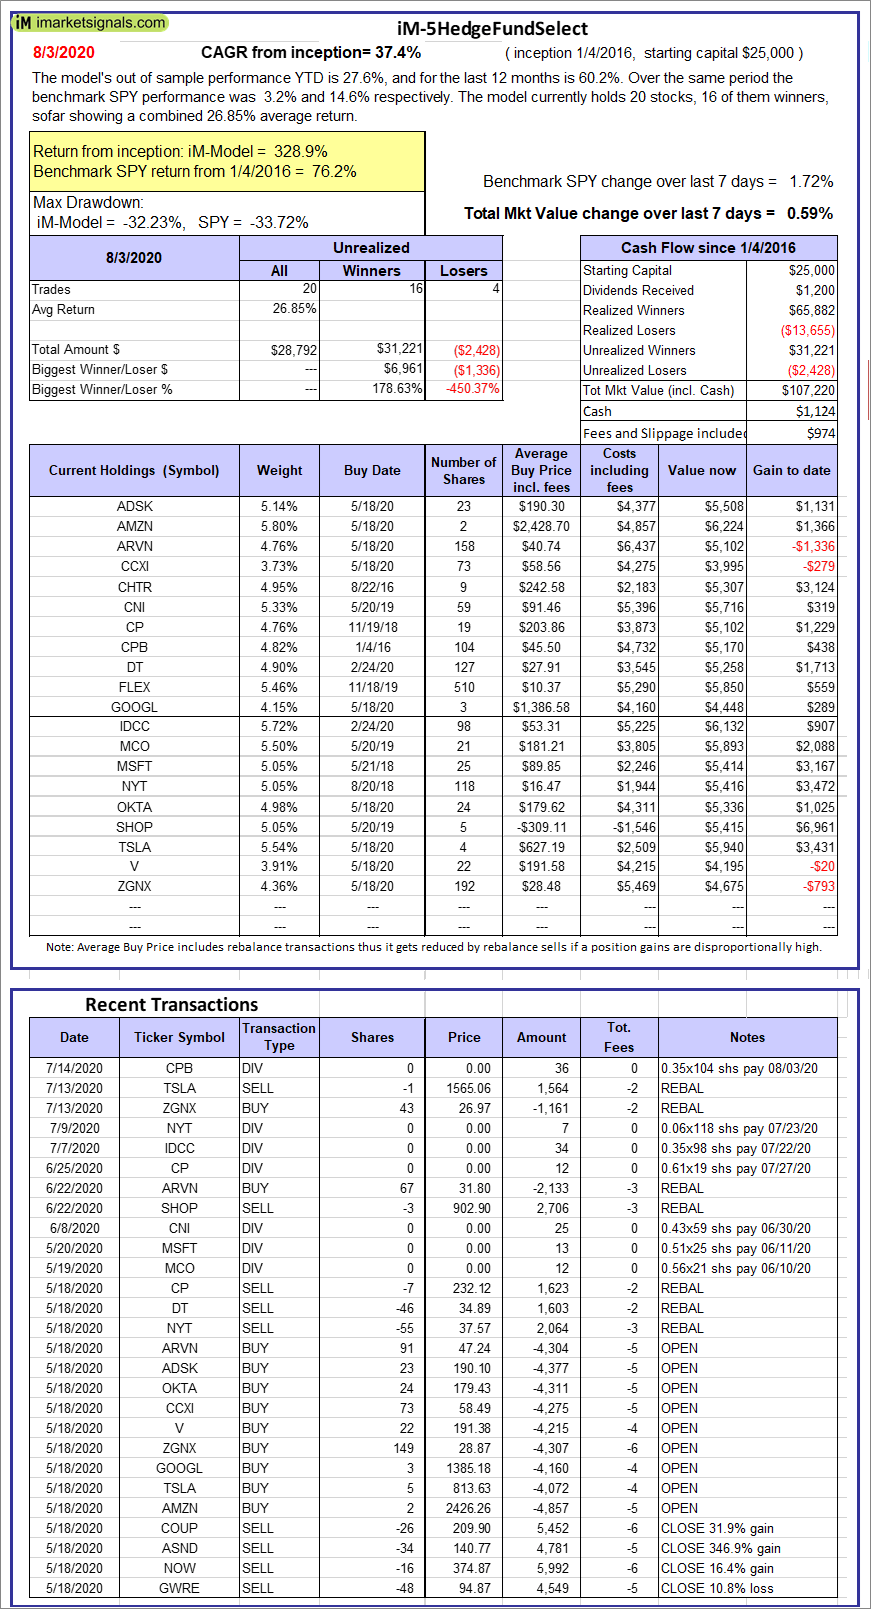 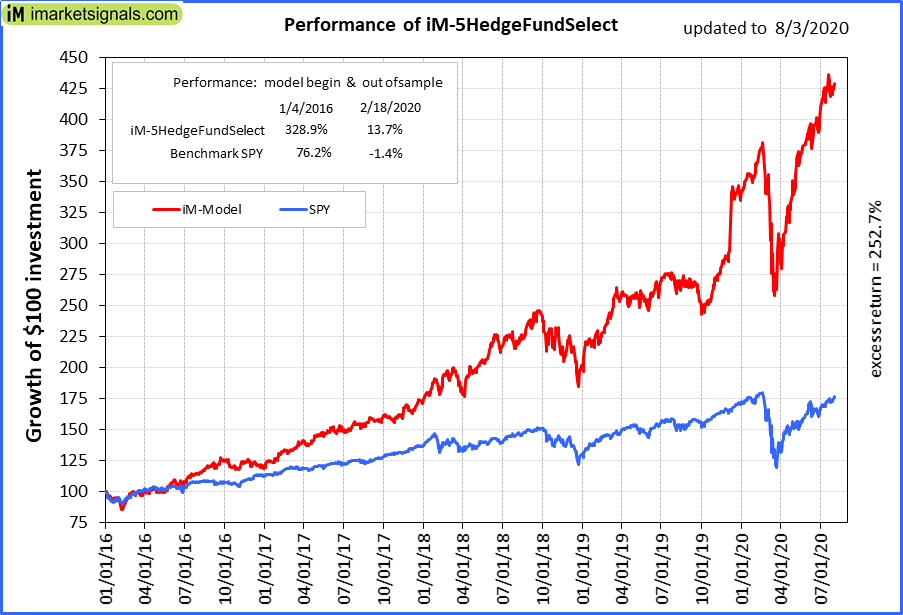 |
iM-5HedgeFundSelect: Since inception, on 1/5/2016, the model gained 328.88% while the benchmark SPY gained 76.17% over the same period. Over the previous week the market value of iM-5HedgeFundSelect gained 0.59% at a time when SPY gained 1.72%. A starting capital of $25,000 at inception on 1/5/2016 would have grown to $107,220 which includes $1,124 cash and excludes $974 spent on fees and slippage. |
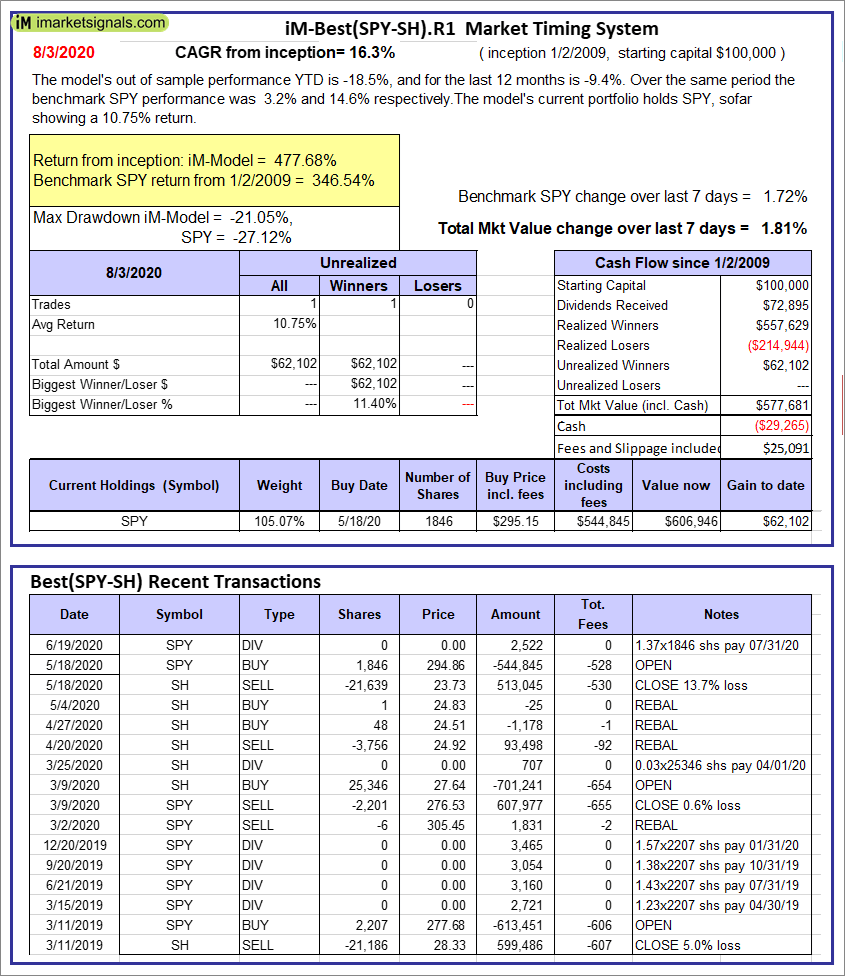 |
iM-Best(SPY-SH).R1: The model’s out of sample performance YTD is -18.5%, and for the last 12 months is -9.4%. Over the same period the benchmark SPY performance was 3.2% and 14.6% respectively. Over the previous week the market value of Best(SPY-SH) gained 1.81% at a time when SPY gained 1.72%. A starting capital of $100,000 at inception on 1/2/2009 would have grown to $577,681 which includes -$29,265 cash and excludes $25,091 spent on fees and slippage. |
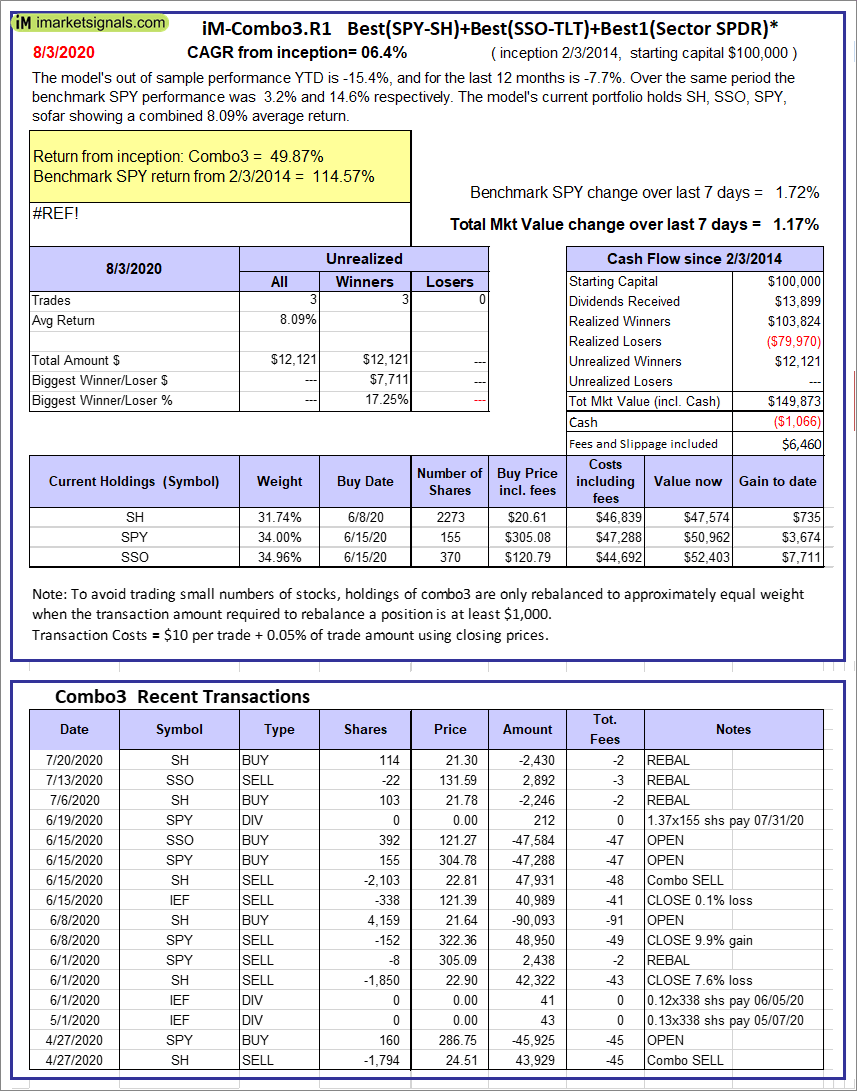 |
iM-Combo3.R1: The model’s out of sample performance YTD is -15.4%, and for the last 12 months is -7.7%. Over the same period the benchmark SPY performance was 3.2% and 14.6% respectively. Over the previous week the market value of iM-Combo3.R1 gained 1.17% at a time when SPY gained 1.72%. A starting capital of $100,000 at inception on 2/3/2014 would have grown to $149,873 which includes -$1,066 cash and excludes $6,460 spent on fees and slippage. |
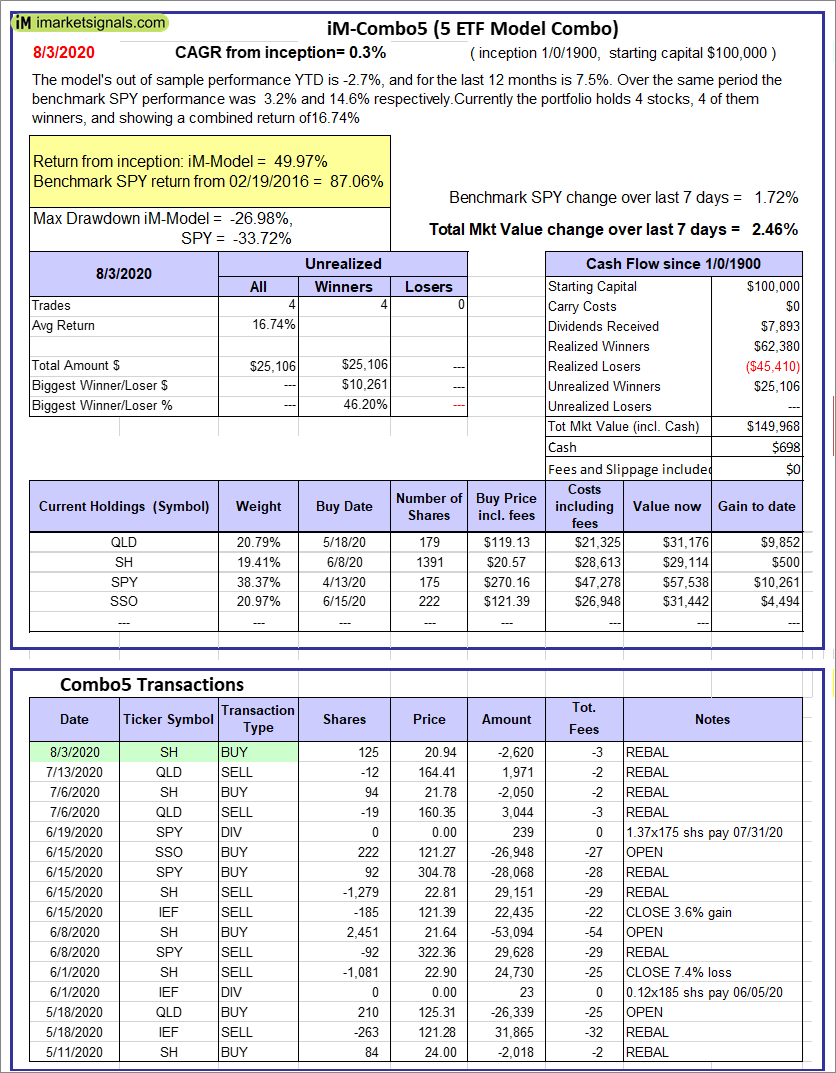 |
iM-Combo5: The model’s out of sample performance YTD is -2.7%, and for the last 12 months is 7.5%. Over the same period the benchmark SPY performance was 3.2% and 14.6% respectively. Over the previous week the market value of iM-Combo5 gained 2.46% at a time when SPY gained 1.72%. A starting capital of $100,000 at inception on 2/22/2016 would have grown to $149,968 which includes $698 cash and excludes $0 spent on fees and slippage. |
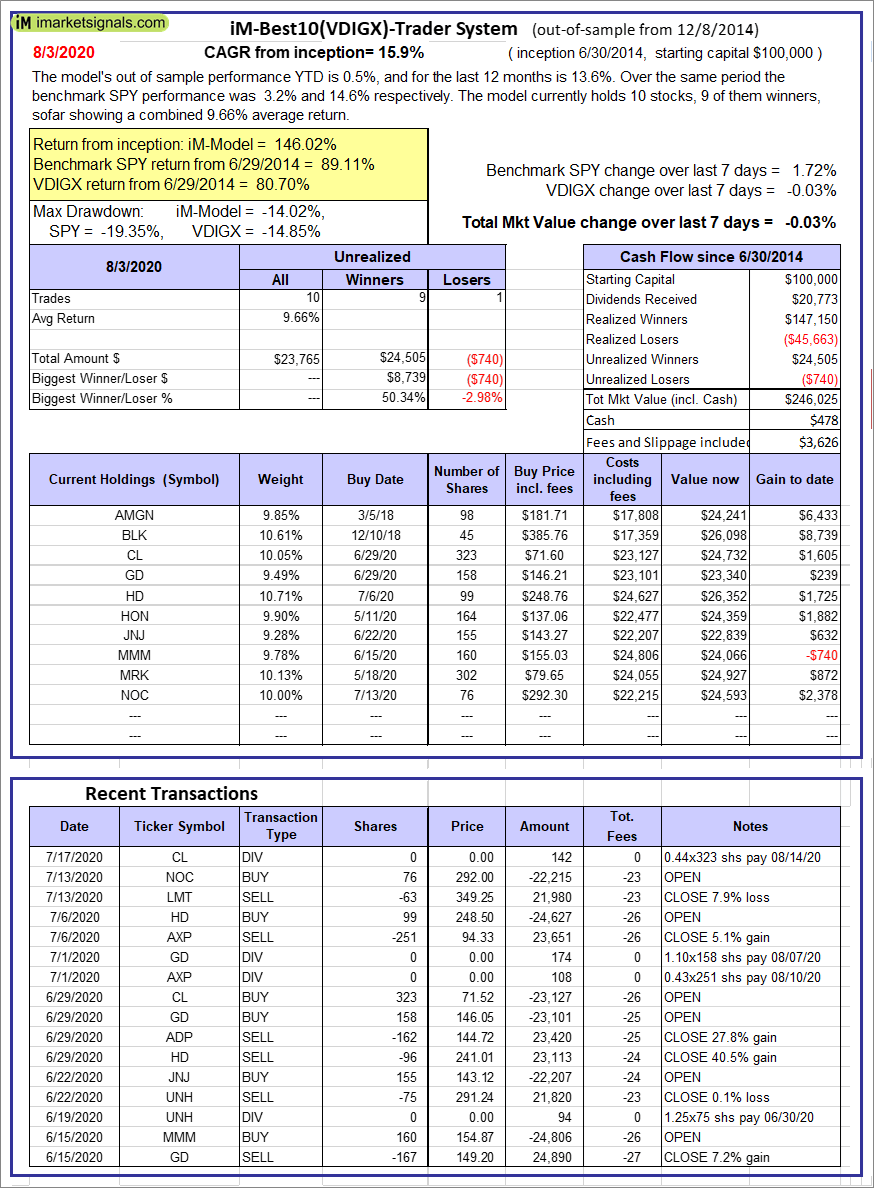 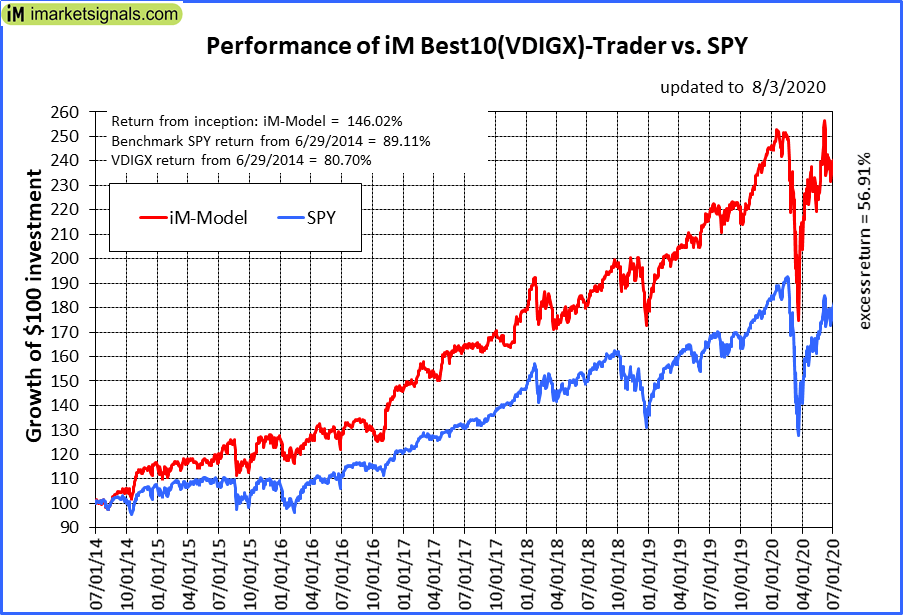 |
iM-Best10(VDIGX)-Trader: The model’s out of sample performance YTD is 0.5%, and for the last 12 months is 13.6%. Over the same period the benchmark SPY performance was 3.2% and 14.6% respectively. Since inception, on 7/1/2014, the model gained 146.02% while the benchmark SPY gained 89.11% and VDIGX gained 80.70% over the same period. Over the previous week the market value of iM-Best10(VDIGX) gained -0.03% at a time when SPY gained 1.72%. A starting capital of $100,000 at inception on 7/1/2014 would have grown to $246,025 which includes $478 cash and excludes $3,626 spent on fees and slippage. |
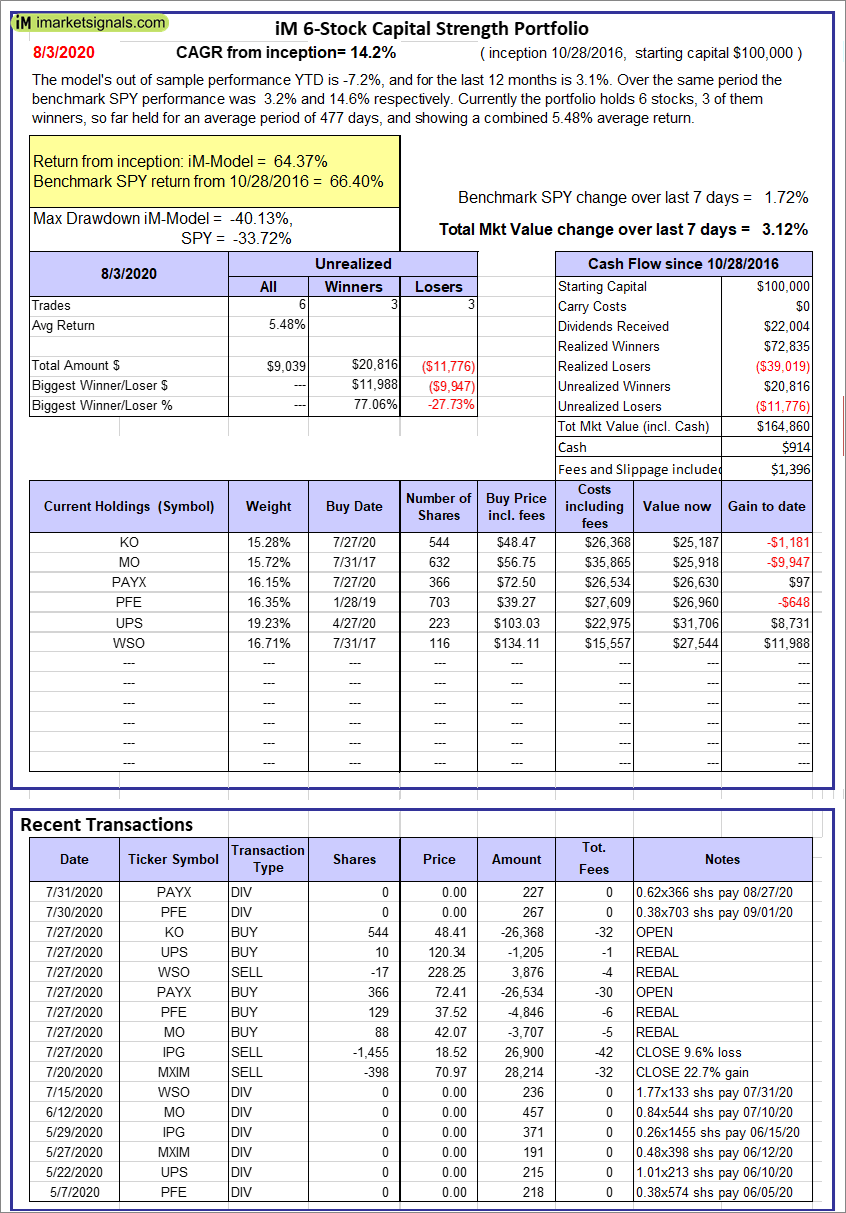 |
iM 6-Stock Capital Strength Portfolio: The model’s out of sample performance YTD is -7.2%, and for the last 12 months is 3.1%. Over the same period the benchmark SPY performance was 3.2% and 14.6% respectively. Over the previous week the market value of the iM 6-Stock Capital Strength Portfolio gained 3.12% at a time when SPY gained 1.72%. A starting capital of $100,000 at inception on 10/28/2016 would have grown to $164,860 which includes $914 cash and excludes $1,396 spent on fees and slippage. |
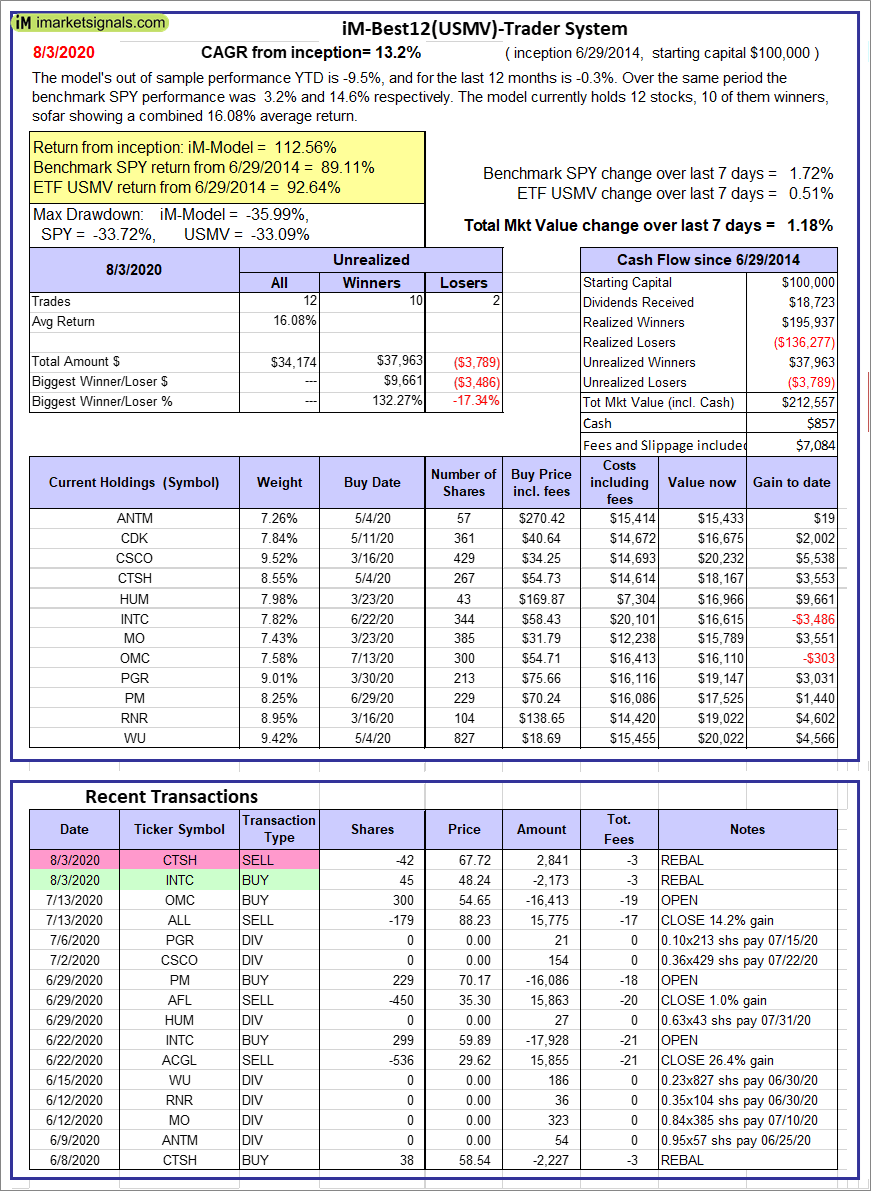 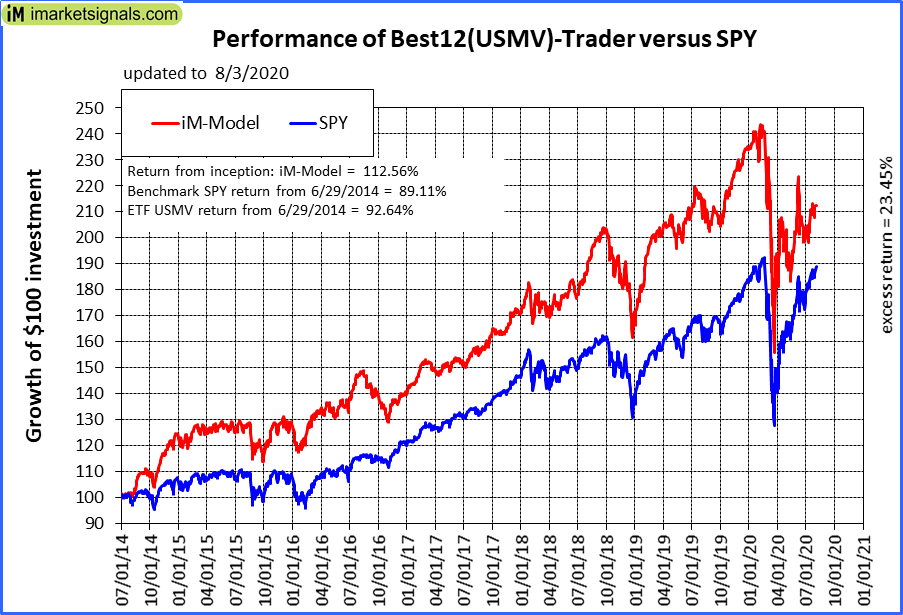 |
iM-Best12(USMV)-Trader: The model’s out of sample performance YTD is -9.5%, and for the last 12 months is -0.3%. Over the same period the benchmark SPY performance was 3.2% and 14.6% respectively. Since inception, on 6/30/2014, the model gained 112.56% while the benchmark SPY gained 89.11% and the ETF USMV gained 92.64% over the same period. Over the previous week the market value of iM-Best12(USMV)-Trader gained 1.18% at a time when SPY gained 1.72%. A starting capital of $100,000 at inception on 6/30/2014 would have grown to $212,557 which includes $857 cash and excludes $7,084 spent on fees and slippage. |
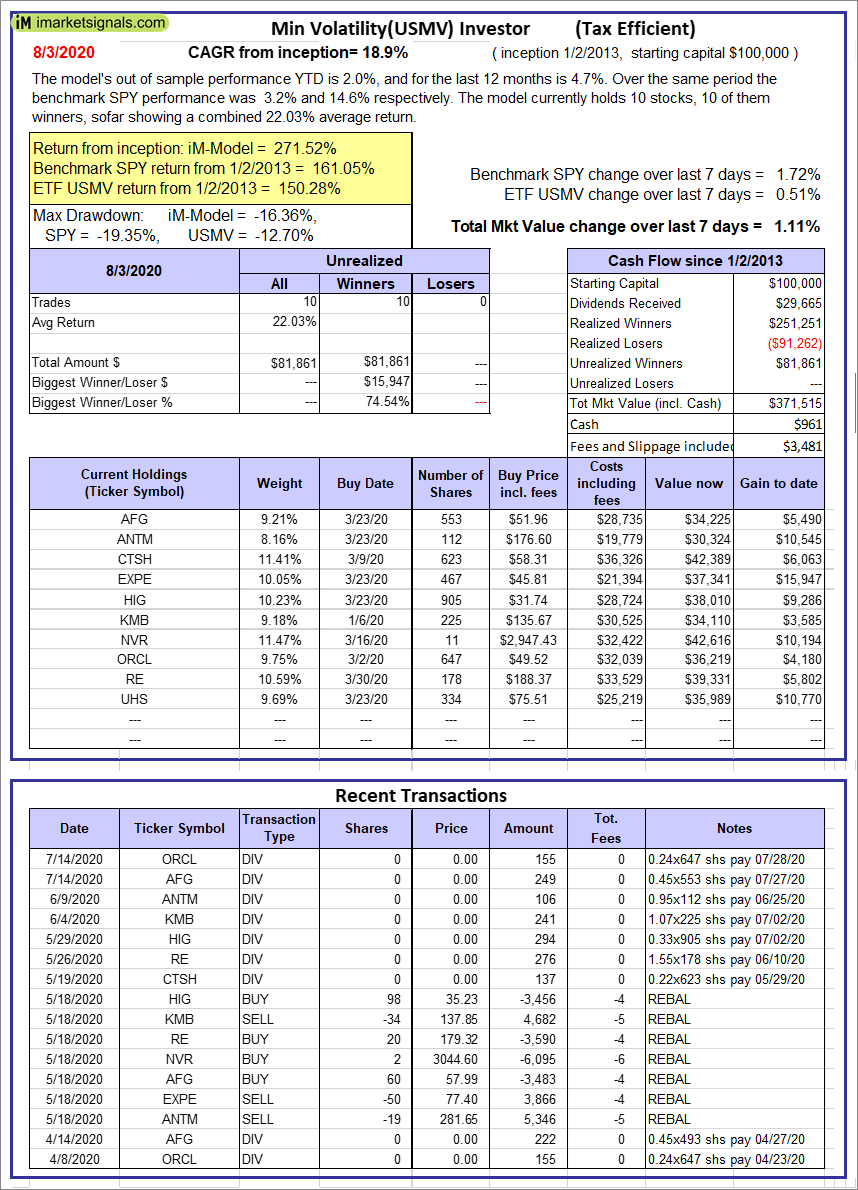 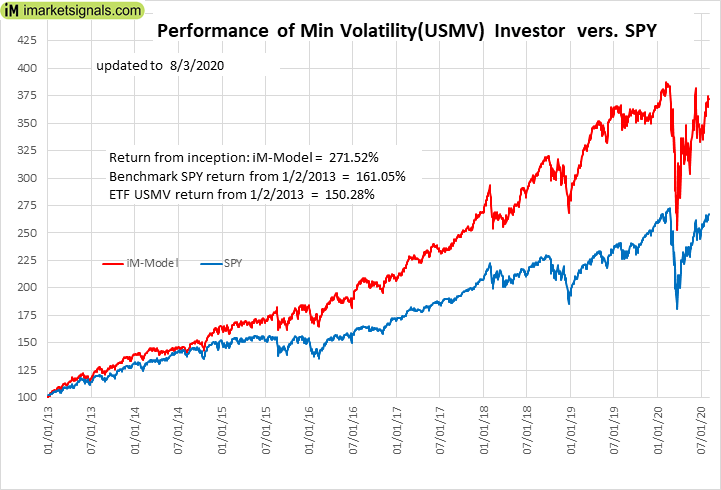 |
iM-Min Volatility(USMV) Investor (Tax Efficient): The model’s out of sample performance YTD is 2.0%, and for the last 12 months is 4.7%. Over the same period the benchmark SPY performance was 3.2% and 14.6% respectively. Since inception, on 1/3/2013, the model gained 271.52% while the benchmark SPY gained 161.05% and the ETF USMV gained 150.28% over the same period. Over the previous week the market value of iM-Best12(USMV)Q1 gained 1.11% at a time when SPY gained 1.72%. A starting capital of $100,000 at inception on 1/3/2013 would have grown to $371,515 which includes $961 cash and excludes $3,481 spent on fees and slippage. |
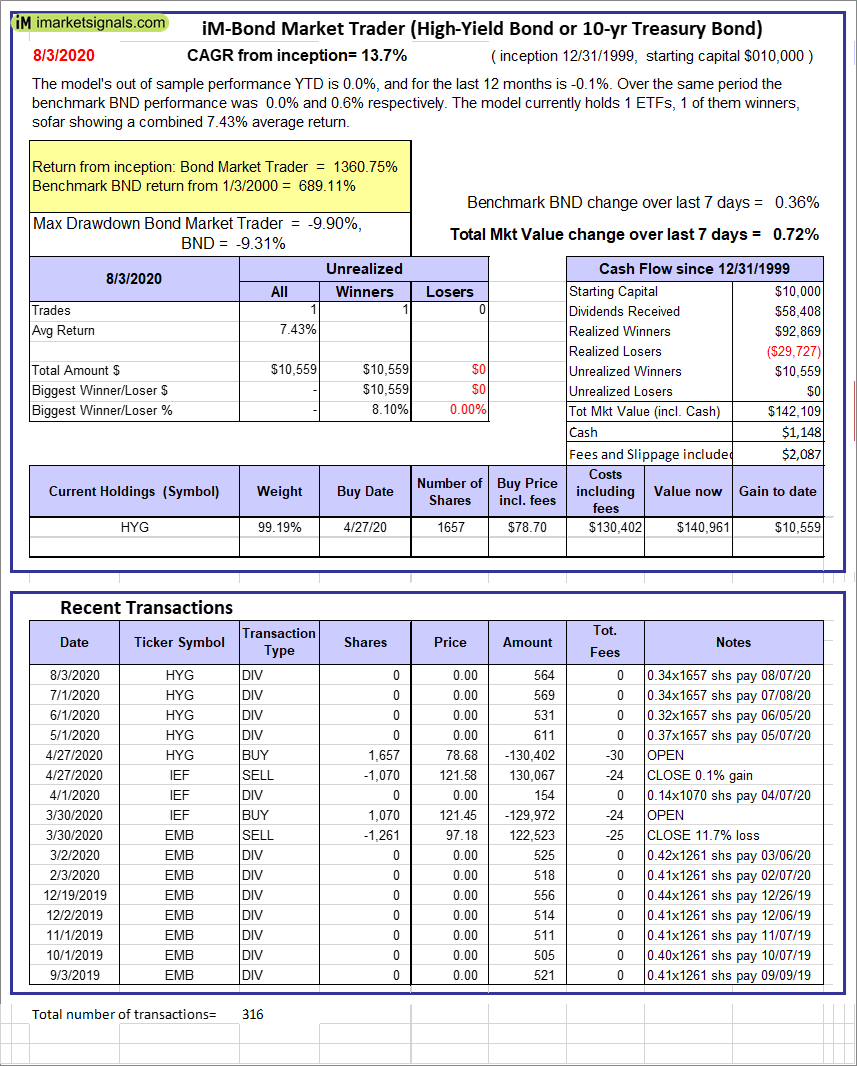 |
iM-Bond Market Trader (High-Yield Bond or 10-yr Treasury Bond): The model’s out of sample performance YTD is -34.9%, and for the last 12 months is -32.7%. Over the same period the benchmark SPY performance was 3.2% and 14.6% respectively. Over the previous week the market value of the iM-Bond Market Trader (High-Yield Bond or 10-yr Treasury Bond) gained 0.72% at a time when BND gained 0.36%. A starting capital of $100,000 at inception on 10/30/2016 would have grown to $142,109 which includes $1,148 cash and excludes $2,087 spent on fees and slippage. |
 |
iM-Best(Short): The model’s out of sample performance YTD is -6.3%, and for the last 12 months is -6.7%. Over the same period the benchmark SPY performance was 3.2% and 14.6% respectively. Over the previous week the market value of iM-Best(Short) gained 0.90% at a time when SPY gained 1.72%. Over the period 1/2/2009 to 8/3/2020 the starting capital of $100,000 would have grown to $75,353 which includes $120,789 cash and excludes $28,205 spent on fees and slippage. |
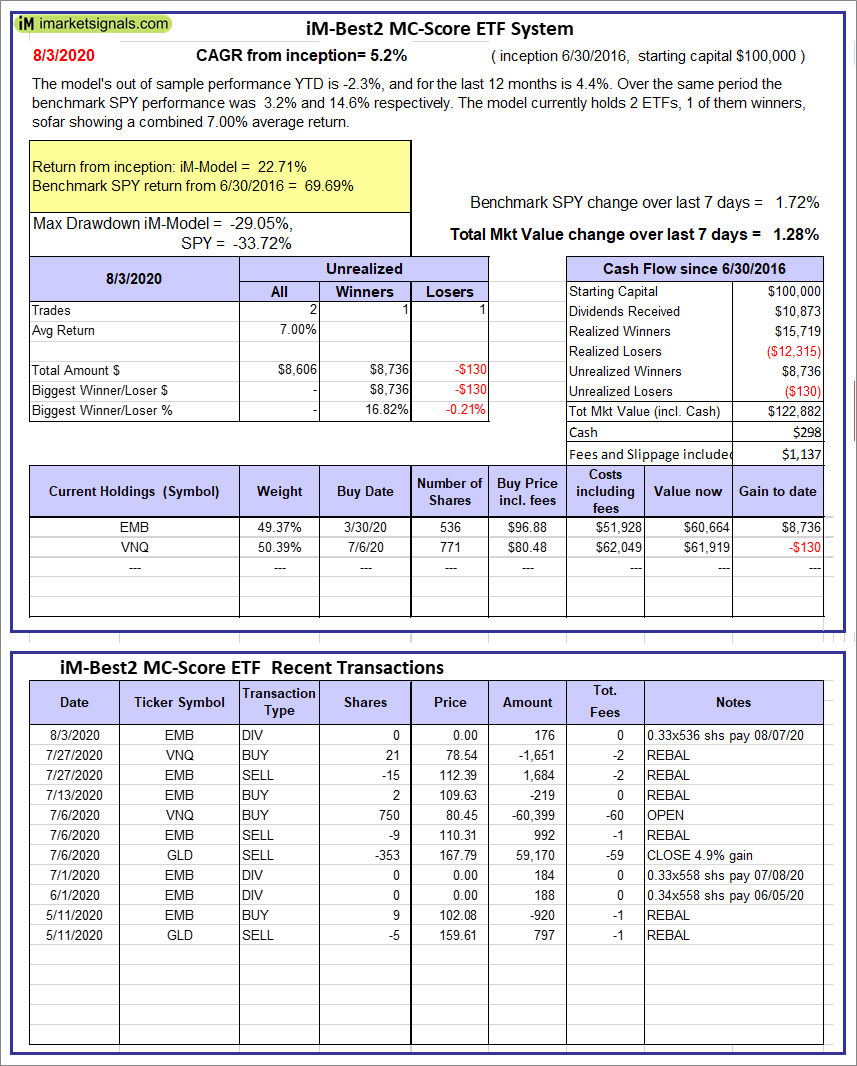 |
iM-Best2 MC-Score ETF System: The model’s out of sample performance YTD is -2.3%, and for the last 12 months is 4.4%. Over the same period the benchmark SPY performance was 3.2% and 14.6% respectively. Over the previous week the market value of the iM-Best2 MC-Score ETF System gained 1.28% at a time when SPY gained 1.72%. A starting capital of $100,000 at inception on 6/30/2016 would have grown to $122,882 which includes $298 cash and excludes $1,137 spent on fees and slippage. |
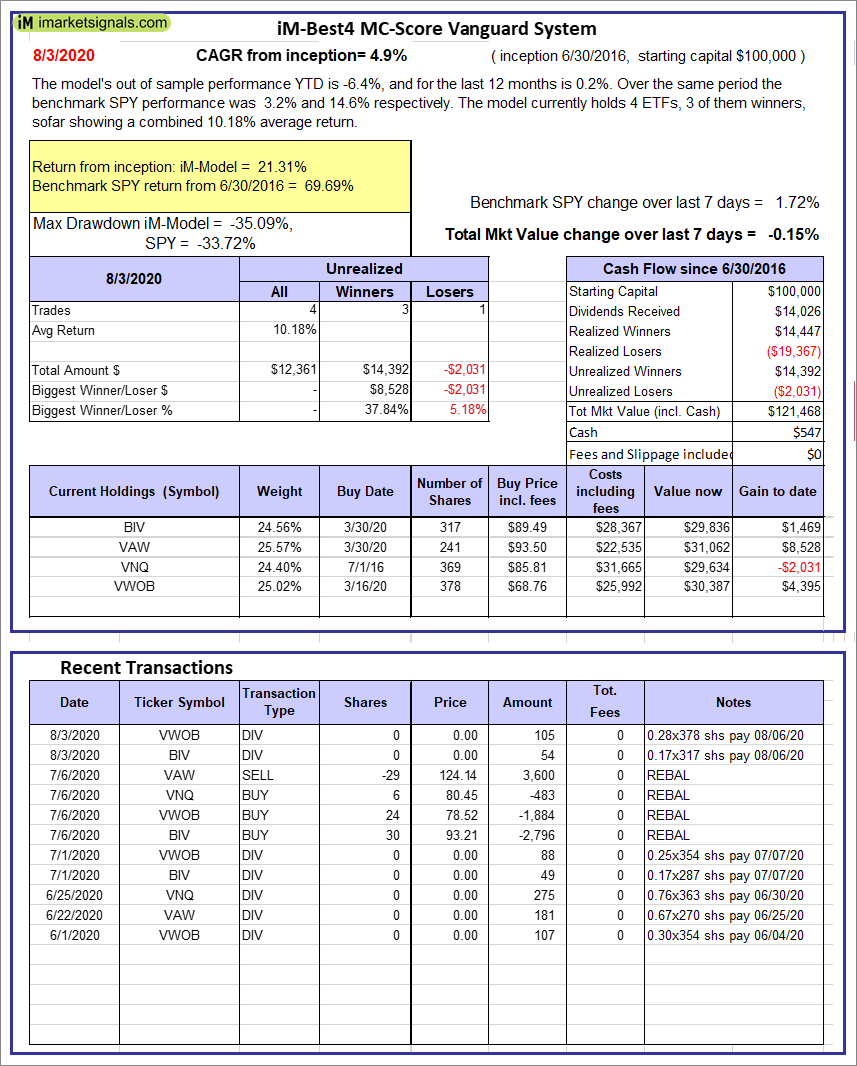 |
iM-Best4 MC-Score Vanguard System: The model’s out of sample performance YTD is -6.4%, and for the last 12 months is 0.2%. Over the same period the benchmark SPY performance was 3.2% and 14.6% respectively. Over the previous week the market value of the iM-Best4 MC-Score Vanguard System gained -0.15% at a time when SPY gained 1.72%. A starting capital of $100,000 at inception on 6/30/2016 would have grown to $121,468 which includes $547 cash and excludes $00 spent on fees and slippage. |
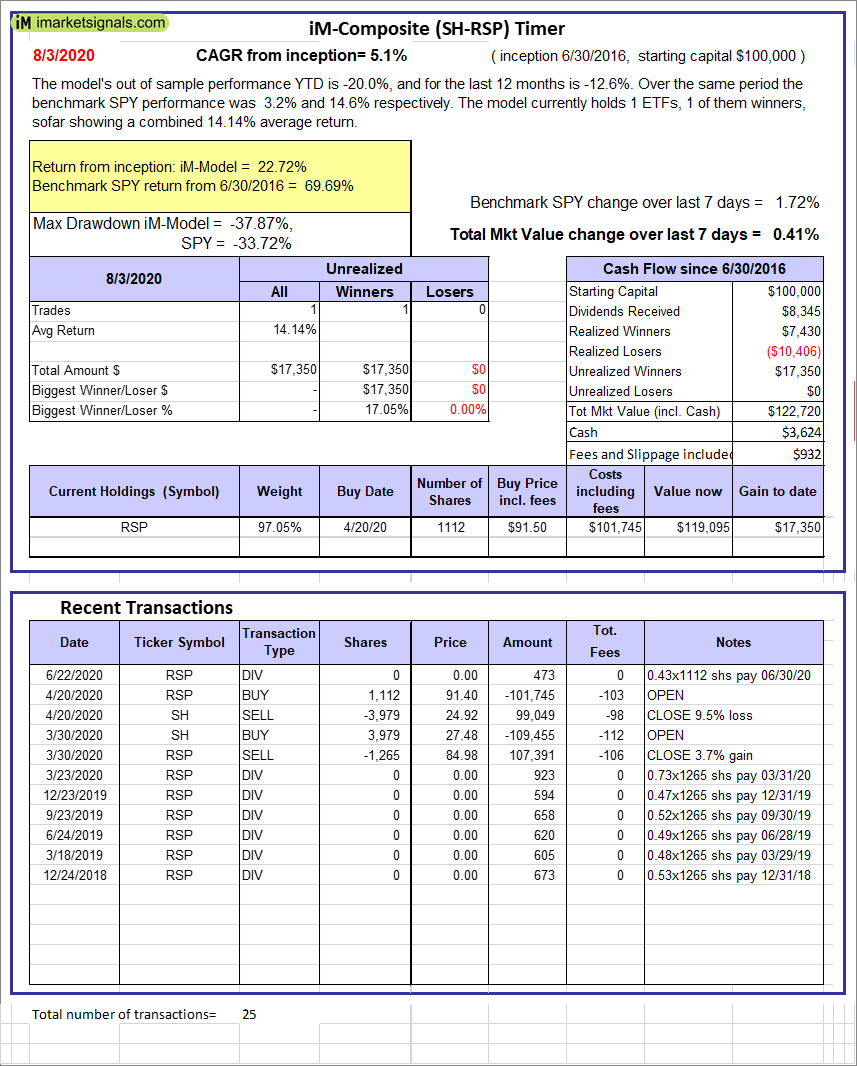 |
iM-Composite (SH-RSP) Timer: The model’s out of sample performance YTD is -20.0%, and for the last 12 months is -12.6%. Over the same period the benchmark SPY performance was 3.2% and 14.6% respectively. Over the previous week the market value of the iM-Composite (SH-RSP) Timer gained 0.41% at a time when SPY gained 1.72%. A starting capital of $100,000 at inception on 6/30/2016 would have grown to $122,720 which includes $3,624 cash and excludes $932 spent on fees and slippage. |
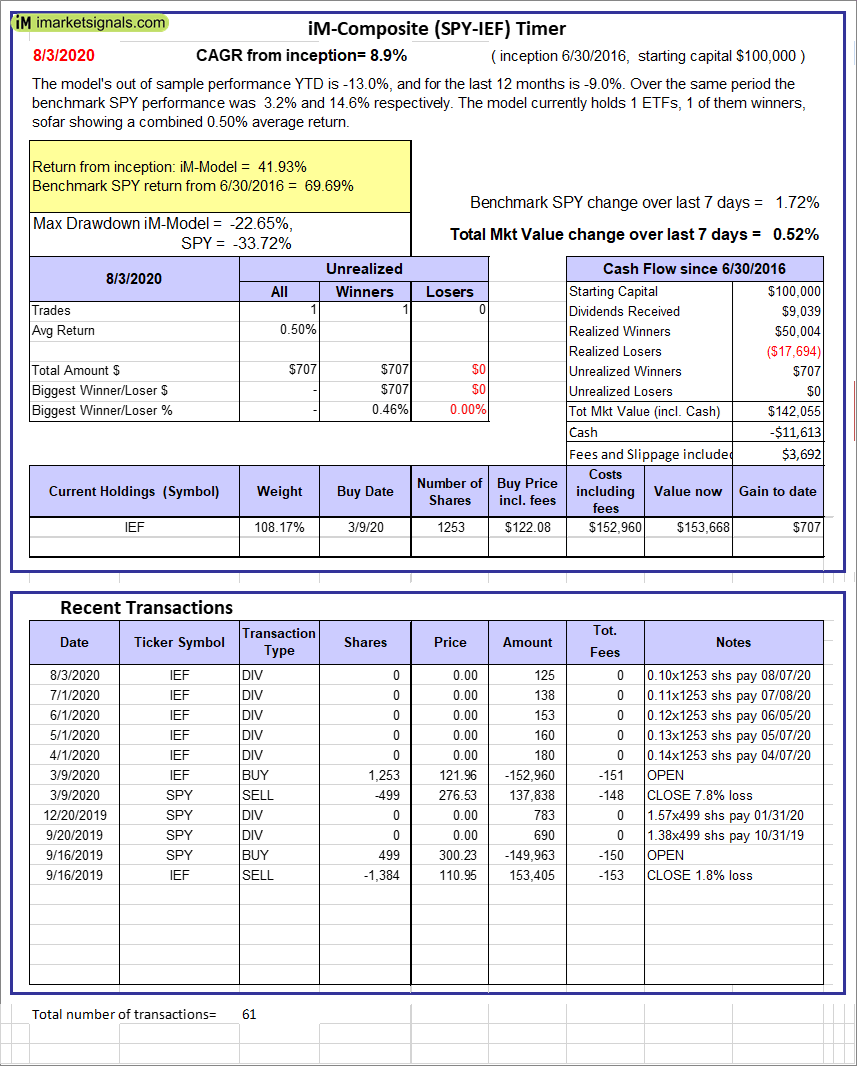 |
iM-Composite (SPY-IEF) Timer: The model’s out of sample performance YTD is -13.0%, and for the last 12 months is -9.0%. Over the same period the benchmark SPY performance was 3.2% and 14.6% respectively. Over the previous week the market value of the iM-Composite (SPY-IEF) Timer gained 0.52% at a time when SPY gained 1.72%. A starting capital of $100,000 at inception on 6/30/2016 would have grown to $142,055 which includes -$11,613 cash and excludes $3,692 spent on fees and slippage. |
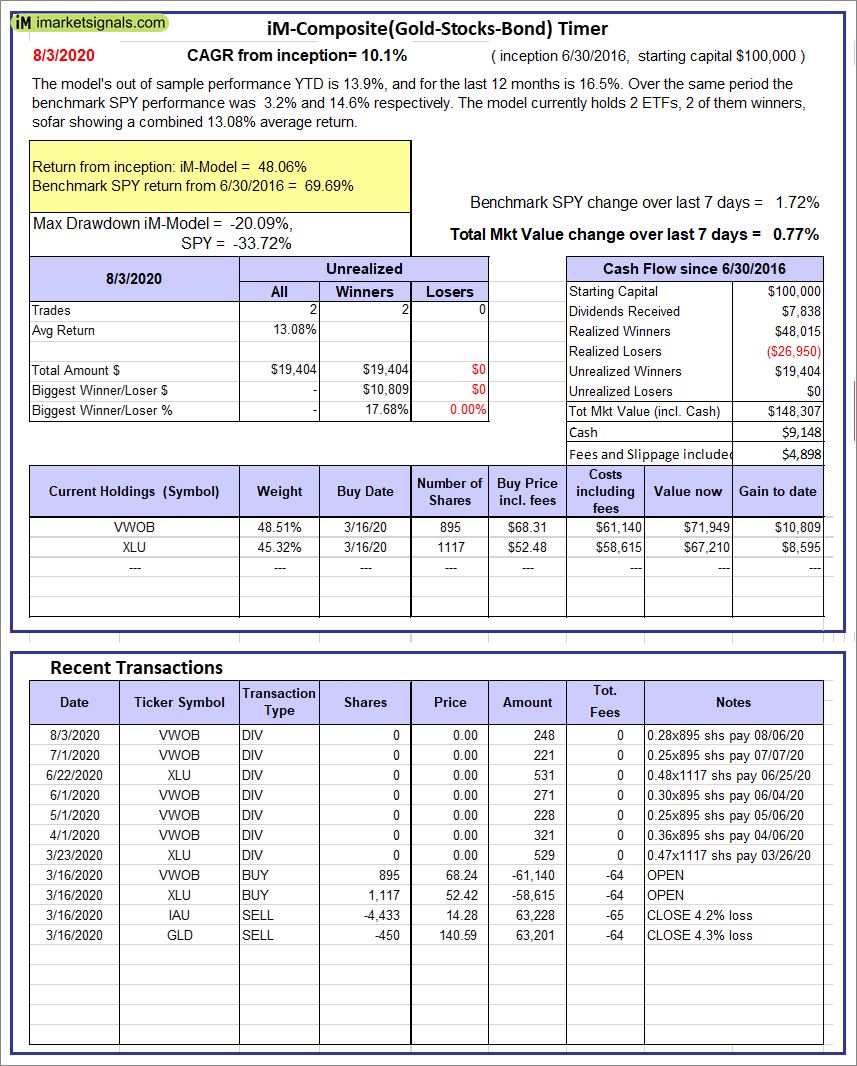 |
iM-Composite(Gold-Stocks-Bond) Timer: The model’s out of sample performance YTD is 13.9%, and for the last 12 months is 16.5%. Over the same period the benchmark SPY performance was 3.2% and 14.6% respectively. Over the previous week the market value of the iM-Composite(Gold-Stocks-Bond) Timer gained 0.77% at a time when SPY gained 1.72%. A starting capital of $100,000 at inception on 6/30/2016 would have grown to $148,307 which includes $9,148 cash and excludes $4,898 spent on fees and slippage. |
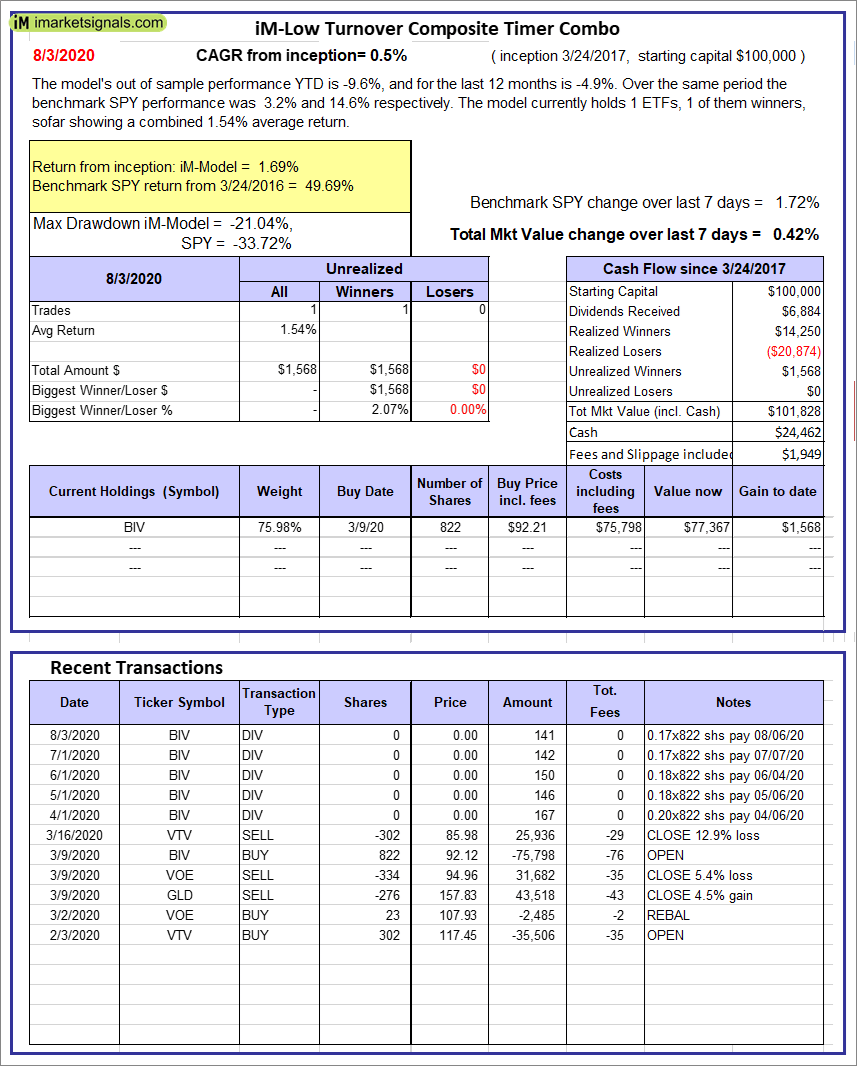 |
iM-Low Turnover Composite Timer Combo: The model’s out of sample performance YTD is -9.6%, and for the last 12 months is -4.9%. Over the same period the benchmark SPY performance was 3.2% and 14.6% respectively. Over the previous week the market value of the iM-Low Turnover Composite Timer Combo gained 0.42% at a time when SPY gained 1.72%. A starting capital of $100,000 at inception on 3/24/27 would have grown to $101,828 which includes $24,462 cash and excludes $1,949 spent on fees and slippage. |
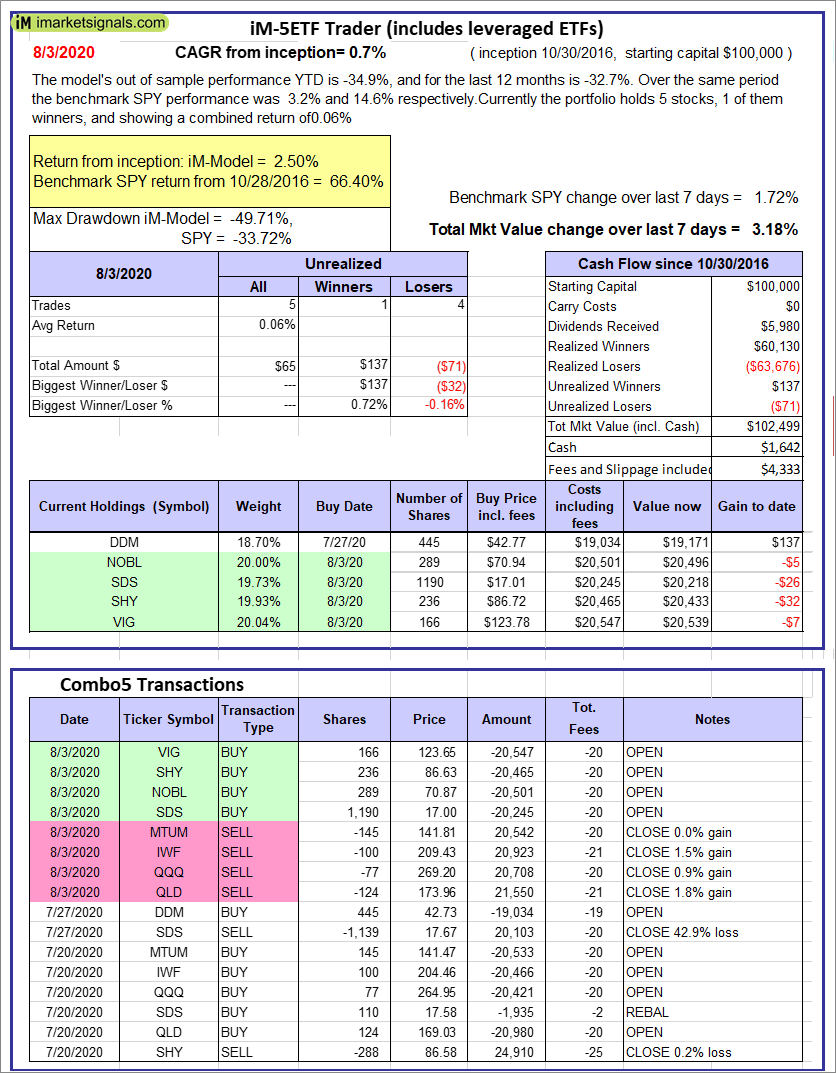 |
iM-5ETF Trader (includes leveraged ETFs): The model’s out of sample performance YTD is -34.9%, and for the last 12 months is -32.7%. Over the same period the benchmark SPY performance was 3.2% and 14.6% respectively. Over the previous week the market value of the iM-5ETF Trader (includes leveraged ETFs) gained 3.18% at a time when SPY gained 1.72%. A starting capital of $100,000 at inception on 10/30/2016 would have grown to $102,499 which includes $1,642 cash and excludes $4,333 spent on fees and slippage. |
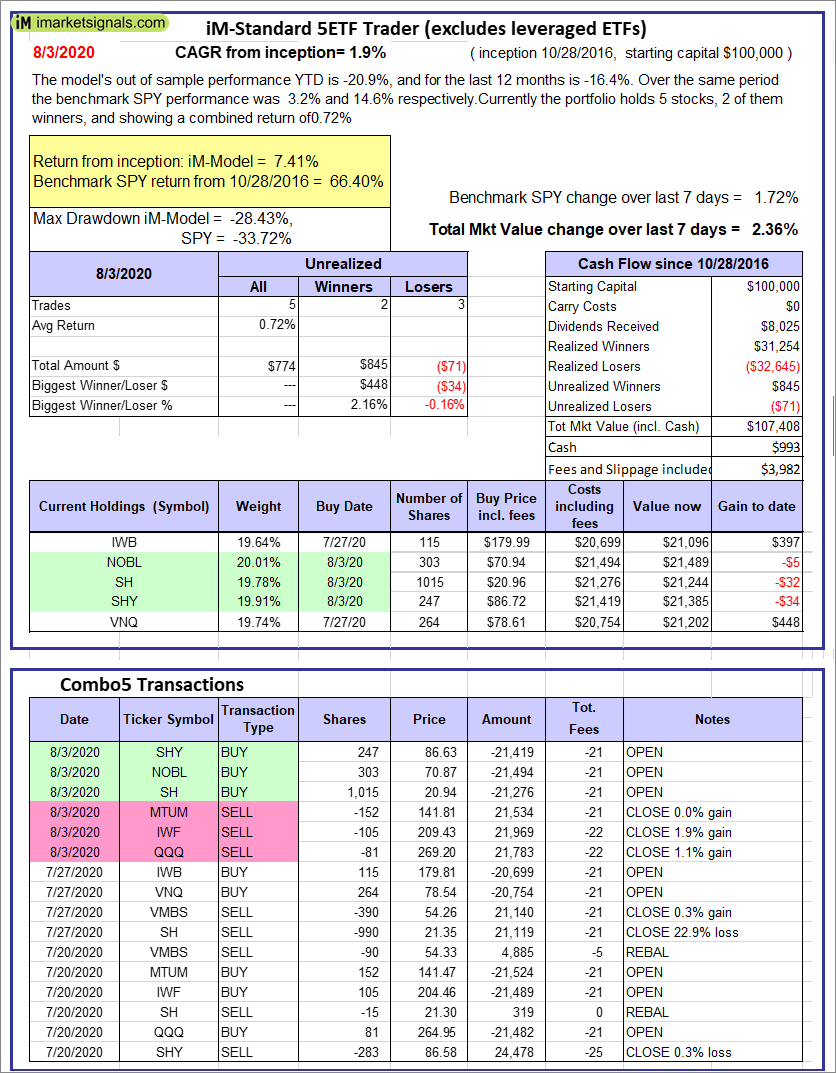 |
iM-Standard 5ETF Trader (excludes leveraged ETFs): The model’s out of sample performance YTD is -20.9%, and for the last 12 months is -16.4%. Over the same period the benchmark SPY performance was 3.2% and 14.6% respectively. Over the previous week the market value of the iM-Standard 5ETF Trader (excludes leveraged ETFs) gained 2.36% at a time when SPY gained 1.72%. A starting capital of $100,000 at inception on 10/30/2016 would have grown to $107,408 which includes $993 cash and excludes $3,982 spent on fees and slippage. |
iM-Best Reports – 8/3/2020
Posted in pmp SPY-SH
Leave a Reply
You must be logged in to post a comment.