
  |
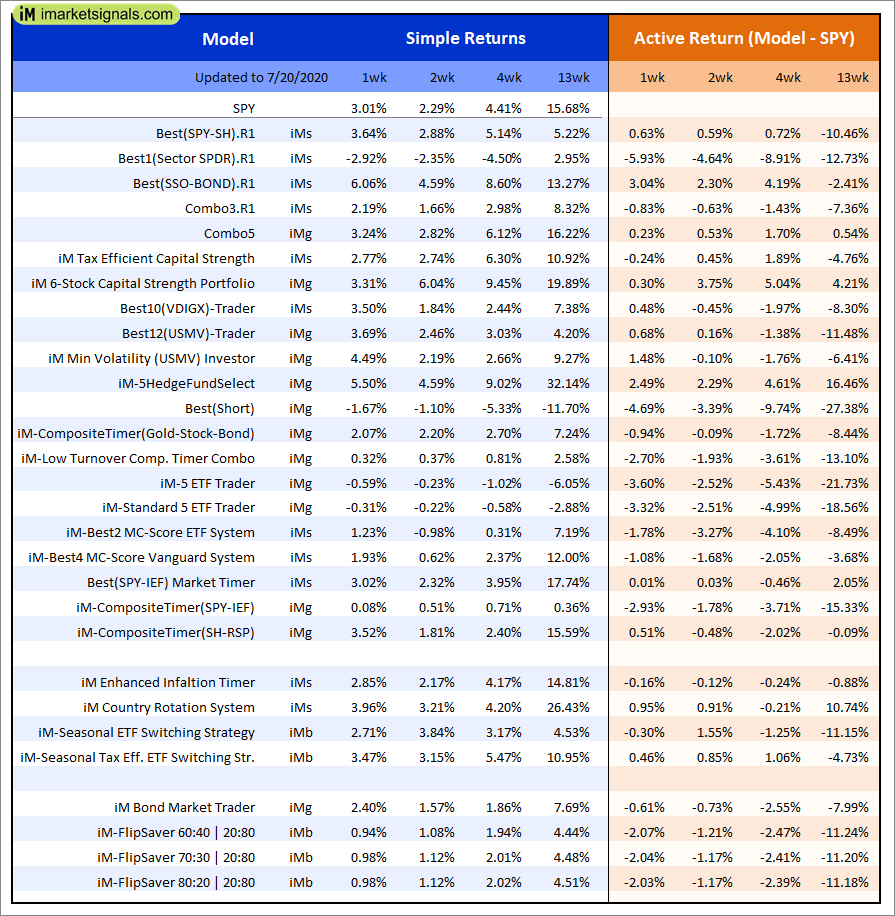
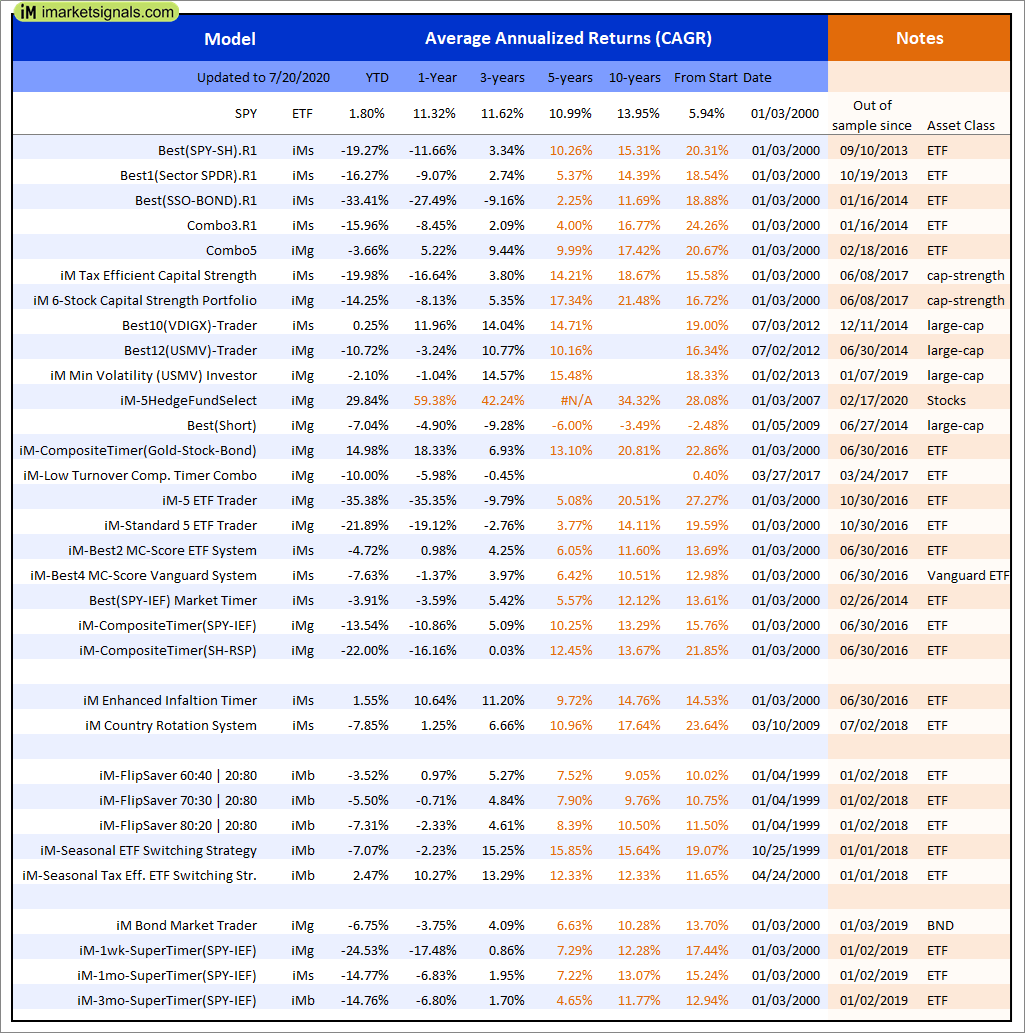
Out of sample performance summary of our models for the past 1, 2, 4 and 13 week periods. The active active return indicates how the models over- or underperformed the benchmark ETF SPY. Also the YTD, and the 1-, 3-, 5- and 10-year annualized returns are shown in the second table |
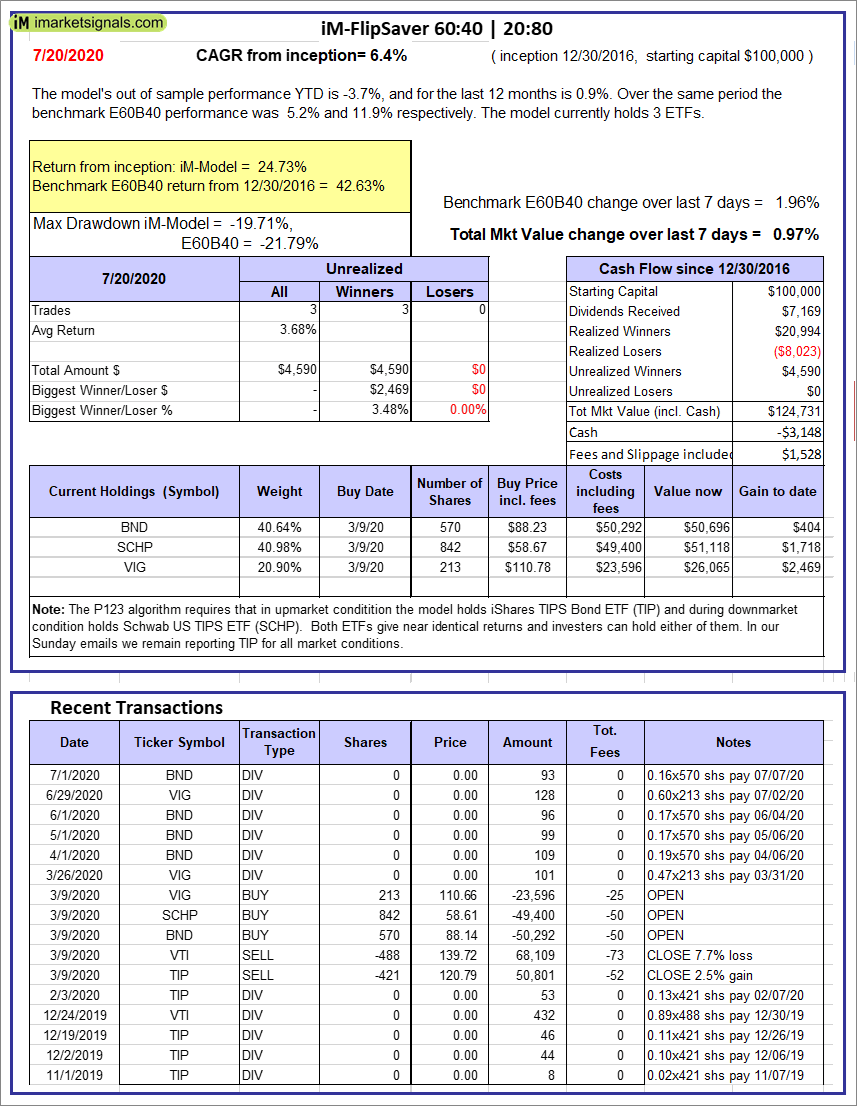 |
iM-FlipSaver 60:40 | 20:80 – 2017: The model’s out of sample performance YTD is -3.7%, and for the last 12 months is 0.9%. Over the same period the benchmark E60B40 performance was 5.2% and 11.9% respectively. Over the previous week the market value of iM-FlipSaver 80:20 | 20:80 gained 0.97% at a time when SPY gained 1.96%. A starting capital of $100,000 at inception on 7/16/2015 would have grown to $124,731 which includes -$3,148 cash and excludes $1,528 spent on fees and slippage. |
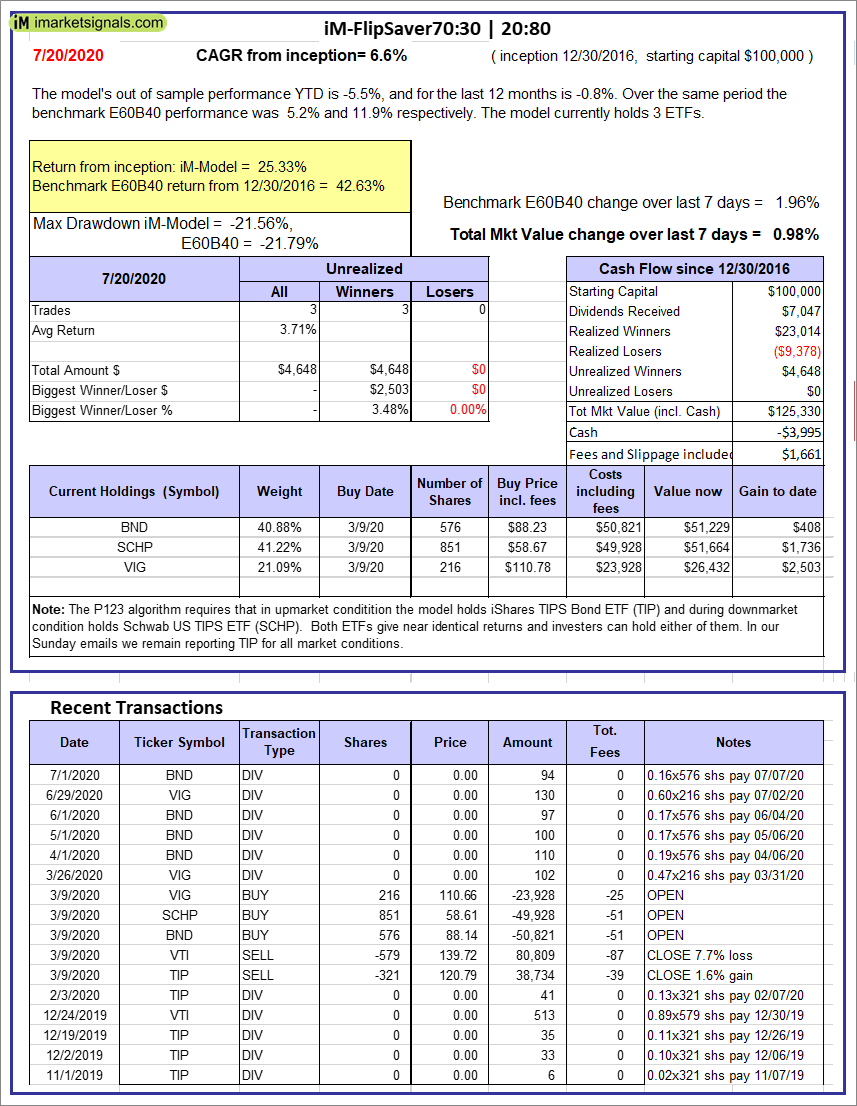 |
iM-FlipSaver 70:30 | 20:80 – 2017: The model’s out of sample performance YTD is -5.5%, and for the last 12 months is -0.8%. Over the same period the benchmark E60B40 performance was 5.2% and 11.9% respectively. Over the previous week the market value of iM-FlipSaver 70:30 | 20:80 gained 0.98% at a time when SPY gained 1.96%. A starting capital of $100,000 at inception on 7/15/2015 would have grown to $125,330 which includes -$3,995 cash and excludes $1,661 spent on fees and slippage. |
 |
iM-FlipSaver 80:20 | 20:80 – 2017: The model’s out of sample performance YTD is -7.3%, and for the last 12 months is -2.4%. Over the same period the benchmark E60B40 performance was 5.2% and 11.9% respectively. Over the previous week the market value of iM-FlipSaver 80:20 | 20:80 gained 0.98% at a time when SPY gained 1.96%. A starting capital of $100,000 at inception on 1/2/2017 would have grown to $125,851 which includes -$4,799 cash and excludes $1,786 spent on fees and slippage. |
 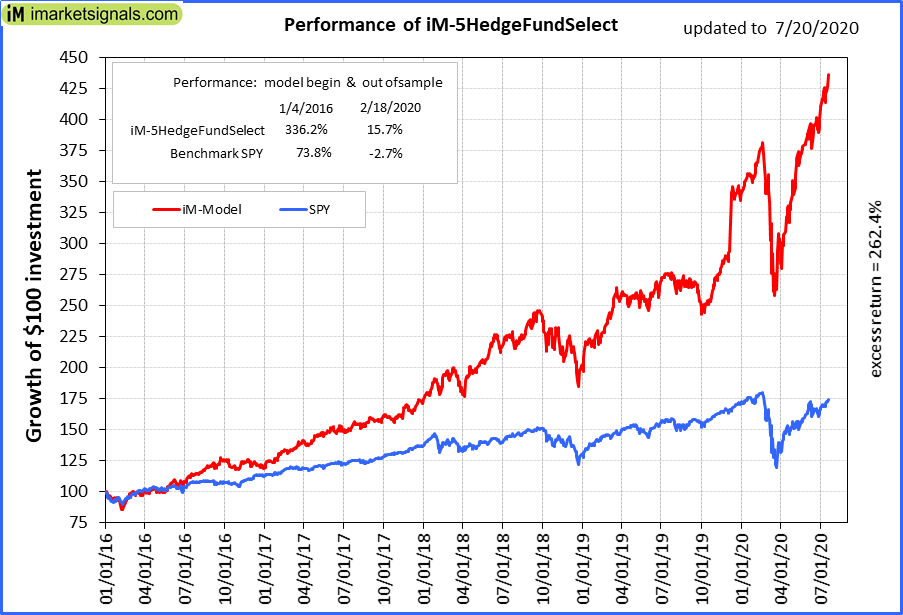 |
iM-5HedgeFundSelect: Since inception, on 1/5/2016, the model gained 336.21% while the benchmark SPY gained 73.77% over the same period. Over the previous week the market value of iM-5HedgeFundSelect gained 5.50% at a time when SPY gained 3.01%. A starting capital of $25,000 at inception on 1/5/2016 would have grown to $109,053 which includes $1,124 cash and excludes $974 spent on fees and slippage. |
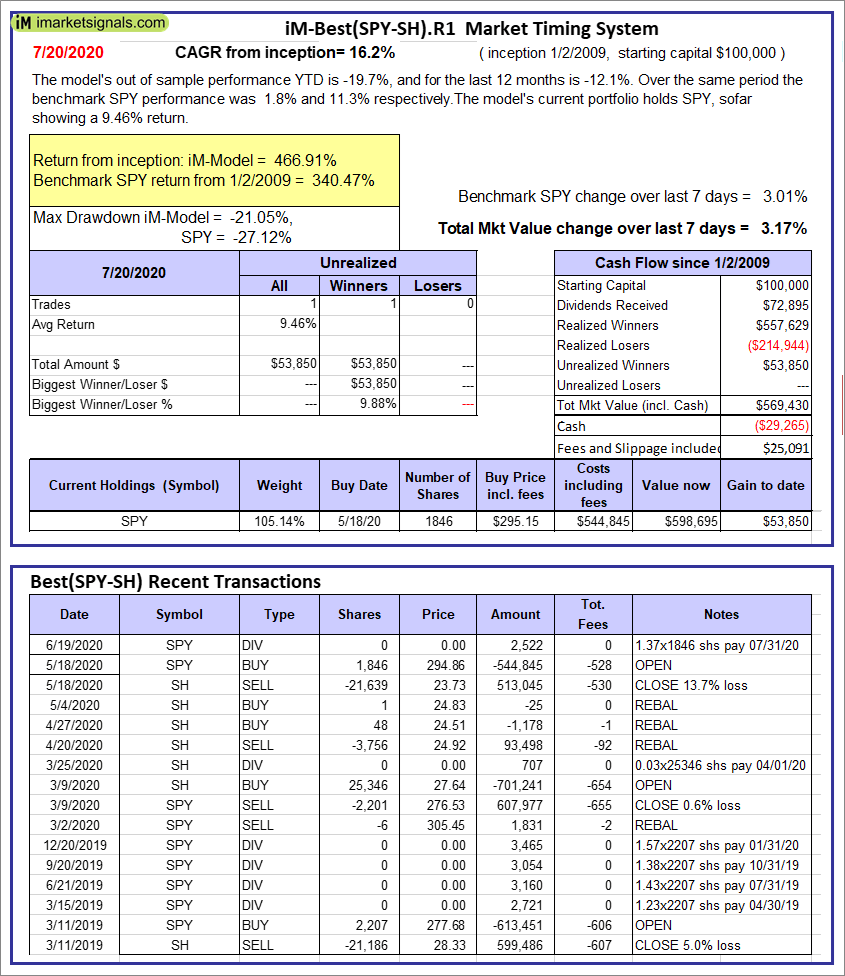 |
iM-Best(SPY-SH).R1: The model’s out of sample performance YTD is -19.7%, and for the last 12 months is -12.1%. Over the same period the benchmark SPY performance was 1.8% and 11.3% respectively. Over the previous week the market value of Best(SPY-SH) gained 3.17% at a time when SPY gained 3.01%. A starting capital of $100,000 at inception on 1/2/2009 would have grown to $569,430 which includes -$29,265 cash and excludes $25,091 spent on fees and slippage. |
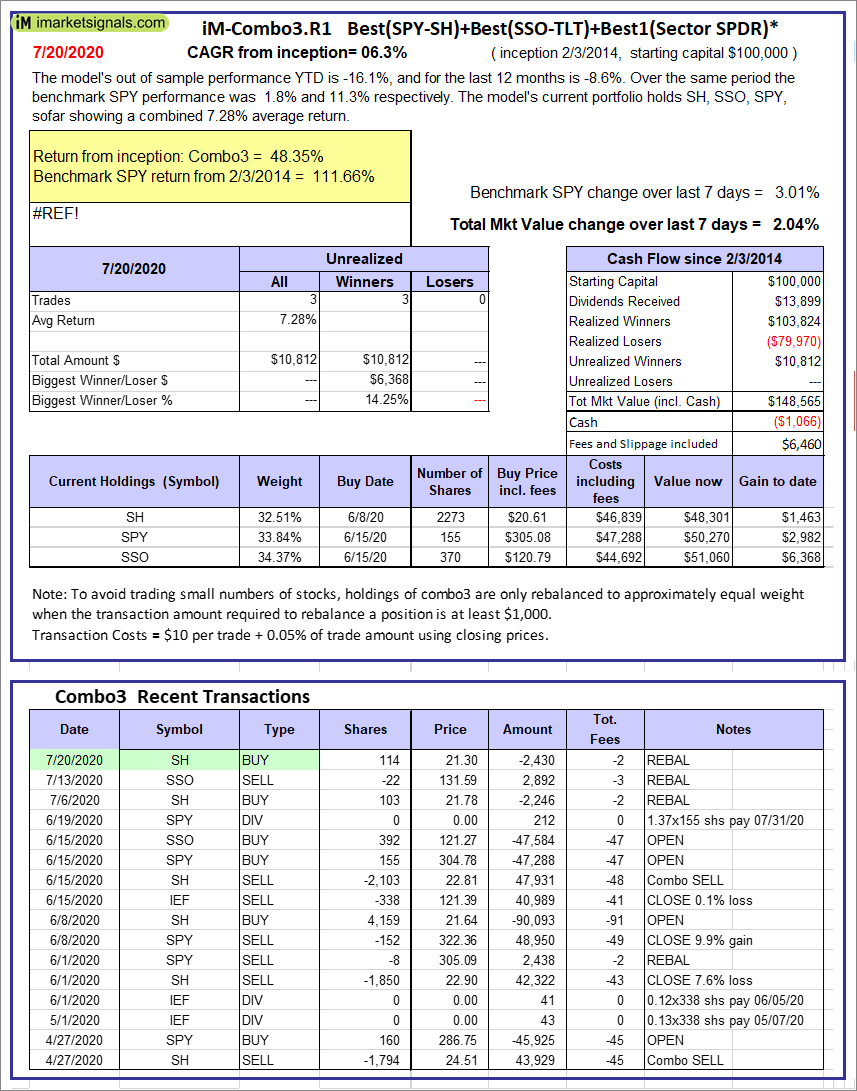 |
iM-Combo3.R1: The model’s out of sample performance YTD is -16.1%, and for the last 12 months is -8.6%. Over the same period the benchmark SPY performance was 1.8% and 11.3% respectively. Over the previous week the market value of iM-Combo3.R1 gained 2.04% at a time when SPY gained 3.01%. A starting capital of $100,000 at inception on 2/3/2014 would have grown to $148,565 which includes -$1,066 cash and excludes $6,460 spent on fees and slippage. |
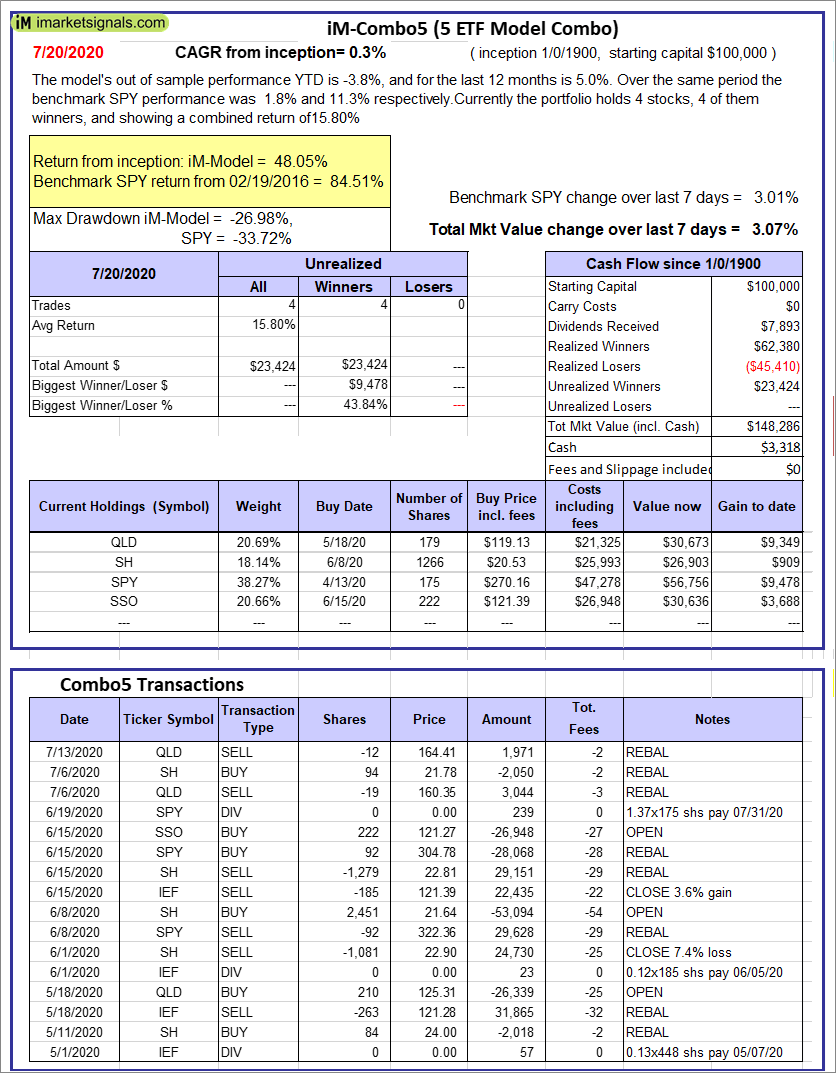 |
iM-Combo5: The model’s out of sample performance YTD is -3.8%, and for the last 12 months is 5.0%. Over the same period the benchmark SPY performance was 1.8% and 11.3% respectively. Over the previous week the market value of iM-Combo5 gained 3.07% at a time when SPY gained 3.01%. A starting capital of $100,000 at inception on 2/22/2016 would have grown to $148,286 which includes $3,318 cash and excludes $0 spent on fees and slippage. |
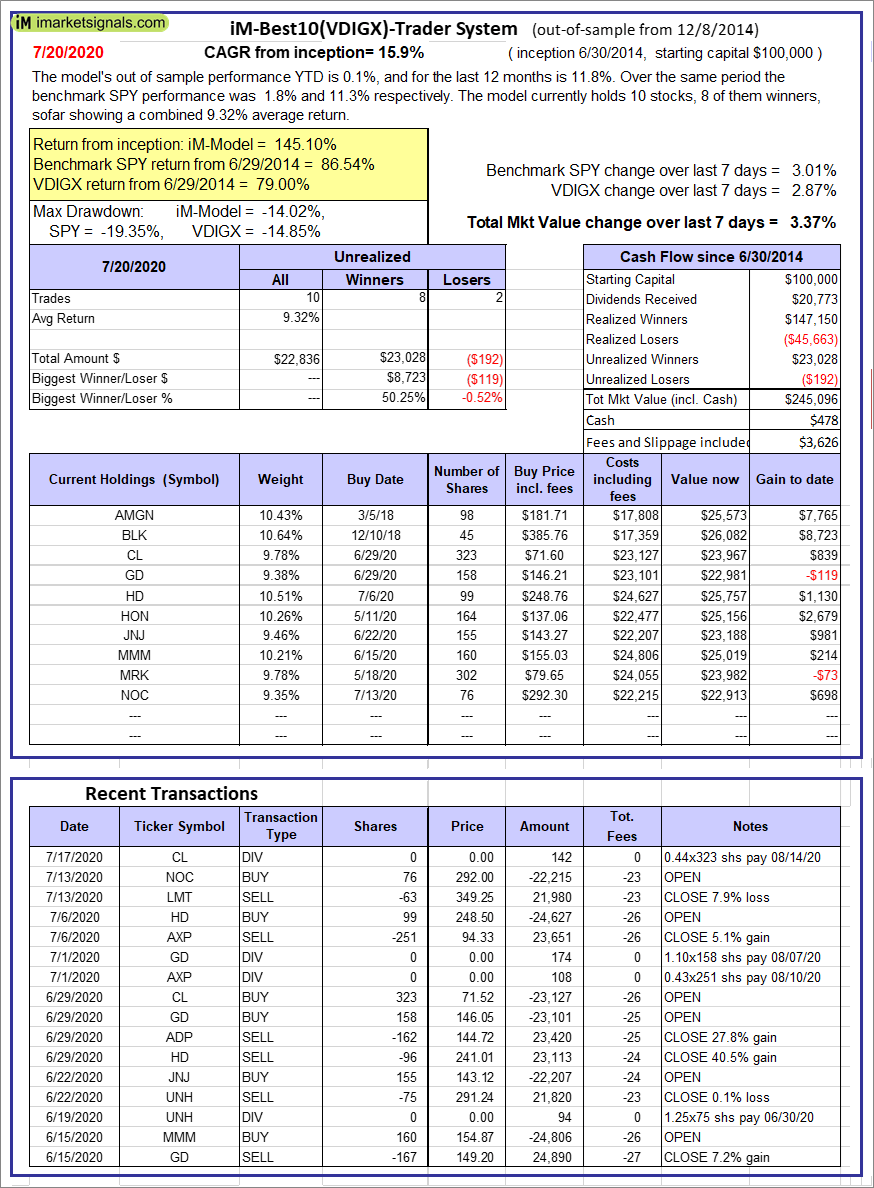 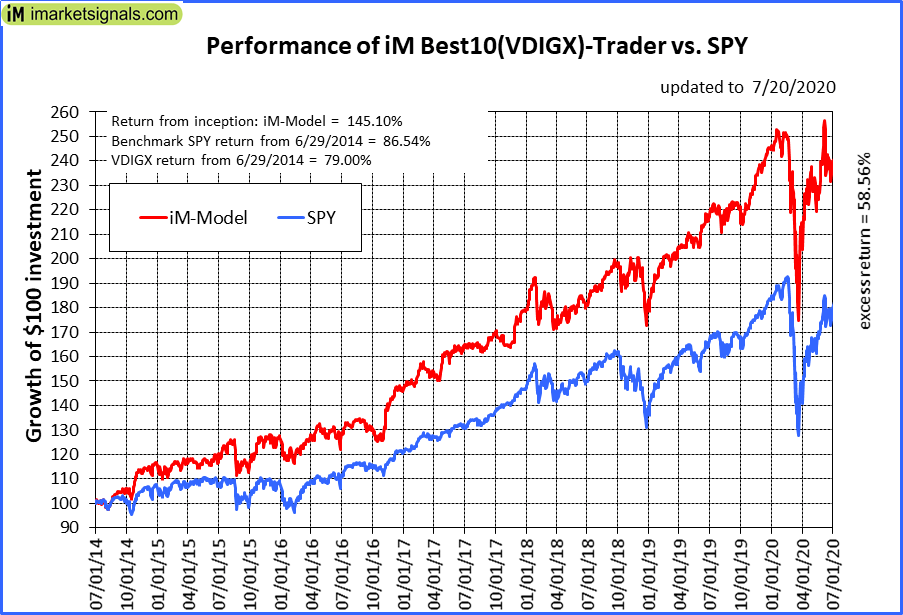 |
iM-Best10(VDIGX)-Trader: The model’s out of sample performance YTD is 0.1%, and for the last 12 months is 11.8%. Over the same period the benchmark SPY performance was 1.8% and 11.3% respectively. Since inception, on 7/1/2014, the model gained 145.10% while the benchmark SPY gained 86.54% and VDIGX gained 79.00% over the same period. Over the previous week the market value of iM-Best10(VDIGX) gained 3.37% at a time when SPY gained 3.01%. A starting capital of $100,000 at inception on 7/1/2014 would have grown to $245,096 which includes $478 cash and excludes $3,626 spent on fees and slippage. |
 |
iM 6-Stock Capital Strength Portfolio: The model’s out of sample performance YTD is -14.5%, and for the last 12 months is -8.4%. Over the same period the benchmark SPY performance was 1.8% and 11.3% respectively. Over the previous week the market value of the iM 6-Stock Capital Strength Portfolio gained 3.31% at a time when SPY gained 3.01%. A starting capital of $100,000 at inception on 10/28/2016 would have grown to $151,932 which includes $32,303 cash and excludes $1,277 spent on fees and slippage. |
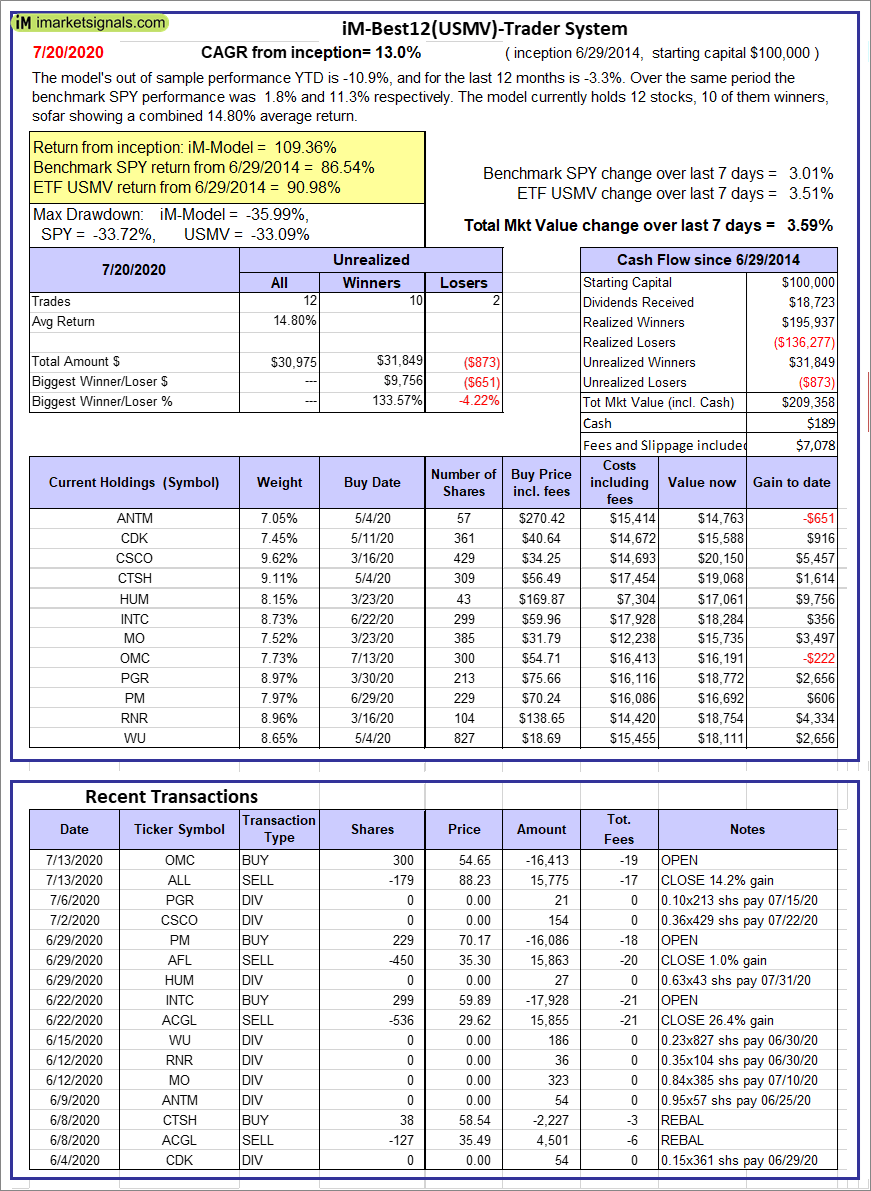 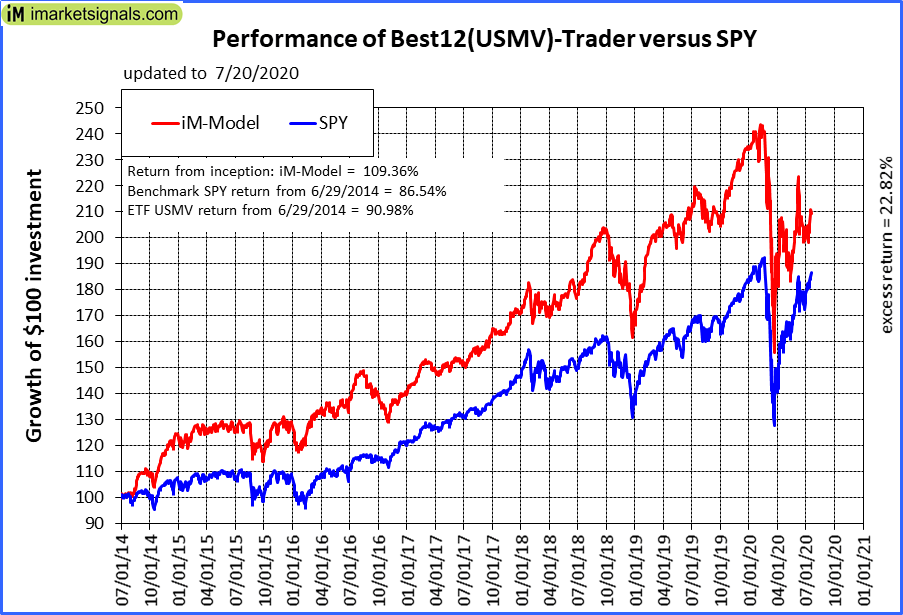 |
iM-Best12(USMV)-Trader: The model’s out of sample performance YTD is -10.9%, and for the last 12 months is -3.3%. Over the same period the benchmark SPY performance was 1.8% and 11.3% respectively. Since inception, on 6/30/2014, the model gained 109.36% while the benchmark SPY gained 86.54% and the ETF USMV gained 90.98% over the same period. Over the previous week the market value of iM-Best12(USMV)-Trader gained 3.59% at a time when SPY gained 3.01%. A starting capital of $100,000 at inception on 6/30/2014 would have grown to $209,358 which includes $189 cash and excludes $7,078 spent on fees and slippage. |
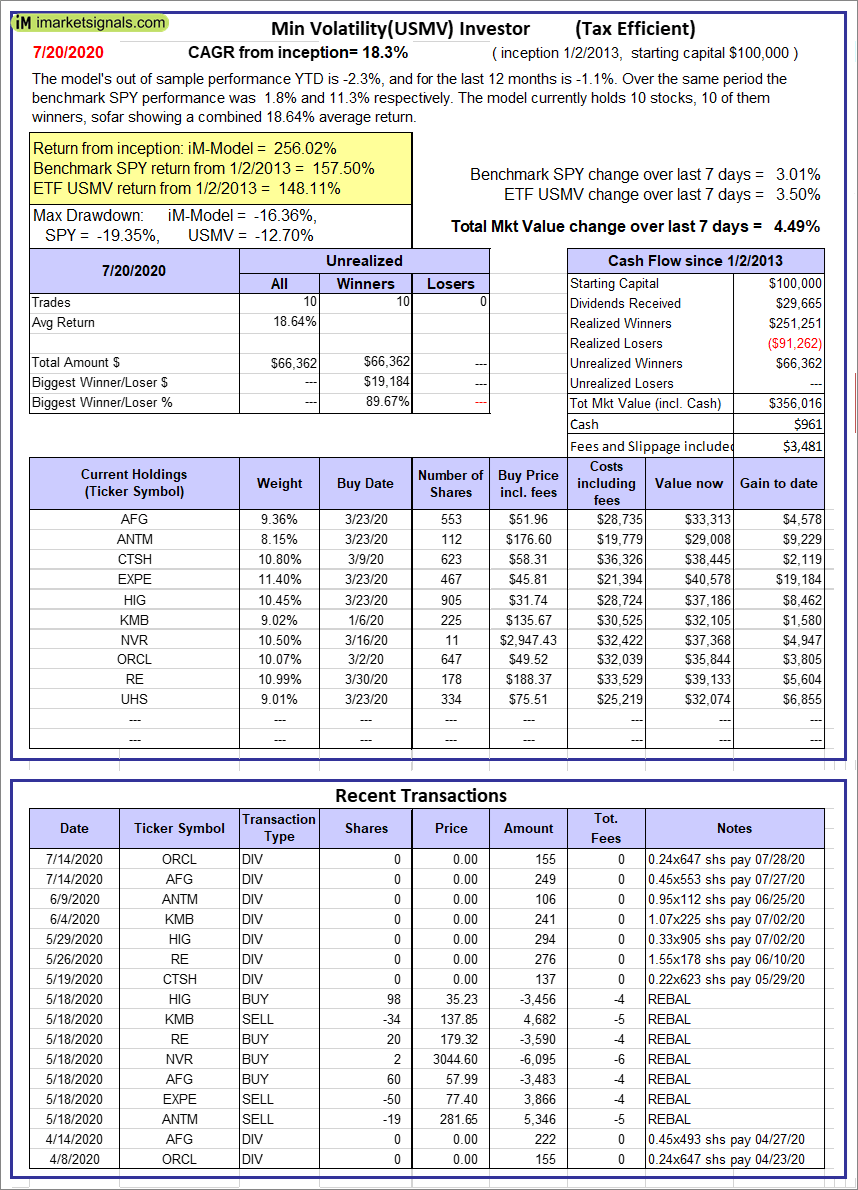 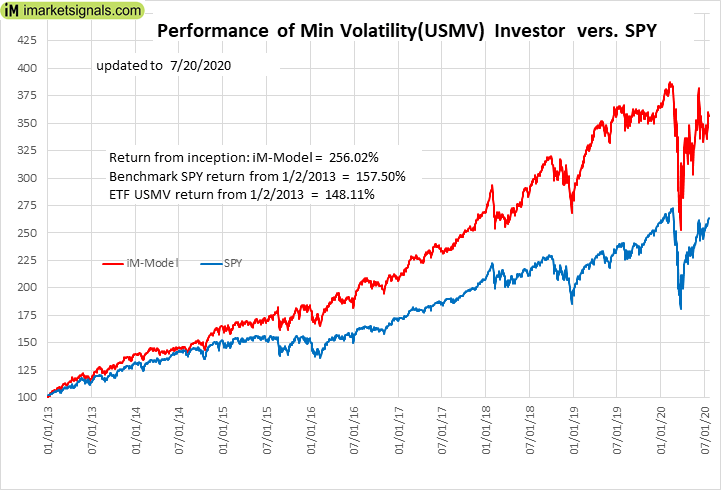 |
iM-Min Volatility(USMV) Investor (Tax Efficient): The model’s out of sample performance YTD is -2.3%, and for the last 12 months is -1.1%. Over the same period the benchmark SPY performance was 1.8% and 11.3% respectively. Since inception, on 1/3/2013, the model gained 256.02% while the benchmark SPY gained 157.50% and the ETF USMV gained 148.11% over the same period. Over the previous week the market value of iM-Best12(USMV)Q1 gained 4.49% at a time when SPY gained 3.01%. A starting capital of $100,000 at inception on 1/3/2013 would have grown to $356,016 which includes $961 cash and excludes $3,481 spent on fees and slippage. |
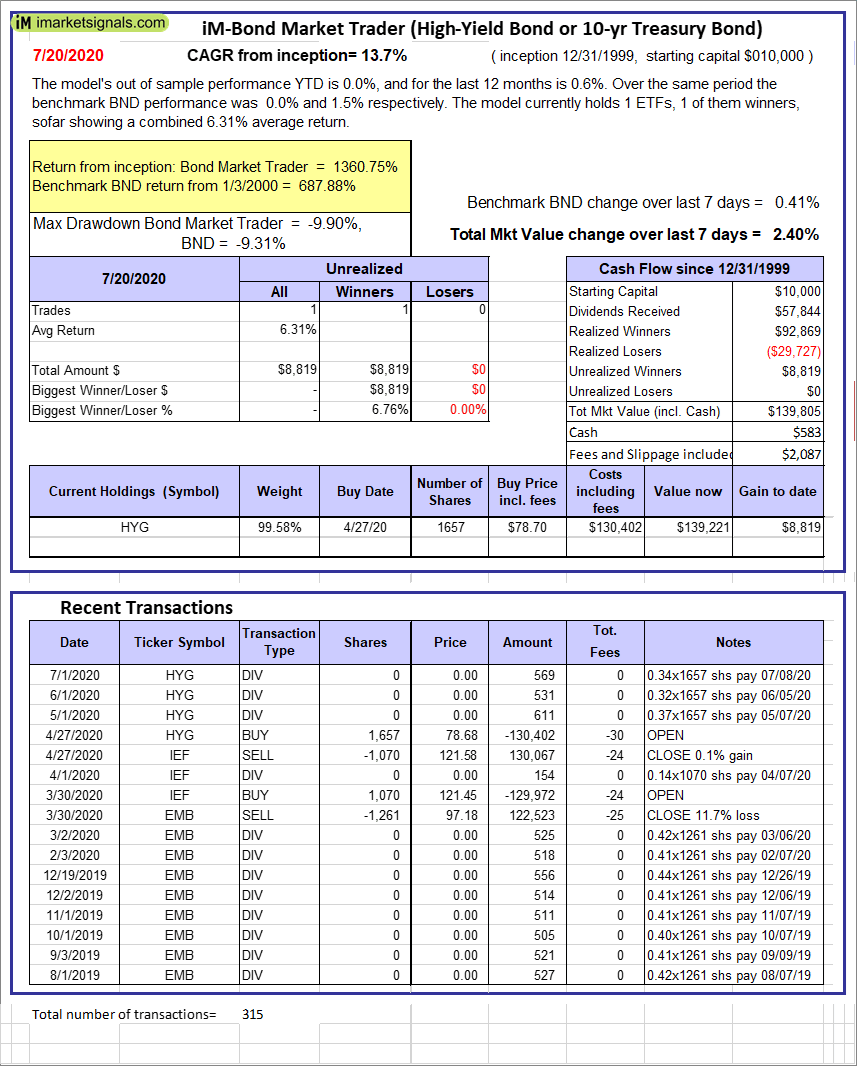 |
iM-Bond Market Trader (High-Yield Bond or 10-yr Treasury Bond): The model’s out of sample performance YTD is -35.5%, and for the last 12 months is -35.4%. Over the same period the benchmark SPY performance was 1.8% and 11.3% respectively. Over the previous week the market value of the iM-Bond Market Trader (High-Yield Bond or 10-yr Treasury Bond) gained 2.40% at a time when BND gained 0.41%. A starting capital of $100,000 at inception on 10/30/2016 would have grown to $139,805 which includes $583 cash and excludes $2,087 spent on fees and slippage. |
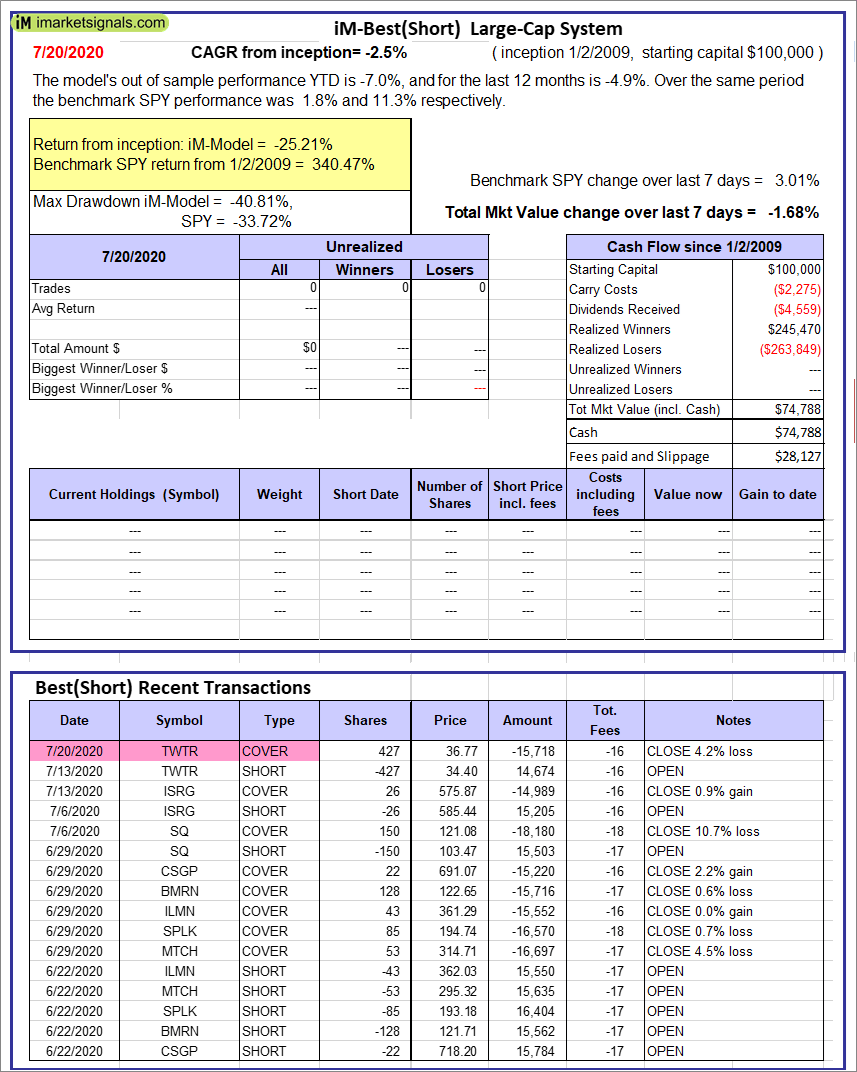 |
iM-Best(Short): The model’s out of sample performance YTD is -7.0%, and for the last 12 months is -4.9%. Over the same period the benchmark SPY performance was 1.8% and 11.3% respectively. Over the previous week the market value of iM-Best(Short) gained -1.68% at a time when SPY gained 3.01%. Over the period 1/2/2009 to 7/20/2020 the starting capital of $100,000 would have grown to $74,788 which includes $74,788 cash and excludes $28,127 spent on fees and slippage. |
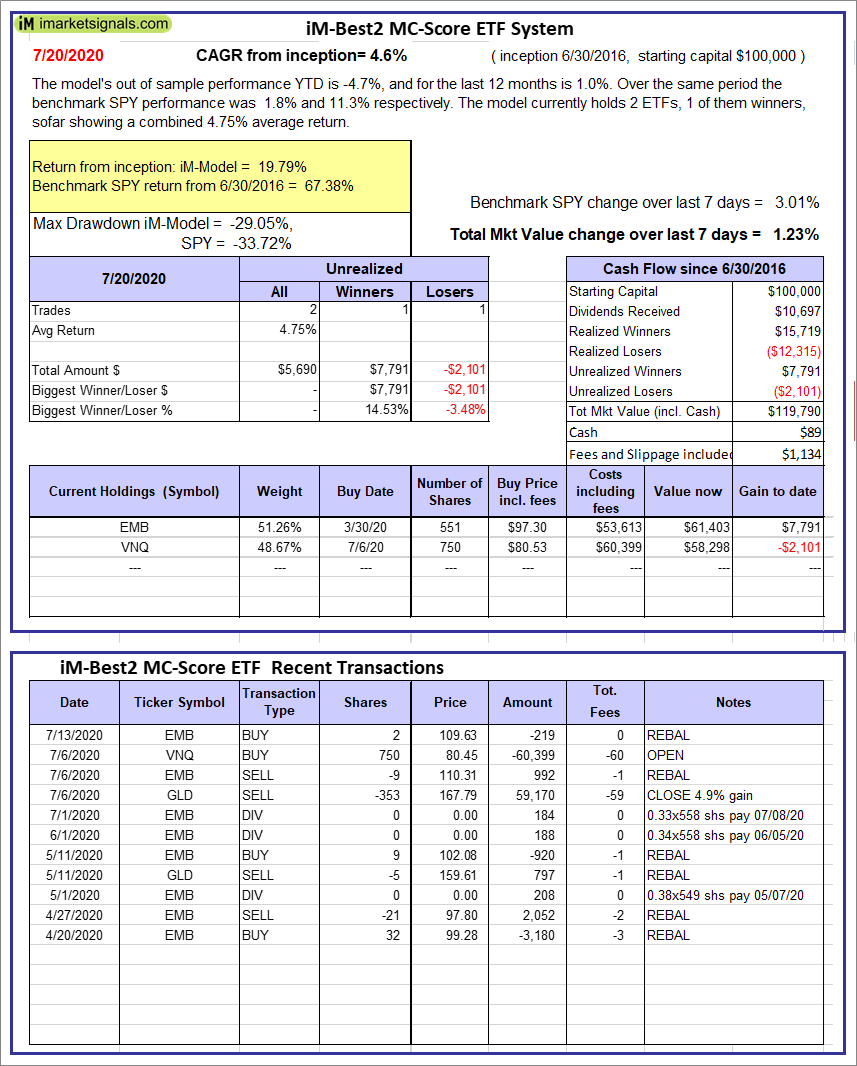 |
iM-Best2 MC-Score ETF System: The model’s out of sample performance YTD is -4.7%, and for the last 12 months is 1.0%. Over the same period the benchmark SPY performance was 1.8% and 11.3% respectively. Over the previous week the market value of the iM-Best2 MC-Score ETF System gained 1.23% at a time when SPY gained 3.01%. A starting capital of $100,000 at inception on 6/30/2016 would have grown to $119,790 which includes $89 cash and excludes $1,134 spent on fees and slippage. |
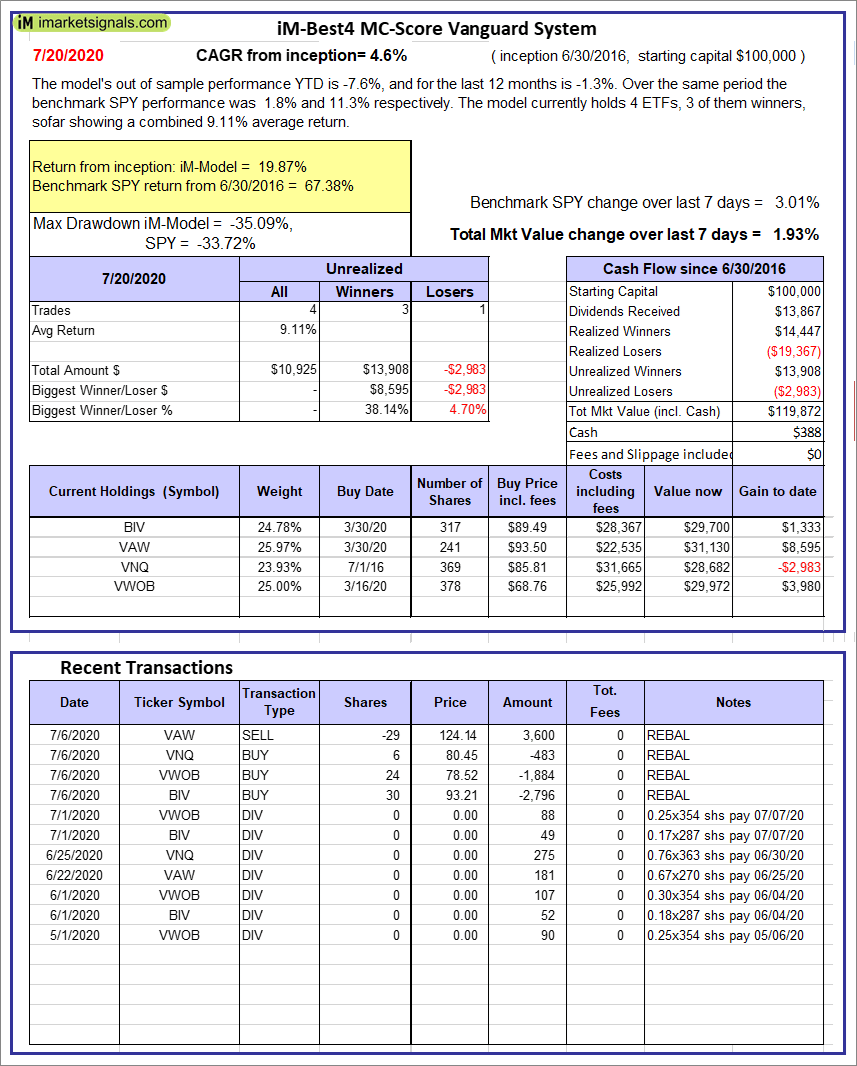 |
iM-Best4 MC-Score Vanguard System: The model’s out of sample performance YTD is -7.6%, and for the last 12 months is -1.3%. Over the same period the benchmark SPY performance was 1.8% and 11.3% respectively. Over the previous week the market value of the iM-Best4 MC-Score Vanguard System gained 1.93% at a time when SPY gained 3.01%. A starting capital of $100,000 at inception on 6/30/2016 would have grown to $119,872 which includes $388 cash and excludes $00 spent on fees and slippage. |
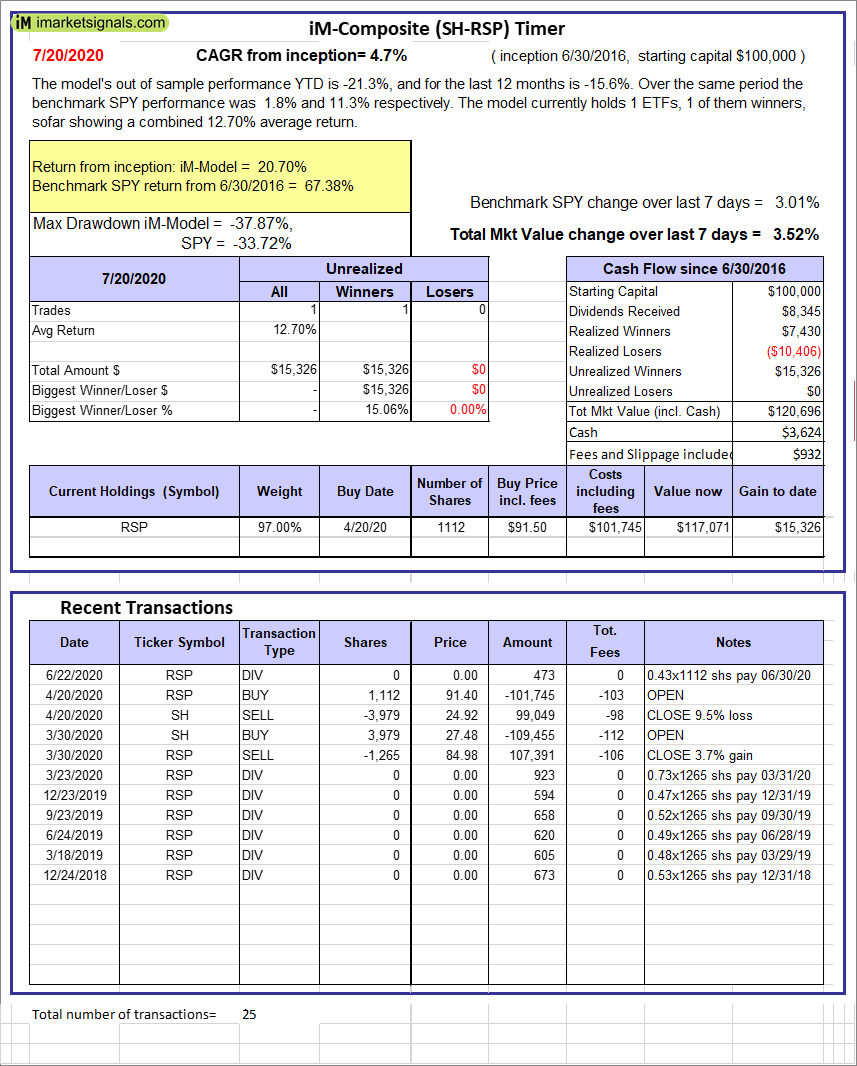 |
iM-Composite (SH-RSP) Timer: The model’s out of sample performance YTD is -21.3%, and for the last 12 months is -15.6%. Over the same period the benchmark SPY performance was 1.8% and 11.3% respectively. Over the previous week the market value of the iM-Composite (SH-RSP) Timer gained 3.52% at a time when SPY gained 3.01%. A starting capital of $100,000 at inception on 6/30/2016 would have grown to $120,696 which includes $3,624 cash and excludes $932 spent on fees and slippage. |
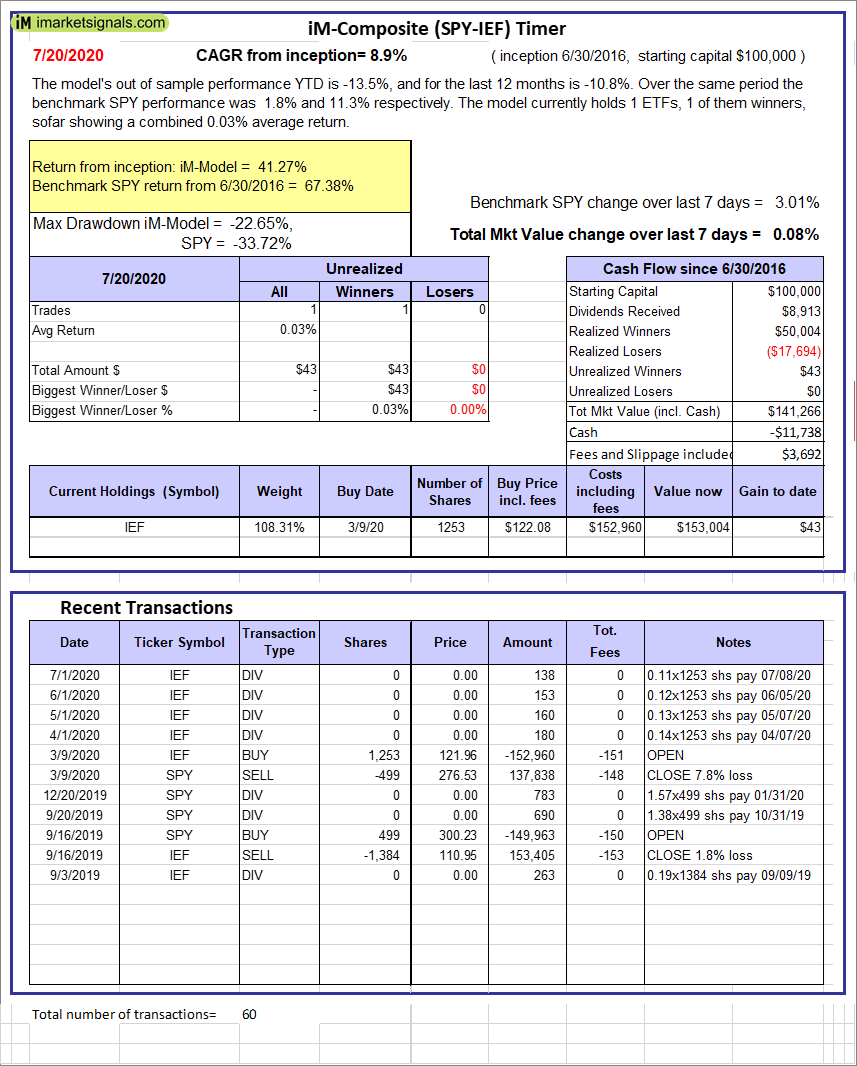 |
iM-Composite (SPY-IEF) Timer: The model’s out of sample performance YTD is -13.5%, and for the last 12 months is -10.8%. Over the same period the benchmark SPY performance was 1.8% and 11.3% respectively. Over the previous week the market value of the iM-Composite (SPY-IEF) Timer gained 0.08% at a time when SPY gained 3.01%. A starting capital of $100,000 at inception on 6/30/2016 would have grown to $141,266 which includes -$11,738 cash and excludes $3,692 spent on fees and slippage. |
 |
iM-Composite(Gold-Stocks-Bond) Timer: The model’s out of sample performance YTD is 12.3%, and for the last 12 months is 12.1%. Over the same period the benchmark SPY performance was 1.8% and 11.3% respectively. Over the previous week the market value of the iM-Composite(Gold-Stocks-Bond) Timer gained 2.07% at a time when SPY gained 3.01%. A starting capital of $100,000 at inception on 6/30/2016 would have grown to $146,236 which includes $8,899 cash and excludes $4,898 spent on fees and slippage. |
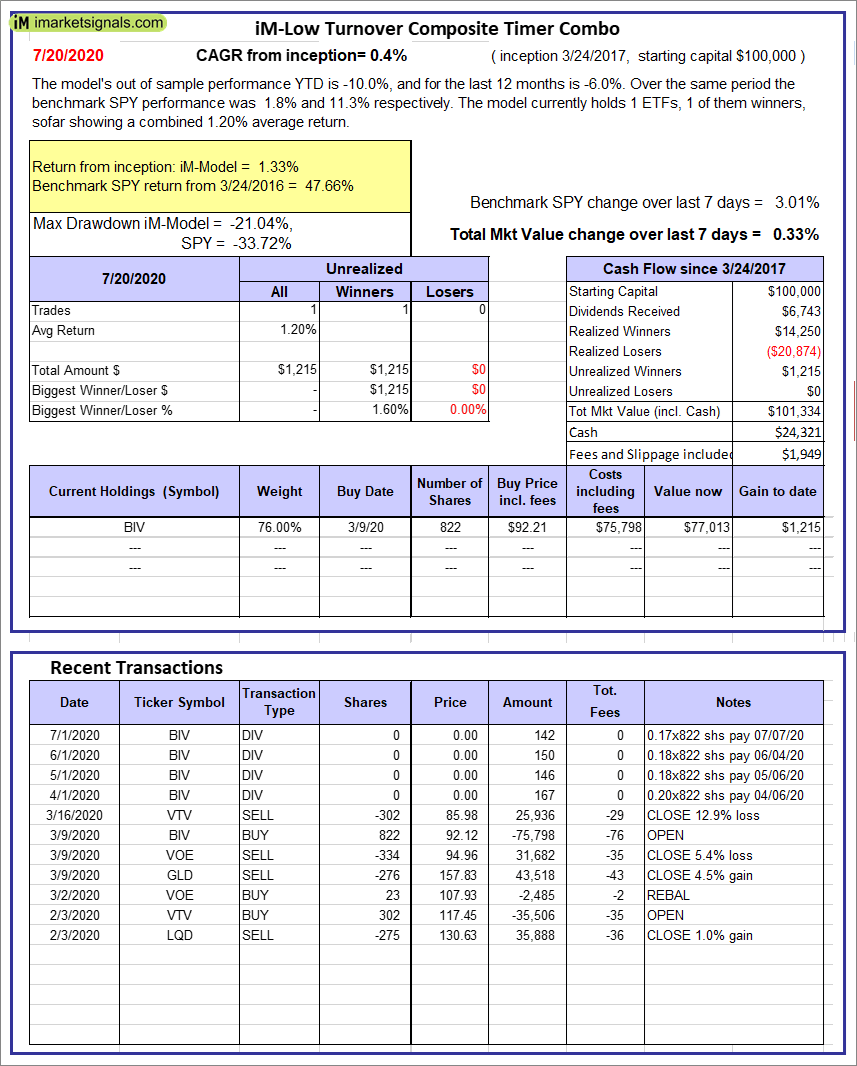 |
iM-Low Turnover Composite Timer Combo: The model’s out of sample performance YTD is -10.0%, and for the last 12 months is -6.0%. Over the same period the benchmark SPY performance was 1.8% and 11.3% respectively. Over the previous week the market value of the iM-Low Turnover Composite Timer Combo gained 0.33% at a time when SPY gained 3.01%. A starting capital of $100,000 at inception on 3/24/27 would have grown to $101,334 which includes $24,321 cash and excludes $1,949 spent on fees and slippage. |
 |
iM-5ETF Trader (includes leveraged ETFs): The model’s out of sample performance YTD is -35.5%, and for the last 12 months is -35.4%. Over the same period the benchmark SPY performance was 1.8% and 11.3% respectively. Over the previous week the market value of the iM-5ETF Trader (includes leveraged ETFs) gained -0.59% at a time when SPY gained 3.01%. A starting capital of $100,000 at inception on 10/30/2016 would have grown to $101,523 which includes -$1,392 cash and excludes $4,130 spent on fees and slippage. |
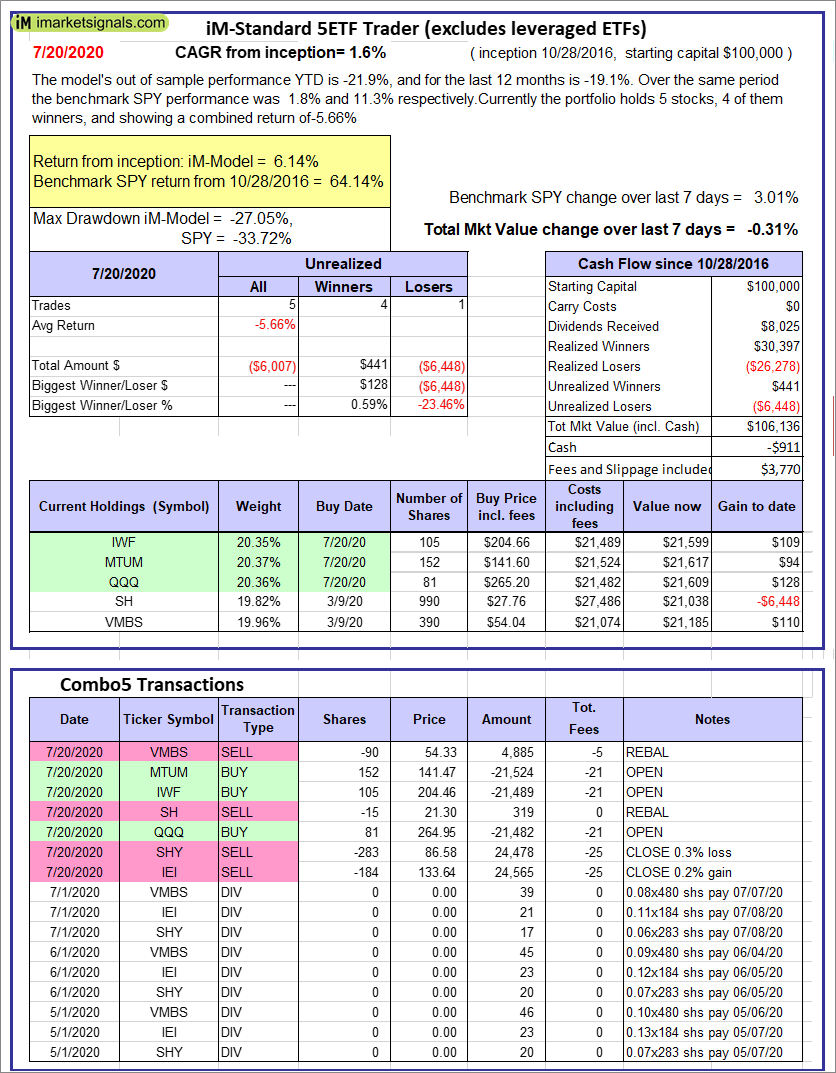 |
iM-Standard 5ETF Trader (excludes leveraged ETFs): The model’s out of sample performance YTD is -21.9%, and for the last 12 months is -19.1%. Over the same period the benchmark SPY performance was 1.8% and 11.3% respectively. Over the previous week the market value of the iM-Standard 5ETF Trader (excludes leveraged ETFs) gained -0.31% at a time when SPY gained 3.01%. A starting capital of $100,000 at inception on 10/30/2016 would have grown to $106,136 which includes -$911 cash and excludes $3,770 spent on fees and slippage. |
iM-Best Reports – 7/14/2020
Posted in pmp SPY-SH
Leave a Reply
You must be logged in to post a comment.