
  |
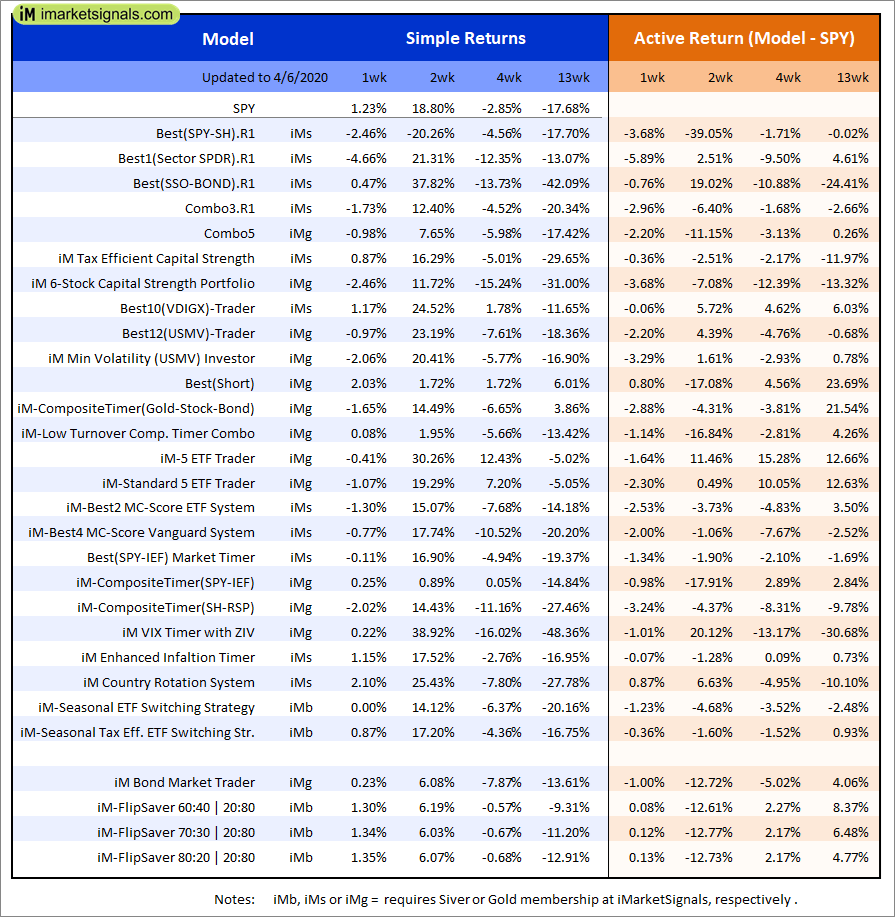
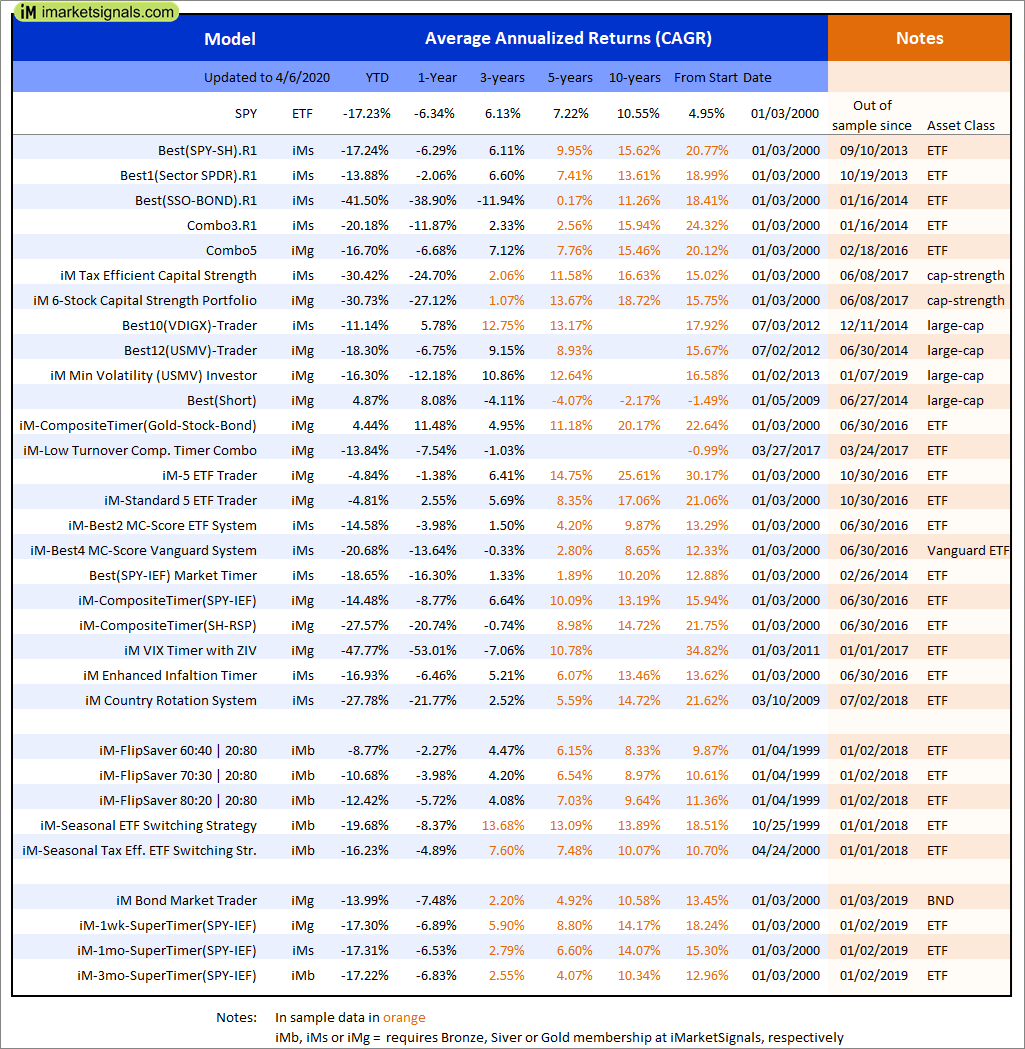
Out of sample performance summary of our models for the past 1, 2, 4 and 13 week periods. The active active return indicates how the models over- or underperformed the benchmark ETF SPY. Also the YTD, and the 1-, 3-, 5- and 10-year annualized returns are shown in the second table |
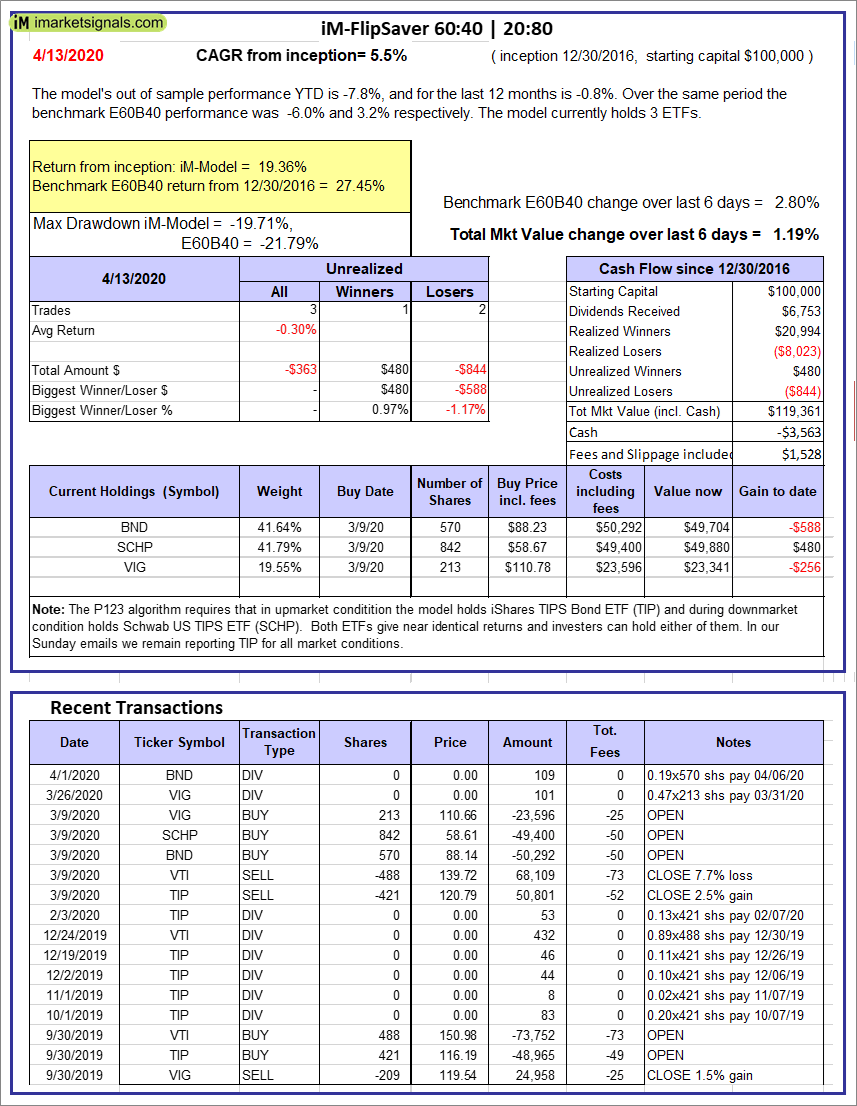 |
iM-FlipSaver 60:40 | 20:80 – 2017: The model’s out of sample performance YTD is -7.8%, and for the last 12 months is -0.8%. Over the same period the benchmark E60B40 performance was -6.0% and 3.2% respectively. Over the previous week the market value of iM-FlipSaver 80:20 | 20:80 gained 1.19% at a time when SPY gained 2.80%. A starting capital of $100,000 at inception on 7/16/2015 would have grown to $119,361 which includes -$3,563 cash and excludes $1,528 spent on fees and slippage. |
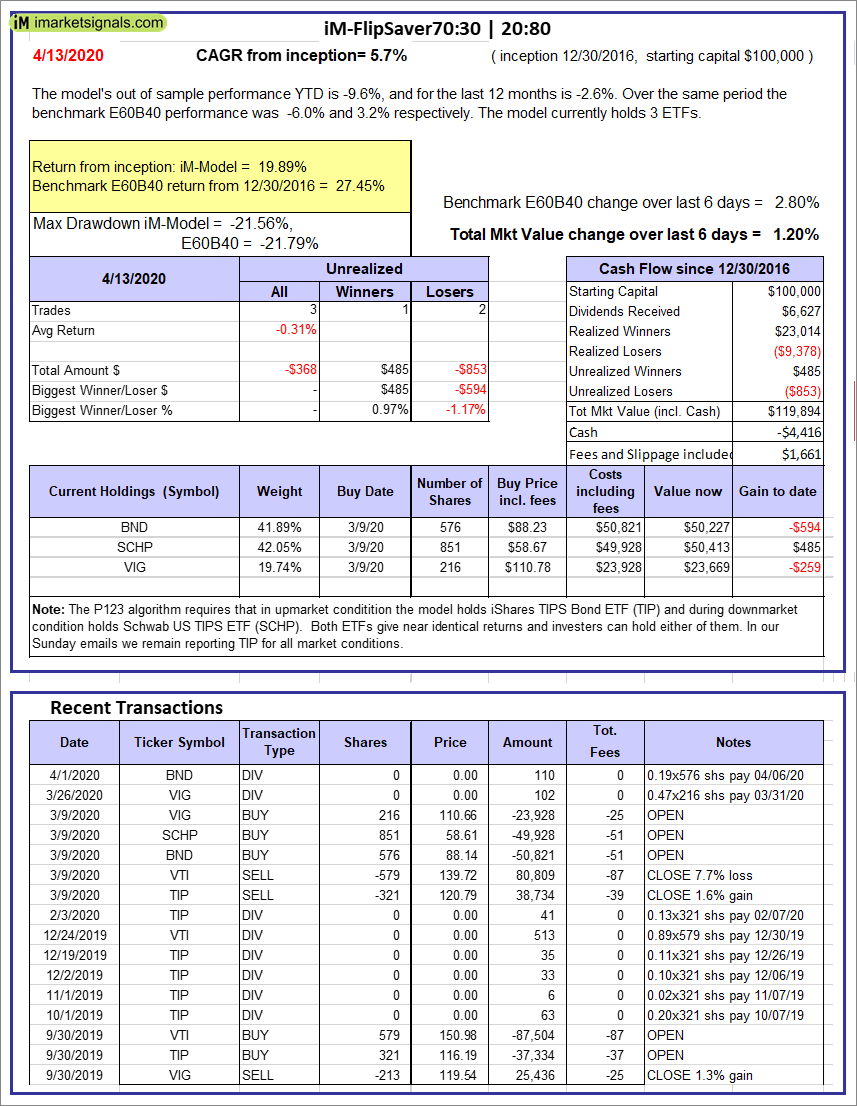 |
iM-FlipSaver 70:30 | 20:80 – 2017: The model’s out of sample performance YTD is -9.6%, and for the last 12 months is -2.6%. Over the same period the benchmark E60B40 performance was -6.0% and 3.2% respectively. Over the previous week the market value of iM-FlipSaver 70:30 | 20:80 gained 1.20% at a time when SPY gained 2.80%. A starting capital of $100,000 at inception on 7/15/2015 would have grown to $119,894 which includes -$4,416 cash and excludes $1,661 spent on fees and slippage. |
 |
iM-FlipSaver 80:20 | 20:80 – 2017: The model’s out of sample performance YTD is -11.4%, and for the last 12 months is -4.3%. Over the same period the benchmark E60B40 performance was -6.0% and 3.2% respectively. Over the previous week the market value of iM-FlipSaver 80:20 | 20:80 gained 1.21% at a time when SPY gained 2.80%. A starting capital of $100,000 at inception on 1/2/2017 would have grown to $120,361 which includes -$5,224 cash and excludes $1,786 spent on fees and slippage. |
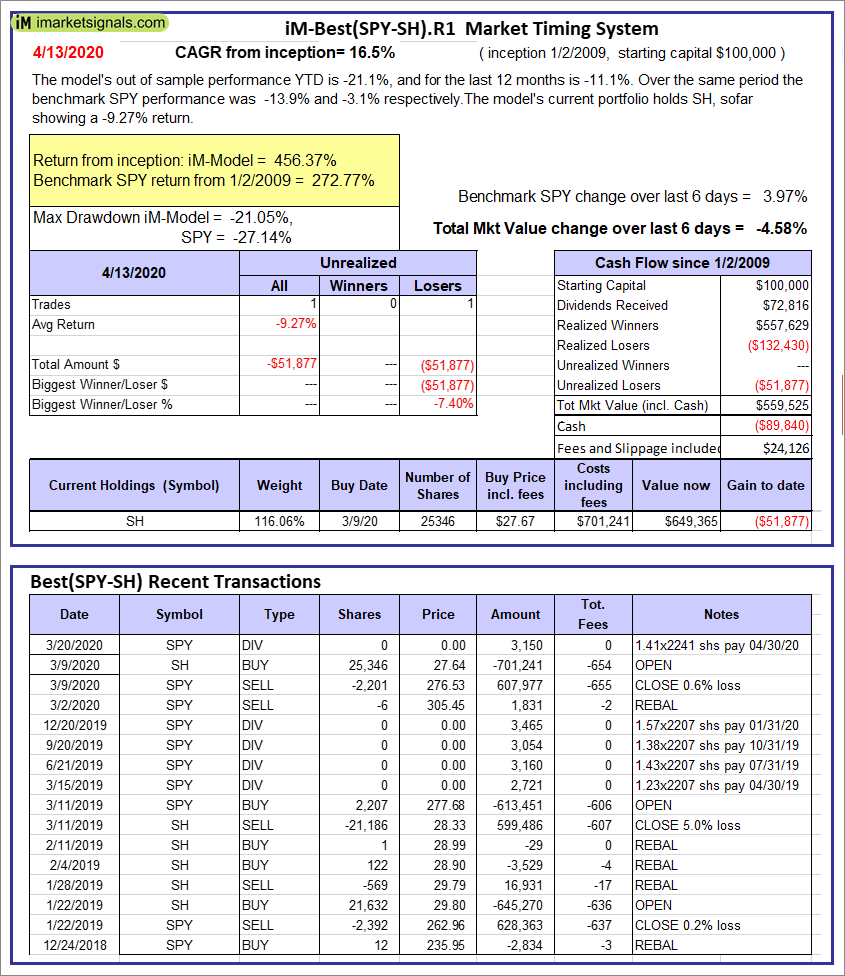 |
iM-Best(SPY-SH).R1: The model’s out of sample performance YTD is -21.1%, and for the last 12 months is -11.1%. Over the same period the benchmark SPY performance was -13.9% and -3.1% respectively. Over the previous week the market value of Best(SPY-SH) gained -4.58% at a time when SPY gained 3.97%. A starting capital of $100,000 at inception on 1/2/2009 would have grown to $559,525 which includes -$89,840 cash and excludes $24,126 spent on fees and slippage. |
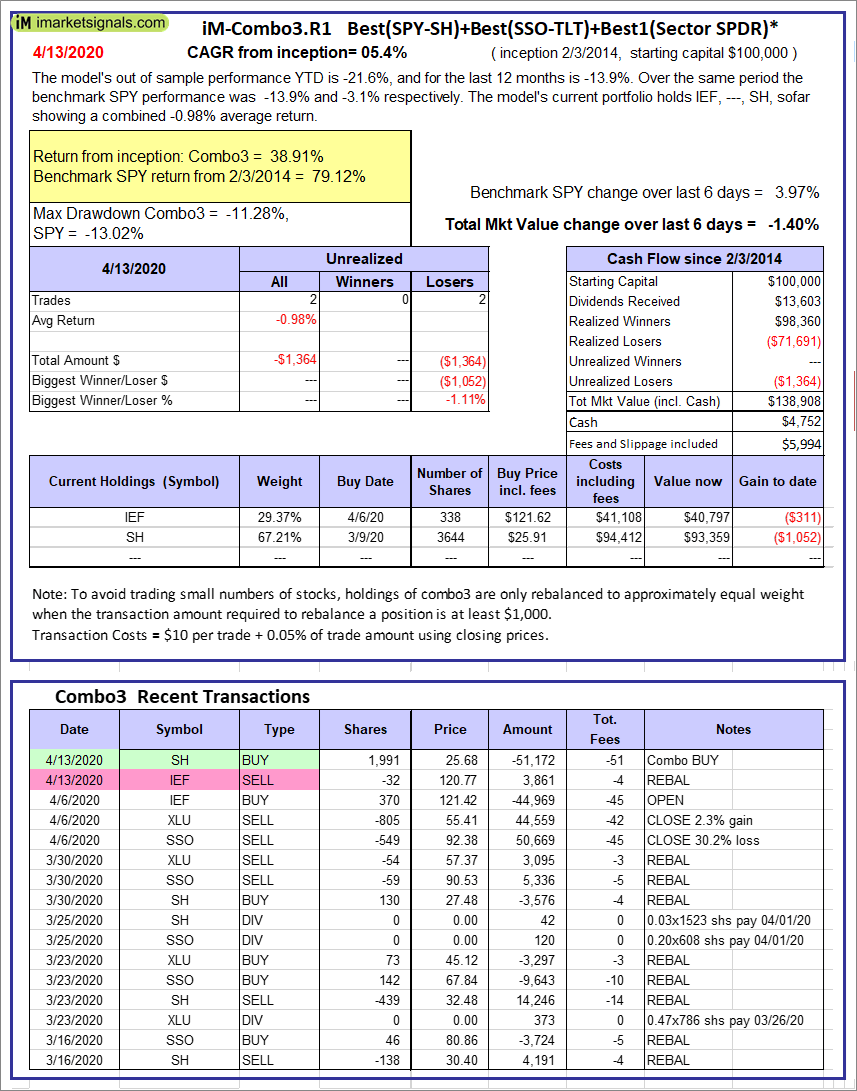 |
iM-Combo3.R1: The model’s out of sample performance YTD is -21.6%, and for the last 12 months is -13.9%. Over the same period the benchmark SPY performance was -13.9% and -3.1% respectively. Over the previous week the market value of iM-Combo3.R1 gained -1.40% at a time when SPY gained 3.97%. A starting capital of $100,000 at inception on 2/3/2014 would have grown to $138,908 which includes $4,752 cash and excludes $5,994 spent on fees and slippage. |
 |
iM-Combo5: The model’s out of sample performance YTD is -17.6%, and for the last 12 months is -8.4%. Over the same period the benchmark SPY performance was -13.9% and -3.1% respectively. Over the previous week the market value of iM-Combo5 gained -0.77% at a time when SPY gained 3.97%. A starting capital of $100,000 at inception on 2/22/2016 would have grown to $126,917 which includes -$4,339 cash and excludes $0 spent on fees and slippage. |
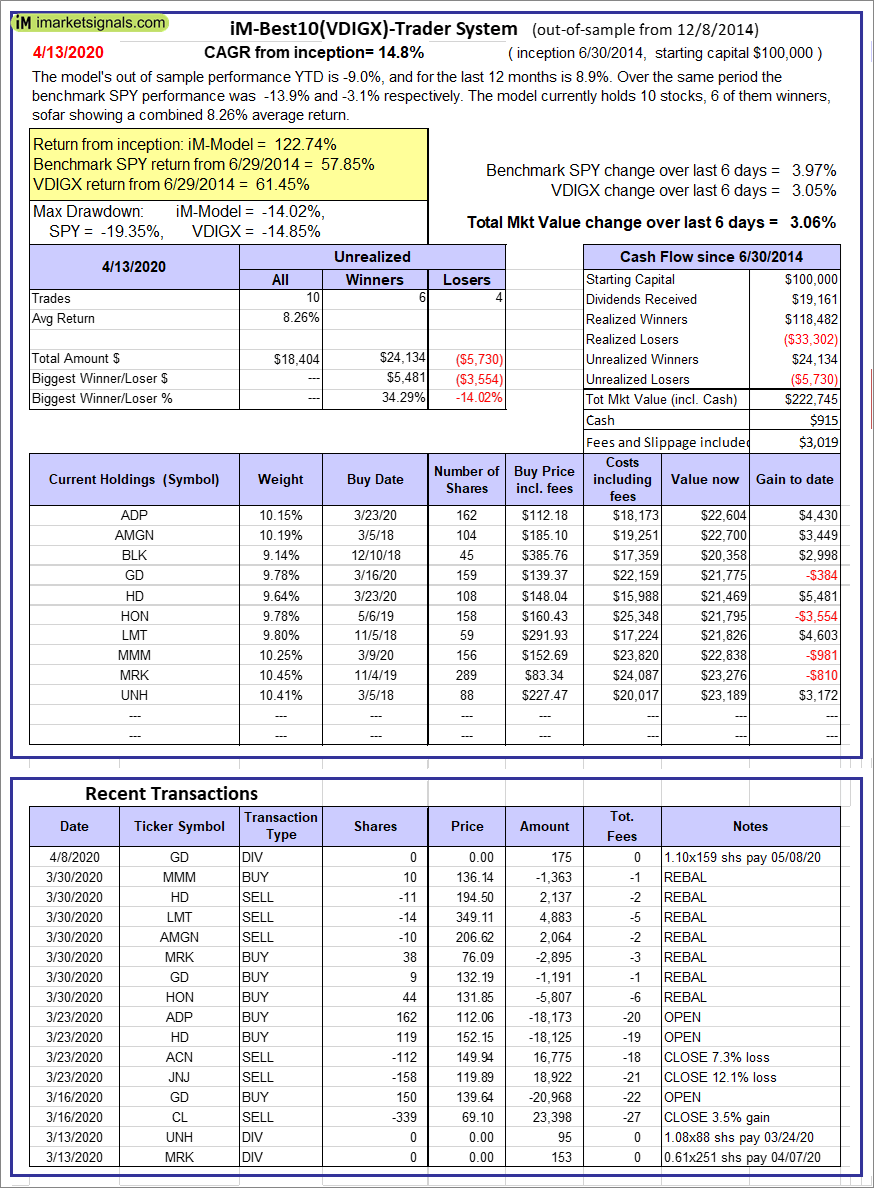 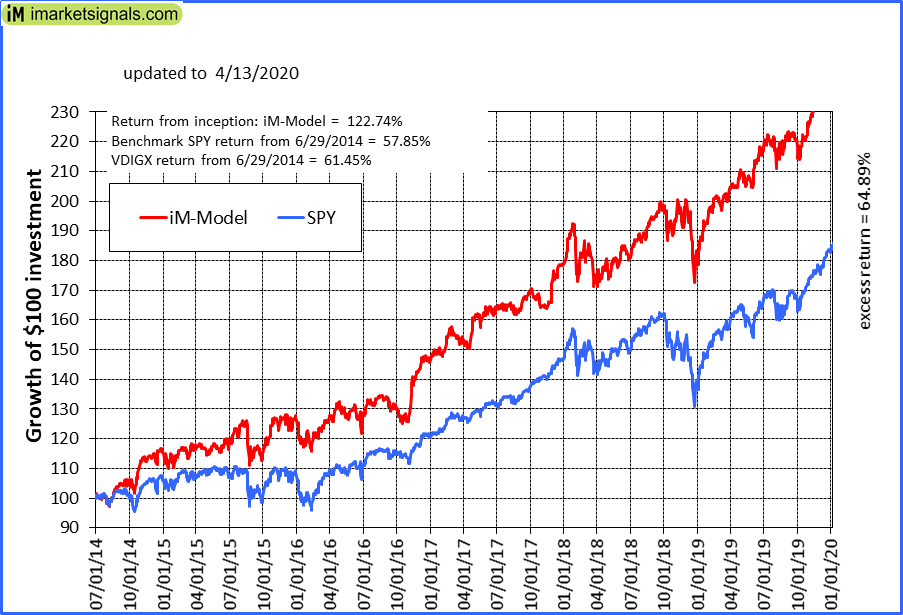 |
iM-Best10(VDIGX)-Trader: The model’s out of sample performance YTD is -9.0%, and for the last 12 months is 8.9%. Over the same period the benchmark SPY performance was -13.9% and -3.1% respectively. Since inception, on 7/1/2014, the model gained 122.74% while the benchmark SPY gained 57.85% and VDIGX gained 61.45% over the same period. Over the previous week the market value of iM-Best10(VDIGX) gained 3.06% at a time when SPY gained 3.97%. A starting capital of $100,000 at inception on 7/1/2014 would have grown to $222,745 which includes $915 cash and excludes $3,019 spent on fees and slippage. |
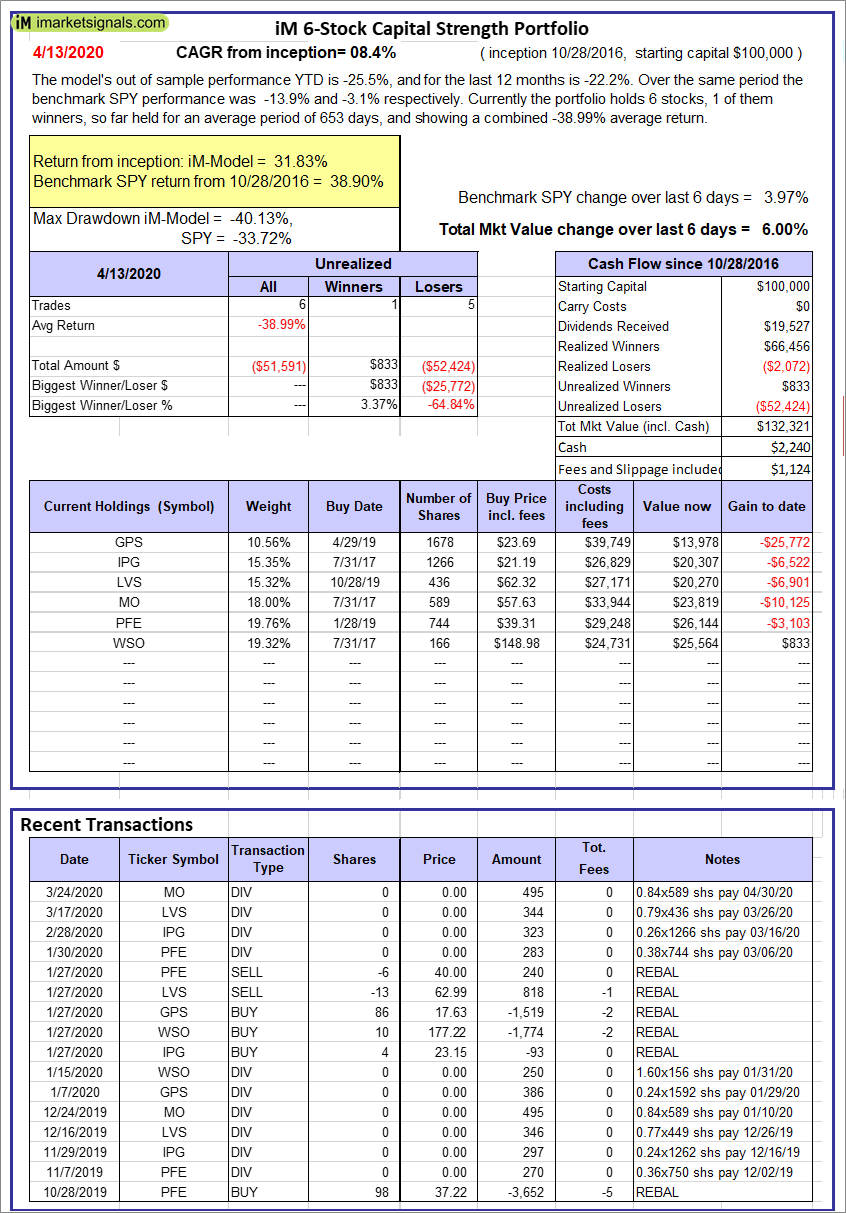 |
iM 6-Stock Capital Strength Portfolio: The model’s out of sample performance YTD is -25.5%, and for the last 12 months is -22.2%. Over the same period the benchmark SPY performance was -13.9% and -3.1% respectively. Over the previous week the market value of the iM 6-Stock Capital Strength Portfolio gained 6.00% at a time when SPY gained 3.97%. A starting capital of $100,000 at inception on 10/28/2016 would have grown to $132,321 which includes $2,240 cash and excludes $1,124 spent on fees and slippage. |
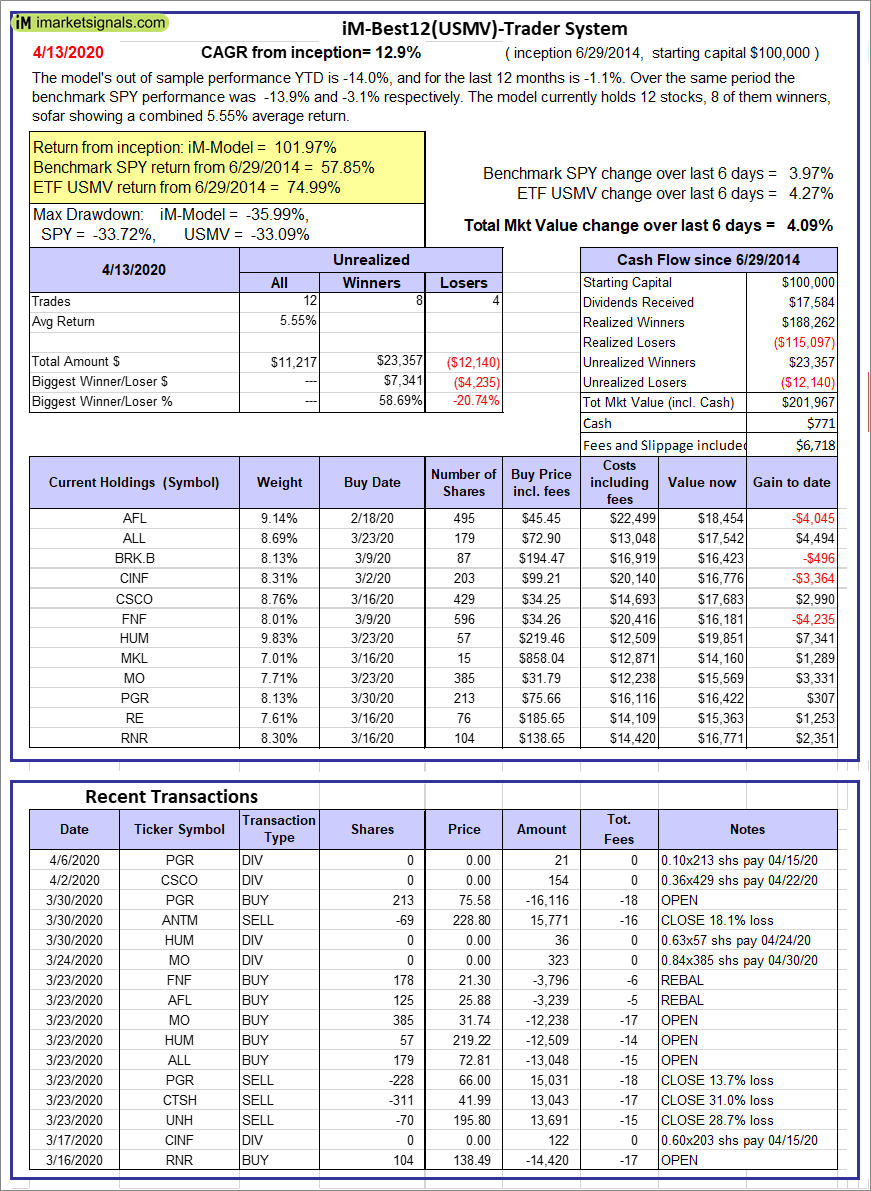 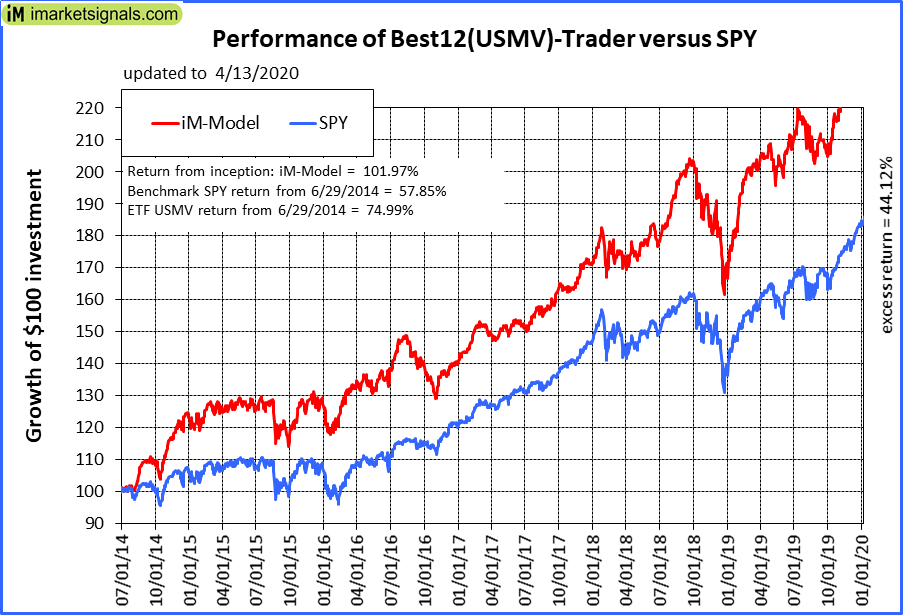 |
iM-Best12(USMV)-Trader: The model’s out of sample performance YTD is -14.0%, and for the last 12 months is -1.1%. Over the same period the benchmark SPY performance was -13.9% and -3.1% respectively. Since inception, on 6/30/2014, the model gained 101.97% while the benchmark SPY gained 57.85% and the ETF USMV gained 74.99% over the same period. Over the previous week the market value of iM-Best12(USMV)-Trader gained 4.09% at a time when SPY gained 3.97%. A starting capital of $100,000 at inception on 6/30/2014 would have grown to $201,967 which includes $771 cash and excludes $6,718 spent on fees and slippage. |
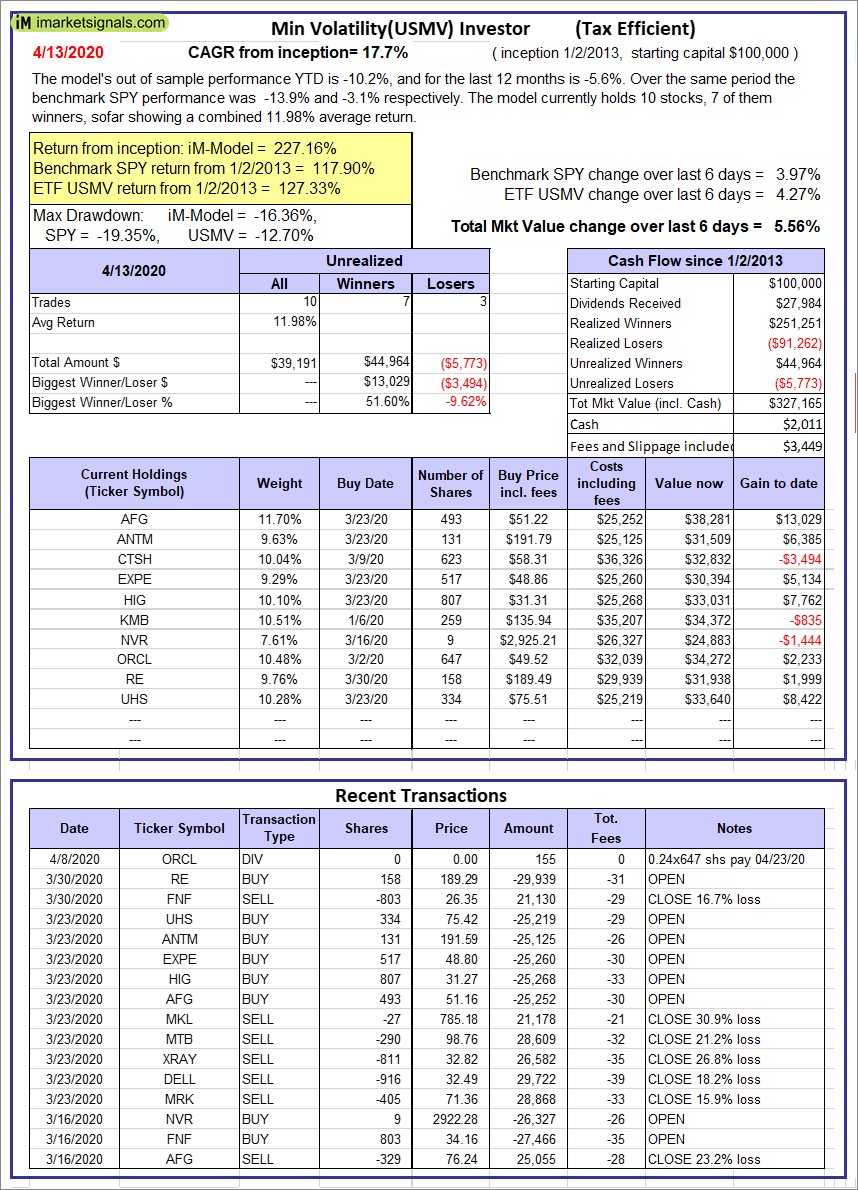 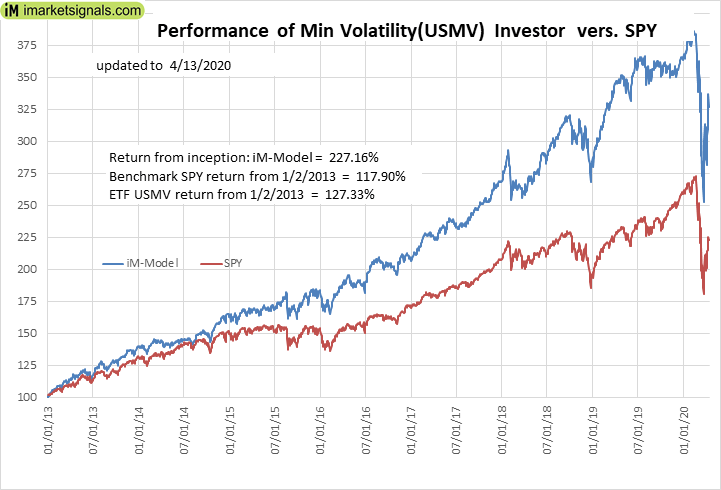 |
iM-Min Volatility(USMV) Investor (Tax Efficient): The model’s out of sample performance YTD is -10.2%, and for the last 12 months is -5.6%. Over the same period the benchmark SPY performance was -13.9% and -3.1% respectively. Since inception, on 1/3/2013, the model gained 227.16% while the benchmark SPY gained 117.90% and the ETF USMV gained 127.33% over the same period. Over the previous week the market value of iM-Best12(USMV)Q1 gained 5.56% at a time when SPY gained 3.97%. A starting capital of $100,000 at inception on 1/3/2013 would have grown to $327,165 which includes $2,011 cash and excludes $3,449 spent on fees and slippage. |
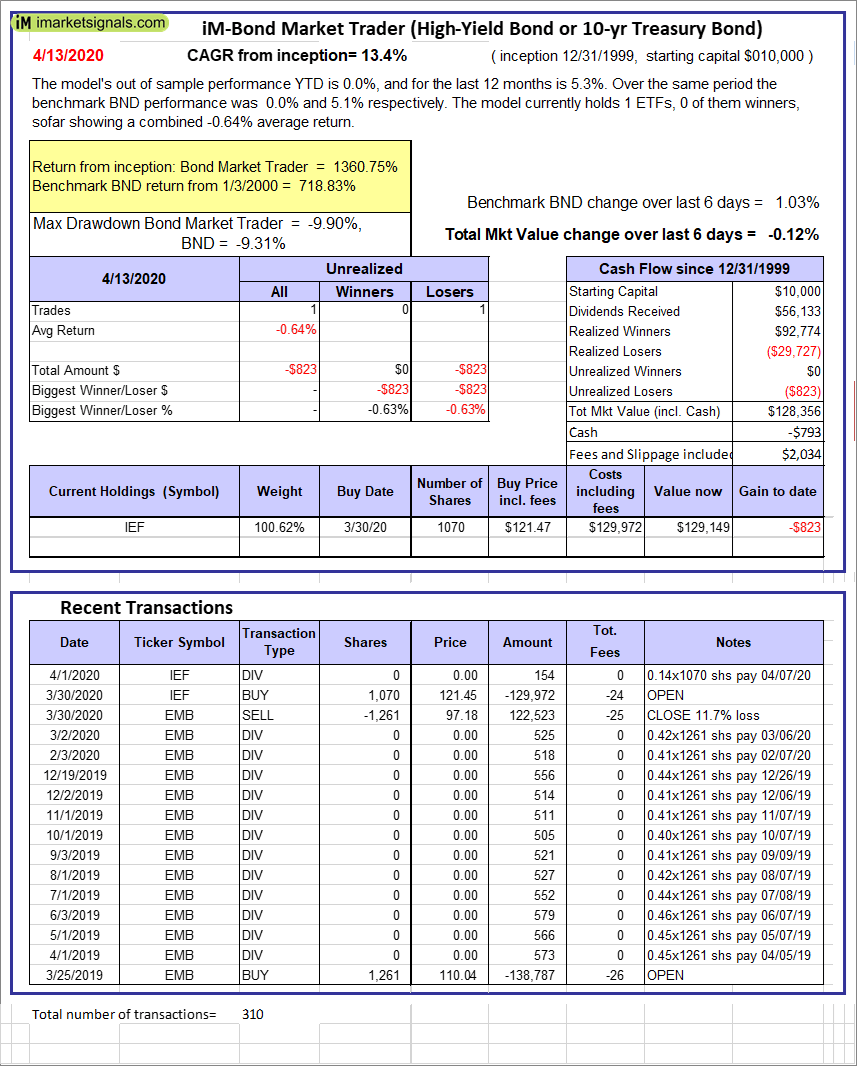 |
iM-Bond Market Trader (High-Yield Bond or 10-yr Treasury Bond): The model’s out of sample performance YTD is -30.7%, and for the last 12 months is -29.4%. Over the same period the benchmark SPY performance was -13.9% and -3.1% respectively. Over the previous week the market value of the iM-Bond Market Trader (High-Yield Bond or 10-yr Treasury Bond) gained -0.12% at a time when BND gained 1.03%. A starting capital of $100,000 at inception on 10/30/2016 would have grown to $128,356 which includes -$793 cash and excludes $2,034 spent on fees and slippage. |
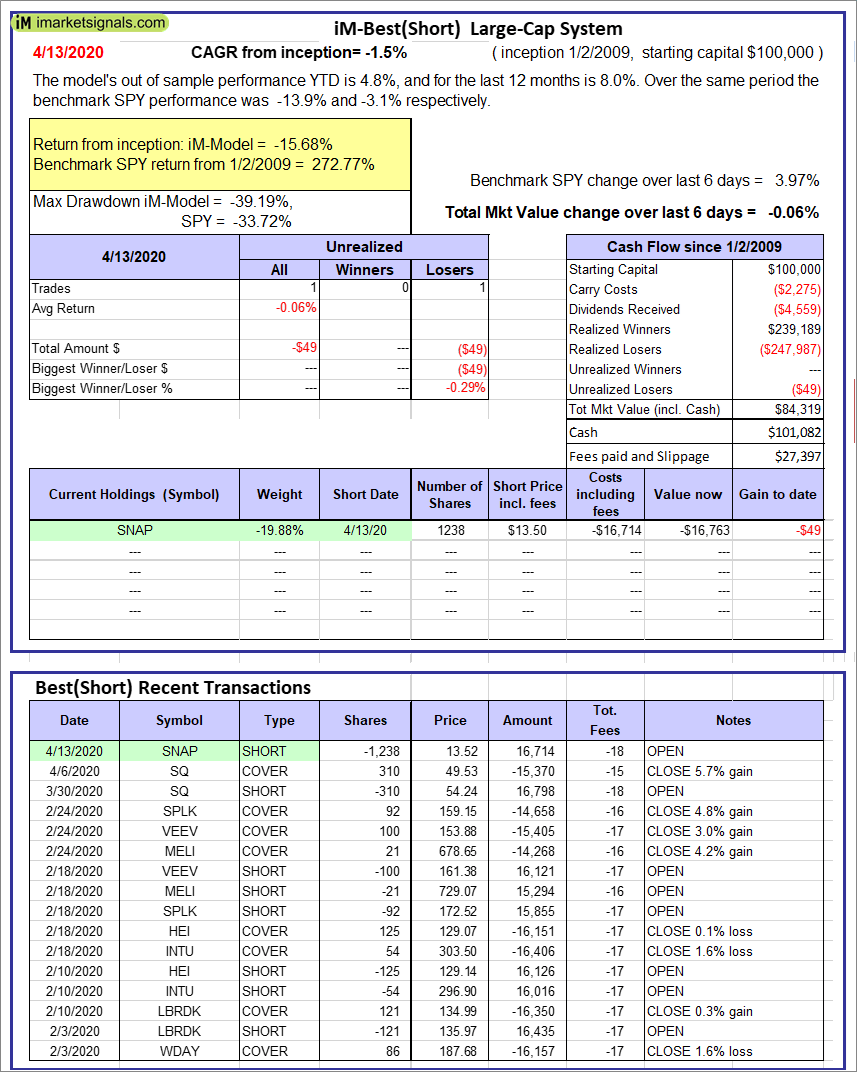 |
iM-Best(Short): The model’s out of sample performance YTD is 4.8%, and for the last 12 months is 8.0%. Over the same period the benchmark SPY performance was -13.9% and -3.1% respectively. Over the previous week the market value of iM-Best(Short) gained -0.06% at a time when SPY gained 3.97%. Over the period 1/2/2009 to 4/13/2020 the starting capital of $100,000 would have grown to $84,319 which includes $101,082 cash and excludes $27,397 spent on fees and slippage. |
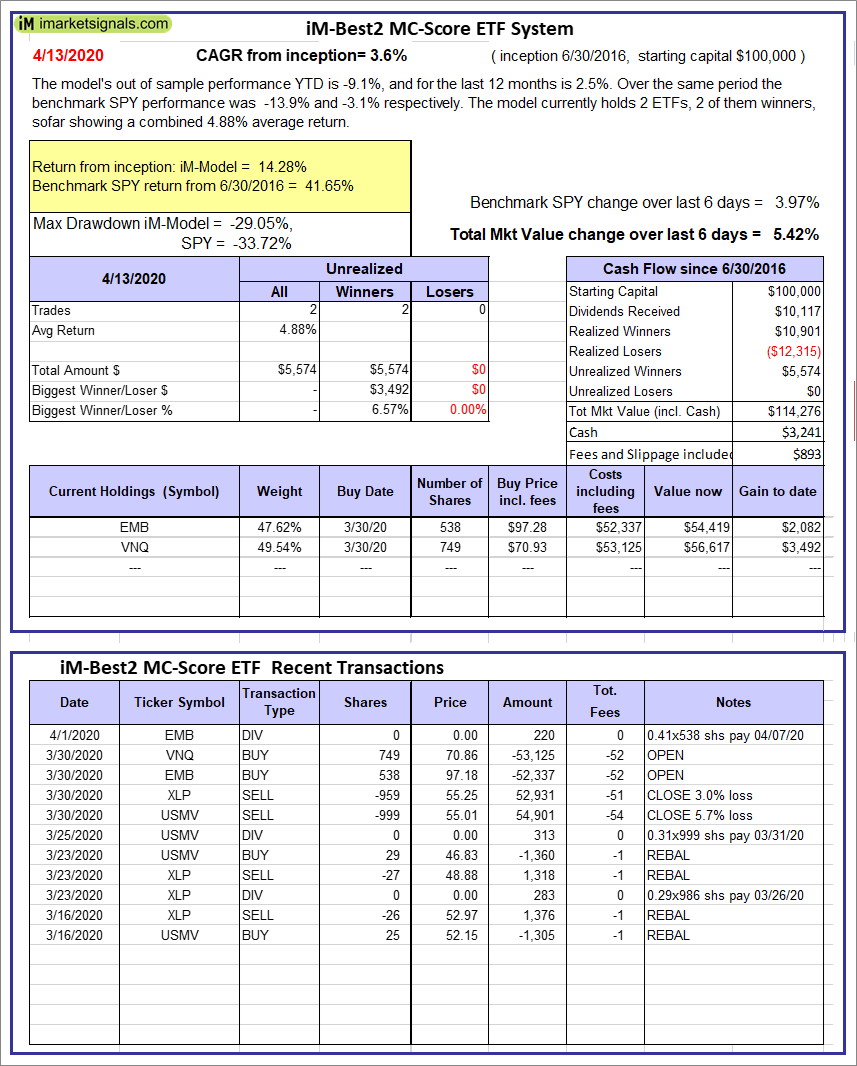 |
iM-Best2 MC-Score ETF System: The model’s out of sample performance YTD is -9.1%, and for the last 12 months is 2.5%. Over the same period the benchmark SPY performance was -13.9% and -3.1% respectively. Over the previous week the market value of the iM-Best2 MC-Score ETF System gained 5.42% at a time when SPY gained 3.97%. A starting capital of $100,000 at inception on 6/30/2016 would have grown to $114,276 which includes $3,241 cash and excludes $893 spent on fees and slippage. |
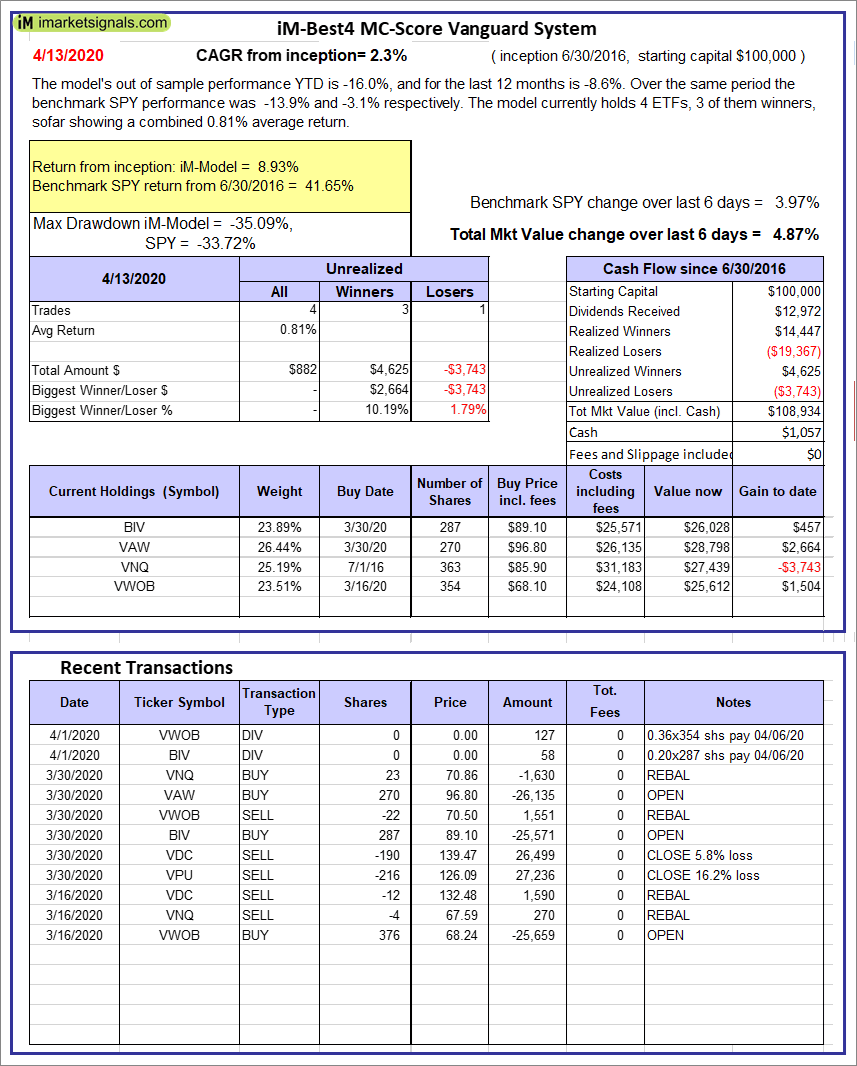 |
iM-Best4 MC-Score Vanguard System: The model’s out of sample performance YTD is -16.0%, and for the last 12 months is -8.6%. Over the same period the benchmark SPY performance was -13.9% and -3.1% respectively. Over the previous week the market value of the iM-Best4 MC-Score Vanguard System gained 4.87% at a time when SPY gained 3.97%. A starting capital of $100,000 at inception on 6/30/2016 would have grown to $108,934 which includes $1,057 cash and excludes $00 spent on fees and slippage. |
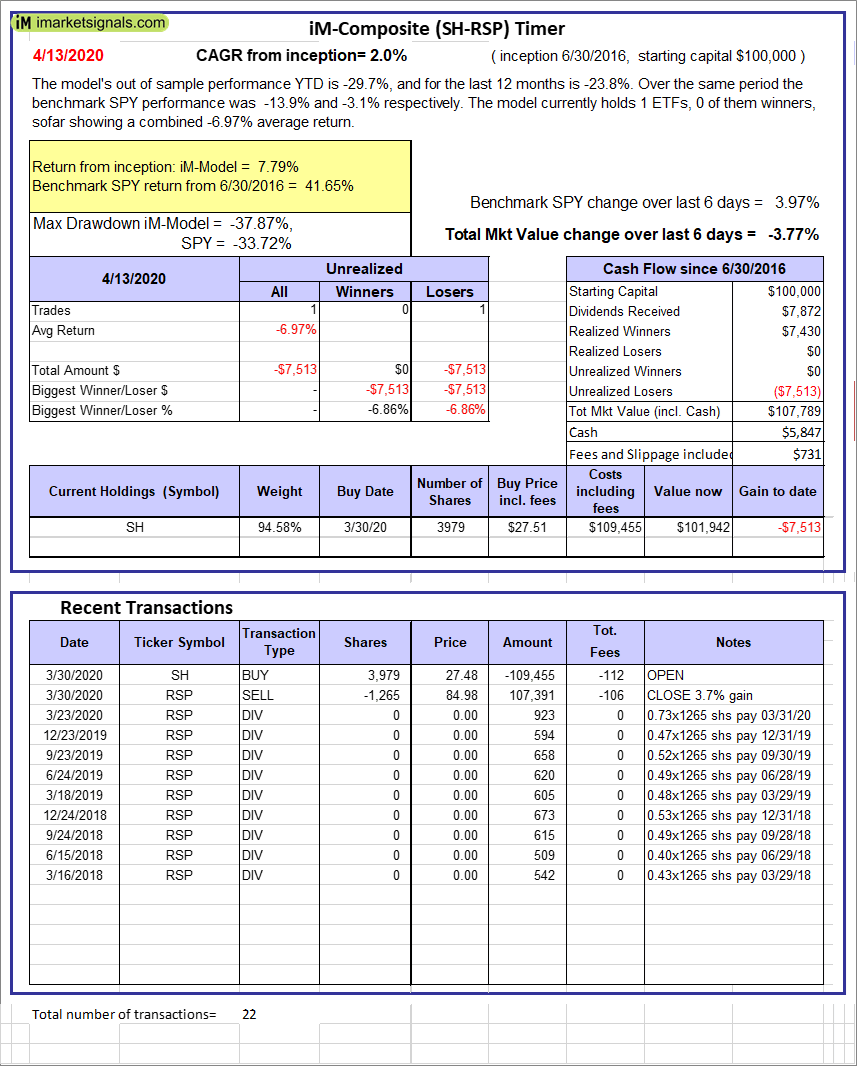 |
iM-Composite (SH-RSP) Timer: The model’s out of sample performance YTD is -29.7%, and for the last 12 months is -23.8%. Over the same period the benchmark SPY performance was -13.9% and -3.1% respectively. Over the previous week the market value of the iM-Composite (SH-RSP) Timer gained -3.77% at a time when SPY gained 3.97%. A starting capital of $100,000 at inception on 6/30/2016 would have grown to $107,789 which includes $5,847 cash and excludes $731 spent on fees and slippage. |
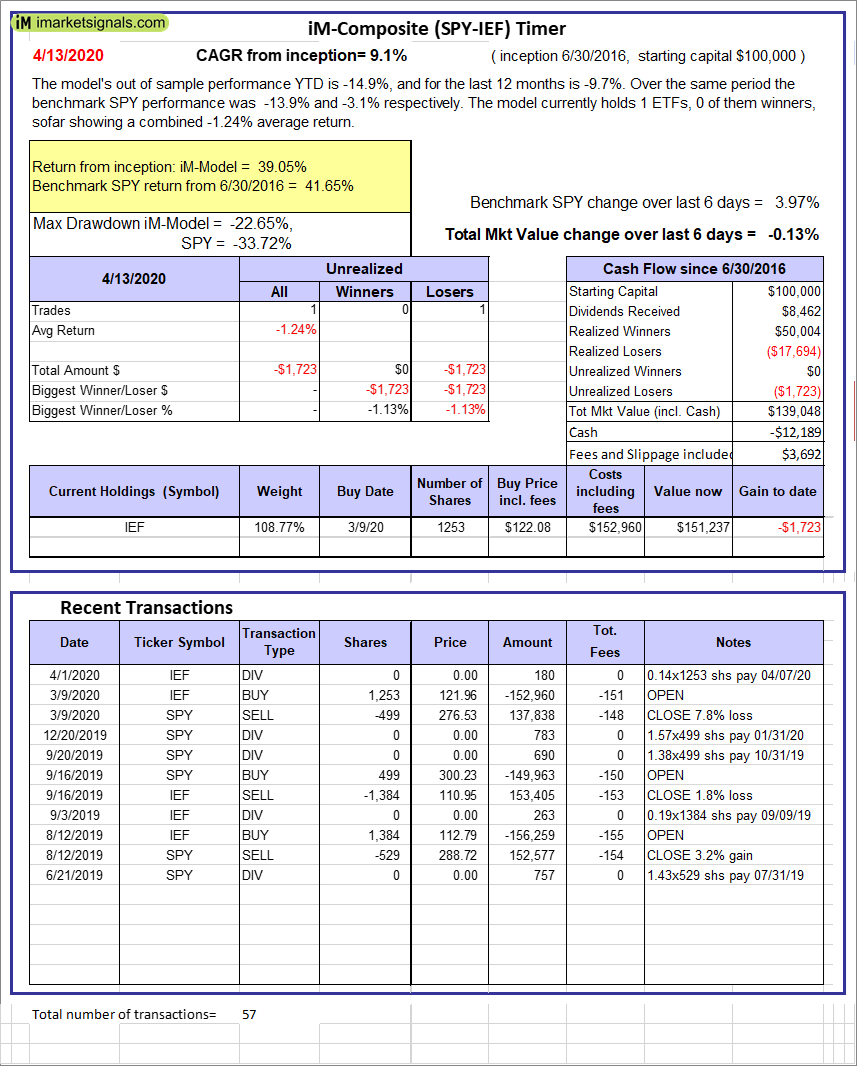 |
iM-Composite (SPY-IEF) Timer: The model’s out of sample performance YTD is -14.9%, and for the last 12 months is -9.7%. Over the same period the benchmark SPY performance was -13.9% and -3.1% respectively. Over the previous week the market value of the iM-Composite (SPY-IEF) Timer gained -0.13% at a time when SPY gained 3.97%. A starting capital of $100,000 at inception on 6/30/2016 would have grown to $139,048 which includes -$12,189 cash and excludes $3,692 spent on fees and slippage. |
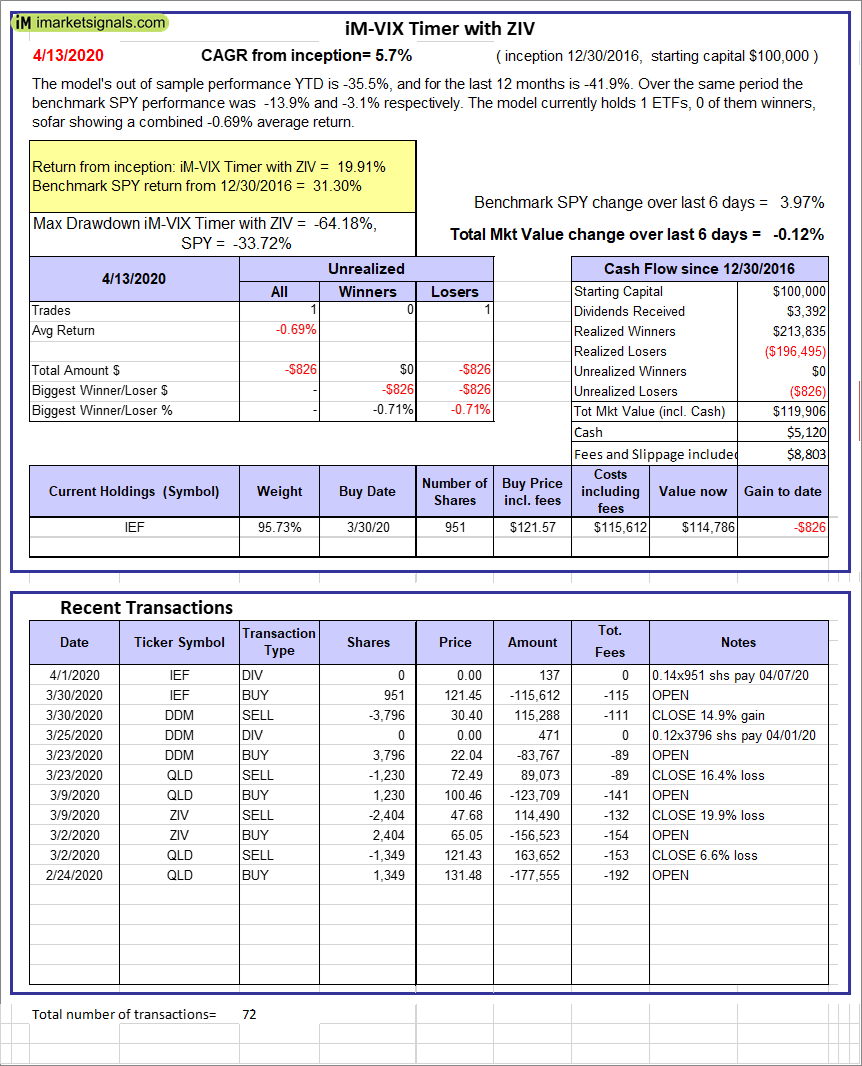 |
iM-VIX Timer with ZIV: The model’s out of sample performance YTD is -35.5%, and for the last 12 months is -41.9%. Over the same period the benchmark SPY performance was -13.9% and -3.1% respectively. Over the previous week the market value of the iM-VIX Timer with ZIV gained -0.12% at a time when SPY gained 3.97%. A starting capital of $100,000 at inception on 6/30/2016 would have grown to $119,906 which includes $5,120 cash and excludes $8,803 spent on fees and slippage. |
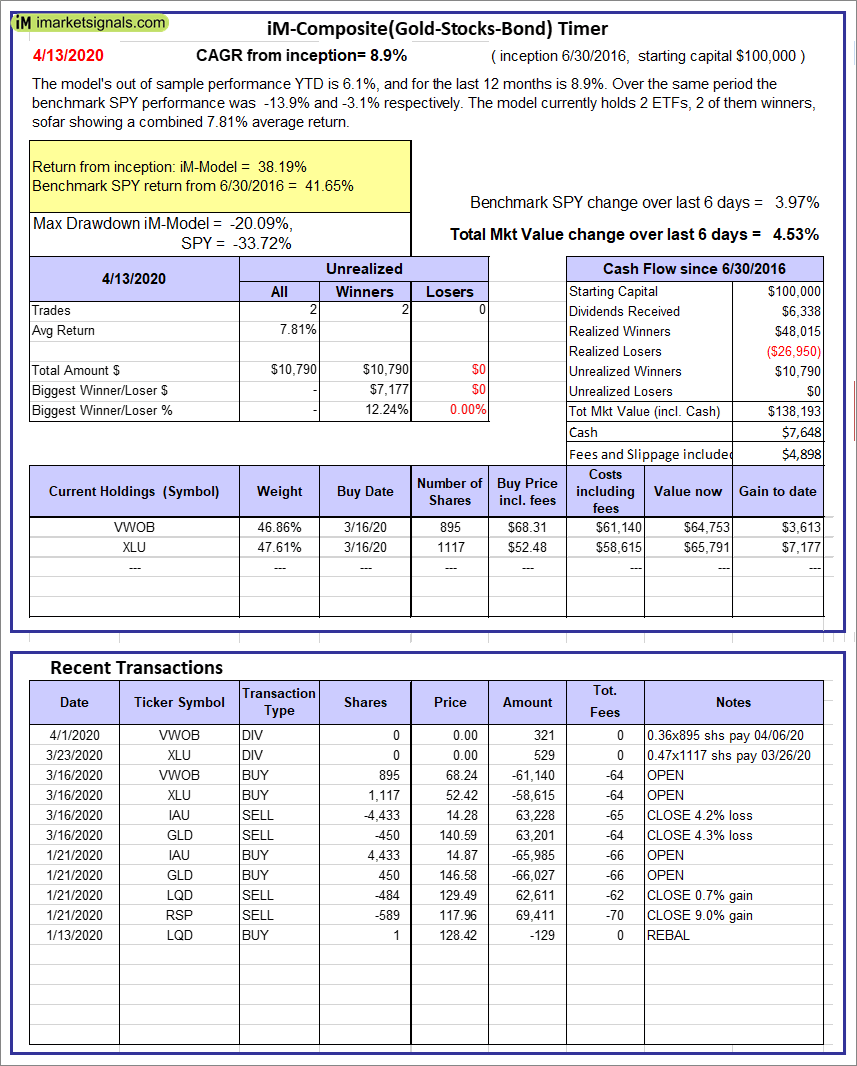 |
iM-Composite(Gold-Stocks-Bond) Timer: The model’s out of sample performance YTD is 6.1%, and for the last 12 months is 8.9%. Over the same period the benchmark SPY performance was -13.9% and -3.1% respectively. Over the previous week the market value of the iM-Composite(Gold-Stocks-Bond) Timer gained 4.53% at a time when SPY gained 3.97%. A starting capital of $100,000 at inception on 6/30/2016 would have grown to $138,193 which includes $7,648 cash and excludes $4,898 spent on fees and slippage. |
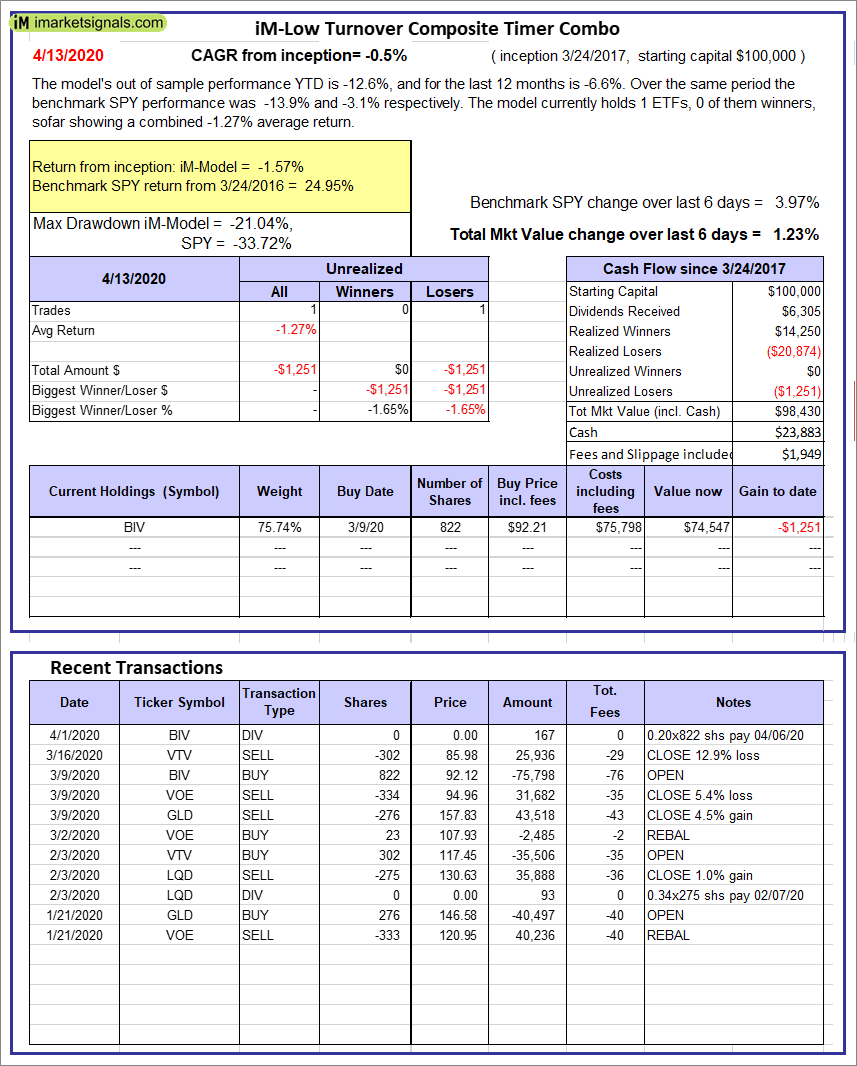 |
iM-Low Turnover Composite Timer Combo: The model’s out of sample performance YTD is -12.6%, and for the last 12 months is -6.6%. Over the same period the benchmark SPY performance was -13.9% and -3.1% respectively. Over the previous week the market value of the iM-Low Turnover Composite Timer Combo gained 1.23% at a time when SPY gained 3.97%. A starting capital of $100,000 at inception on 3/24/27 would have grown to $98,430 which includes $23,883 cash and excludes $1,949 spent on fees and slippage. |
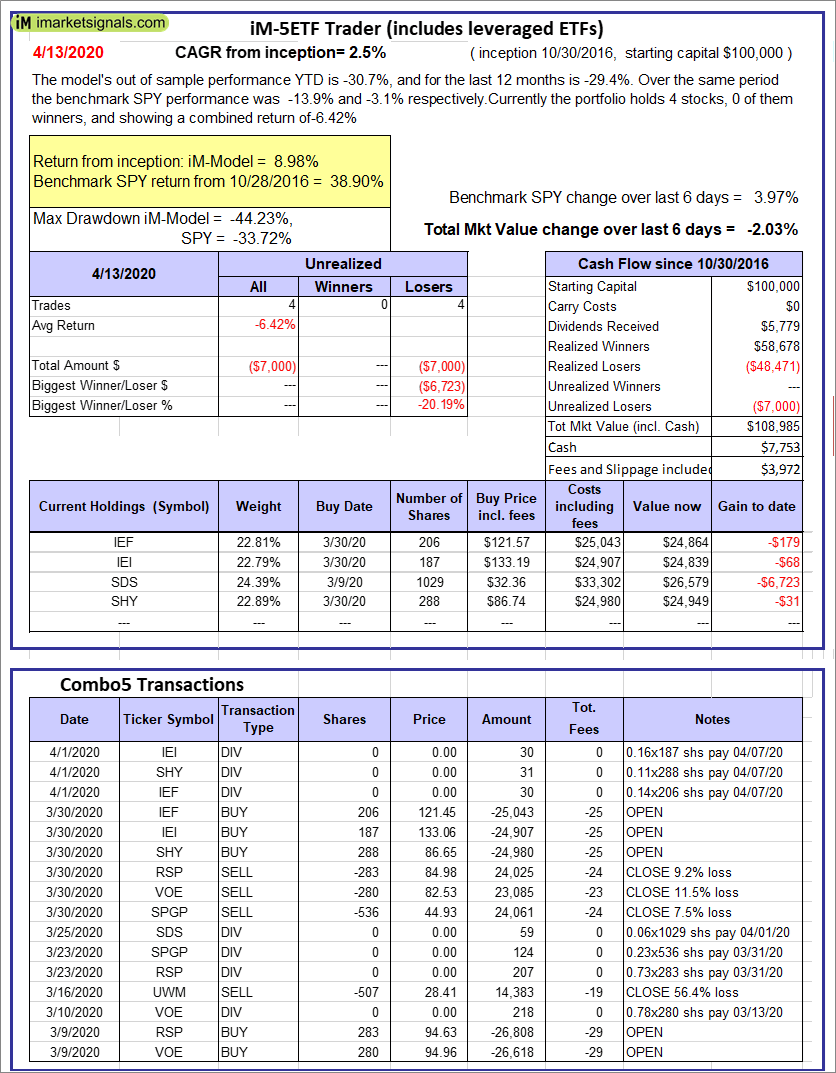 |
iM-5ETF Trader (includes leveraged ETFs): The model’s out of sample performance YTD is -30.7%, and for the last 12 months is -29.4%. Over the same period the benchmark SPY performance was -13.9% and -3.1% respectively. Over the previous week the market value of the iM-5ETF Trader (includes leveraged ETFs) gained -2.03% at a time when SPY gained 3.97%. A starting capital of $100,000 at inception on 10/30/2016 would have grown to $108,985 which includes $7,753 cash and excludes $3,972 spent on fees and slippage. |
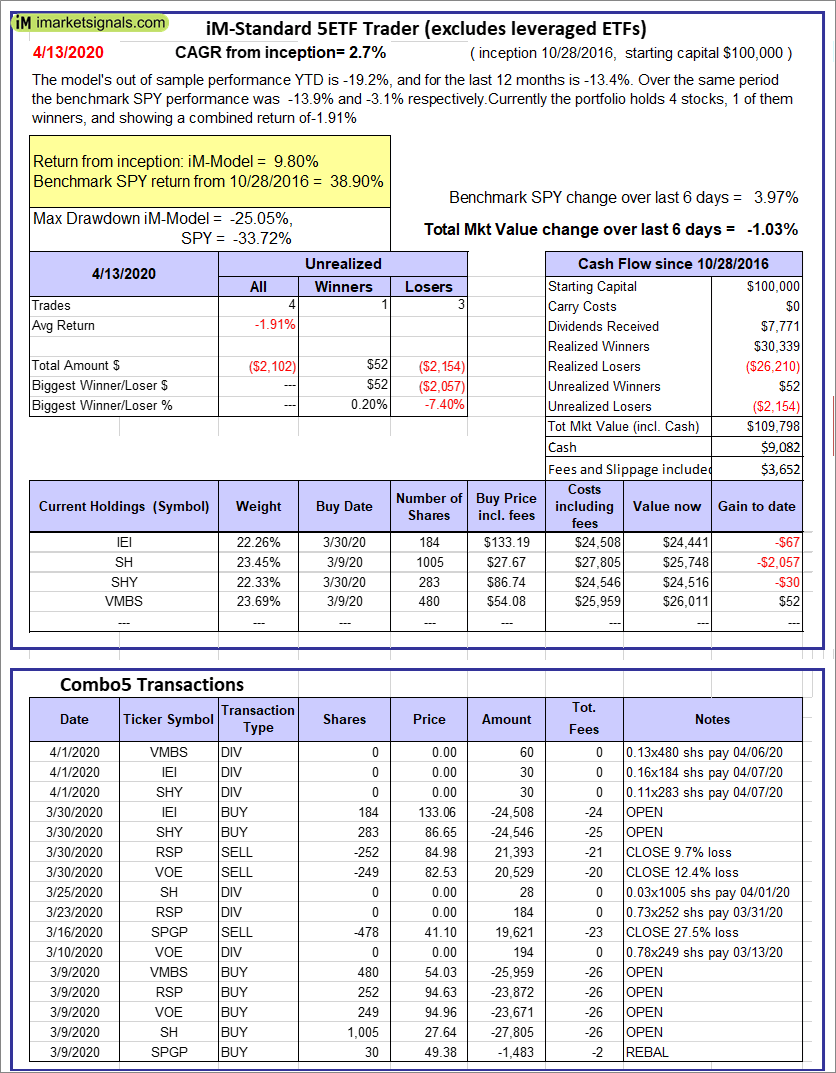 |
iM-Standard 5ETF Trader (excludes leveraged ETFs): The model’s out of sample performance YTD is -19.2%, and for the last 12 months is -13.4%. Over the same period the benchmark SPY performance was -13.9% and -3.1% respectively. Over the previous week the market value of the iM-Standard 5ETF Trader (excludes leveraged ETFs) gained -1.03% at a time when SPY gained 3.97%. A starting capital of $100,000 at inception on 10/30/2016 would have grown to $109,798 which includes $9,082 cash and excludes $3,652 spent on fees and slippage. |
iM-Best Reports – 4/13/2020
Posted in pmp SPY-SH
Leave a Reply
You must be logged in to post a comment.