
  |
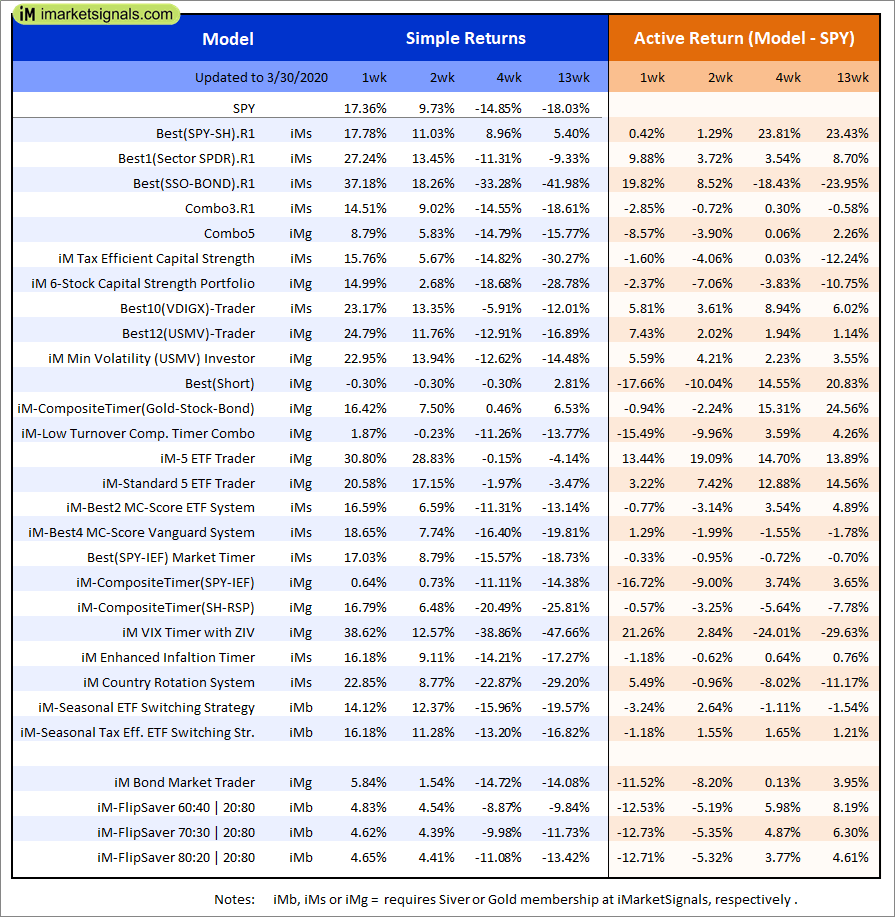
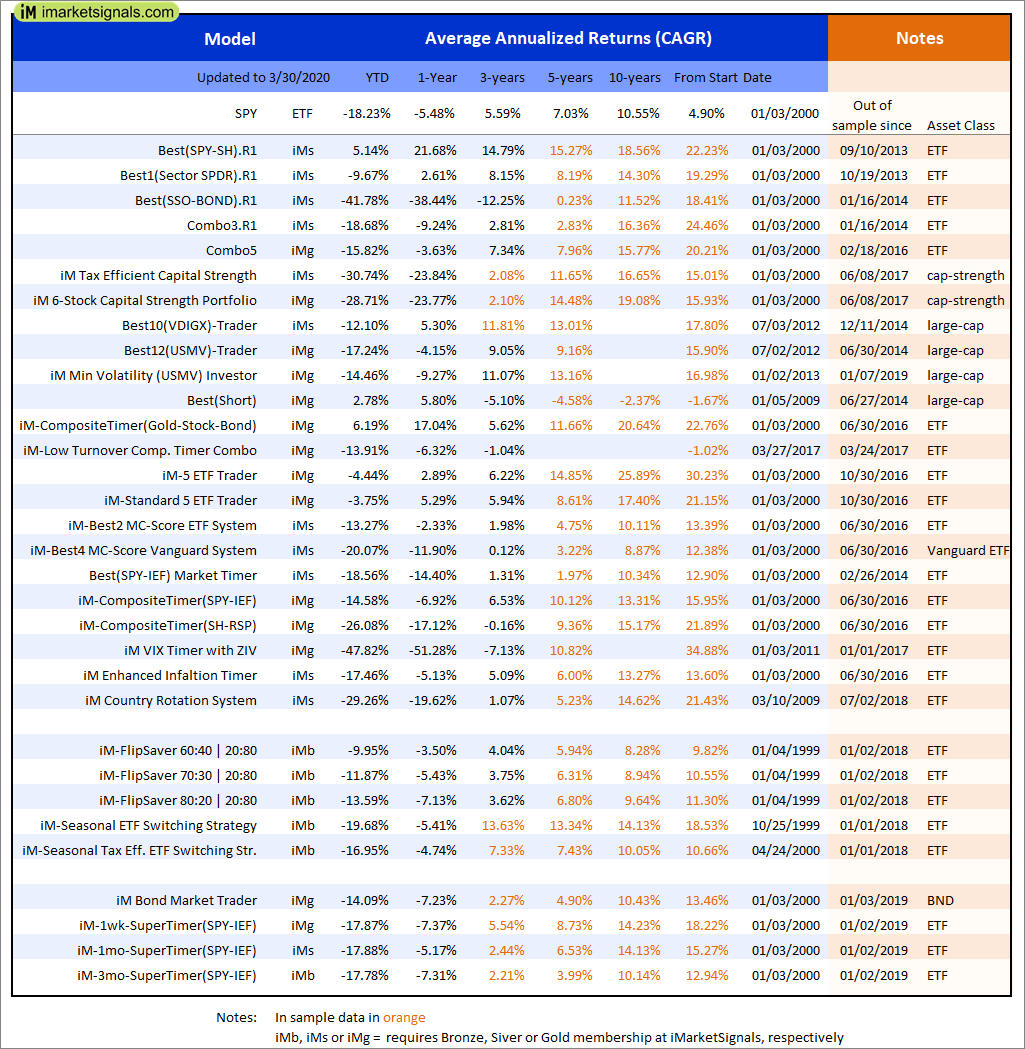
Out of sample performance summary of our models for the past 1, 2, 4 and 13 week periods. The active active return indicates how the models over- or underperformed the benchmark ETF SPY. Also the YTD, and the 1-, 3-, 5- and 10-year annualized returns are shown in the second table |
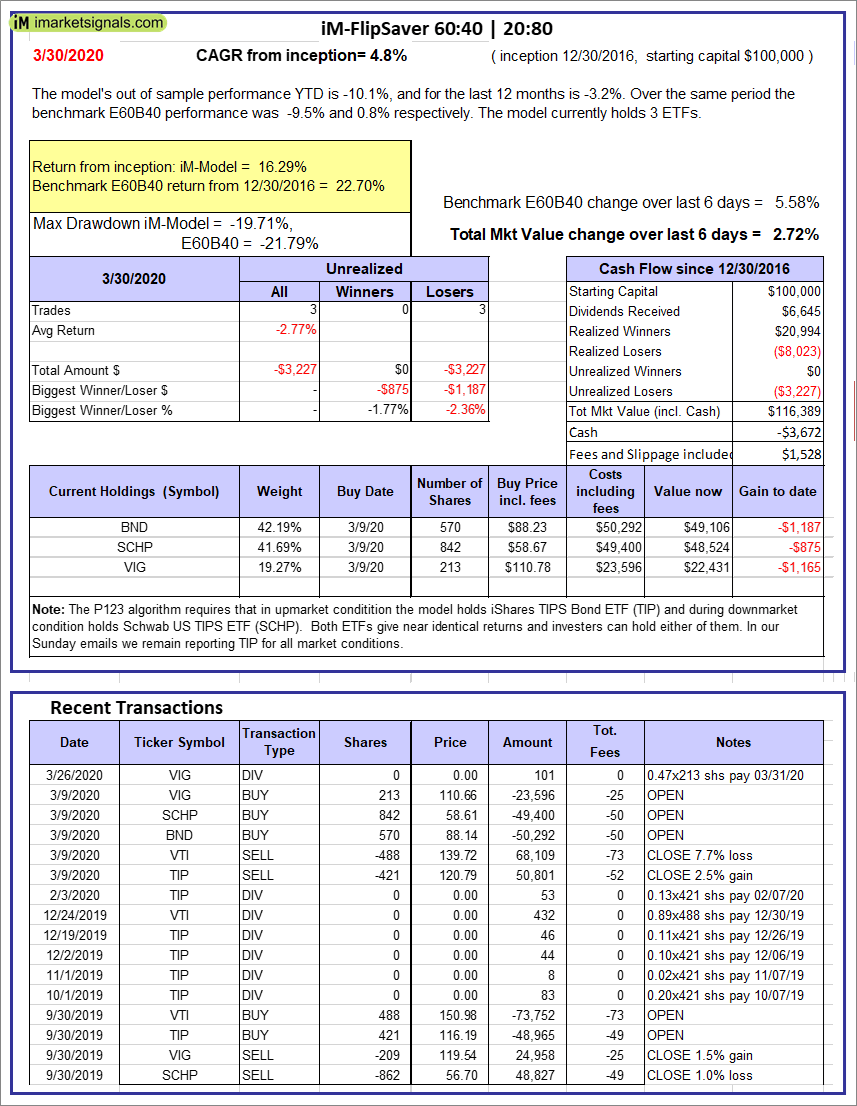 |
iM-FlipSaver 60:40 | 20:80 – 2017: The model’s out of sample performance YTD is -10.1%, and for the last 12 months is -3.2%. Over the same period the benchmark E60B40 performance was -9.5% and 0.8% respectively. Over the previous week the market value of iM-FlipSaver 80:20 | 20:80 gained 2.72% at a time when SPY gained 5.58%. A starting capital of $100,000 at inception on 7/16/2015 would have grown to $116,389 which includes -$3,672 cash and excludes $1,528 spent on fees and slippage. |
 |
iM-FlipSaver 70:30 | 20:80 – 2017: The model’s out of sample performance YTD is -11.9%, and for the last 12 months is -5.0%. Over the same period the benchmark E60B40 performance was -9.5% and 0.8% respectively. Over the previous week the market value of iM-FlipSaver 70:30 | 20:80 gained 2.75% at a time when SPY gained 5.58%. A starting capital of $100,000 at inception on 7/15/2015 would have grown to $116,887 which includes -$4,525 cash and excludes $1,661 spent on fees and slippage. |
 |
iM-FlipSaver 80:20 | 20:80 – 2017: The model’s out of sample performance YTD is -13.6%, and for the last 12 months is -6.8%. Over the same period the benchmark E60B40 performance was -9.5% and 0.8% respectively. Over the previous week the market value of iM-FlipSaver 80:20 | 20:80 gained 2.76% at a time when SPY gained 5.58%. A starting capital of $100,000 at inception on 1/2/2017 would have grown to $117,324 which includes -$5,335 cash and excludes $1,786 spent on fees and slippage. |
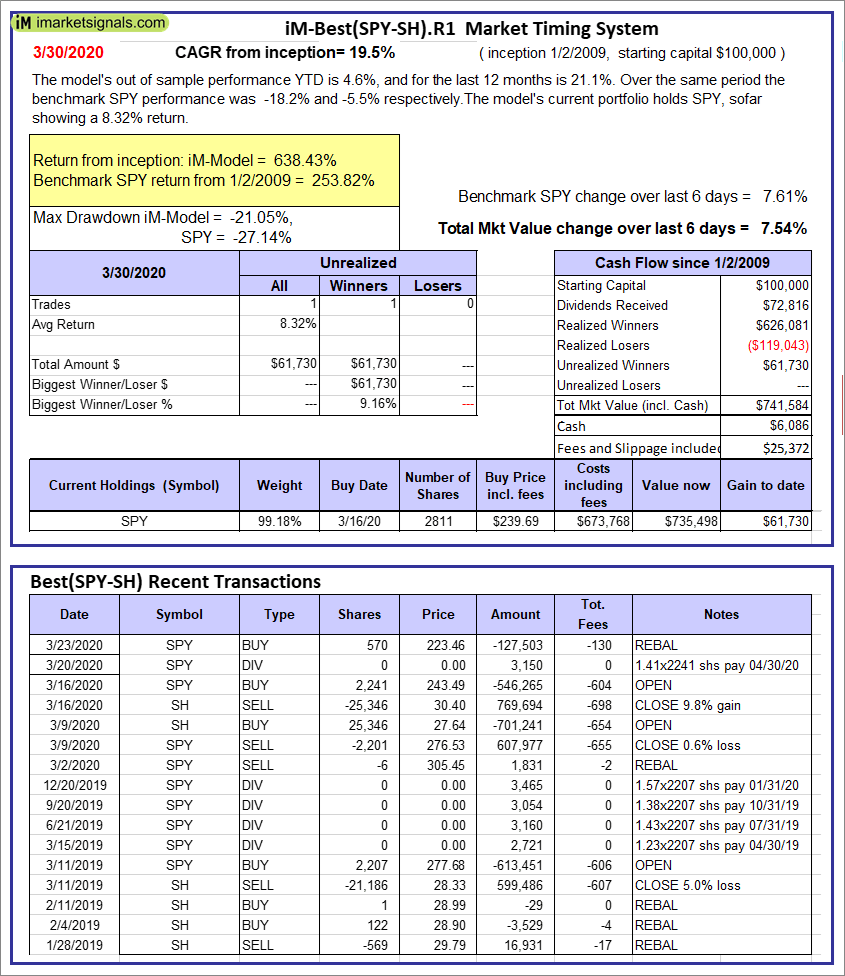 |
iM-Best(SPY-SH).R1: The model’s out of sample performance YTD is 4.6%, and for the last 12 months is 21.1%. Over the same period the benchmark SPY performance was -18.2% and -5.5% respectively. Over the previous week the market value of Best(SPY-SH) gained 7.54% at a time when SPY gained 7.61%. A starting capital of $100,000 at inception on 1/2/2009 would have grown to $741,584 which includes $6,086 cash and excludes $25,372 spent on fees and slippage. |
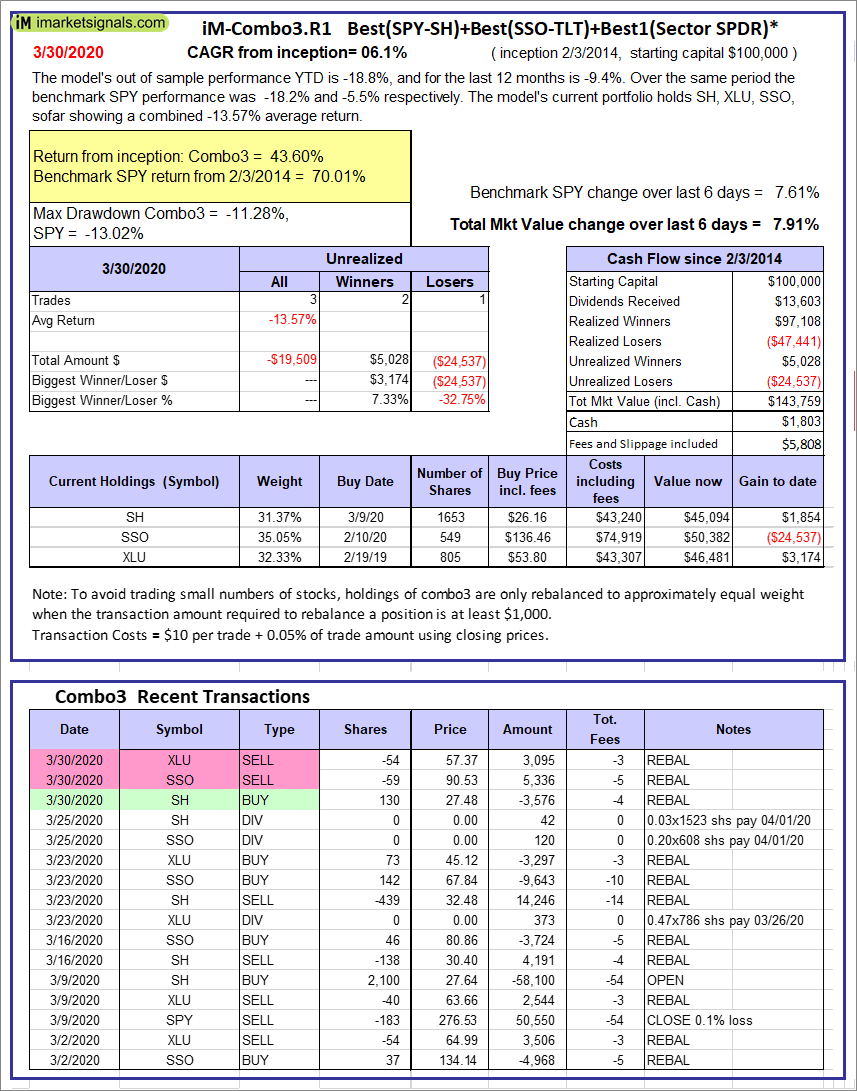 |
iM-Combo3.R1: The model’s out of sample performance YTD is -18.8%, and for the last 12 months is -9.4%. Over the same period the benchmark SPY performance was -18.2% and -5.5% respectively. Over the previous week the market value of iM-Combo3.R1 gained 7.91% at a time when SPY gained 7.61%. A starting capital of $100,000 at inception on 2/3/2014 would have grown to $143,759 which includes $1,803 cash and excludes $5,808 spent on fees and slippage. |
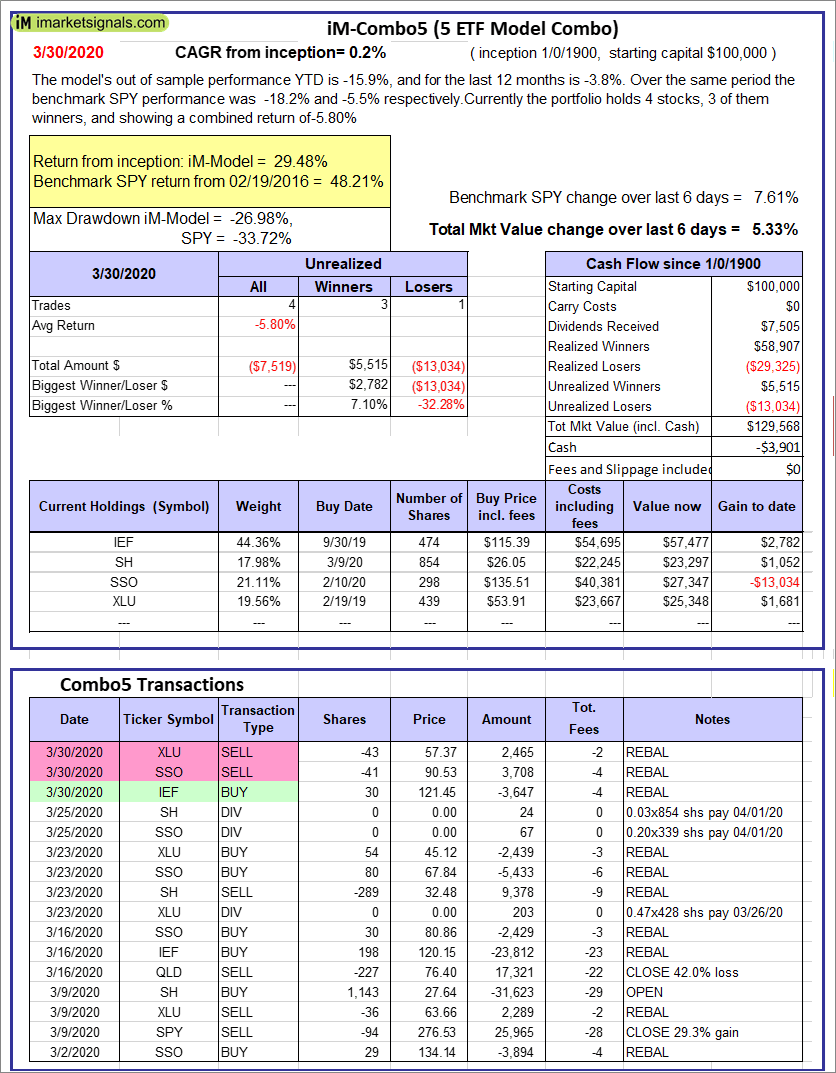 |
iM-Combo5: The model’s out of sample performance YTD is -15.9%, and for the last 12 months is -3.8%. Over the same period the benchmark SPY performance was -18.2% and -5.5% respectively. Over the previous week the market value of iM-Combo5 gained 5.33% at a time when SPY gained 7.61%. A starting capital of $100,000 at inception on 2/22/2016 would have grown to $129,568 which includes -$3,901 cash and excludes $0 spent on fees and slippage. |
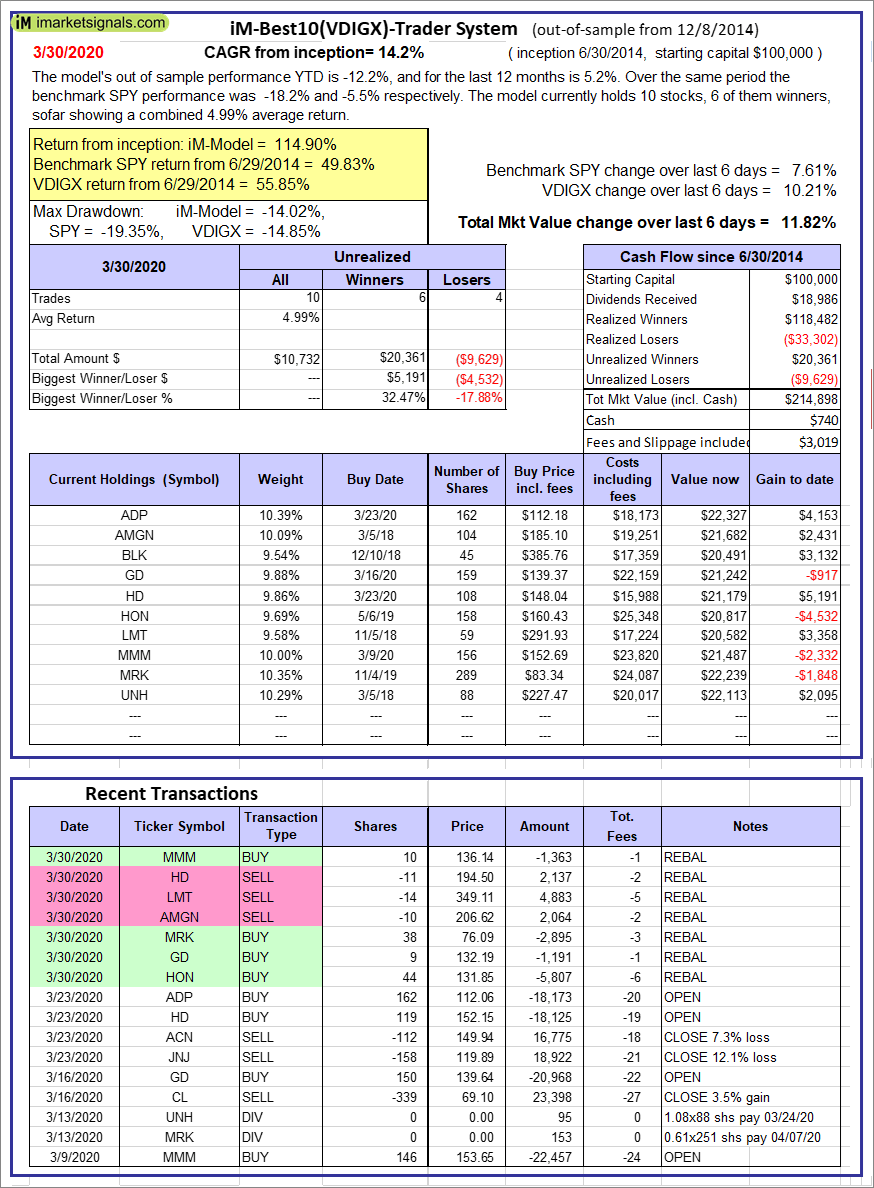  |
iM-Best10(VDIGX)-Trader: The model’s out of sample performance YTD is -12.2%, and for the last 12 months is 5.2%. Over the same period the benchmark SPY performance was -18.2% and -5.5% respectively. Since inception, on 7/1/2014, the model gained 114.90% while the benchmark SPY gained 49.83% and VDIGX gained 55.85% over the same period. Over the previous week the market value of iM-Best10(VDIGX) gained 11.82% at a time when SPY gained 7.61%. A starting capital of $100,000 at inception on 7/1/2014 would have grown to $214,898 which includes $740 cash and excludes $3,019 spent on fees and slippage. |
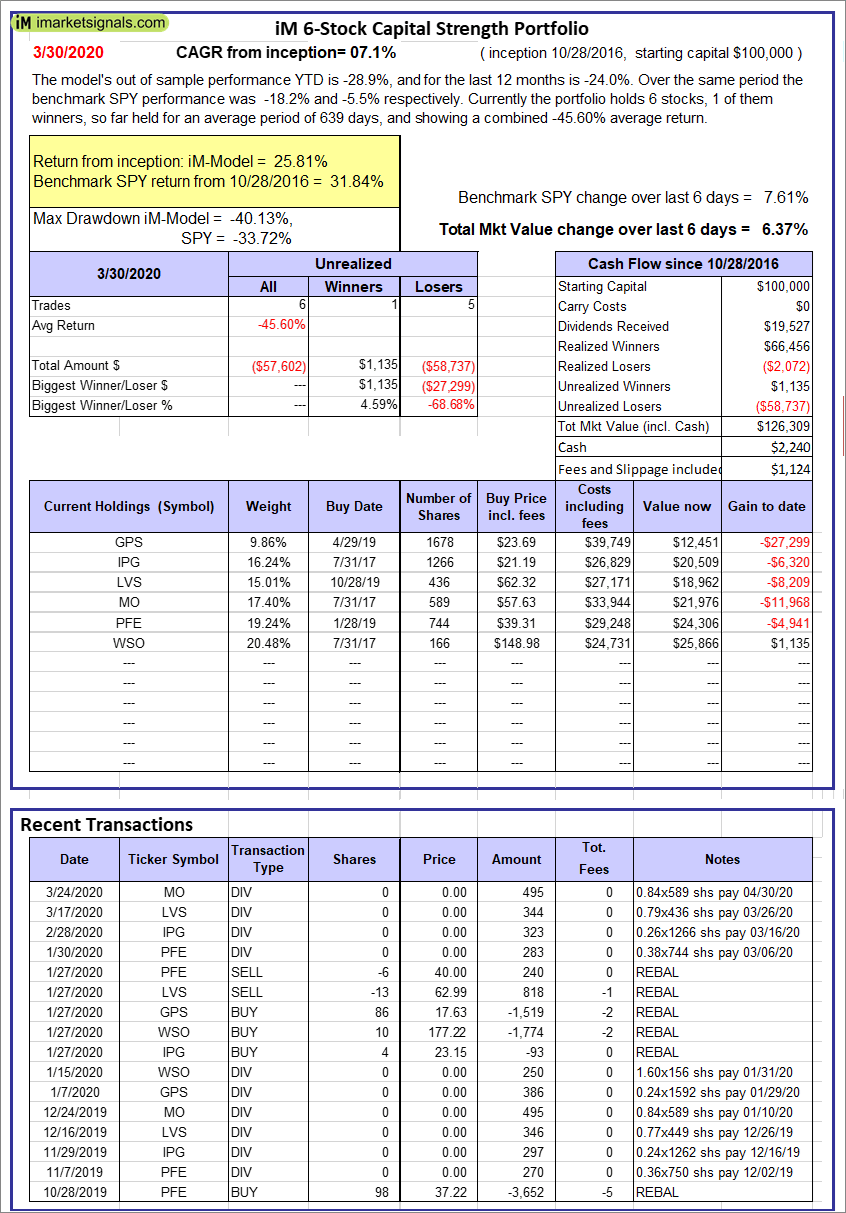 |
iM 6-Stock Capital Strength Portfolio: The model’s out of sample performance YTD is -28.9%, and for the last 12 months is -24.0%. Over the same period the benchmark SPY performance was -18.2% and -5.5% respectively. Over the previous week the market value of the iM 6-Stock Capital Strength Portfolio gained 6.37% at a time when SPY gained 7.61%. A starting capital of $100,000 at inception on 10/28/2016 would have grown to $126,309 which includes $2,240 cash and excludes $1,124 spent on fees and slippage. |
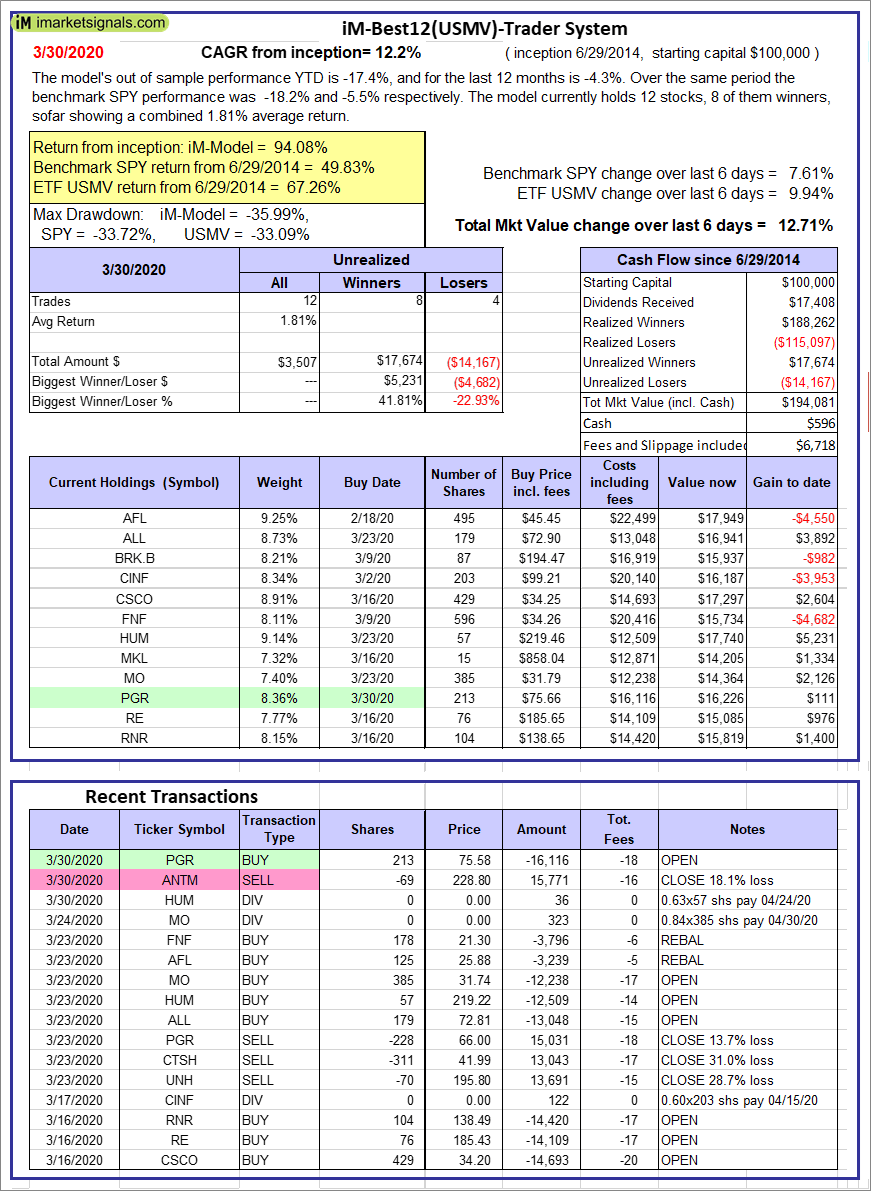 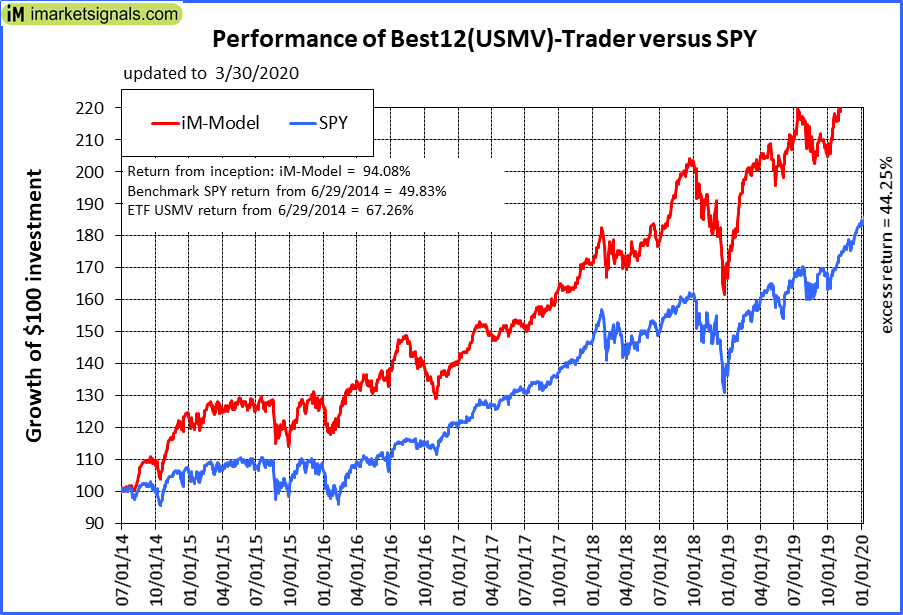 |
iM-Best12(USMV)-Trader: The model’s out of sample performance YTD is -17.4%, and for the last 12 months is -4.3%. Over the same period the benchmark SPY performance was -18.2% and -5.5% respectively. Since inception, on 6/30/2014, the model gained 94.08% while the benchmark SPY gained 49.83% and the ETF USMV gained 67.26% over the same period. Over the previous week the market value of iM-Best12(USMV)-Trader gained 12.71% at a time when SPY gained 7.61%. A starting capital of $100,000 at inception on 6/30/2014 would have grown to $194,081 which includes $596 cash and excludes $6,718 spent on fees and slippage. |
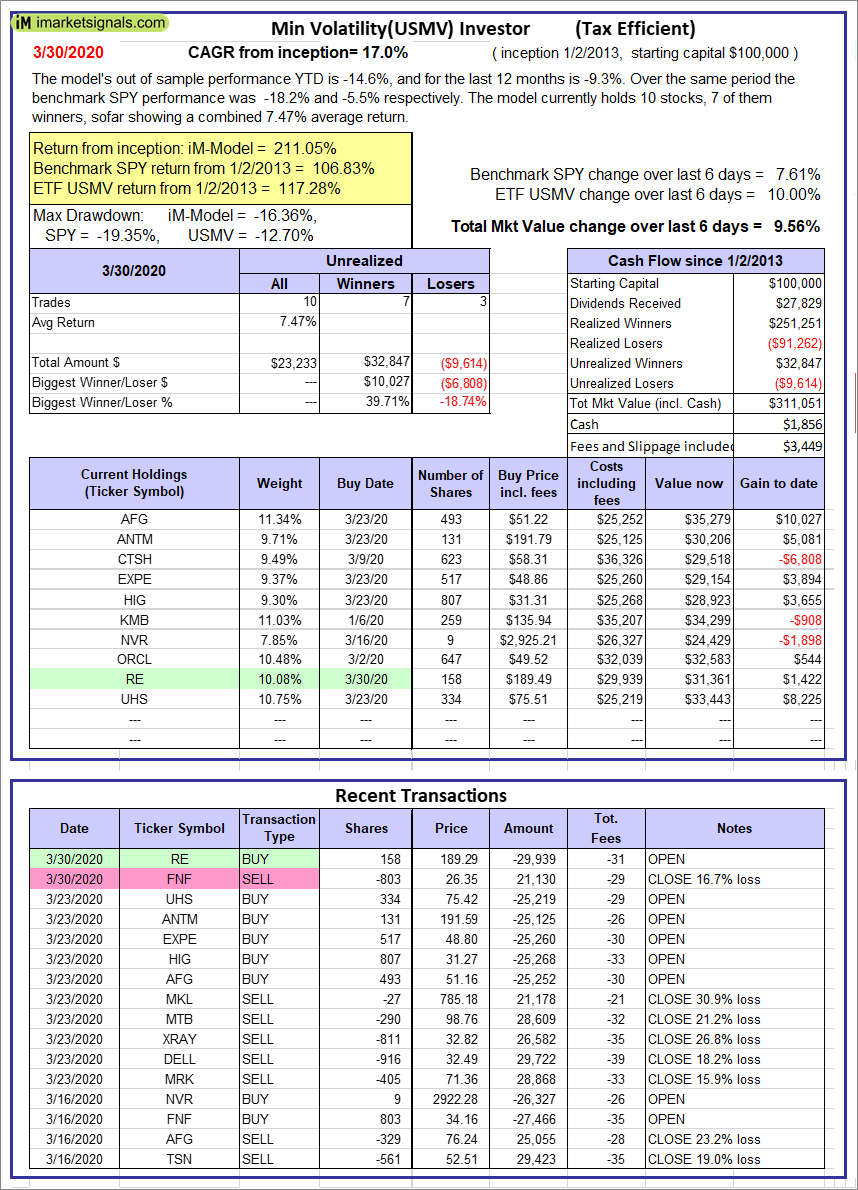 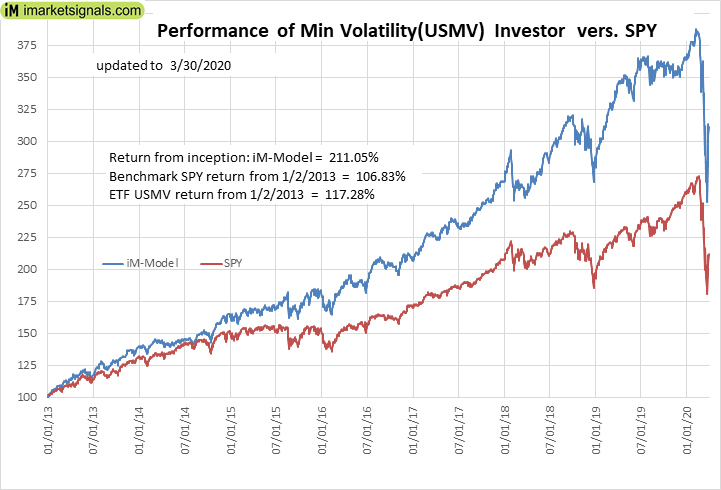 |
iM-Min Volatility(USMV) Investor (Tax Efficient): The model’s out of sample performance YTD is -14.6%, and for the last 12 months is -9.3%. Over the same period the benchmark SPY performance was -18.2% and -5.5% respectively. Since inception, on 1/3/2013, the model gained 211.05% while the benchmark SPY gained 106.83% and the ETF USMV gained 117.28% over the same period. Over the previous week the market value of iM-Best12(USMV)Q1 gained 9.56% at a time when SPY gained 7.61%. A starting capital of $100,000 at inception on 1/3/2013 would have grown to $311,051 which includes $1,856 cash and excludes $3,449 spent on fees and slippage. |
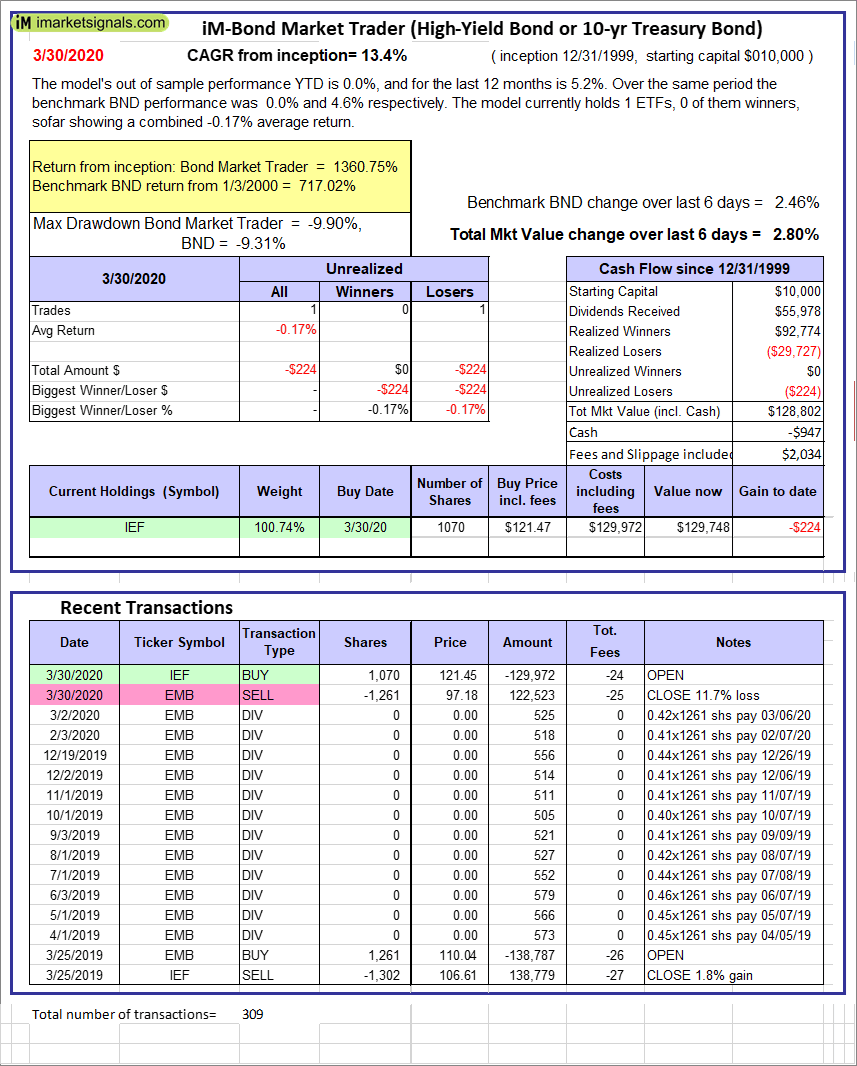 |
iM-Bond Market Trader (High-Yield Bond or 10-yr Treasury Bond): The model’s out of sample performance YTD is -28.3%, and for the last 12 months is -23.1%. Over the same period the benchmark SPY performance was -18.2% and -5.5% respectively. Over the previous week the market value of the iM-Bond Market Trader (High-Yield Bond or 10-yr Treasury Bond) gained 2.80% at a time when BND gained 2.46%. A starting capital of $100,000 at inception on 10/30/2016 would have grown to $128,802 which includes -$947 cash and excludes $2,034 spent on fees and slippage. |
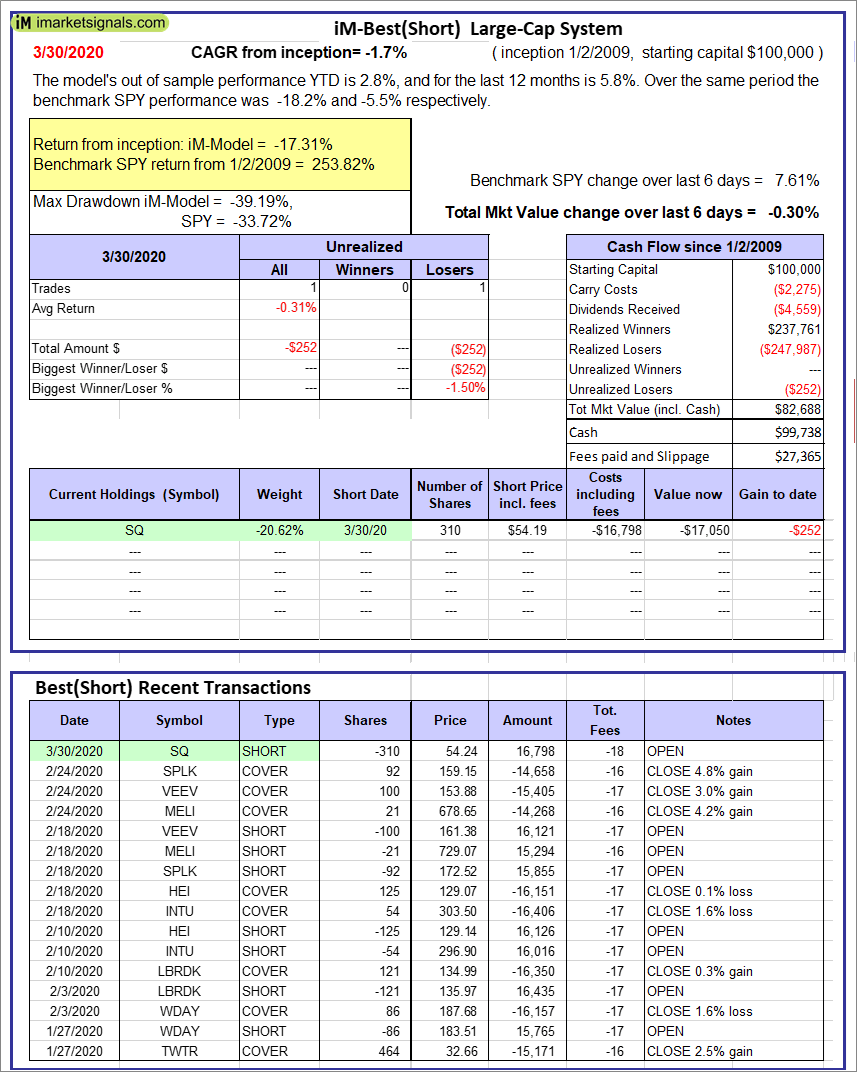 |
iM-Best(Short): The model’s out of sample performance YTD is 2.8%, and for the last 12 months is 5.8%. Over the same period the benchmark SPY performance was -18.2% and -5.5% respectively. Over the previous week the market value of iM-Best(Short) gained -0.30% at a time when SPY gained 7.61%. Over the period 1/2/2009 to 3/30/2020 the starting capital of $100,000 would have grown to $82,688 which includes $99,738 cash and excludes $27,365 spent on fees and slippage. |
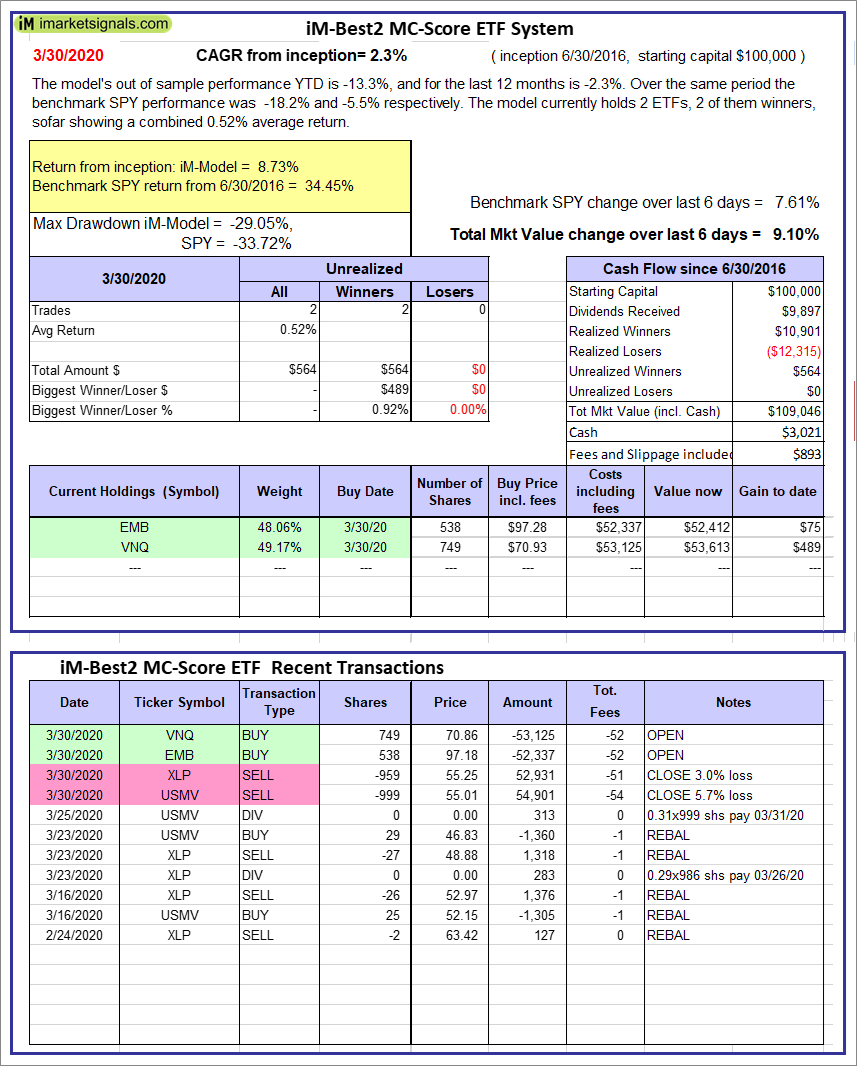 |
iM-Best2 MC-Score ETF System: The model’s out of sample performance YTD is -13.3%, and for the last 12 months is -2.3%. Over the same period the benchmark SPY performance was -18.2% and -5.5% respectively. Over the previous week the market value of the iM-Best2 MC-Score ETF System gained 9.10% at a time when SPY gained 7.61%. A starting capital of $100,000 at inception on 6/30/2016 would have grown to $109,046 which includes $3,021 cash and excludes $893 spent on fees and slippage. |
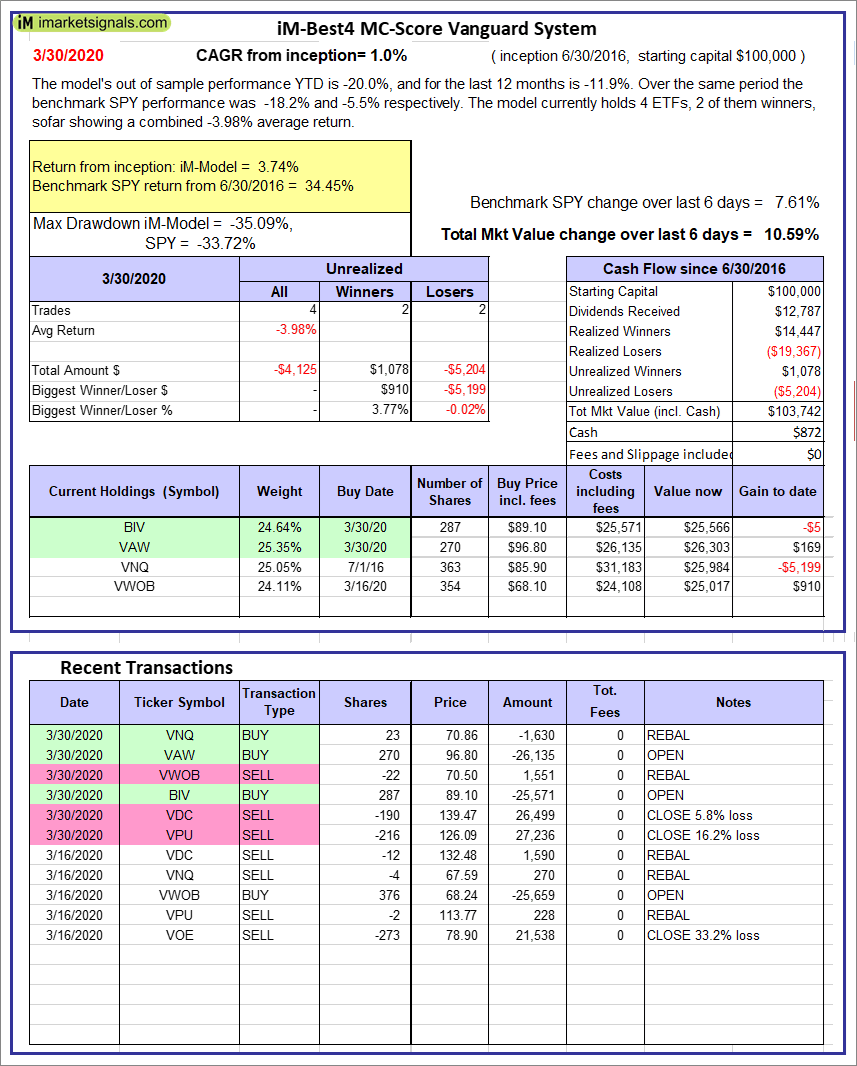 |
iM-Best4 MC-Score Vanguard System: The model’s out of sample performance YTD is -20.0%, and for the last 12 months is -11.9%. Over the same period the benchmark SPY performance was -18.2% and -5.5% respectively. Over the previous week the market value of the iM-Best4 MC-Score Vanguard System gained 10.59% at a time when SPY gained 7.61%. A starting capital of $100,000 at inception on 6/30/2016 would have grown to $103,742 which includes $872 cash and excludes $00 spent on fees and slippage. |
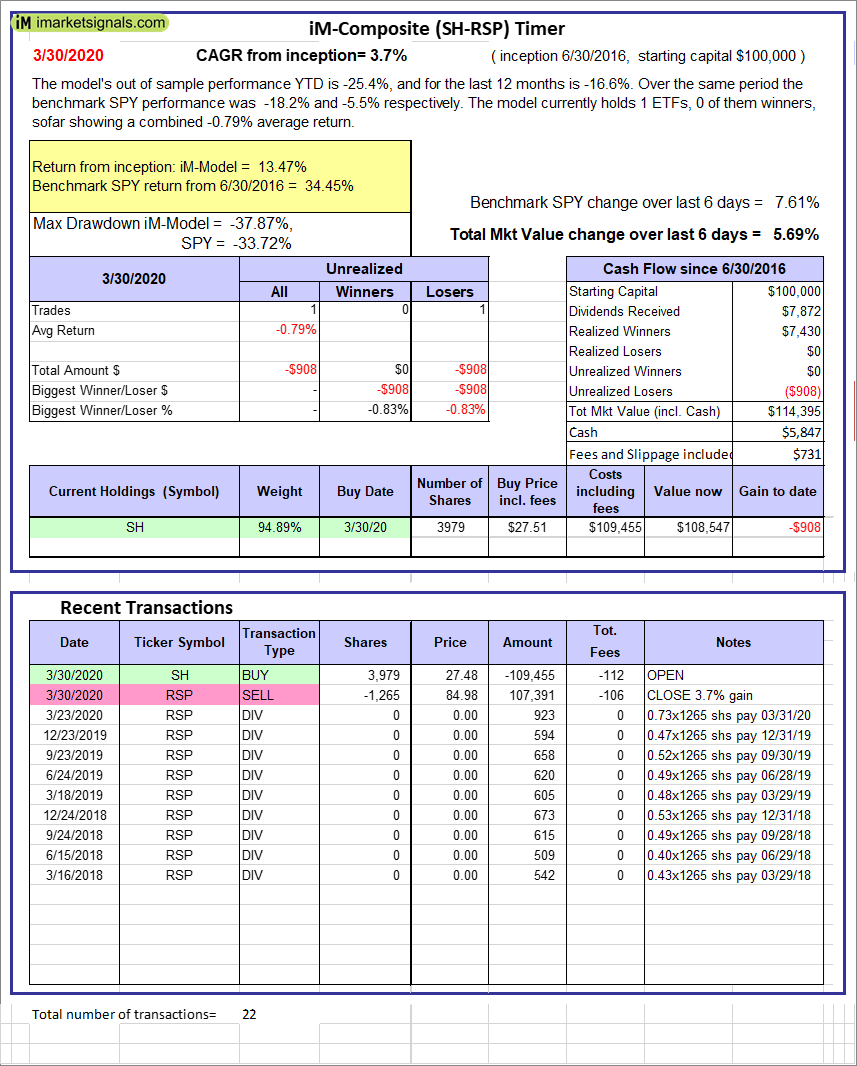 |
iM-Composite (SH-RSP) Timer: The model’s out of sample performance YTD is -25.4%, and for the last 12 months is -16.6%. Over the same period the benchmark SPY performance was -18.2% and -5.5% respectively. Over the previous week the market value of the iM-Composite (SH-RSP) Timer gained 5.69% at a time when SPY gained 7.61%. A starting capital of $100,000 at inception on 6/30/2016 would have grown to $114,395 which includes $5,847 cash and excludes $731 spent on fees and slippage. |
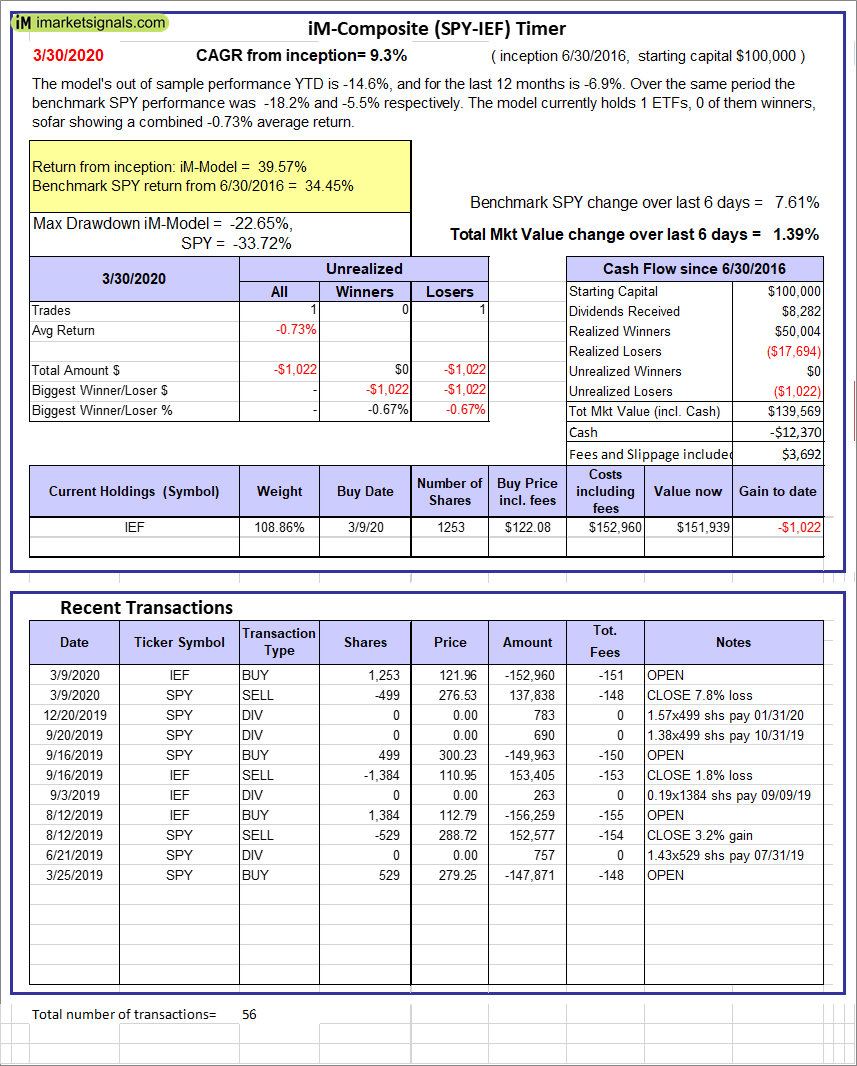 |
iM-Composite (SPY-IEF) Timer: The model’s out of sample performance YTD is -14.6%, and for the last 12 months is -6.9%. Over the same period the benchmark SPY performance was -18.2% and -5.5% respectively. Over the previous week the market value of the iM-Composite (SPY-IEF) Timer gained 1.39% at a time when SPY gained 7.61%. A starting capital of $100,000 at inception on 6/30/2016 would have grown to $139,569 which includes -$12,370 cash and excludes $3,692 spent on fees and slippage. |
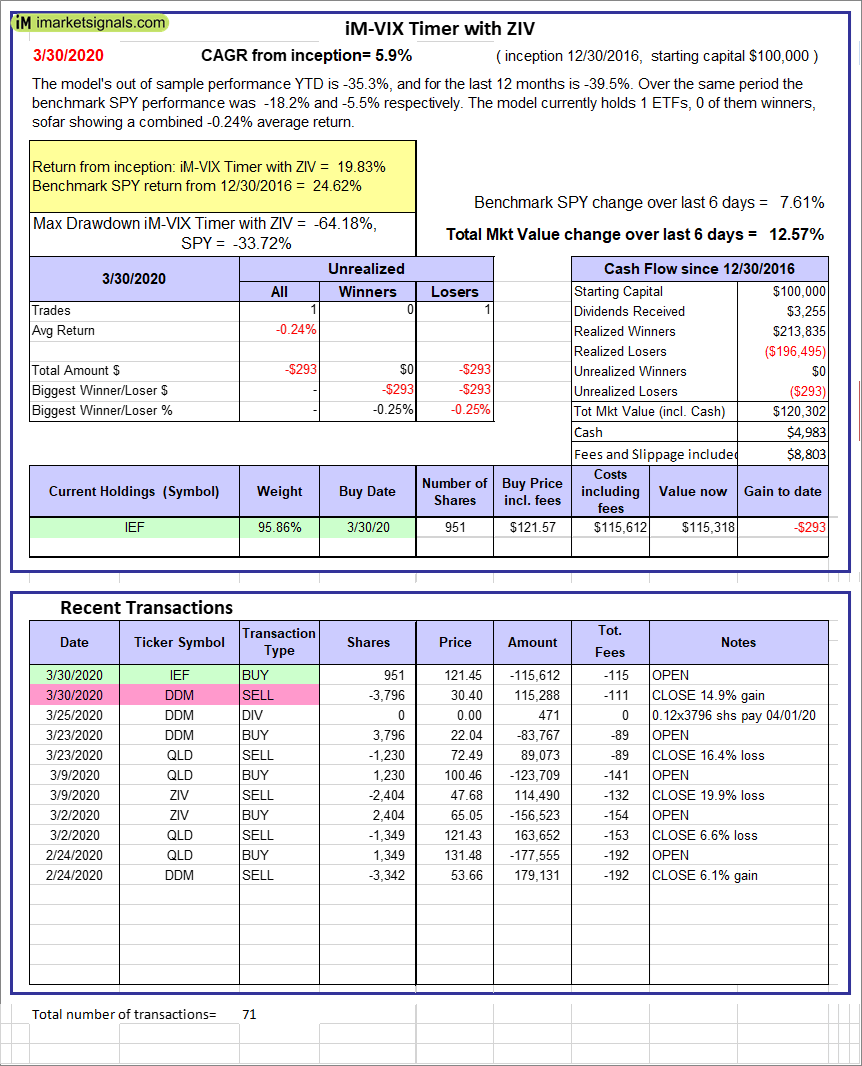 |
iM-VIX Timer with ZIV: The model’s out of sample performance YTD is -35.3%, and for the last 12 months is -39.5%. Over the same period the benchmark SPY performance was -18.2% and -5.5% respectively. Over the previous week the market value of the iM-VIX Timer with ZIV gained 12.57% at a time when SPY gained 7.61%. A starting capital of $100,000 at inception on 6/30/2016 would have grown to $120,302 which includes $4,983 cash and excludes $8,803 spent on fees and slippage. |
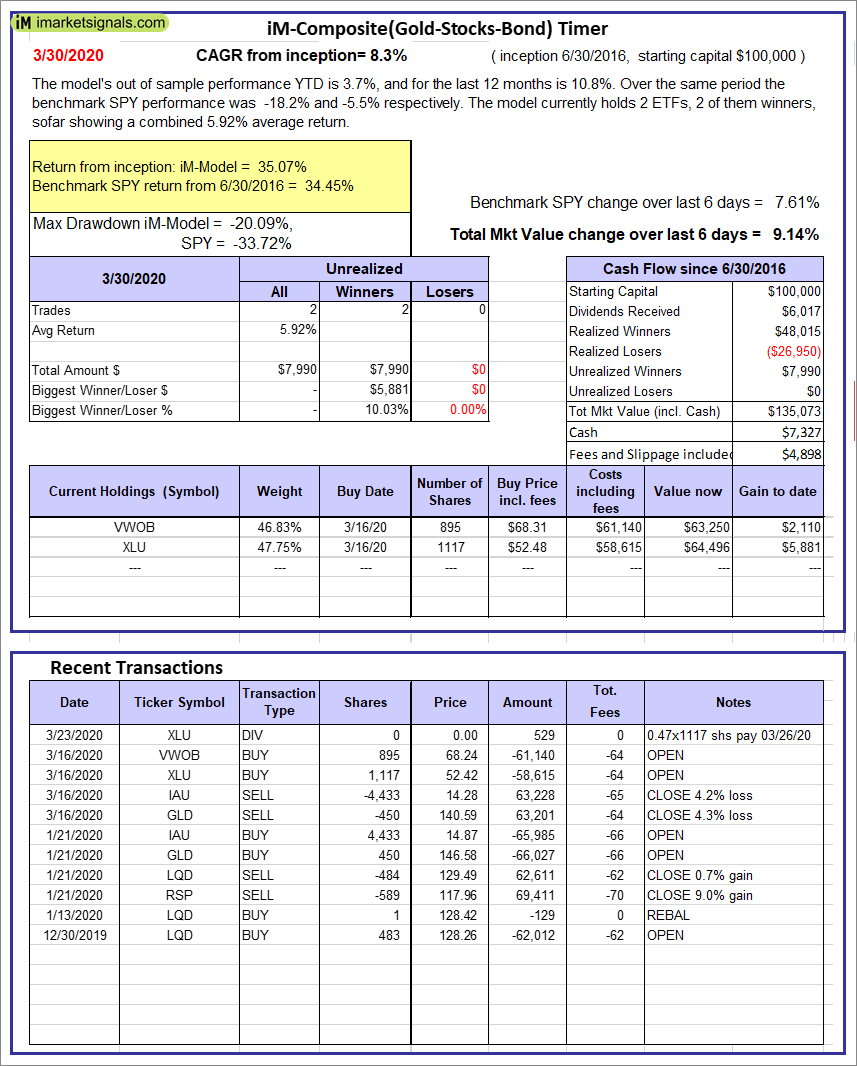 |
iM-Composite(Gold-Stocks-Bond) Timer: The model’s out of sample performance YTD is 3.7%, and for the last 12 months is 10.8%. Over the same period the benchmark SPY performance was -18.2% and -5.5% respectively. Over the previous week the market value of the iM-Composite(Gold-Stocks-Bond) Timer gained 9.14% at a time when SPY gained 7.61%. A starting capital of $100,000 at inception on 6/30/2016 would have grown to $135,073 which includes $7,327 cash and excludes $4,898 spent on fees and slippage. |
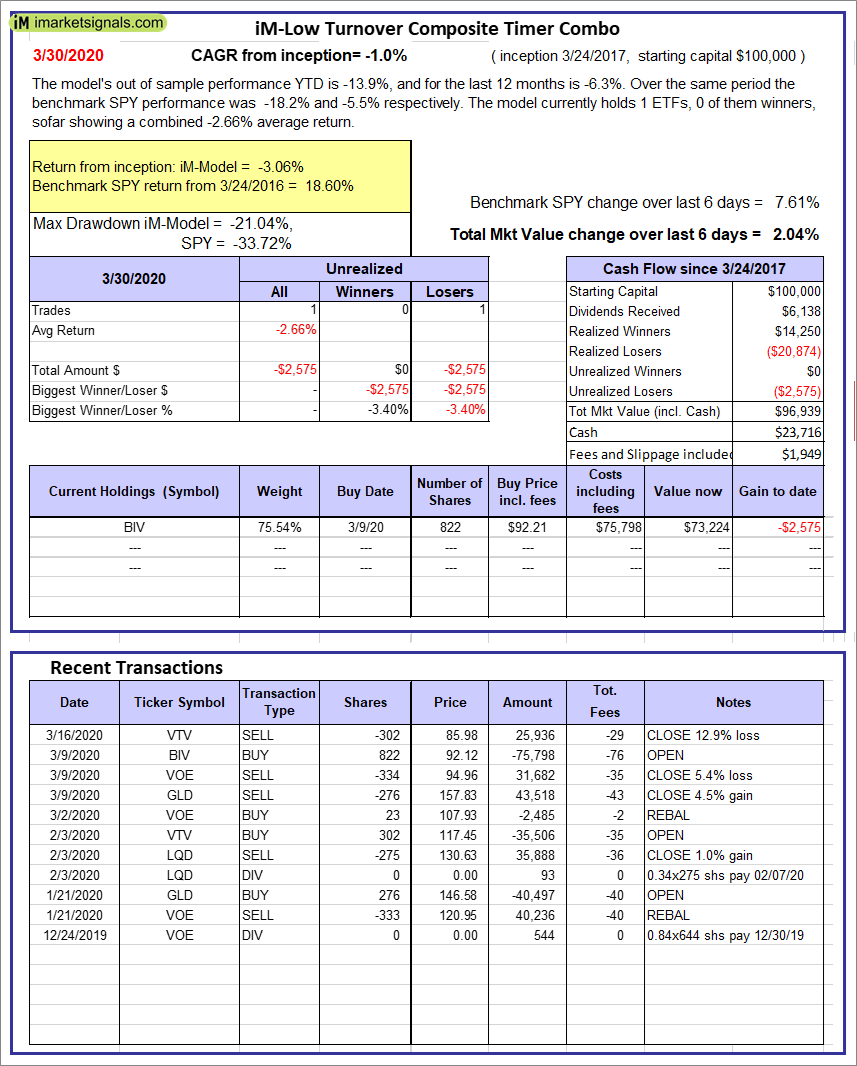 |
iM-Low Turnover Composite Timer Combo: The model’s out of sample performance YTD is -13.9%, and for the last 12 months is -6.3%. Over the same period the benchmark SPY performance was -18.2% and -5.5% respectively. Over the previous week the market value of the iM-Low Turnover Composite Timer Combo gained 2.04% at a time when SPY gained 7.61%. A starting capital of $100,000 at inception on 3/24/27 would have grown to $96,939 which includes $23,716 cash and excludes $1,949 spent on fees and slippage. |
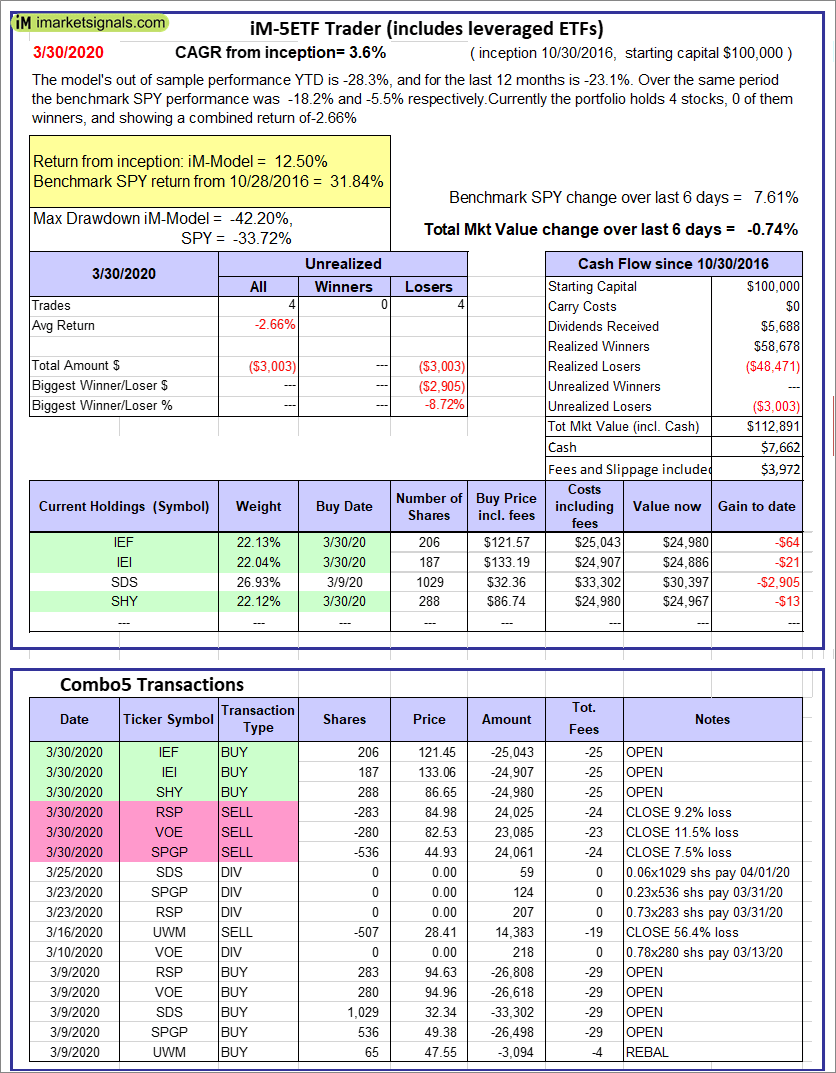 |
iM-5ETF Trader (includes leveraged ETFs): The model’s out of sample performance YTD is -28.3%, and for the last 12 months is -23.1%. Over the same period the benchmark SPY performance was -18.2% and -5.5% respectively. Over the previous week the market value of the iM-5ETF Trader (includes leveraged ETFs) gained -0.74% at a time when SPY gained 7.61%. A starting capital of $100,000 at inception on 10/30/2016 would have grown to $112,891 which includes $7,662 cash and excludes $3,972 spent on fees and slippage. |
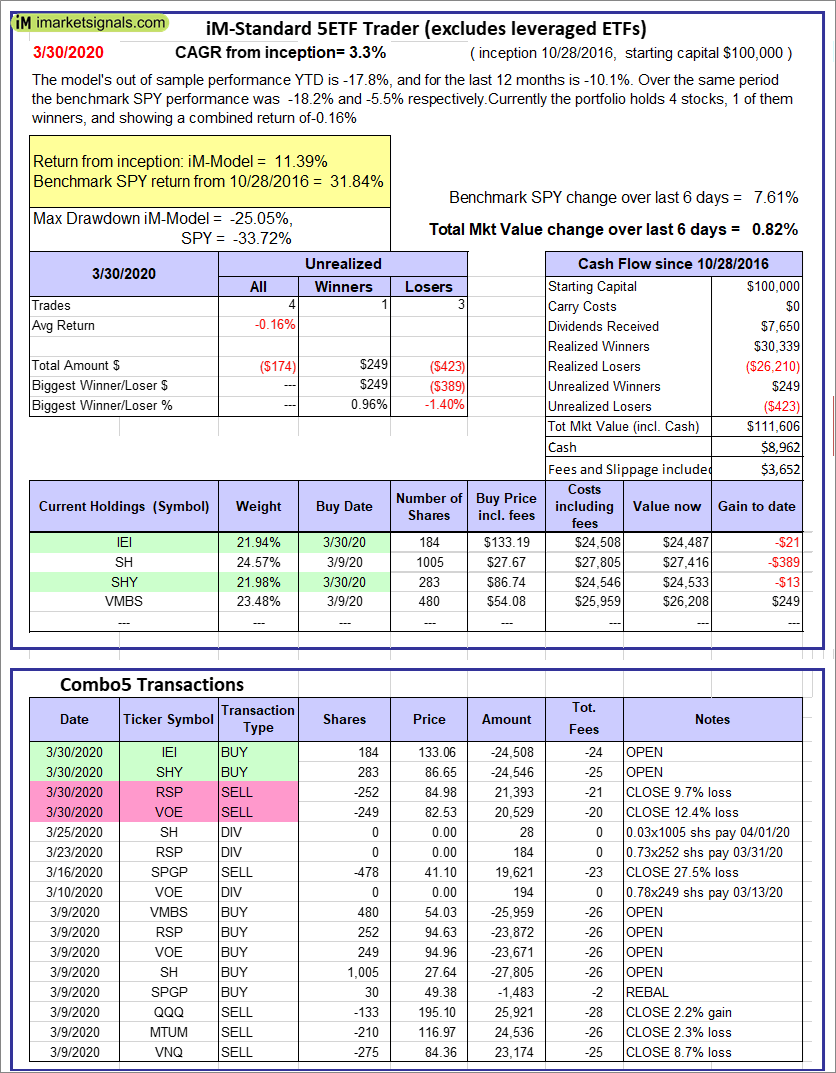 |
iM-Standard 5ETF Trader (excludes leveraged ETFs): The model’s out of sample performance YTD is -17.8%, and for the last 12 months is -10.1%. Over the same period the benchmark SPY performance was -18.2% and -5.5% respectively. Over the previous week the market value of the iM-Standard 5ETF Trader (excludes leveraged ETFs) gained 0.82% at a time when SPY gained 7.61%. A starting capital of $100,000 at inception on 10/30/2016 would have grown to $111,606 which includes $8,962 cash and excludes $3,652 spent on fees and slippage. |
iM-Best Reports – 3/30/2020
Posted in pmp SPY-SH
Leave a Reply
You must be logged in to post a comment.