
  |
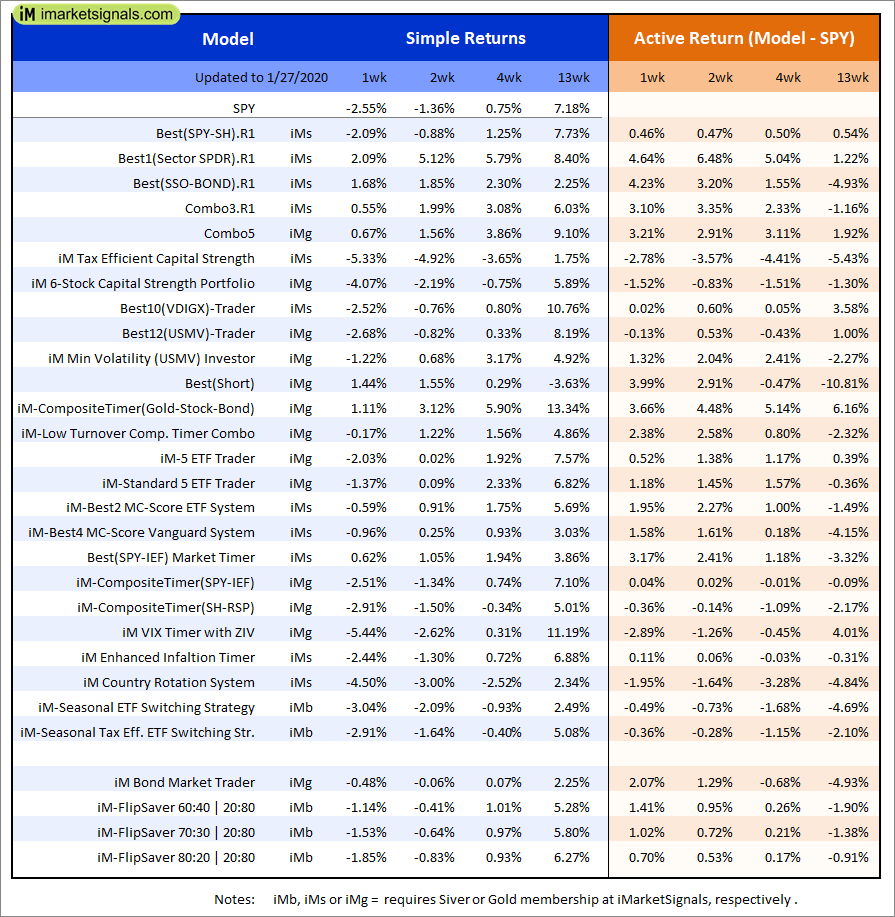
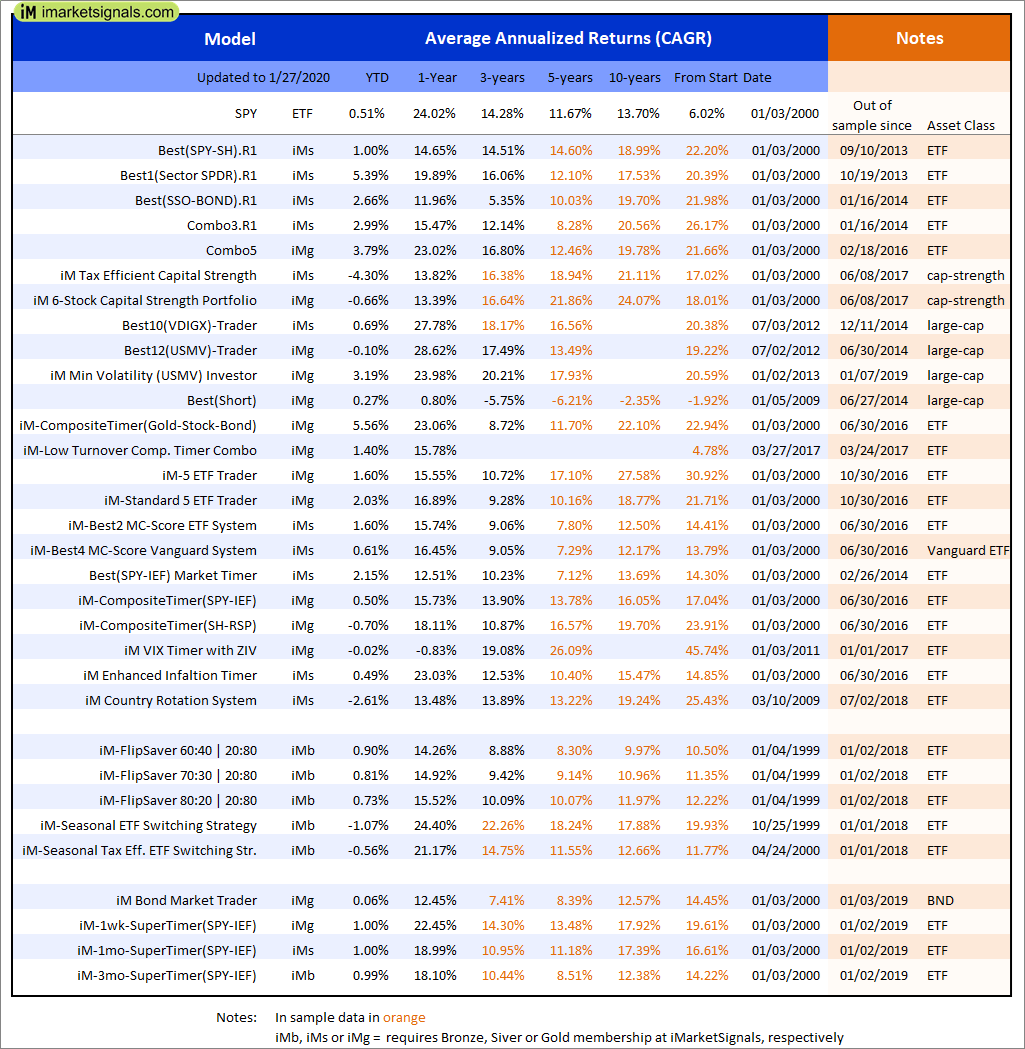
Out of sample performance summary of our models for the past 1, 2, 4 and 13 week periods. The active active return indicates how the models over- or underperformed the benchmark ETF SPY. Also the YTD, and the 1-, 3-, 5- and 10-year annualized returns are shown in the second table |
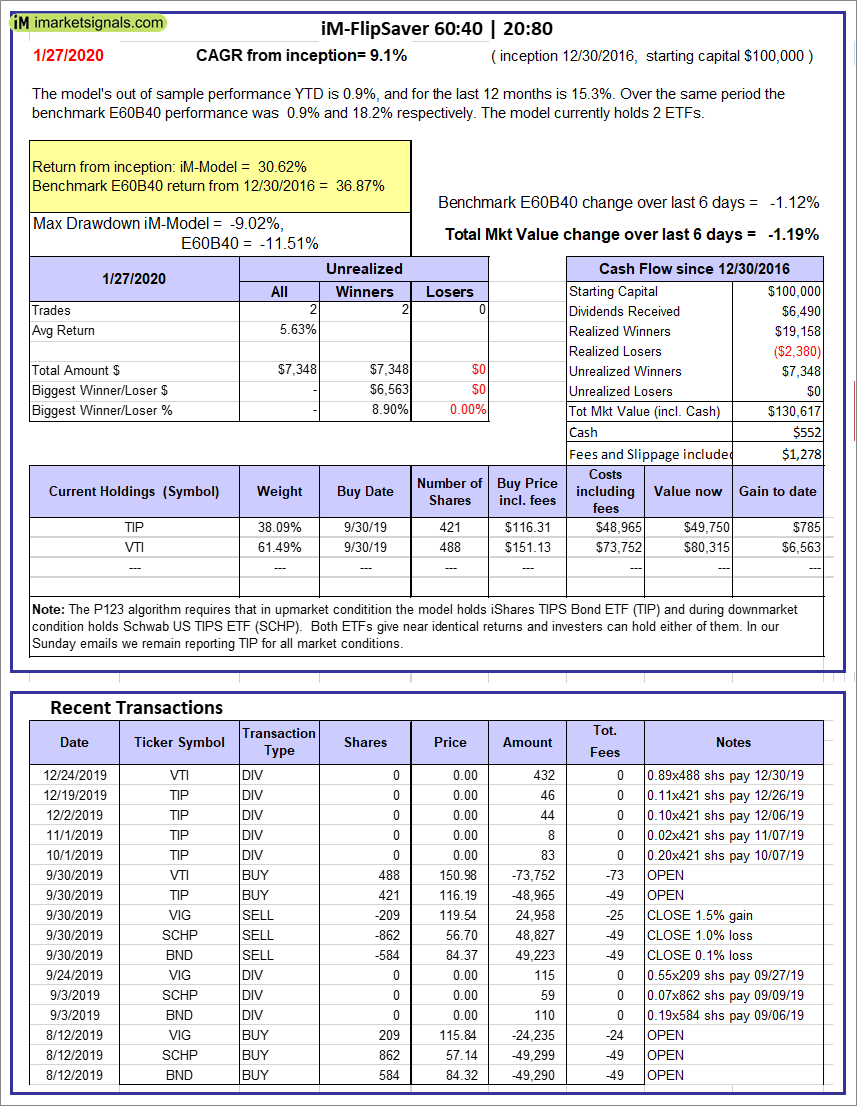 |
iM-FlipSaver 60:40 | 20:80 – 2017: The model’s out of sample performance YTD is 0.9%, and for the last 12 months is 15.3%. Over the same period the benchmark E60B40 performance was 0.9% and 18.2% respectively. Over the previous week the market value of iM-FlipSaver 80:20 | 20:80 gained -1.19% at a time when SPY gained -1.12%. A starting capital of $100,000 at inception on 7/16/2015 would have grown to $130,617 which includes $552 cash and excludes $1,278 spent on fees and slippage. |
 |
iM-FlipSaver 70:30 | 20:80 – 2017: The model’s out of sample performance YTD is 0.8%, and for the last 12 months is 15.9%. Over the same period the benchmark E60B40 performance was 0.9% and 18.2% respectively. Over the previous week the market value of iM-FlipSaver 70:30 | 20:80 gained -1.47% at a time when SPY gained -1.12%. A starting capital of $100,000 at inception on 7/15/2015 would have grown to $133,690 which includes $466 cash and excludes $1,408 spent on fees and slippage. |
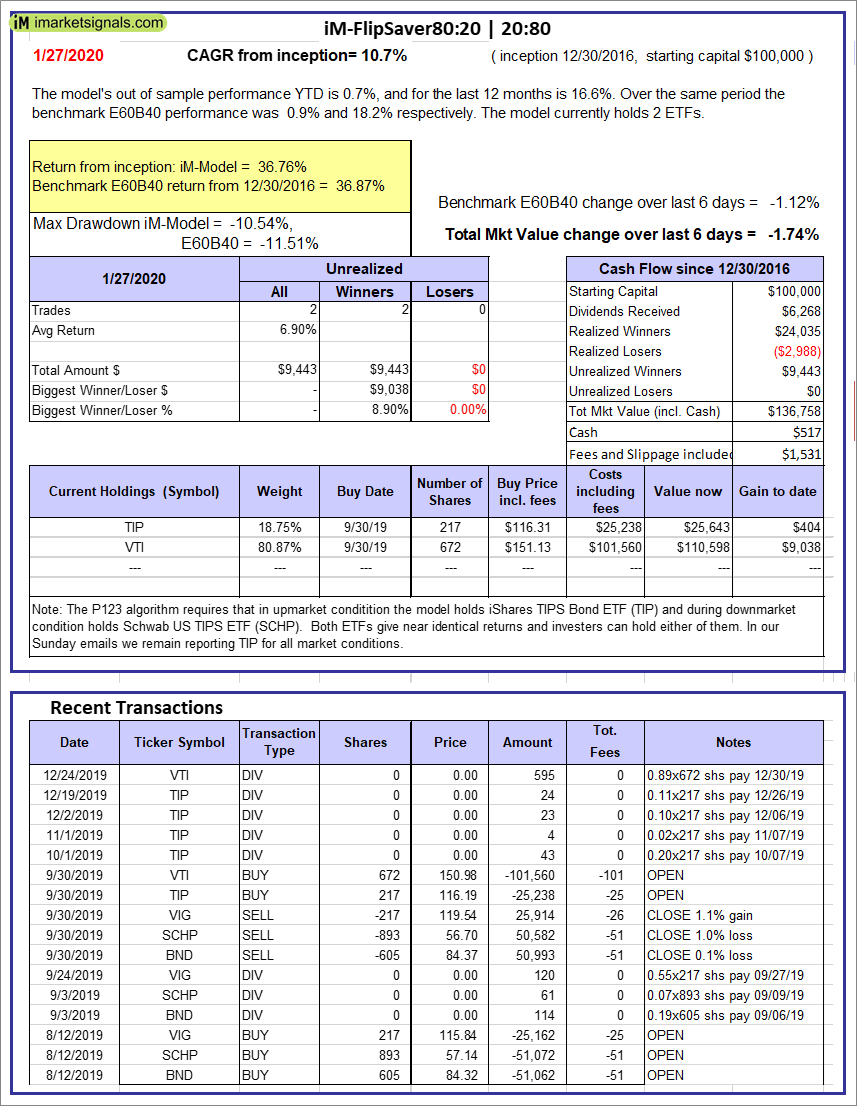 |
iM-FlipSaver 80:20 | 20:80 – 2017: The model’s out of sample performance YTD is 0.7%, and for the last 12 months is 16.6%. Over the same period the benchmark E60B40 performance was 0.9% and 18.2% respectively. Over the previous week the market value of iM-FlipSaver 80:20 | 20:80 gained -1.74% at a time when SPY gained -1.12%. A starting capital of $100,000 at inception on 1/2/2017 would have grown to $136,758 which includes $517 cash and excludes $1,531 spent on fees and slippage. |
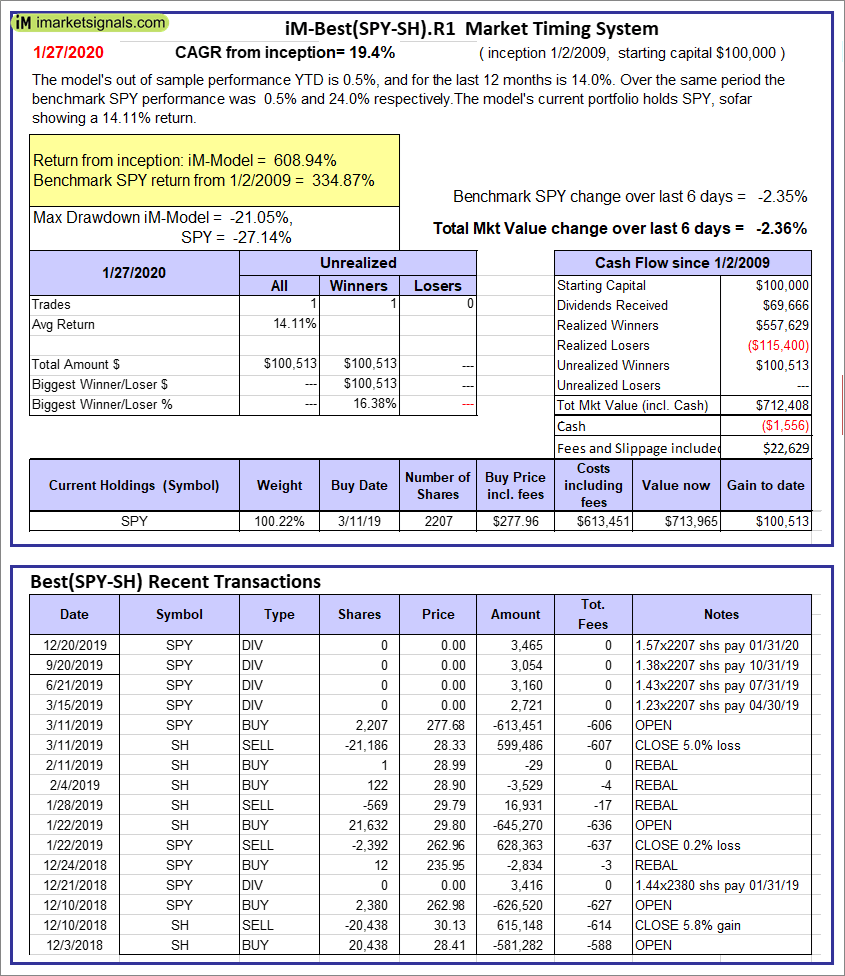 |
iM-Best(SPY-SH).R1: The model’s out of sample performance YTD is 0.5%, and for the last 12 months is 14.0%. Over the same period the benchmark SPY performance was 0.5% and 24.0% respectively. Over the previous week the market value of Best(SPY-SH) gained -2.36% at a time when SPY gained -2.35%. A starting capital of $100,000 at inception on 1/2/2009 would have grown to $712,408 which includes -$1,556 cash and excludes $22,629 spent on fees and slippage. |
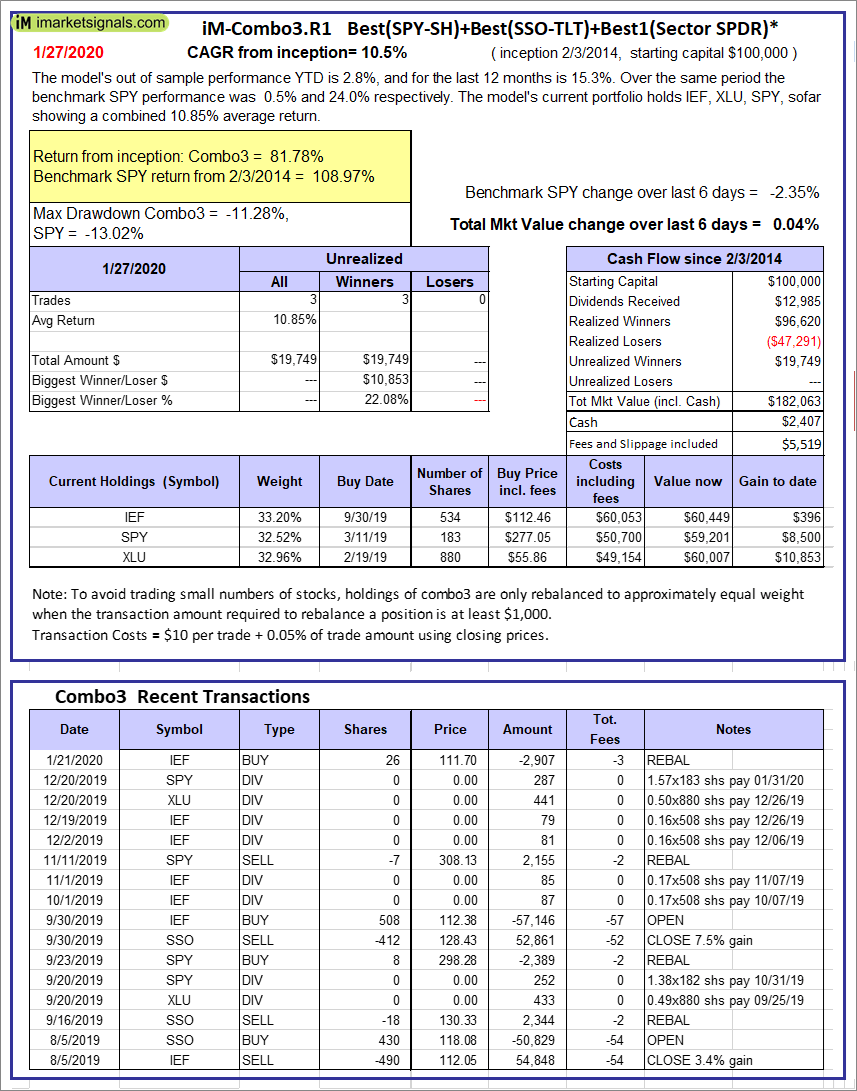 |
iM-Combo3.R1: The model’s out of sample performance YTD is 2.8%, and for the last 12 months is 15.3%. Over the same period the benchmark SPY performance was 0.5% and 24.0% respectively. Over the previous week the market value of iM-Combo3.R1 gained 0.04% at a time when SPY gained -2.35%. A starting capital of $100,000 at inception on 2/3/2014 would have grown to $182,063 which includes $2,407 cash and excludes $5,519 spent on fees and slippage. |
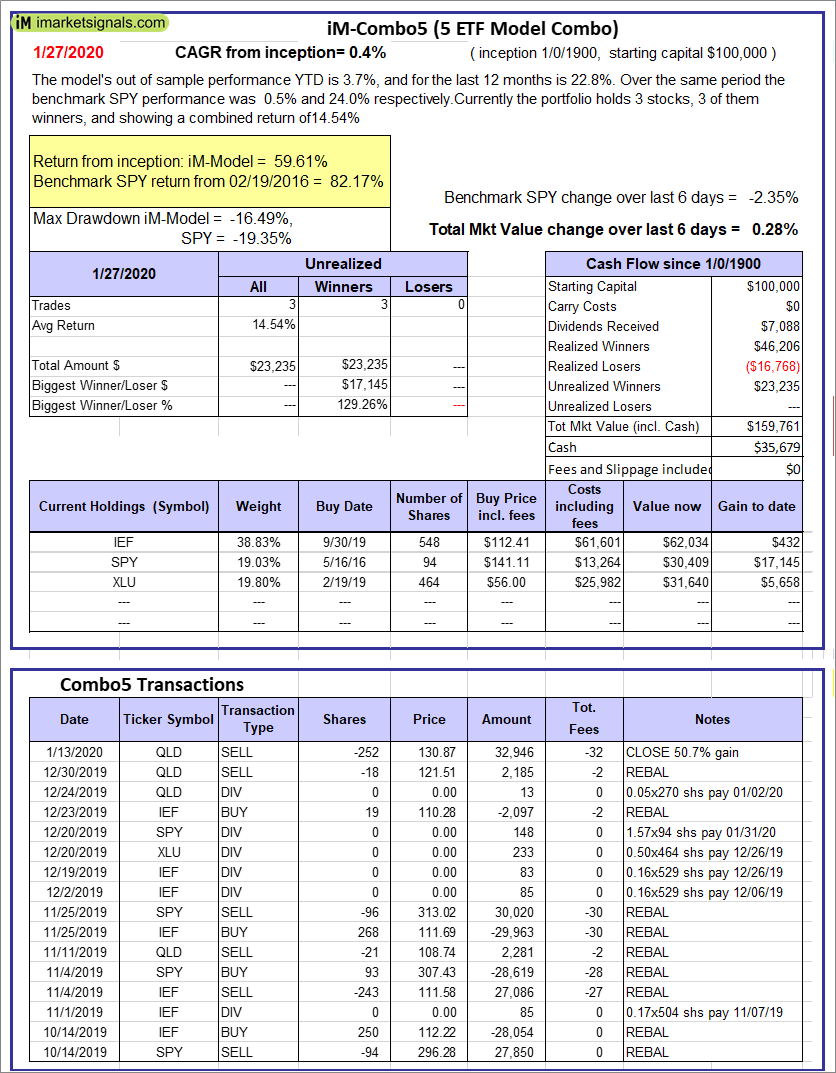 |
iM-Combo5: The model’s out of sample performance YTD is 3.7%, and for the last 12 months is 22.8%. Over the same period the benchmark SPY performance was 0.5% and 24.0% respectively. Over the previous week the market value of iM-Combo5 gained 0.28% at a time when SPY gained -2.35%. A starting capital of $100,000 at inception on 2/22/2016 would have grown to $159,761 which includes $35,679 cash and excludes $0 spent on fees and slippage. |
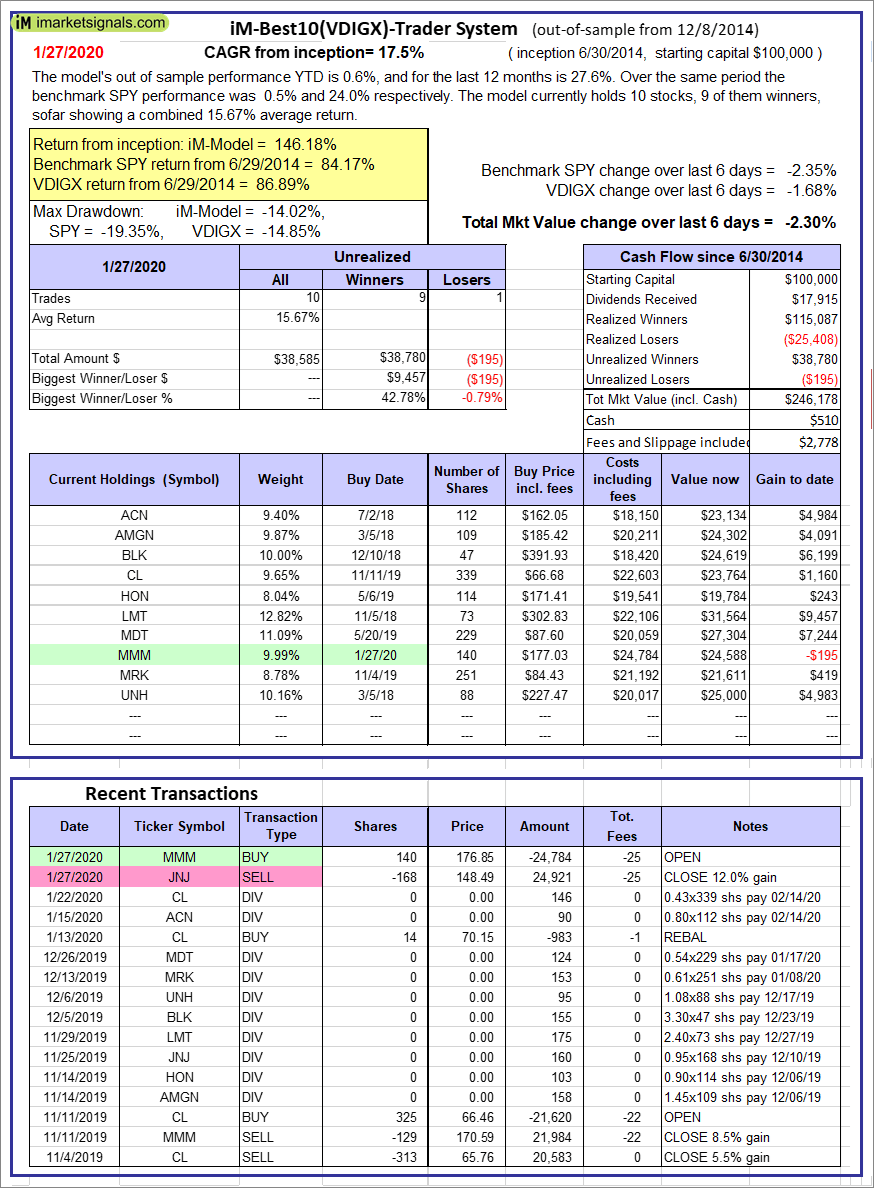 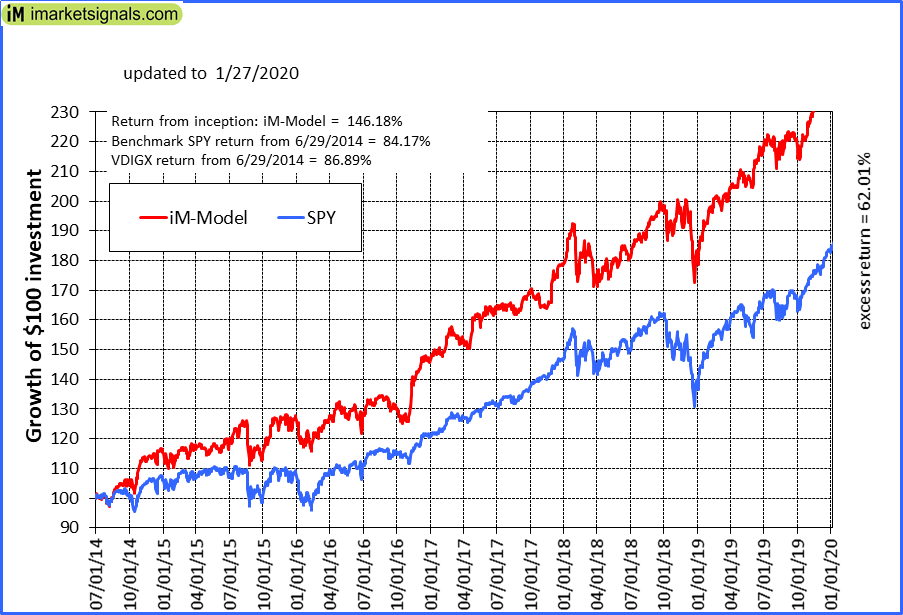 |
iM-Best10(VDIGX)-Trader: The model’s out of sample performance YTD is 0.6%, and for the last 12 months is 27.6%. Over the same period the benchmark SPY performance was 0.5% and 24.0% respectively. Since inception, on 7/1/2014, the model gained 146.18% while the benchmark SPY gained 84.17% and VDIGX gained 86.89% over the same period. Over the previous week the market value of iM-Best10(VDIGX) gained -2.30% at a time when SPY gained -2.35%. A starting capital of $100,000 at inception on 7/1/2014 would have grown to $246,178 which includes $510 cash and excludes $2,778 spent on fees and slippage. |
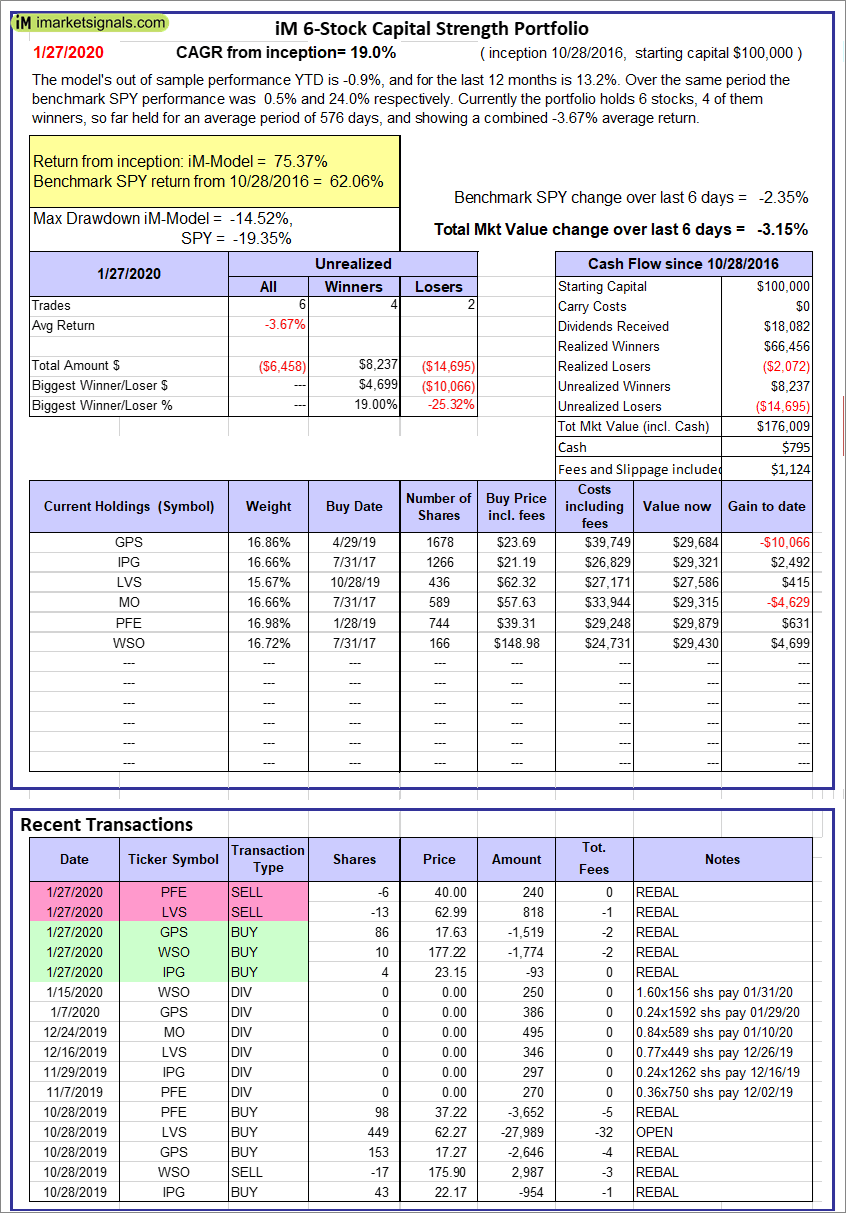 |
iM 6-Stock Capital Strength Portfolio: The model’s out of sample performance YTD is -0.9%, and for the last 12 months is 13.2%. Over the same period the benchmark SPY performance was 0.5% and 24.0% respectively. Over the previous week the market value of the iM 6-Stock Capital Strength Portfolio gained -3.15% at a time when SPY gained -2.35%. A starting capital of $100,000 at inception on 10/28/2016 would have grown to $176,009 which includes $795 cash and excludes $1,124 spent on fees and slippage. |
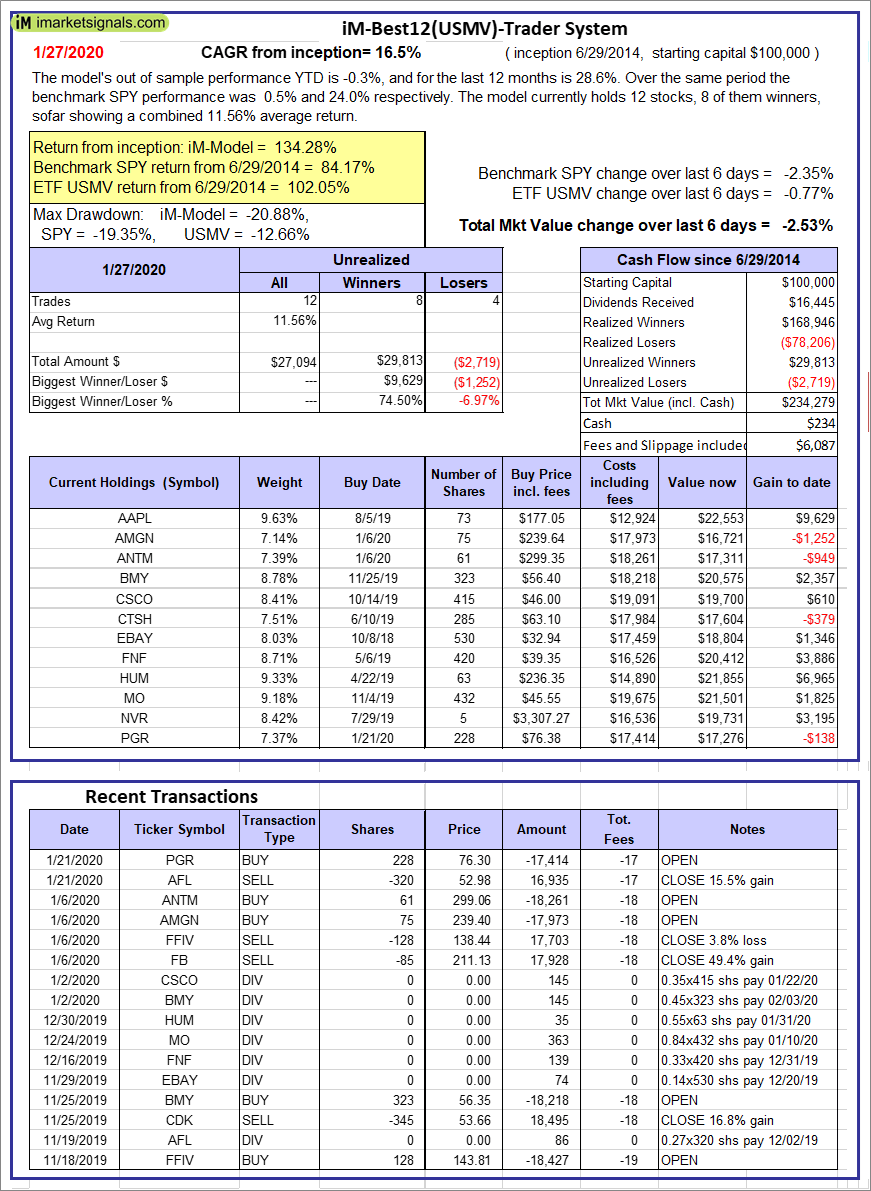 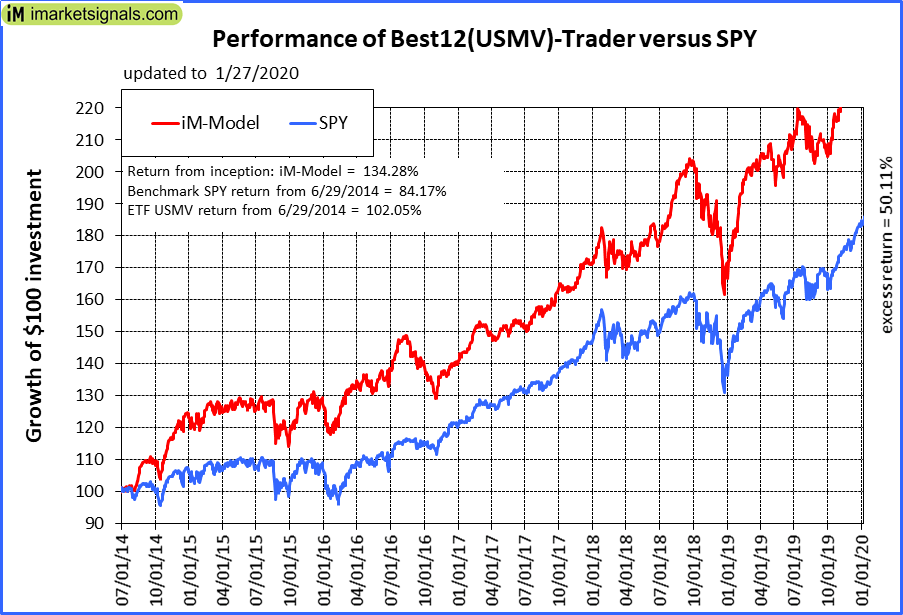 |
iM-Best12(USMV)-Trader: The model’s out of sample performance YTD is -0.3%, and for the last 12 months is 28.6%. Over the same period the benchmark SPY performance was 0.5% and 24.0% respectively. Since inception, on 6/30/2014, the model gained 134.28% while the benchmark SPY gained 84.17% and the ETF USMV gained 102.05% over the same period. Over the previous week the market value of iM-Best12(USMV)-Trader gained -2.53% at a time when SPY gained -2.35%. A starting capital of $100,000 at inception on 6/30/2014 would have grown to $234,279 which includes $234 cash and excludes $6,087 spent on fees and slippage. |
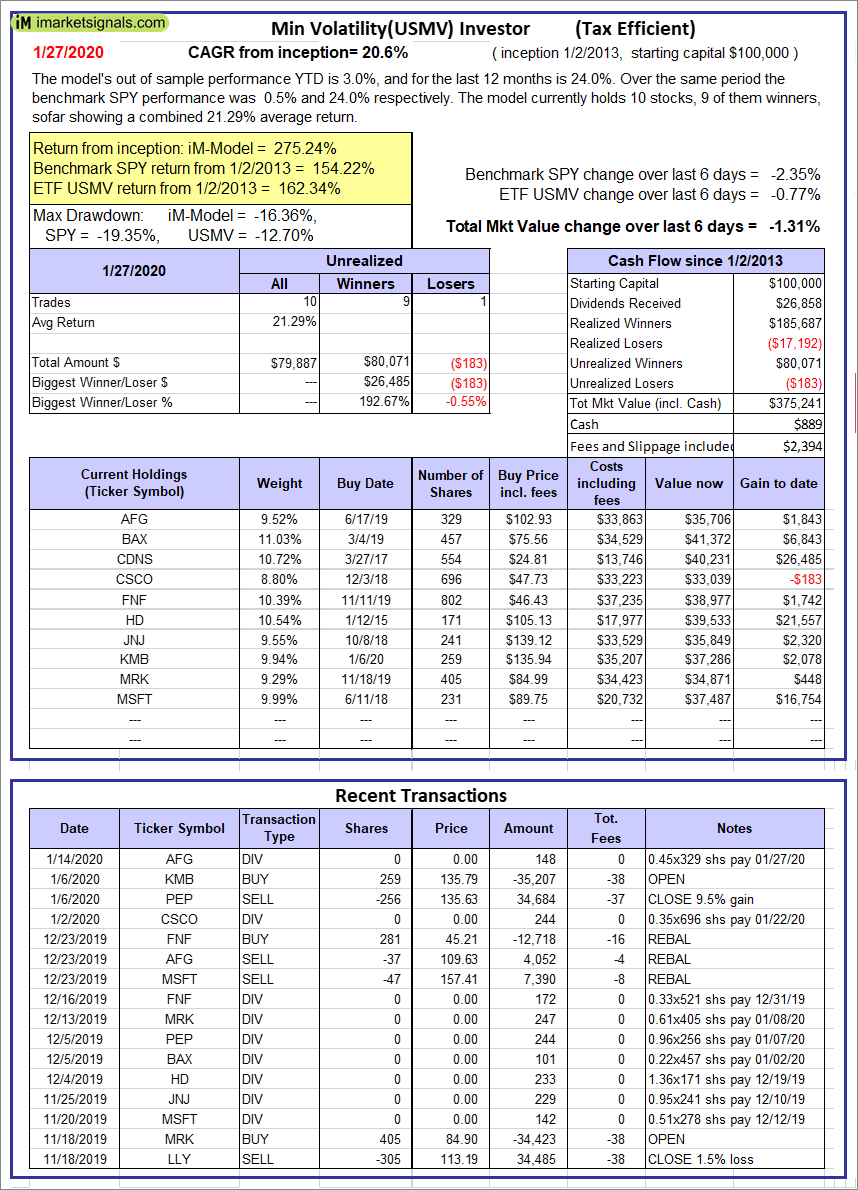 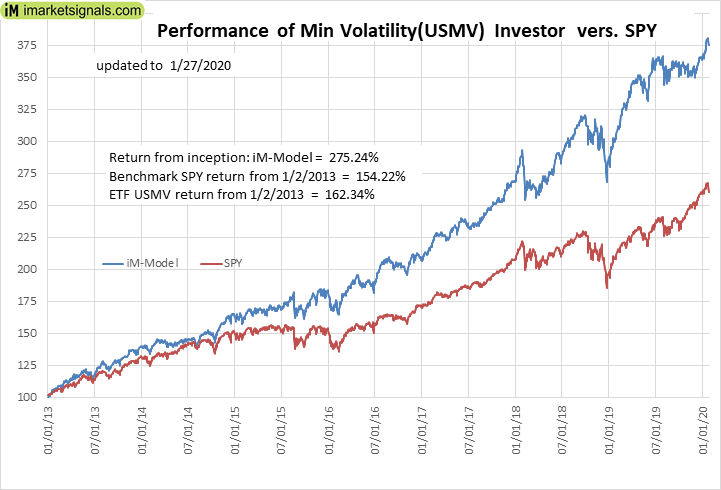 |
iM-Min Volatility(USMV) Investor (Tax Efficient): The model’s out of sample performance YTD is 3.0%, and for the last 12 months is 24.0%. Over the same period the benchmark SPY performance was 0.5% and 24.0% respectively. Since inception, on 1/3/2013, the model gained 275.24% while the benchmark SPY gained 154.22% and the ETF USMV gained 162.34% over the same period. Over the previous week the market value of iM-Best12(USMV)Q1 gained -1.31% at a time when SPY gained -2.35%. A starting capital of $100,000 at inception on 1/3/2013 would have grown to $375,241 which includes $889 cash and excludes $2,394 spent on fees and slippage. |
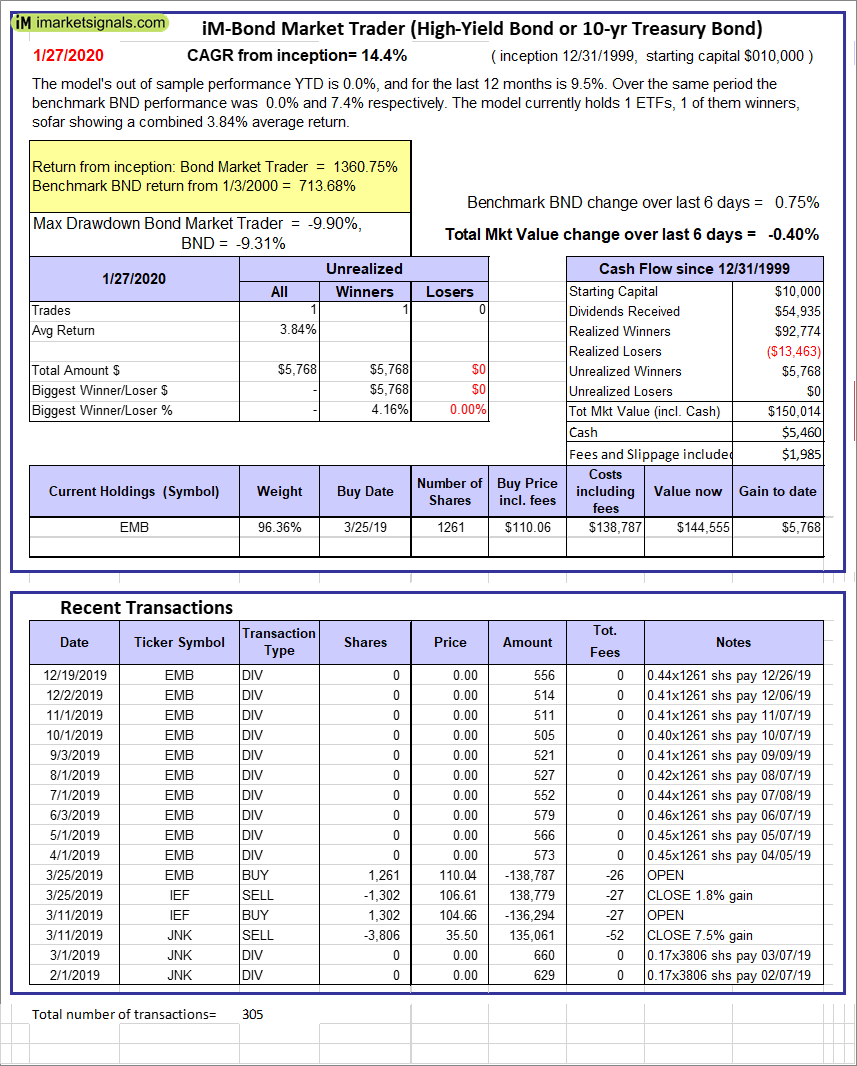 |
iM-Bond Market Trader (High-Yield Bond or 10-yr Treasury Bond): The model’s out of sample performance YTD is 1.6%, and for the last 12 months is 15.2%. Over the same period the benchmark SPY performance was 0.5% and 24.0% respectively. Over the previous week the market value of the iM-Bond Market Trader (High-Yield Bond or 10-yr Treasury Bond) gained -0.40% at a time when BND gained 0.75%. A starting capital of $100,000 at inception on 10/30/2016 would have grown to $150,014 which includes $5,460 cash and excludes $1,985 spent on fees and slippage. |
 |
iM-Best(Short): The model’s out of sample performance YTD is 0.3%, and for the last 12 months is 0.8%. Over the same period the benchmark SPY performance was 0.5% and 24.0% respectively. Over the previous week the market value of iM-Best(Short) gained 0.74% at a time when SPY gained -2.35%. Over the period 1/2/2009 to 1/27/2020 the starting capital of $100,000 would have grown to $80,669 which includes $96,490 cash and excludes $27,128 spent on fees and slippage. |
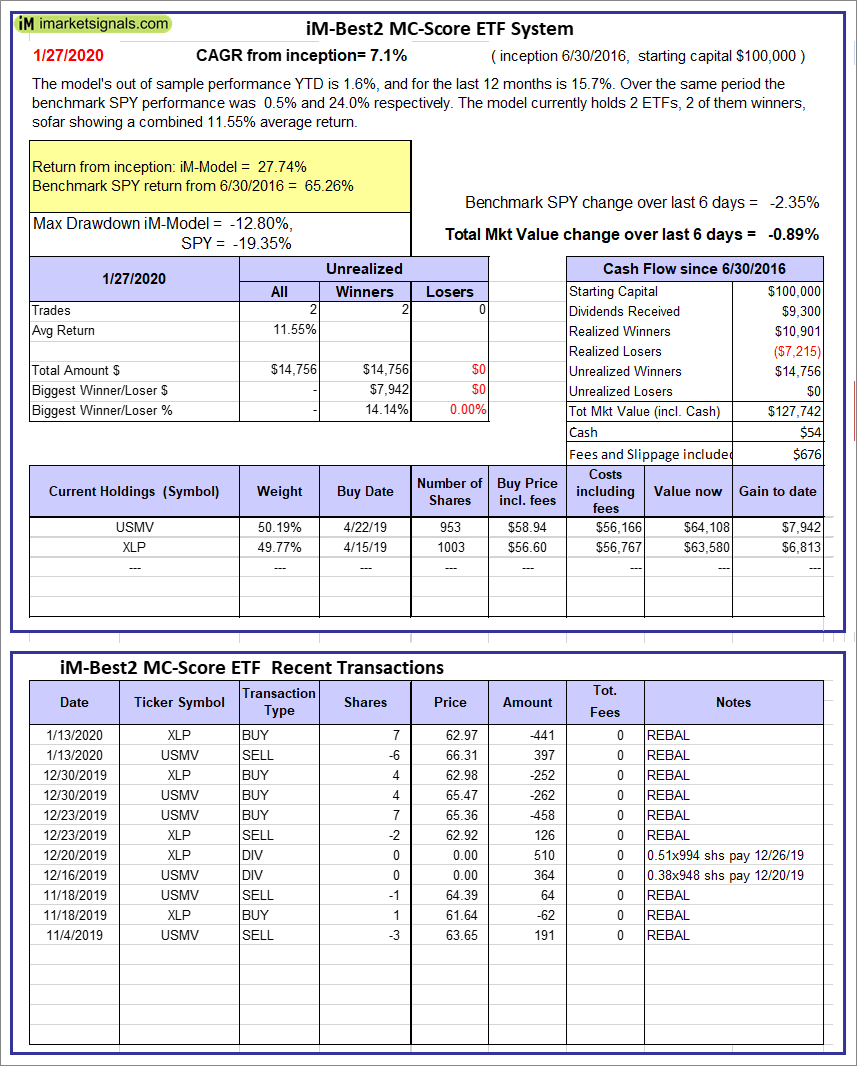 |
iM-Best2 MC-Score ETF System: The model’s out of sample performance YTD is 1.6%, and for the last 12 months is 15.7%. Over the same period the benchmark SPY performance was 0.5% and 24.0% respectively. Over the previous week the market value of the iM-Best2 MC-Score ETF System gained -0.89% at a time when SPY gained -2.35%. A starting capital of $100,000 at inception on 6/30/2016 would have grown to $127,742 which includes $54 cash and excludes $676 spent on fees and slippage. |
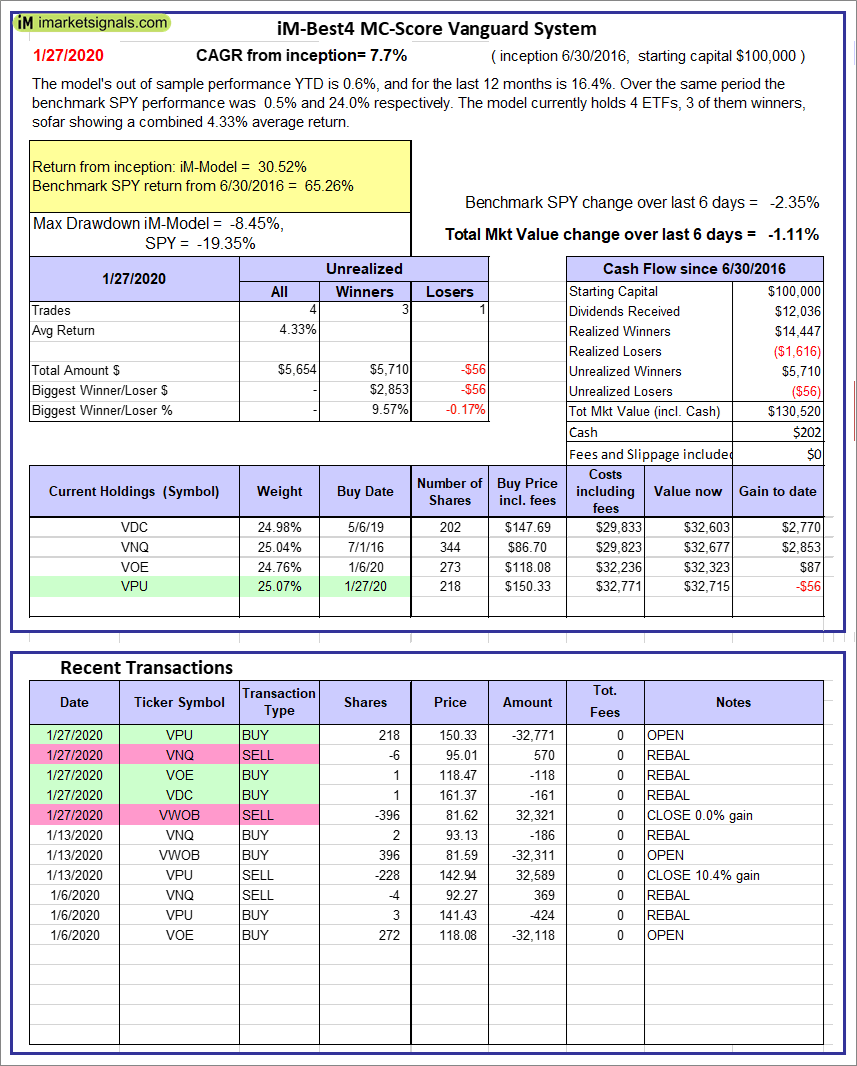 |
iM-Best4 MC-Score Vanguard System: The model’s out of sample performance YTD is 0.6%, and for the last 12 months is 16.4%. Over the same period the benchmark SPY performance was 0.5% and 24.0% respectively. Over the previous week the market value of the iM-Best4 MC-Score Vanguard System gained -1.11% at a time when SPY gained -2.35%. A starting capital of $100,000 at inception on 6/30/2016 would have grown to $130,520 which includes $202 cash and excludes $00 spent on fees and slippage. |
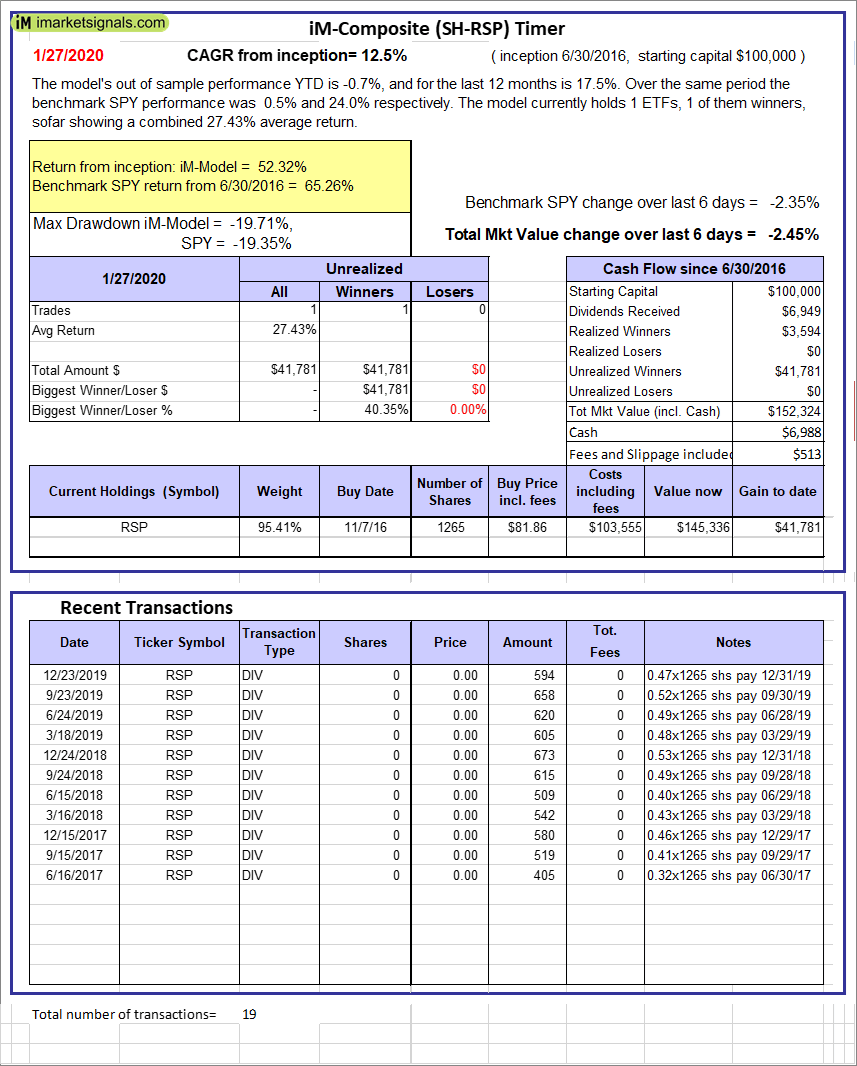 |
iM-Composite (SH-RSP) Timer: The model’s out of sample performance YTD is -0.7%, and for the last 12 months is 17.5%. Over the same period the benchmark SPY performance was 0.5% and 24.0% respectively. Over the previous week the market value of the iM-Composite (SH-RSP) Timer gained -2.45% at a time when SPY gained -2.35%. A starting capital of $100,000 at inception on 6/30/2016 would have grown to $152,324 which includes $6,988 cash and excludes $513 spent on fees and slippage. |
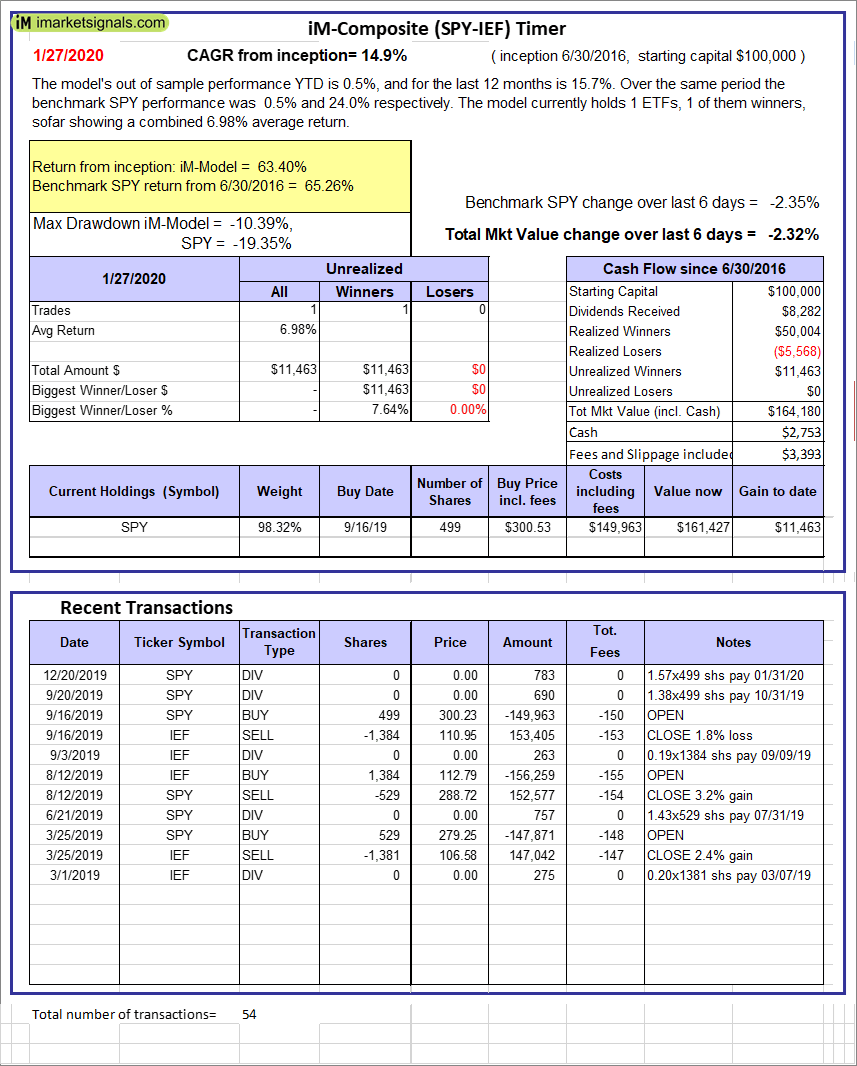 |
iM-Composite (SPY-IEF) Timer: The model’s out of sample performance YTD is 0.5%, and for the last 12 months is 15.7%. Over the same period the benchmark SPY performance was 0.5% and 24.0% respectively. Over the previous week the market value of the iM-Composite (SPY-IEF) Timer gained -2.32% at a time when SPY gained -2.35%. A starting capital of $100,000 at inception on 6/30/2016 would have grown to $164,180 which includes $2,753 cash and excludes $3,393 spent on fees and slippage. |
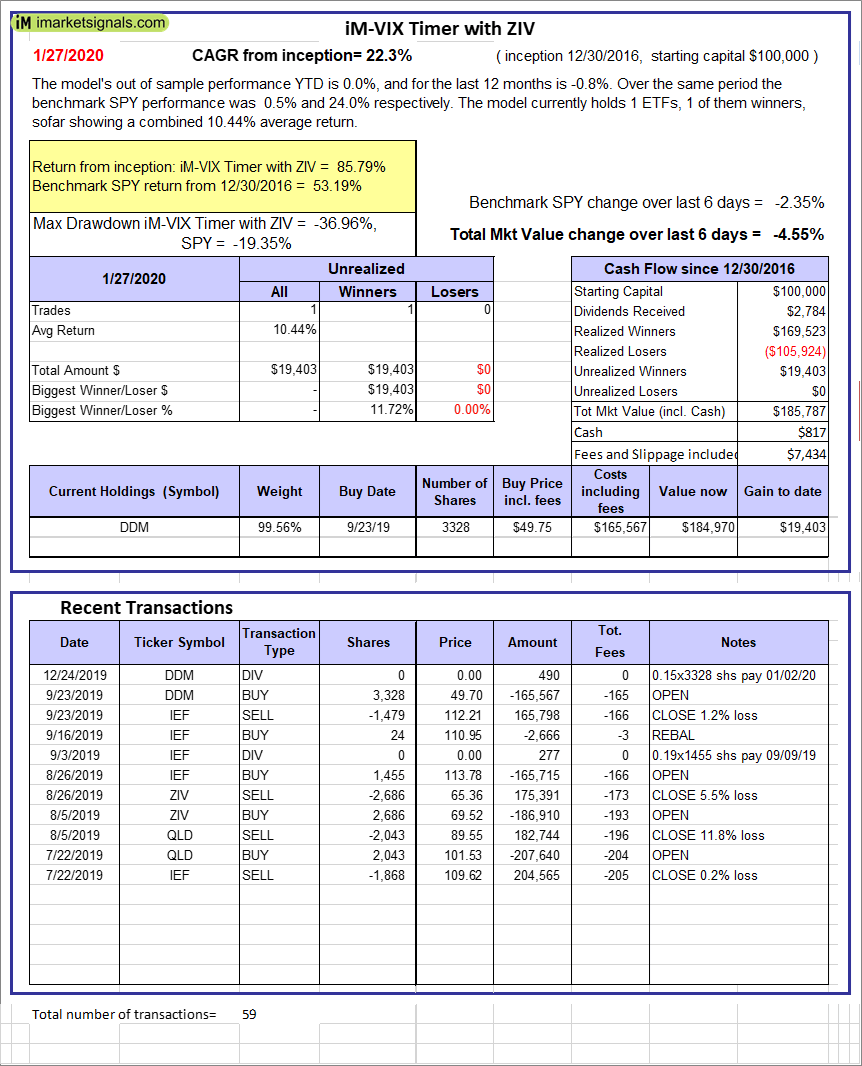 |
iM-VIX Timer with ZIV: The model’s out of sample performance YTD is 0.0%, and for the last 12 months is -0.8%. Over the same period the benchmark SPY performance was 0.5% and 24.0% respectively. Over the previous week the market value of the iM-VIX Timer with ZIV gained -4.55% at a time when SPY gained -2.35%. A starting capital of $100,000 at inception on 6/30/2016 would have grown to $185,787 which includes $817 cash and excludes $7,434 spent on fees and slippage. |
 |
iM-Composite(Gold-Stocks-Bond) Timer: The model’s out of sample performance YTD is 3.1%, and for the last 12 months is 20.2%. Over the same period the benchmark SPY performance was 0.5% and 24.0% respectively. Over the previous week the market value of the iM-Composite(Gold-Stocks-Bond) Timer gained 1.54% at a time when SPY gained -2.35%. A starting capital of $100,000 at inception on 6/30/2016 would have grown to $134,241 which includes $124 cash and excludes $4,640 spent on fees and slippage. |
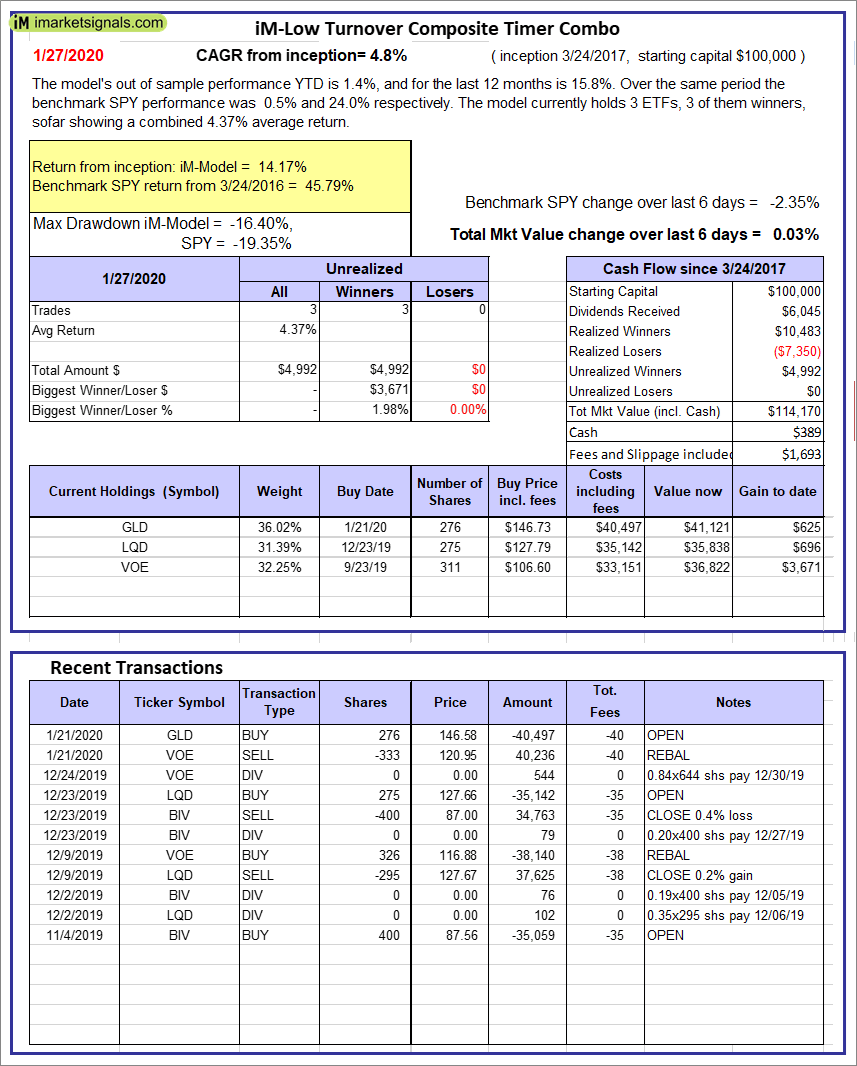 |
iM-Low Turnover Composite Timer Combo: The model’s out of sample performance YTD is 1.4%, and for the last 12 months is 15.8%. Over the same period the benchmark SPY performance was 0.5% and 24.0% respectively. Over the previous week the market value of the iM-Low Turnover Composite Timer Combo gained 0.03% at a time when SPY gained -2.35%. A starting capital of $100,000 at inception on 3/24/27 would have grown to $114,170 which includes $389 cash and excludes $1,693 spent on fees and slippage. |
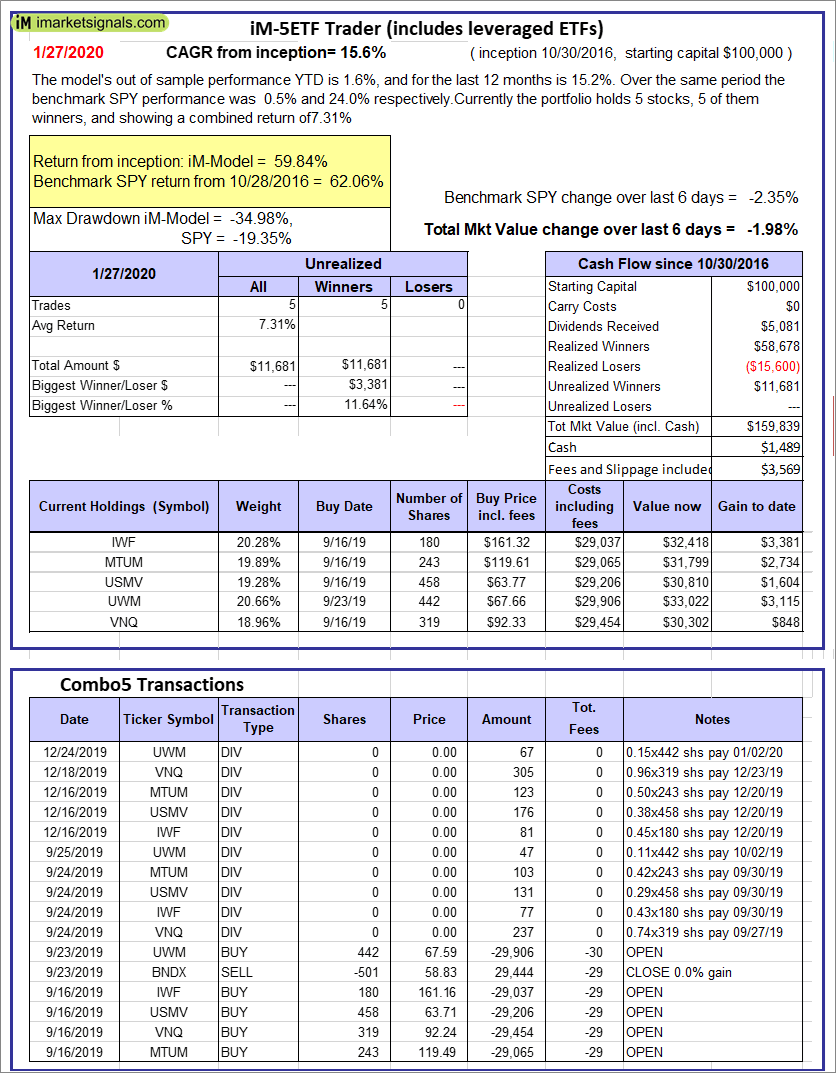 |
iM-5ETF Trader (includes leveraged ETFs): The model’s out of sample performance YTD is 1.6%, and for the last 12 months is 15.2%. Over the same period the benchmark SPY performance was 0.5% and 24.0% respectively. Over the previous week the market value of the iM-5ETF Trader (includes leveraged ETFs) gained -1.98% at a time when SPY gained -2.35%. A starting capital of $100,000 at inception on 10/30/2016 would have grown to $159,839 which includes $1,489 cash and excludes $3,569 spent on fees and slippage. |
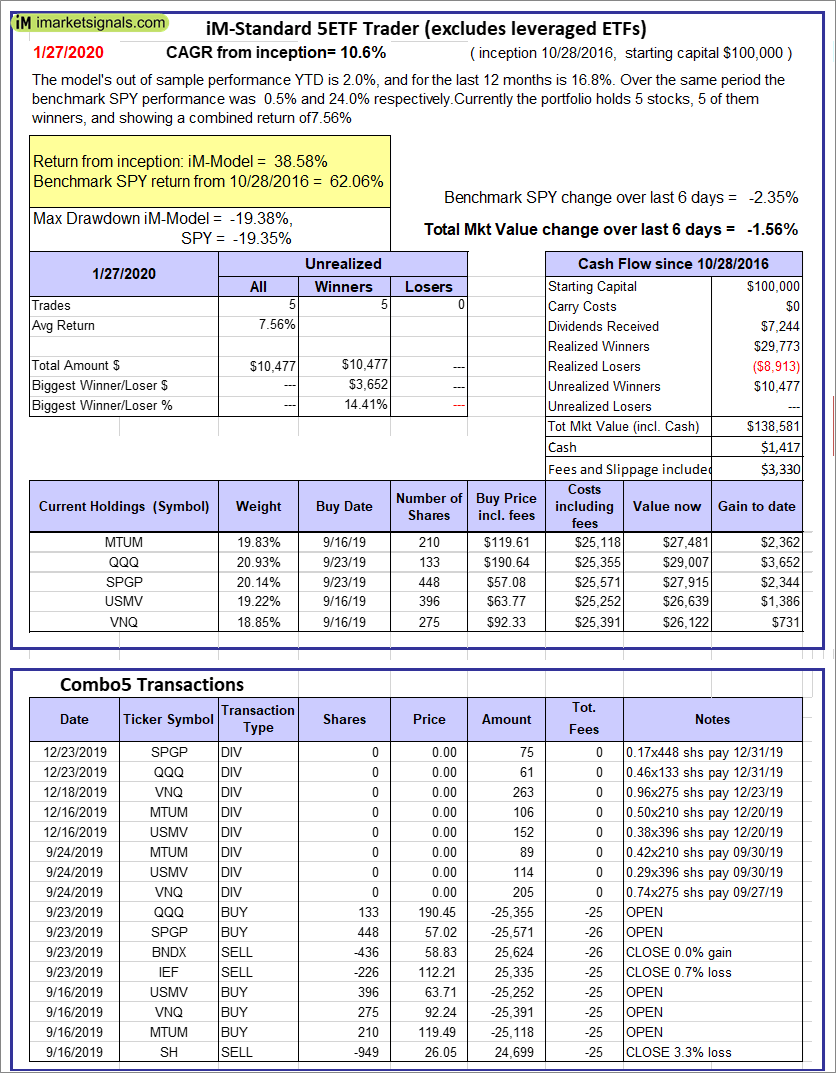 |
iM-Standard 5ETF Trader (excludes leveraged ETFs): The model’s out of sample performance YTD is 2.0%, and for the last 12 months is 16.8%. Over the same period the benchmark SPY performance was 0.5% and 24.0% respectively. Over the previous week the market value of the iM-Standard 5ETF Trader (excludes leveraged ETFs) gained -1.56% at a time when SPY gained -2.35%. A starting capital of $100,000 at inception on 10/30/2016 would have grown to $138,581 which includes $1,417 cash and excludes $3,330 spent on fees and slippage. |
iM-Best Reports – 1/27/2020
Posted in pmp SPY-SH
Leave a Reply
You must be logged in to post a comment.