
  |
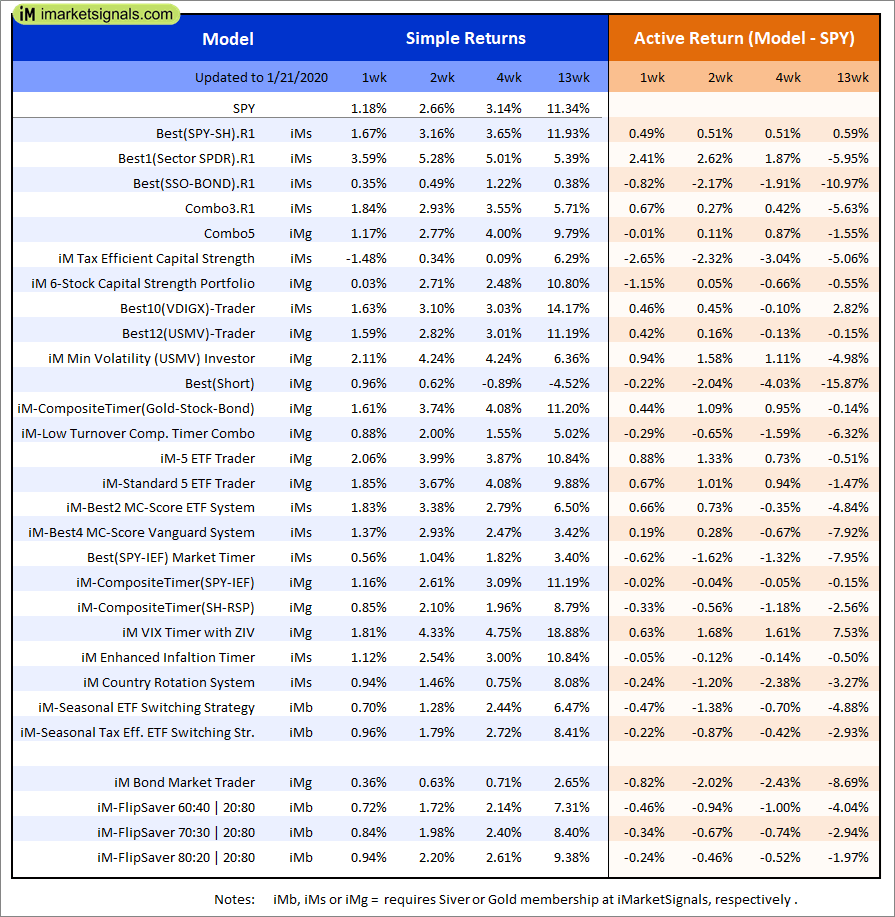
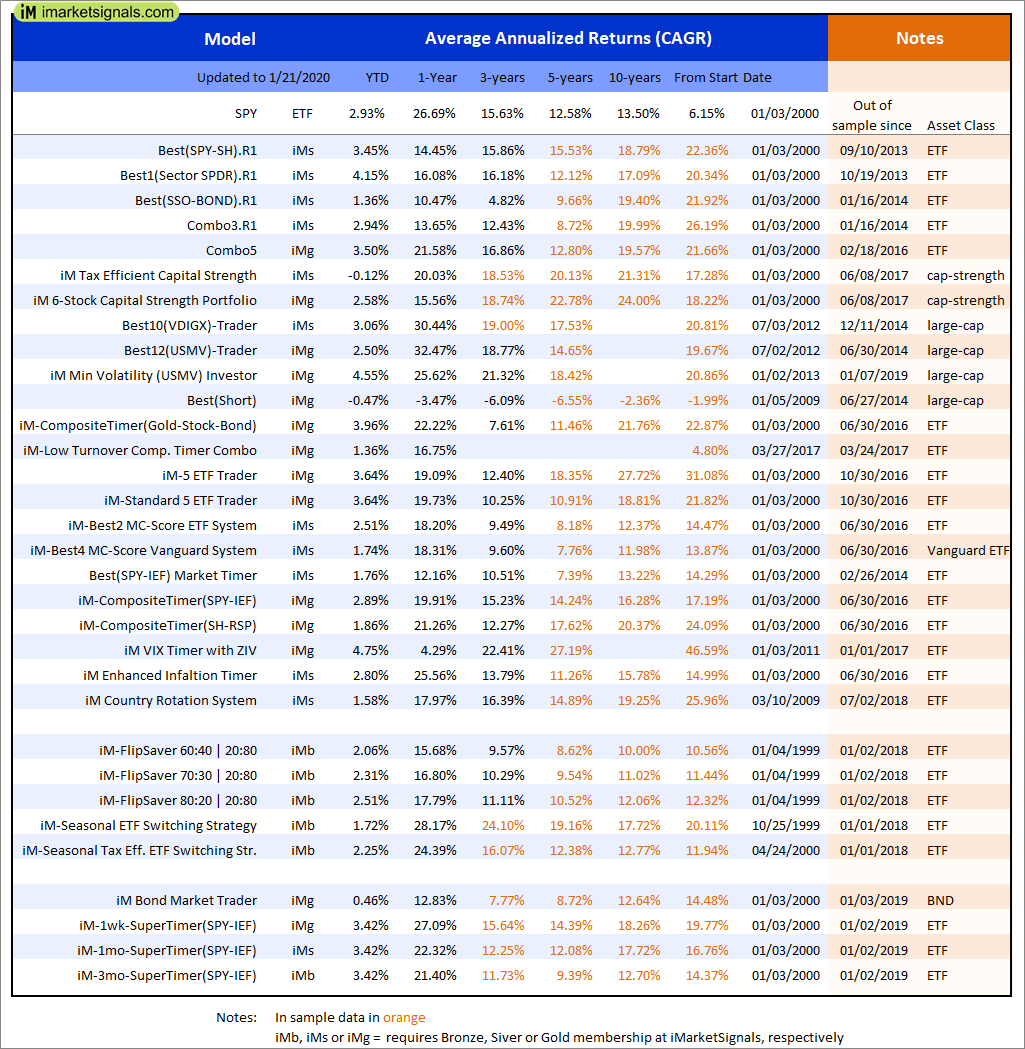
Out of sample performance summary of our models for the past 1, 2, 4 and 13 week periods. The active active return indicates how the models over- or underperformed the benchmark ETF SPY. Also the YTD, and the 1-, 3-, 5- and 10-year annualized returns are shown in the second table |
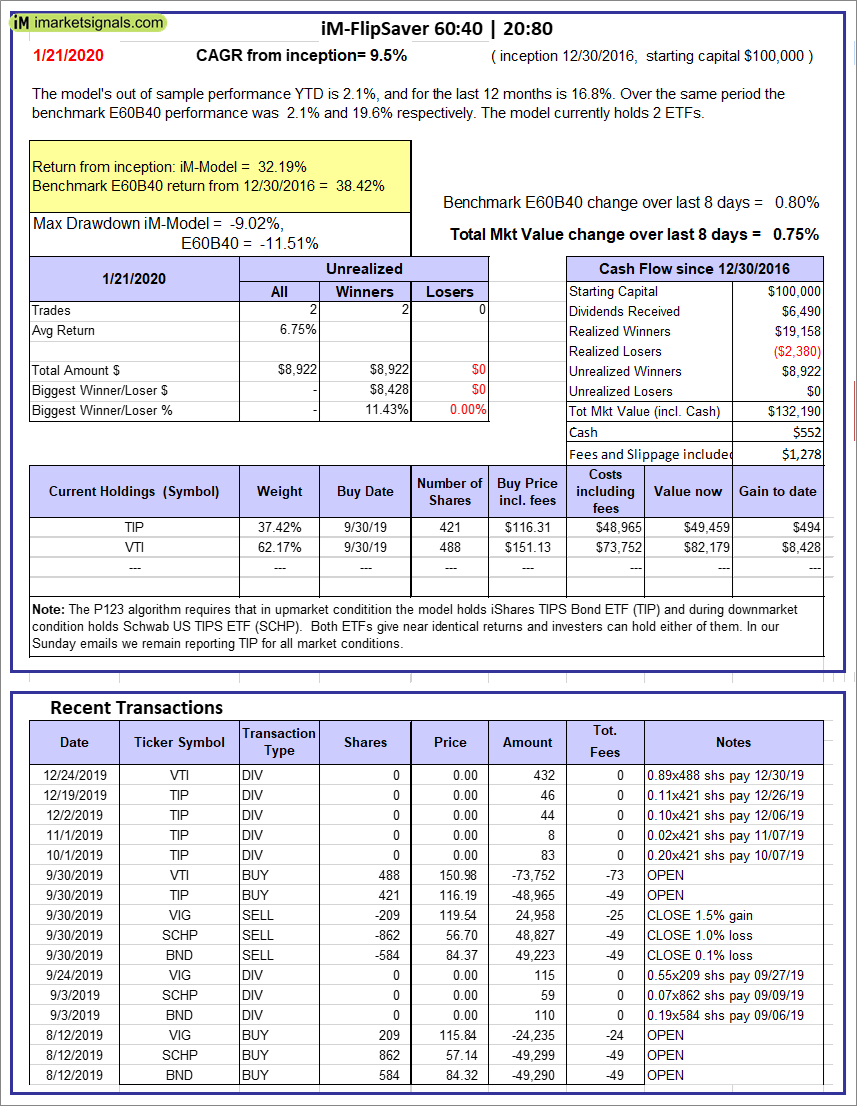 |
iM-FlipSaver 60:40 | 20:80 – 2017: The model’s out of sample performance YTD is 2.1%, and for the last 12 months is 16.8%. Over the same period the benchmark E60B40 performance was 2.1% and 19.6% respectively. Over the previous week the market value of iM-FlipSaver 80:20 | 20:80 gained 0.75% at a time when SPY gained 0.80%. A starting capital of $100,000 at inception on 7/16/2015 would have grown to $132,190 which includes $552 cash and excludes $1,278 spent on fees and slippage. |
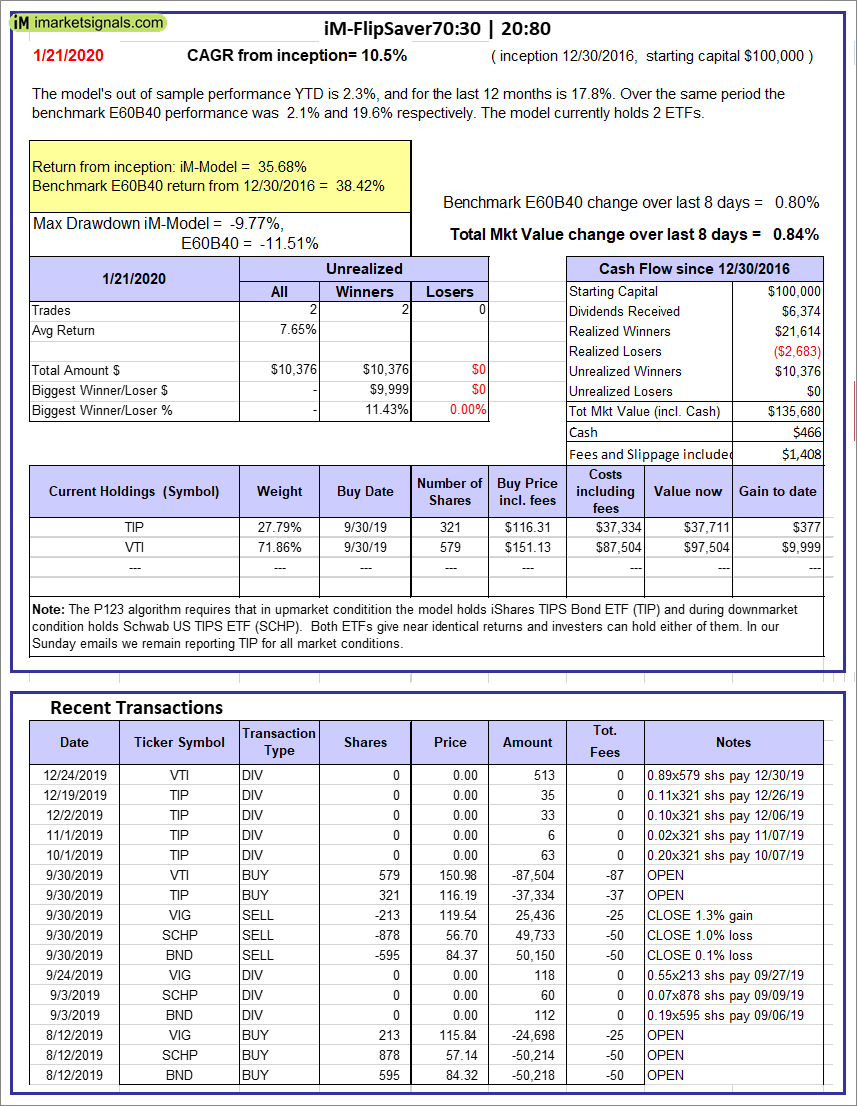 |
iM-FlipSaver 70:30 | 20:80 – 2017: The model’s out of sample performance YTD is 2.3%, and for the last 12 months is 17.8%. Over the same period the benchmark E60B40 performance was 2.1% and 19.6% respectively. Over the previous week the market value of iM-FlipSaver 70:30 | 20:80 gained 0.84% at a time when SPY gained 0.80%. A starting capital of $100,000 at inception on 7/15/2015 would have grown to $135,680 which includes $466 cash and excludes $1,408 spent on fees and slippage. |
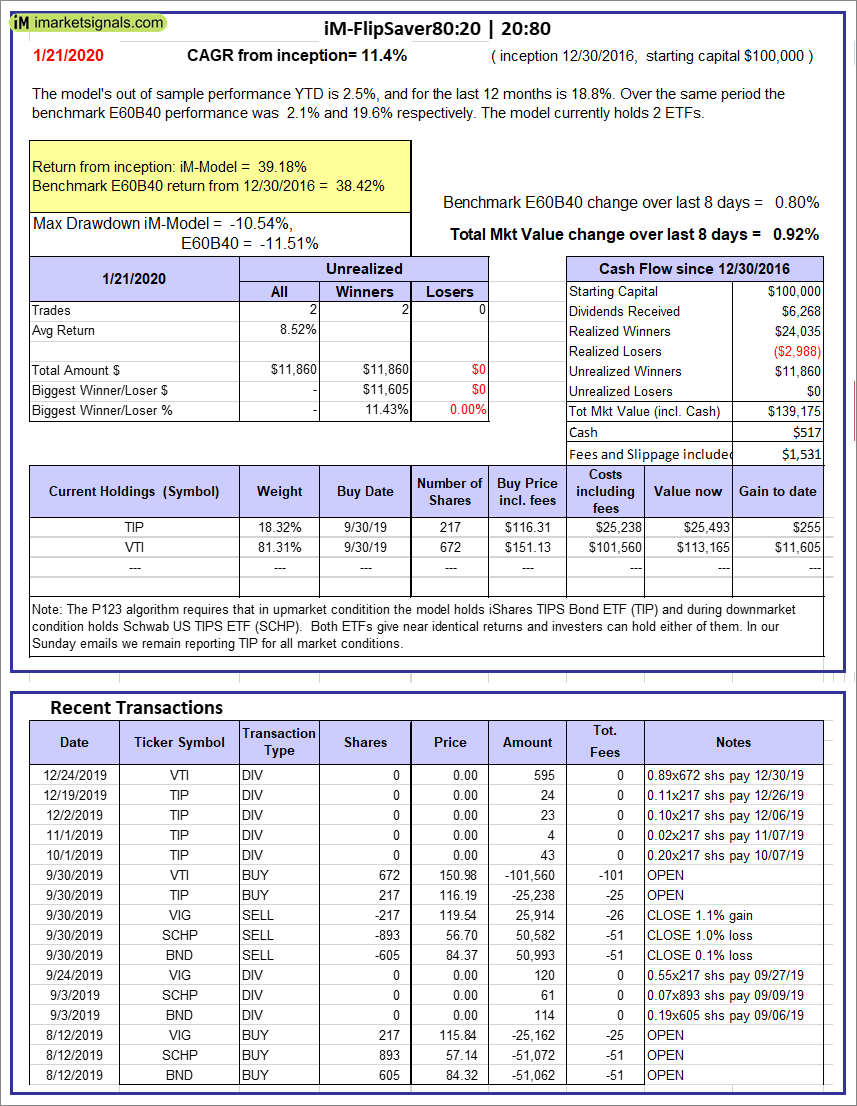 |
iM-FlipSaver 80:20 | 20:80 – 2017: The model’s out of sample performance YTD is 2.5%, and for the last 12 months is 18.8%. Over the same period the benchmark E60B40 performance was 2.1% and 19.6% respectively. Over the previous week the market value of iM-FlipSaver 80:20 | 20:80 gained 0.92% at a time when SPY gained 0.80%. A starting capital of $100,000 at inception on 1/2/2017 would have grown to $139,175 which includes $517 cash and excludes $1,531 spent on fees and slippage. |
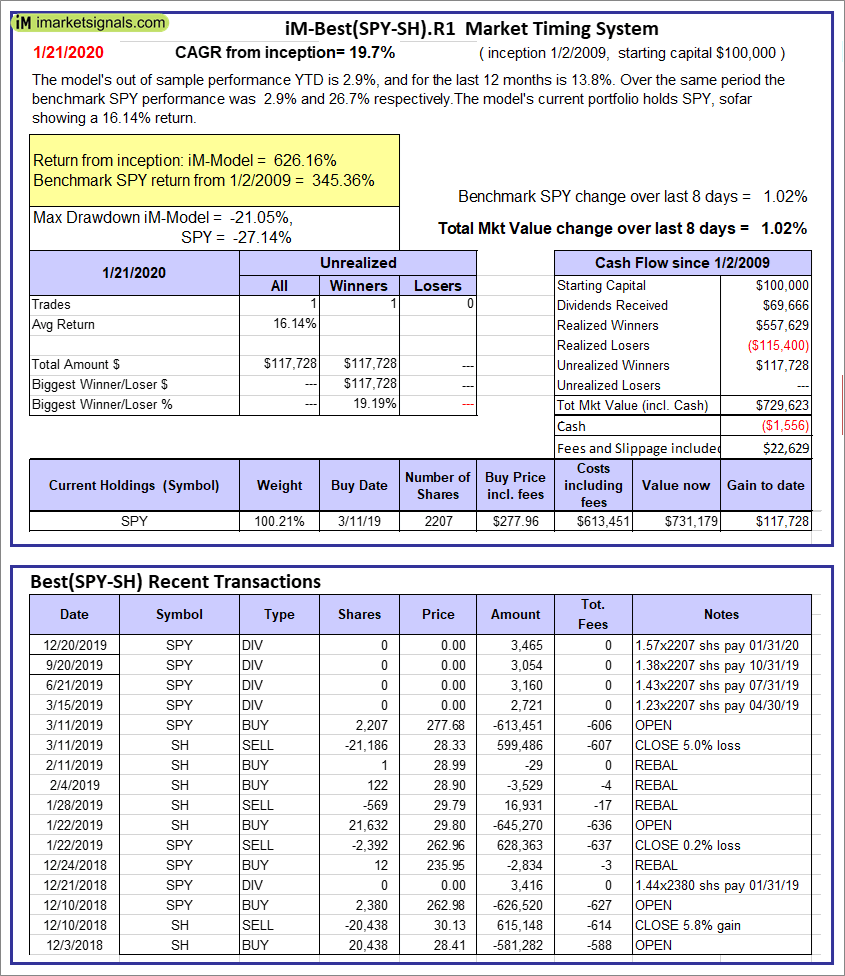 |
iM-Best(SPY-SH).R1: The model’s out of sample performance YTD is 2.9%, and for the last 12 months is 13.8%. Over the same period the benchmark SPY performance was 2.9% and 26.7% respectively. Over the previous week the market value of Best(SPY-SH) gained 1.02% at a time when SPY gained 1.02%. A starting capital of $100,000 at inception on 1/2/2009 would have grown to $729,623 which includes -$1,556 cash and excludes $22,629 spent on fees and slippage. |
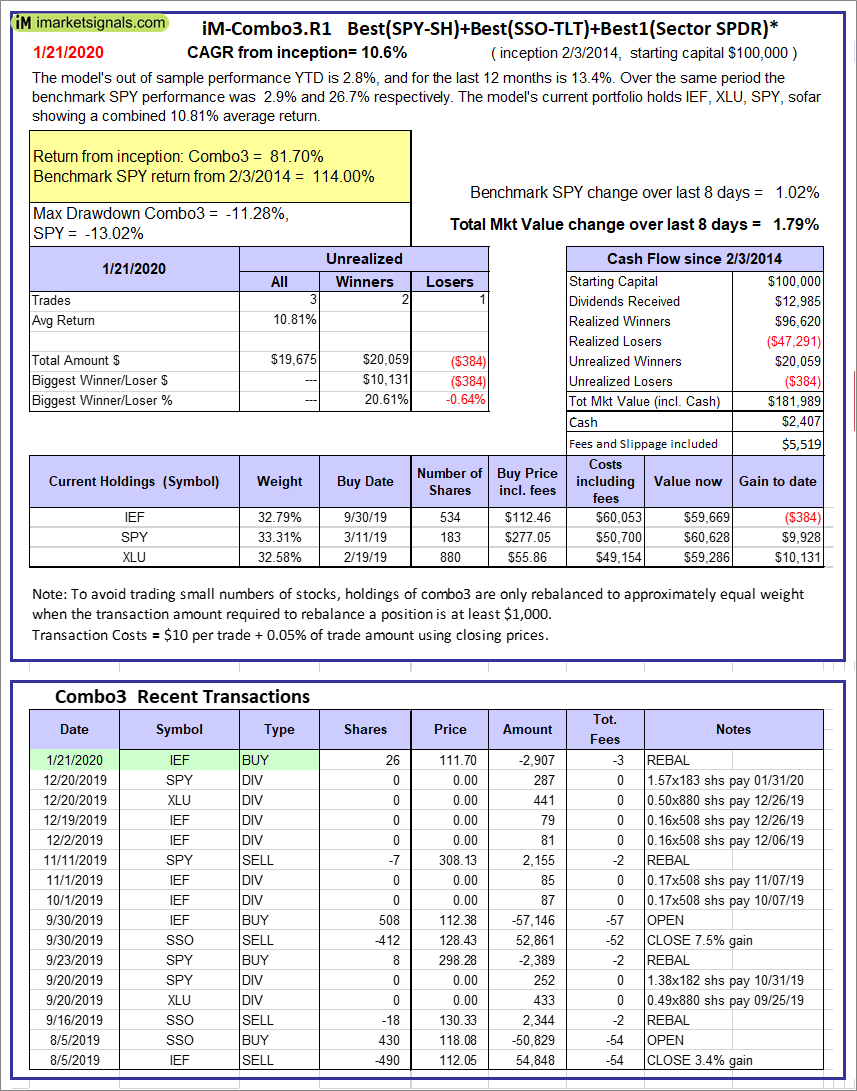 |
iM-Combo3.R1: The model’s out of sample performance YTD is 2.8%, and for the last 12 months is 13.4%. Over the same period the benchmark SPY performance was 2.9% and 26.7% respectively. Over the previous week the market value of iM-Combo3.R1 gained 1.79% at a time when SPY gained 1.02%. A starting capital of $100,000 at inception on 2/3/2014 would have grown to $181,989 which includes $2,407 cash and excludes $5,519 spent on fees and slippage. |
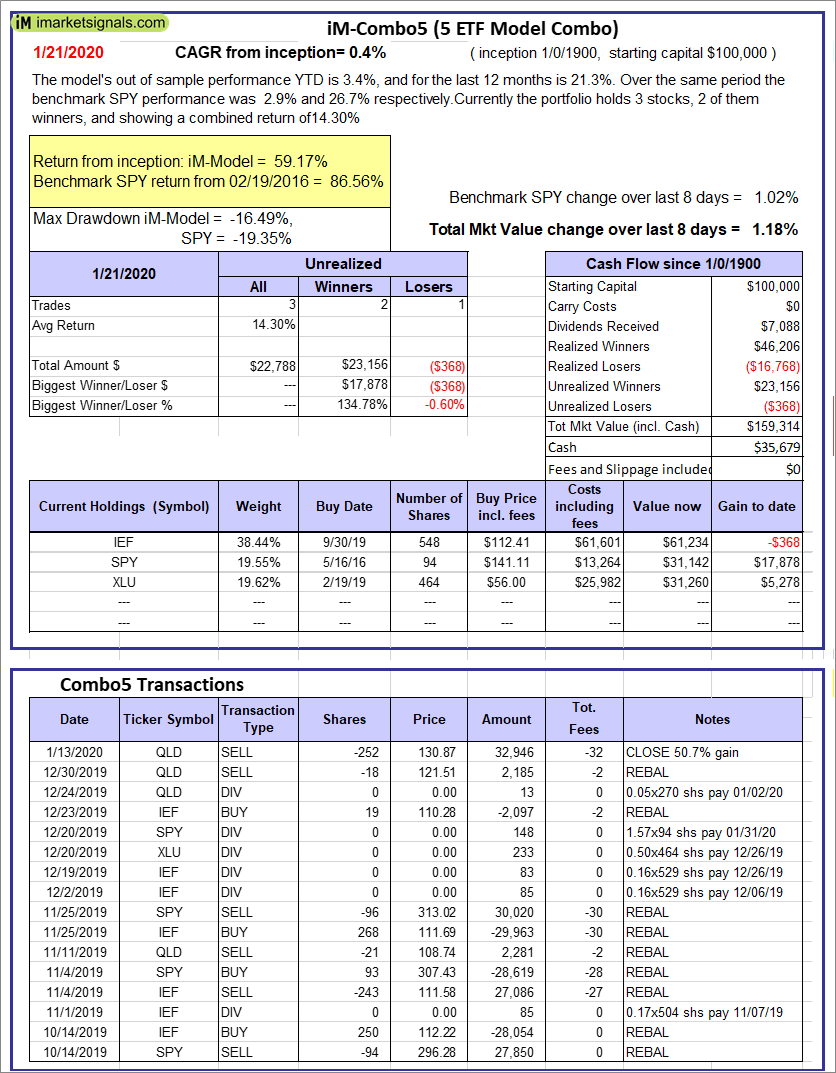 |
iM-Combo5: The model’s out of sample performance YTD is 3.4%, and for the last 12 months is 21.3%. Over the same period the benchmark SPY performance was 2.9% and 26.7% respectively. Over the previous week the market value of iM-Combo5 gained 1.18% at a time when SPY gained 1.02%. A starting capital of $100,000 at inception on 2/22/2016 would have grown to $159,314 which includes $35,679 cash and excludes $0 spent on fees and slippage. |
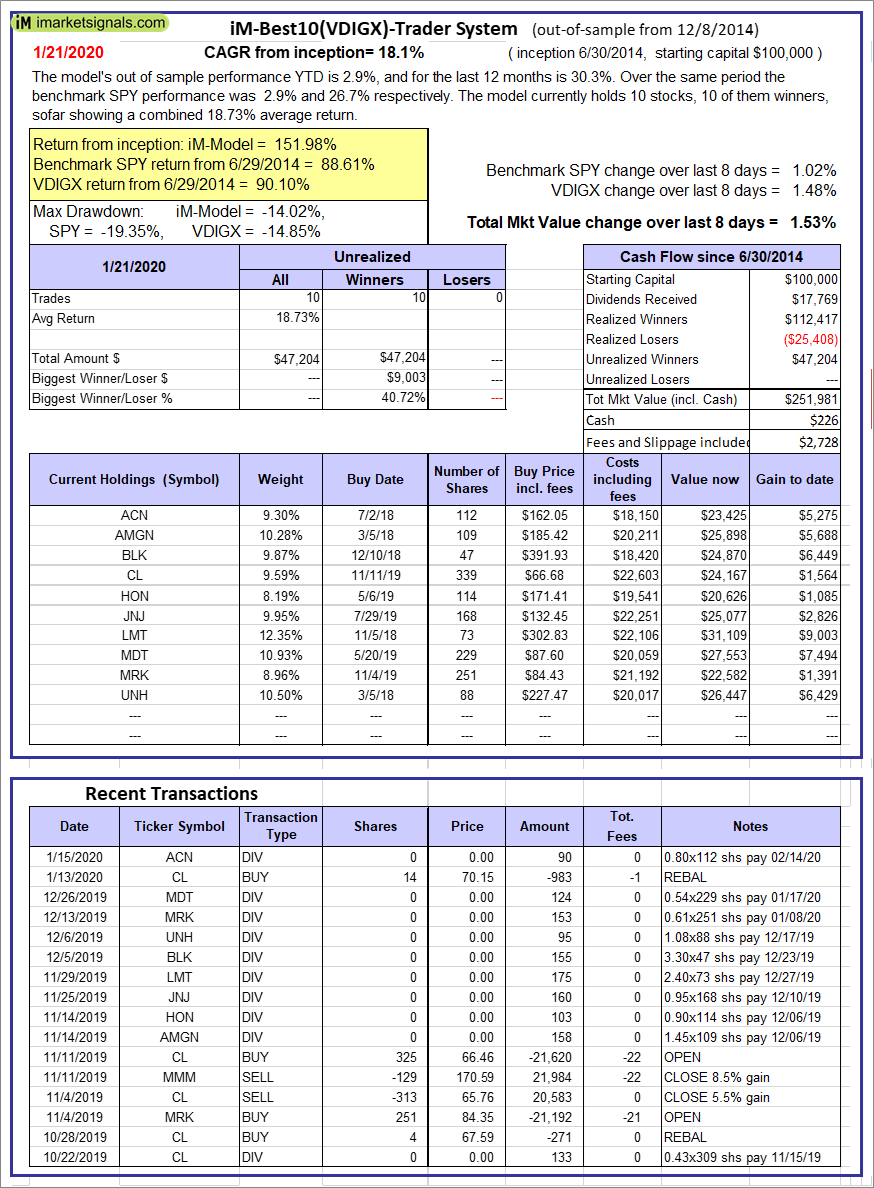 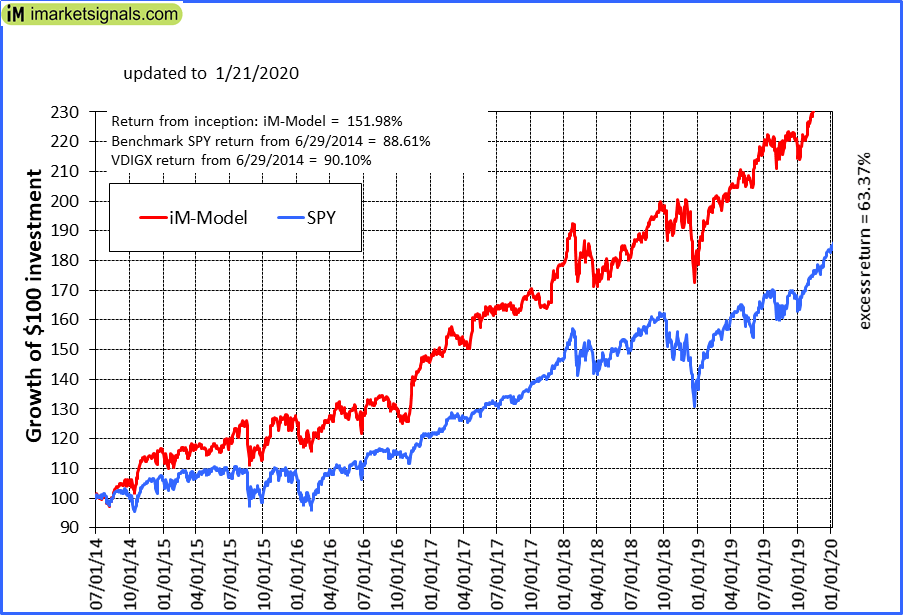 |
iM-Best10(VDIGX)-Trader: The model’s out of sample performance YTD is 2.9%, and for the last 12 months is 30.3%. Over the same period the benchmark SPY performance was 2.9% and 26.7% respectively. Since inception, on 7/1/2014, the model gained 151.98% while the benchmark SPY gained 88.61% and VDIGX gained 90.10% over the same period. Over the previous week the market value of iM-Best10(VDIGX) gained 1.53% at a time when SPY gained 1.02%. A starting capital of $100,000 at inception on 7/1/2014 would have grown to $251,981 which includes $226 cash and excludes $2,728 spent on fees and slippage. |
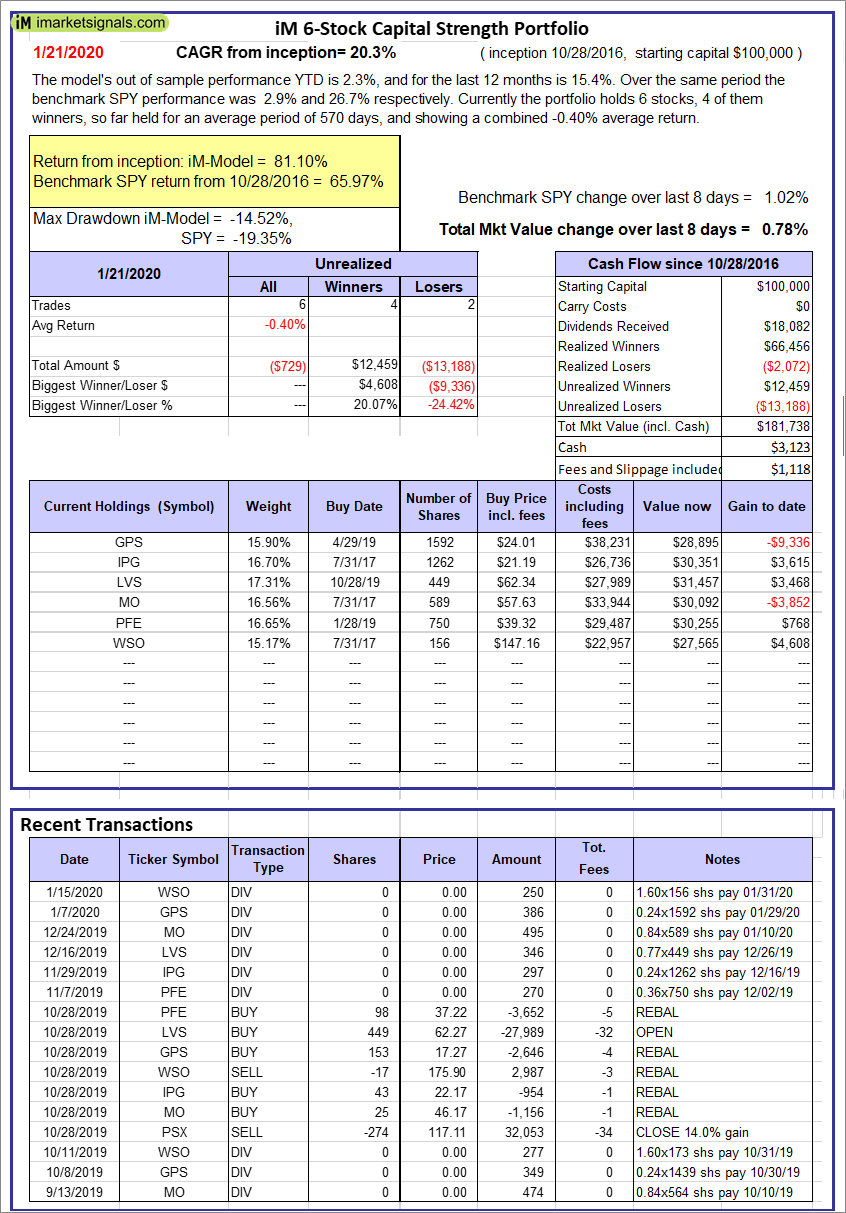 |
iM 6-Stock Capital Strength Portfolio: The model’s out of sample performance YTD is 2.3%, and for the last 12 months is 15.4%. Over the same period the benchmark SPY performance was 2.9% and 26.7% respectively. Over the previous week the market value of the iM 6-Stock Capital Strength Portfolio gained 0.78% at a time when SPY gained 1.02%. A starting capital of $100,000 at inception on 10/28/2016 would have grown to $181,738 which includes $3,123 cash and excludes $1,118 spent on fees and slippage. |
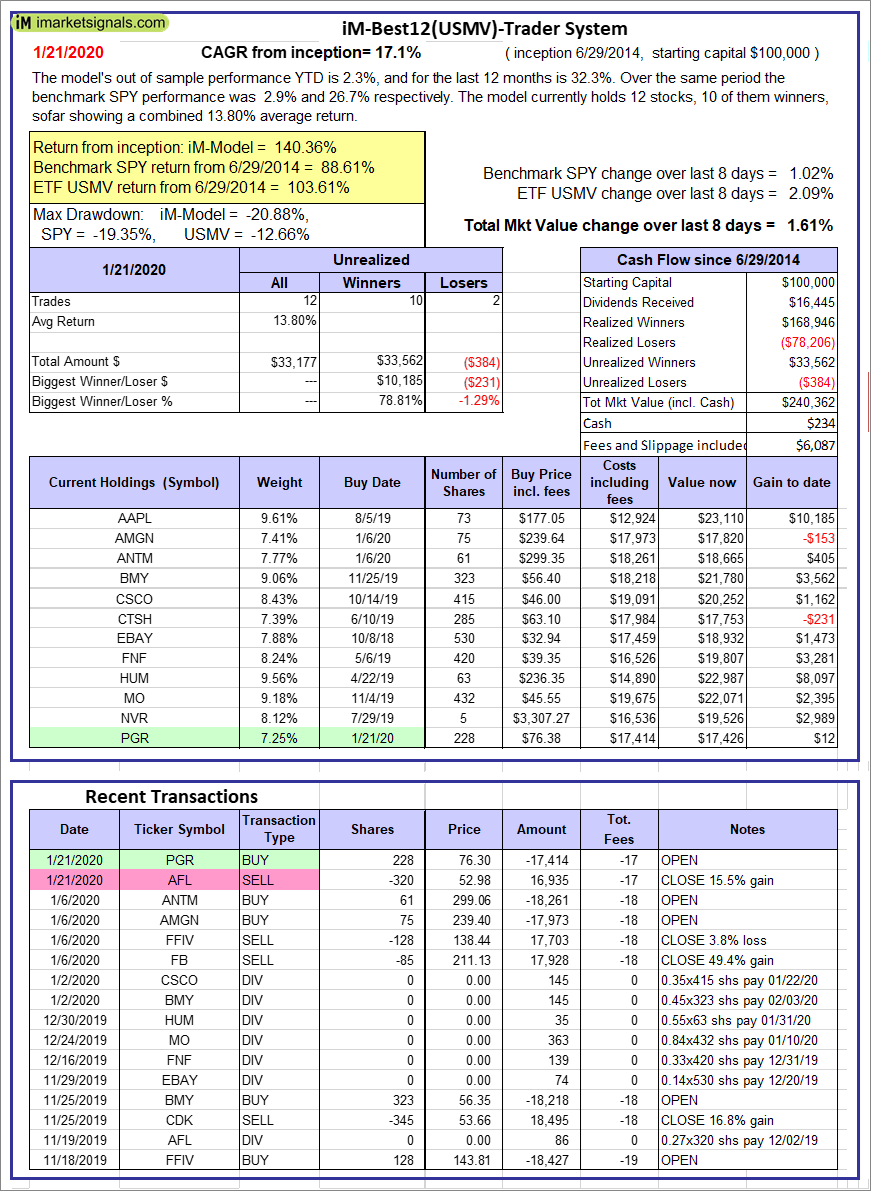 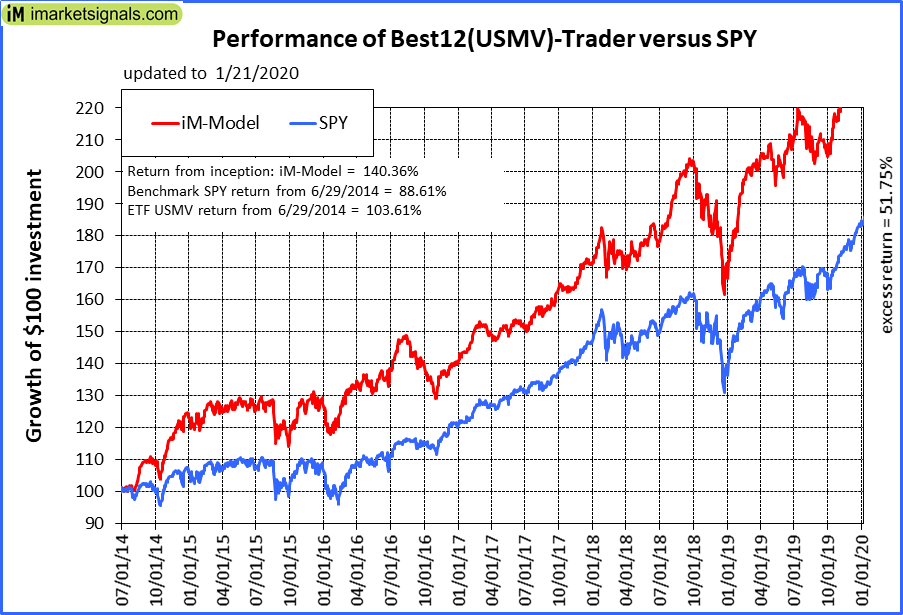 |
iM-Best12(USMV)-Trader: The model’s out of sample performance YTD is 2.3%, and for the last 12 months is 32.3%. Over the same period the benchmark SPY performance was 2.9% and 26.7% respectively. Since inception, on 6/30/2014, the model gained 140.36% while the benchmark SPY gained 88.61% and the ETF USMV gained 103.61% over the same period. Over the previous week the market value of iM-Best12(USMV)-Trader gained 1.61% at a time when SPY gained 1.02%. A starting capital of $100,000 at inception on 6/30/2014 would have grown to $240,362 which includes $234 cash and excludes $6,087 spent on fees and slippage. |
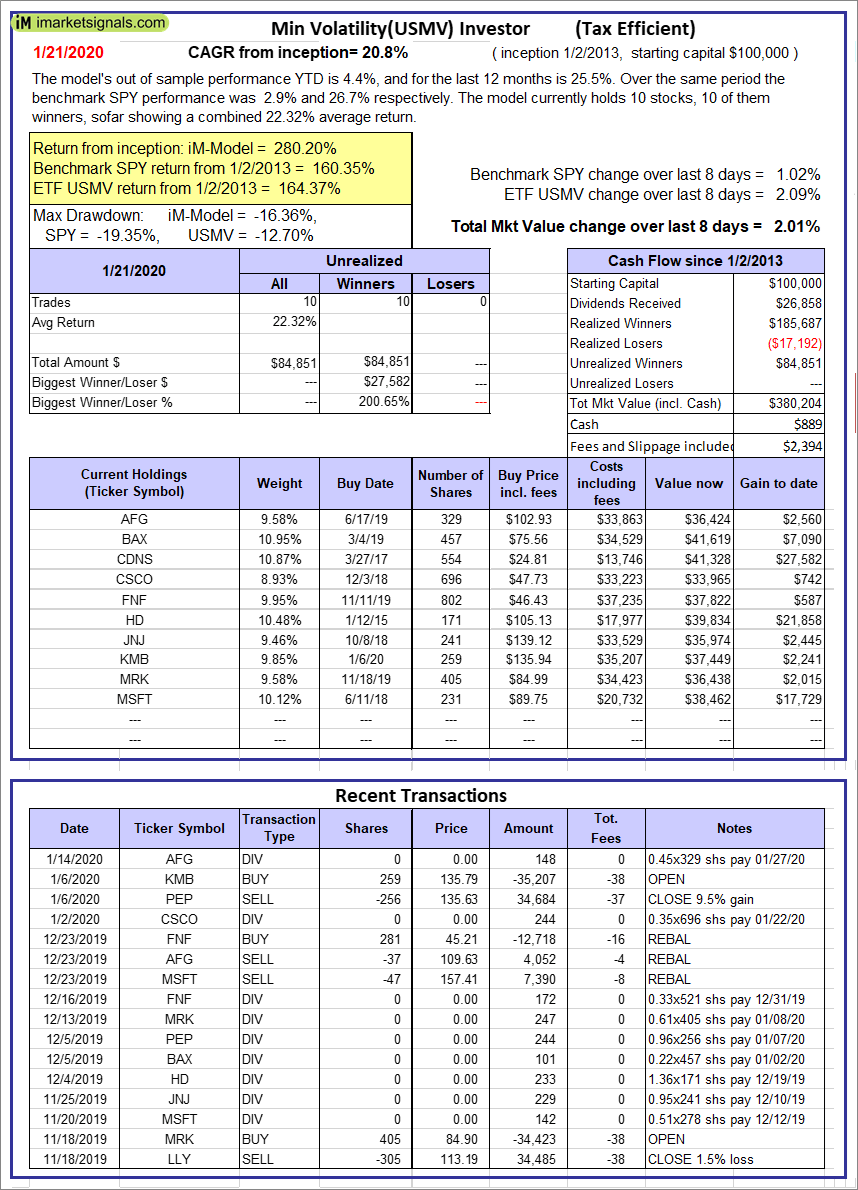 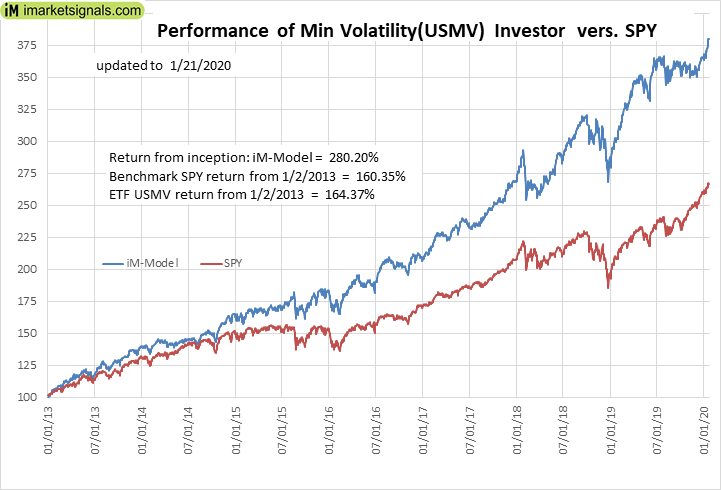 |
iM-Min Volatility(USMV) Investor (Tax Efficient): The model’s out of sample performance YTD is 4.4%, and for the last 12 months is 25.5%. Over the same period the benchmark SPY performance was 2.9% and 26.7% respectively. Since inception, on 1/3/2013, the model gained 280.20% while the benchmark SPY gained 160.35% and the ETF USMV gained 164.37% over the same period. Over the previous week the market value of iM-Best12(USMV)Q1 gained 2.01% at a time when SPY gained 1.02%. A starting capital of $100,000 at inception on 1/3/2013 would have grown to $380,204 which includes $889 cash and excludes $2,394 spent on fees and slippage. |
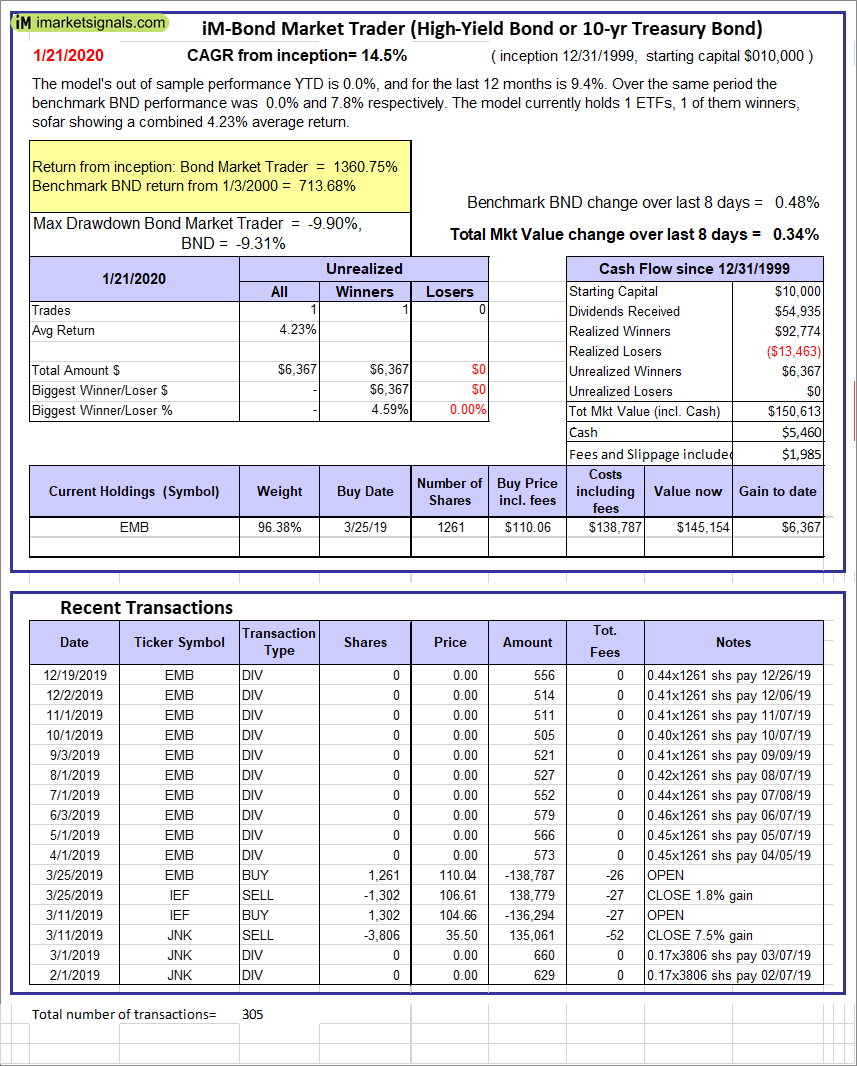 |
iM-Bond Market Trader (High-Yield Bond or 10-yr Treasury Bond): The model’s out of sample performance YTD is 3.6%, and for the last 12 months is 18.8%. Over the same period the benchmark SPY performance was 2.9% and 26.7% respectively. Over the previous week the market value of the iM-Bond Market Trader (High-Yield Bond or 10-yr Treasury Bond) gained 0.34% at a time when BND gained 0.48%. A starting capital of $100,000 at inception on 10/30/2016 would have grown to $150,613 which includes $5,460 cash and excludes $1,985 spent on fees and slippage. |
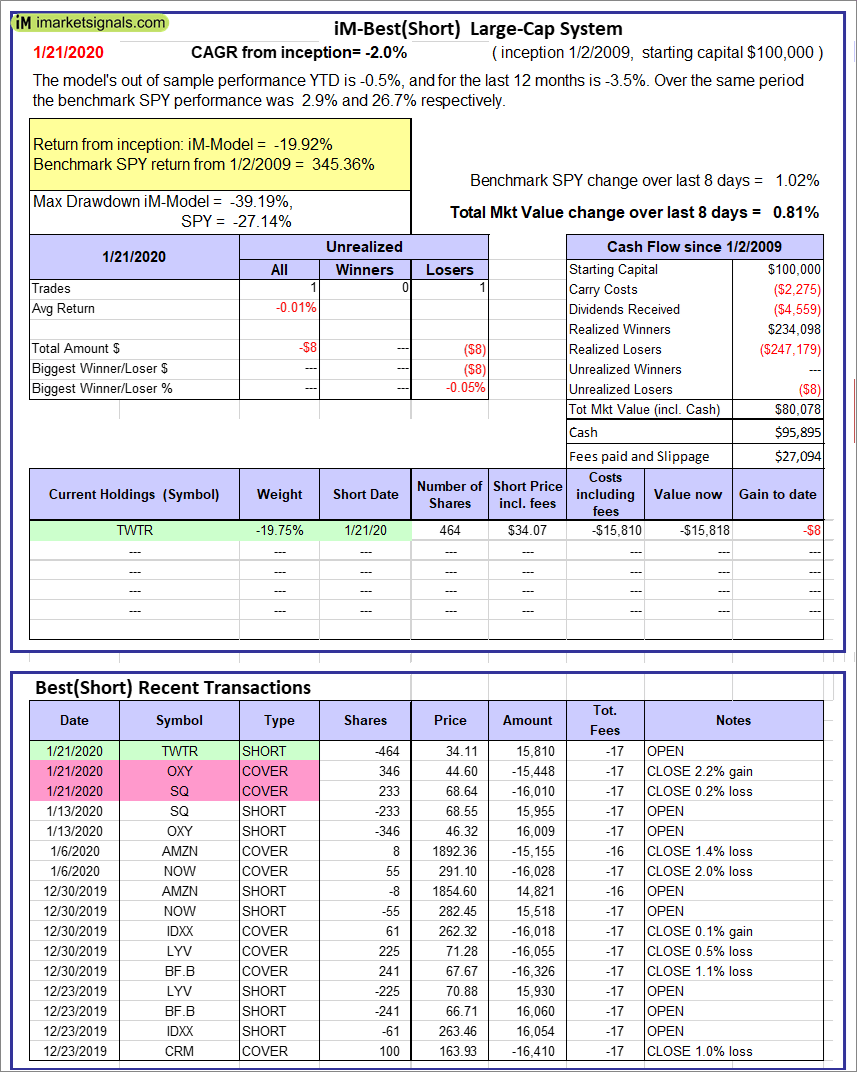 |
iM-Best(Short): The model’s out of sample performance YTD is -0.5%, and for the last 12 months is -3.5%. Over the same period the benchmark SPY performance was 2.9% and 26.7% respectively. Over the previous week the market value of iM-Best(Short) gained 0.81% at a time when SPY gained 1.02%. Over the period 1/2/2009 to 1/21/2020 the starting capital of $100,000 would have grown to $80,078 which includes $95,895 cash and excludes $27,094 spent on fees and slippage. |
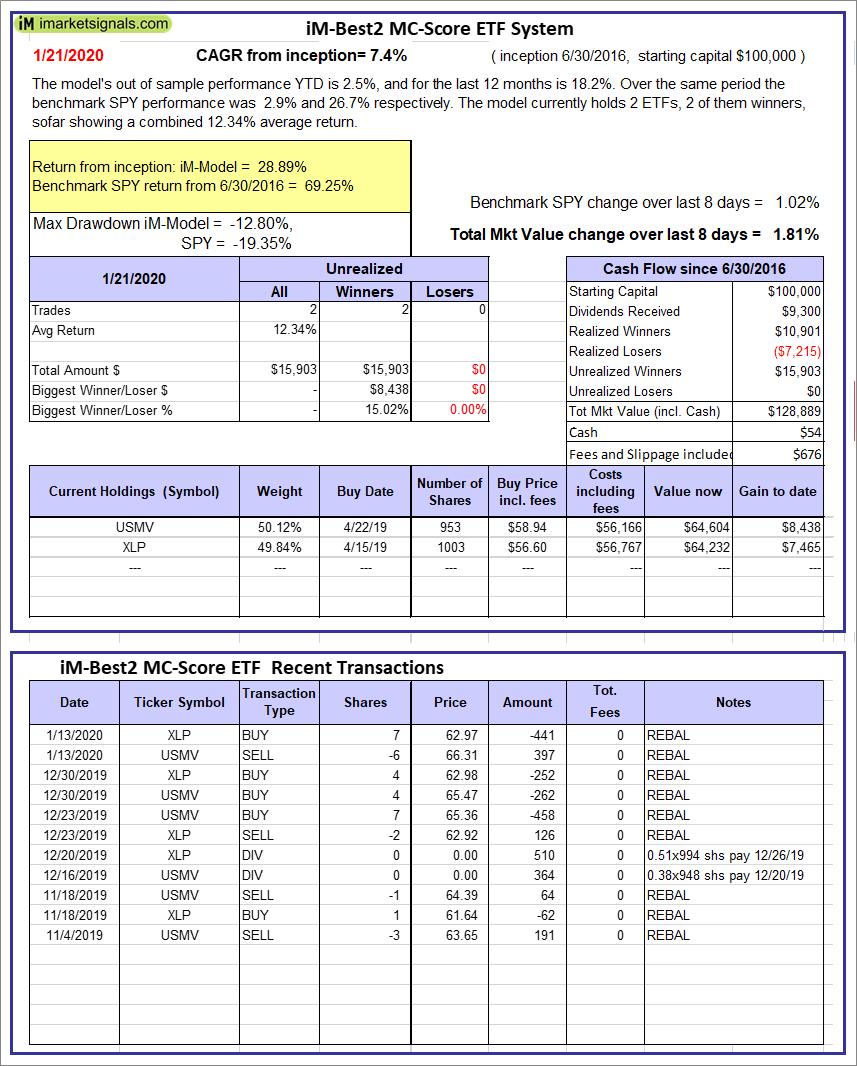 |
iM-Best2 MC-Score ETF System: The model’s out of sample performance YTD is 2.5%, and for the last 12 months is 18.2%. Over the same period the benchmark SPY performance was 2.9% and 26.7% respectively. Over the previous week the market value of the iM-Best2 MC-Score ETF System gained 1.81% at a time when SPY gained 1.02%. A starting capital of $100,000 at inception on 6/30/2016 would have grown to $128,889 which includes $54 cash and excludes $676 spent on fees and slippage. |
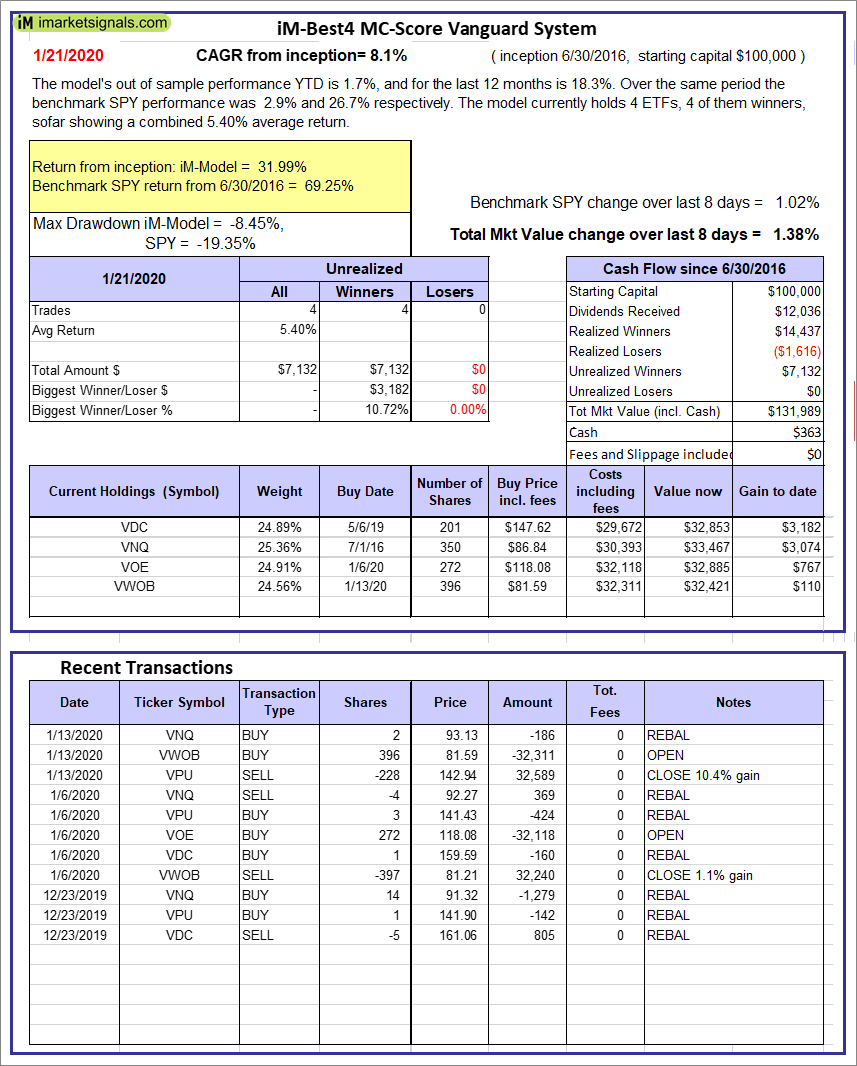 |
iM-Best4 MC-Score Vanguard System: The model’s out of sample performance YTD is 1.7%, and for the last 12 months is 18.3%. Over the same period the benchmark SPY performance was 2.9% and 26.7% respectively. Over the previous week the market value of the iM-Best4 MC-Score Vanguard System gained 1.38% at a time when SPY gained 1.02%. A starting capital of $100,000 at inception on 6/30/2016 would have grown to $131,989 which includes $363 cash and excludes $00 spent on fees and slippage. |
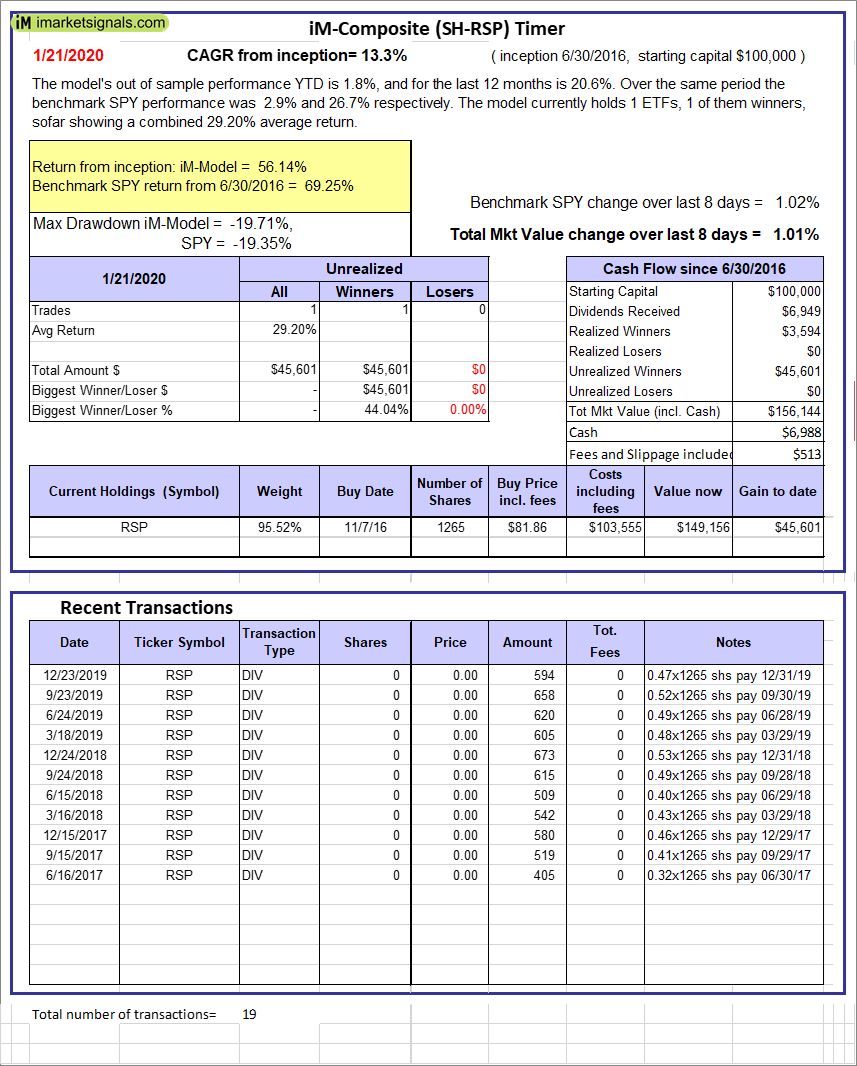 |
iM-Composite (SH-RSP) Timer: The model’s out of sample performance YTD is 1.8%, and for the last 12 months is 20.6%. Over the same period the benchmark SPY performance was 2.9% and 26.7% respectively. Over the previous week the market value of the iM-Composite (SH-RSP) Timer gained 1.01% at a time when SPY gained 1.02%. A starting capital of $100,000 at inception on 6/30/2016 would have grown to $156,144 which includes $6,988 cash and excludes $513 spent on fees and slippage. |
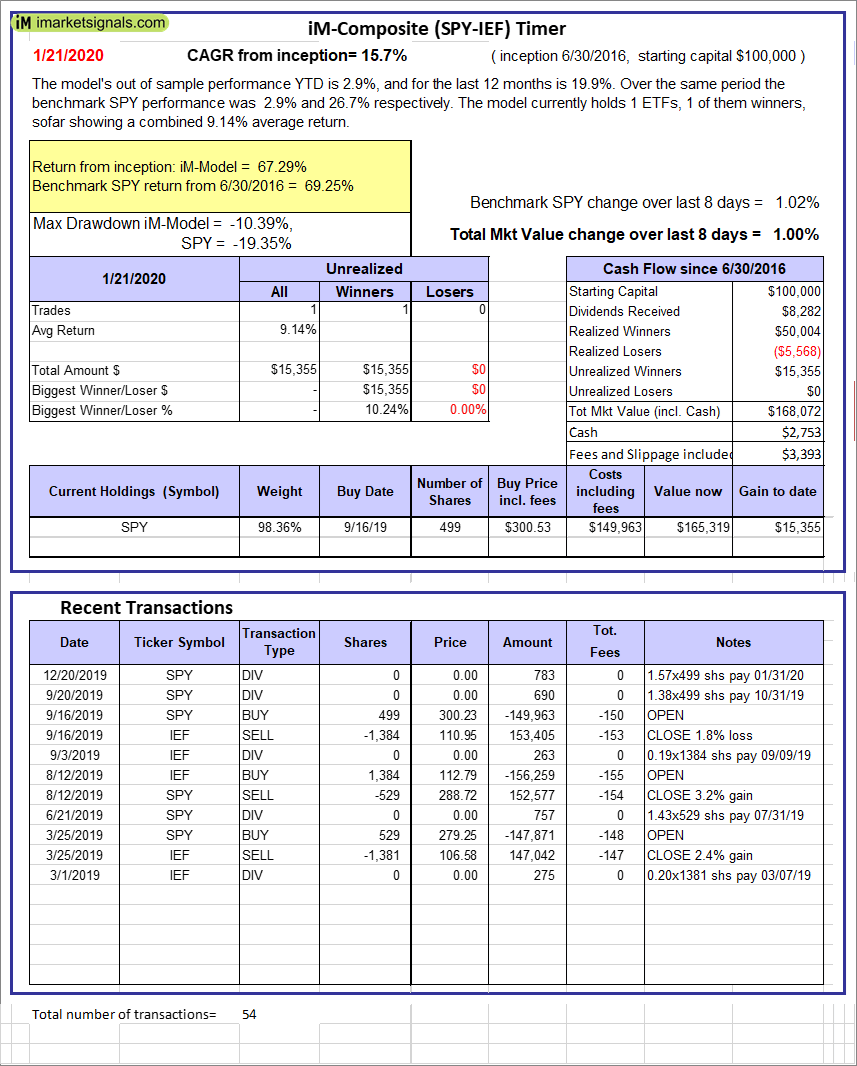 |
iM-Composite (SPY-IEF) Timer: The model’s out of sample performance YTD is 2.9%, and for the last 12 months is 19.9%. Over the same period the benchmark SPY performance was 2.9% and 26.7% respectively. Over the previous week the market value of the iM-Composite (SPY-IEF) Timer gained 1.00% at a time when SPY gained 1.02%. A starting capital of $100,000 at inception on 6/30/2016 would have grown to $168,072 which includes $2,753 cash and excludes $3,393 spent on fees and slippage. |
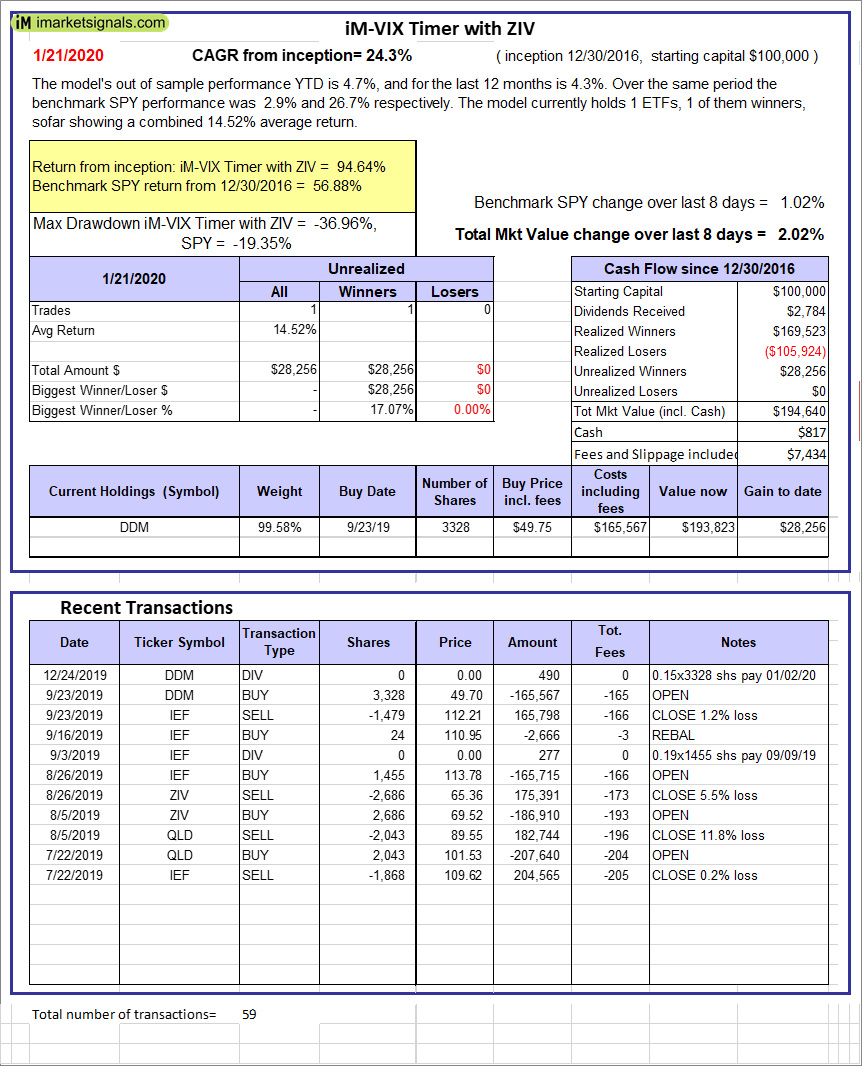 |
iM-VIX Timer with ZIV: The model’s out of sample performance YTD is 4.7%, and for the last 12 months is 4.3%. Over the same period the benchmark SPY performance was 2.9% and 26.7% respectively. Over the previous week the market value of the iM-VIX Timer with ZIV gained 2.02% at a time when SPY gained 1.02%. A starting capital of $100,000 at inception on 6/30/2016 would have grown to $194,640 which includes $817 cash and excludes $7,434 spent on fees and slippage. |
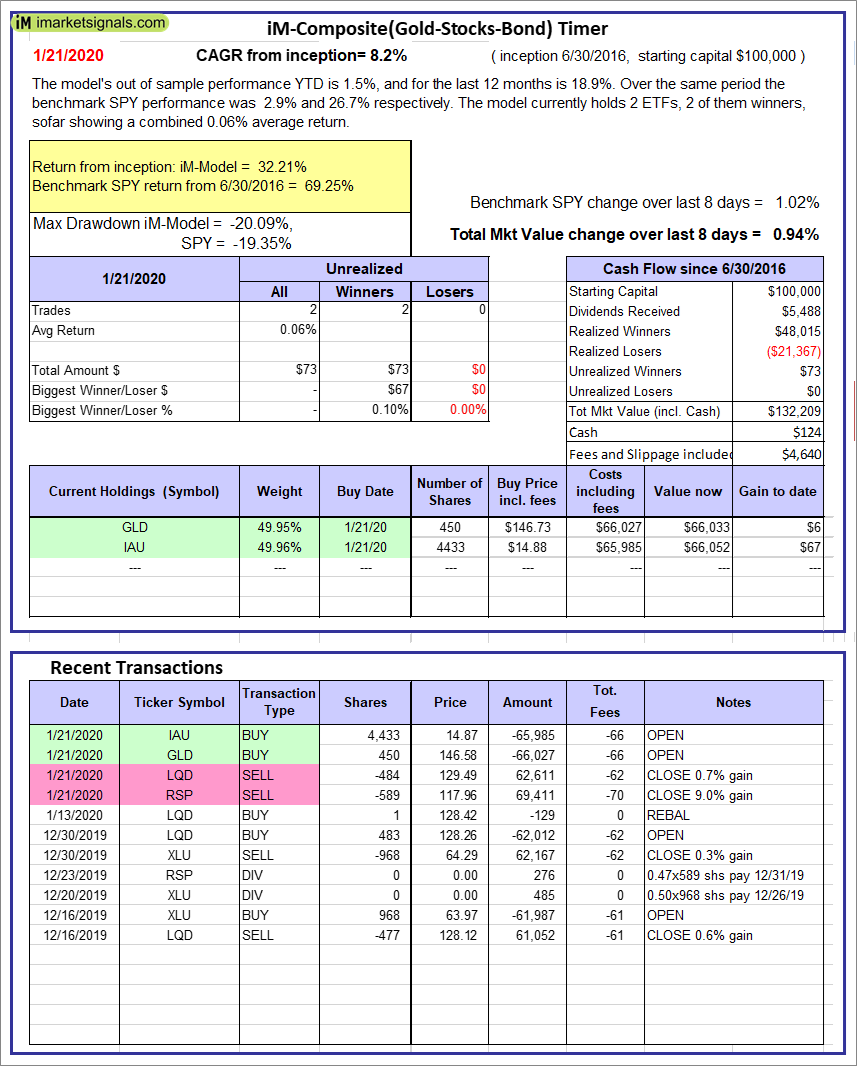 |
iM-Composite(Gold-Stocks-Bond) Timer: The model’s out of sample performance YTD is 1.5%, and for the last 12 months is 18.9%. Over the same period the benchmark SPY performance was 2.9% and 26.7% respectively. Over the previous week the market value of the iM-Composite(Gold-Stocks-Bond) Timer gained 0.94% at a time when SPY gained 1.02%. A starting capital of $100,000 at inception on 6/30/2016 would have grown to $132,209 which includes $124 cash and excludes $4,640 spent on fees and slippage. |
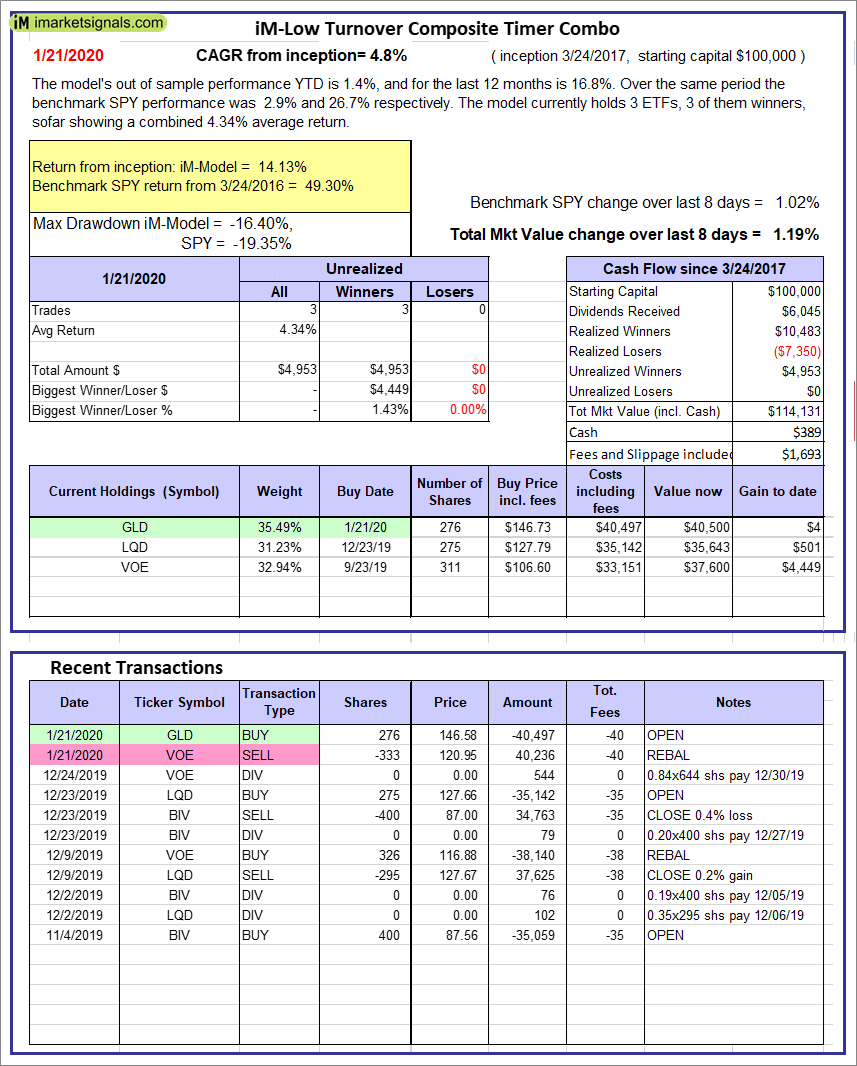 |
iM-Low Turnover Composite Timer Combo: The model’s out of sample performance YTD is 1.4%, and for the last 12 months is 16.8%. Over the same period the benchmark SPY performance was 2.9% and 26.7% respectively. Over the previous week the market value of the iM-Low Turnover Composite Timer Combo gained 1.19% at a time when SPY gained 1.02%. A starting capital of $100,000 at inception on 3/24/27 would have grown to $114,131 which includes $389 cash and excludes $1,693 spent on fees and slippage. |
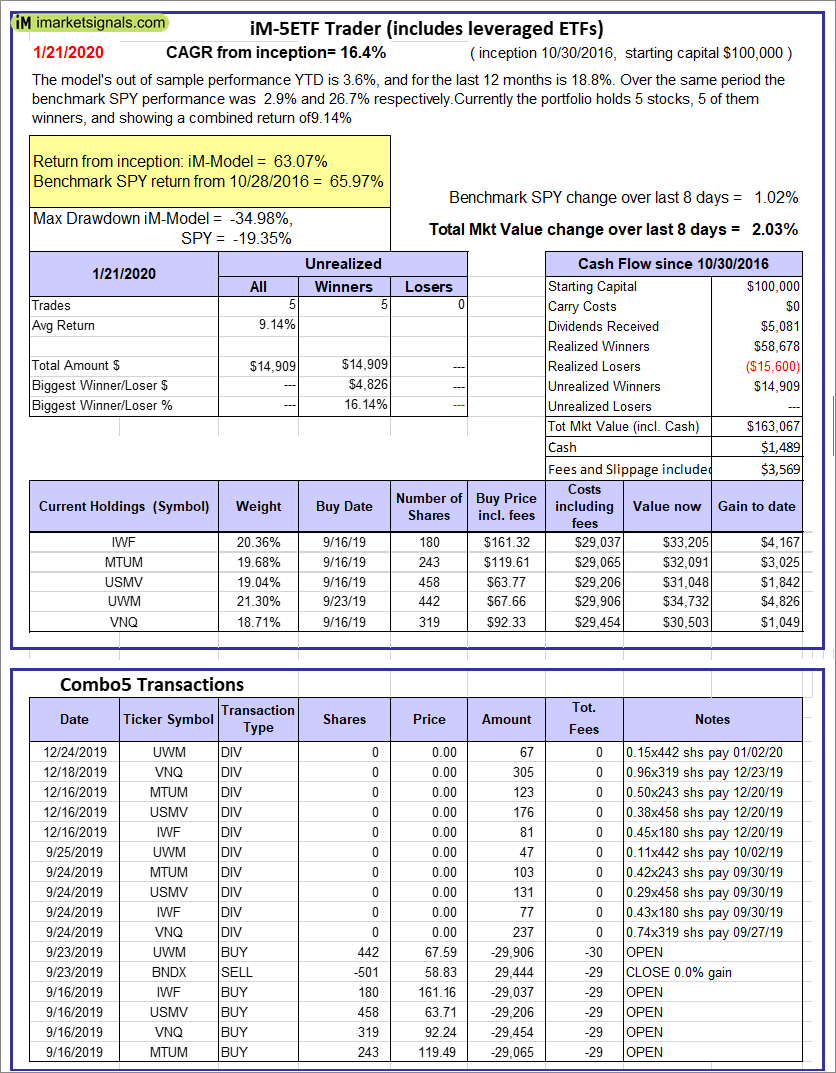 |
iM-5ETF Trader (includes leveraged ETFs): The model’s out of sample performance YTD is 3.6%, and for the last 12 months is 18.8%. Over the same period the benchmark SPY performance was 2.9% and 26.7% respectively. Over the previous week the market value of the iM-5ETF Trader (includes leveraged ETFs) gained 2.03% at a time when SPY gained 1.02%. A starting capital of $100,000 at inception on 10/30/2016 would have grown to $163,067 which includes $1,489 cash and excludes $3,569 spent on fees and slippage. |
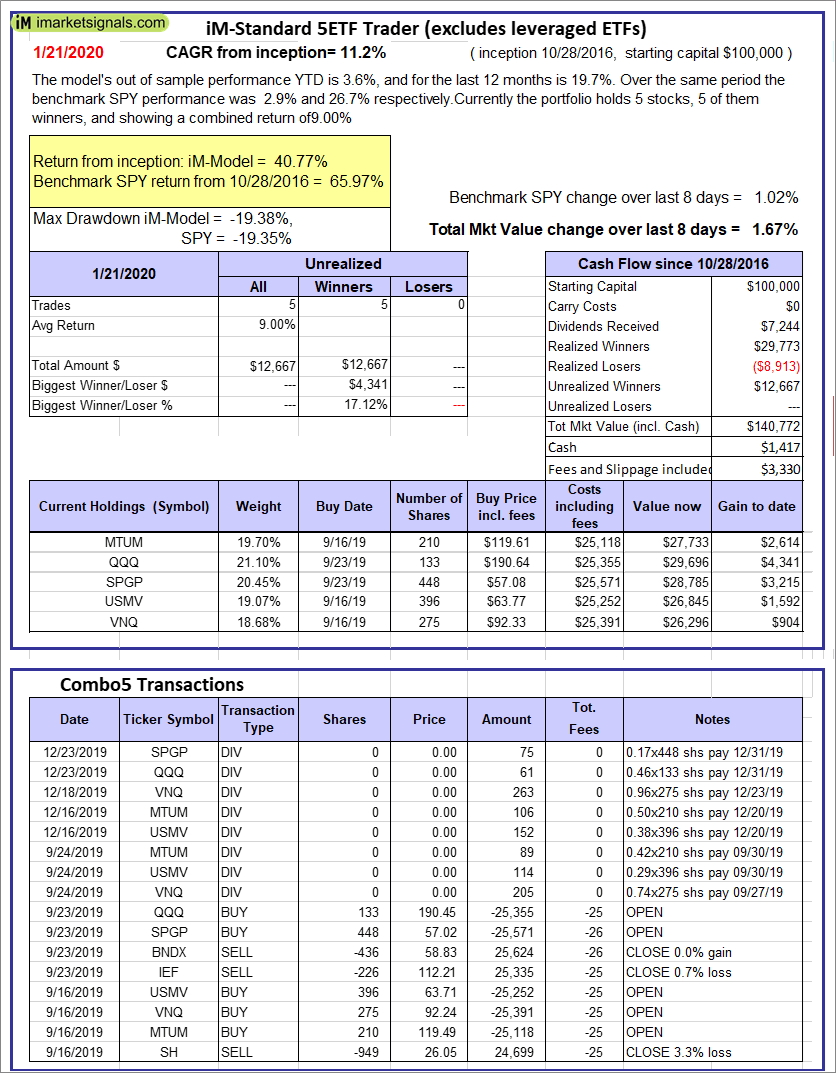 |
iM-Standard 5ETF Trader (excludes leveraged ETFs): The model’s out of sample performance YTD is 3.6%, and for the last 12 months is 19.7%. Over the same period the benchmark SPY performance was 2.9% and 26.7% respectively. Over the previous week the market value of the iM-Standard 5ETF Trader (excludes leveraged ETFs) gained 1.67% at a time when SPY gained 1.02%. A starting capital of $100,000 at inception on 10/30/2016 would have grown to $140,772 which includes $1,417 cash and excludes $3,330 spent on fees and slippage. |
iM-Best Reports – 1/21/2020
Posted in pmp SPY-SH
Leave a Reply
You must be logged in to post a comment.