
  |
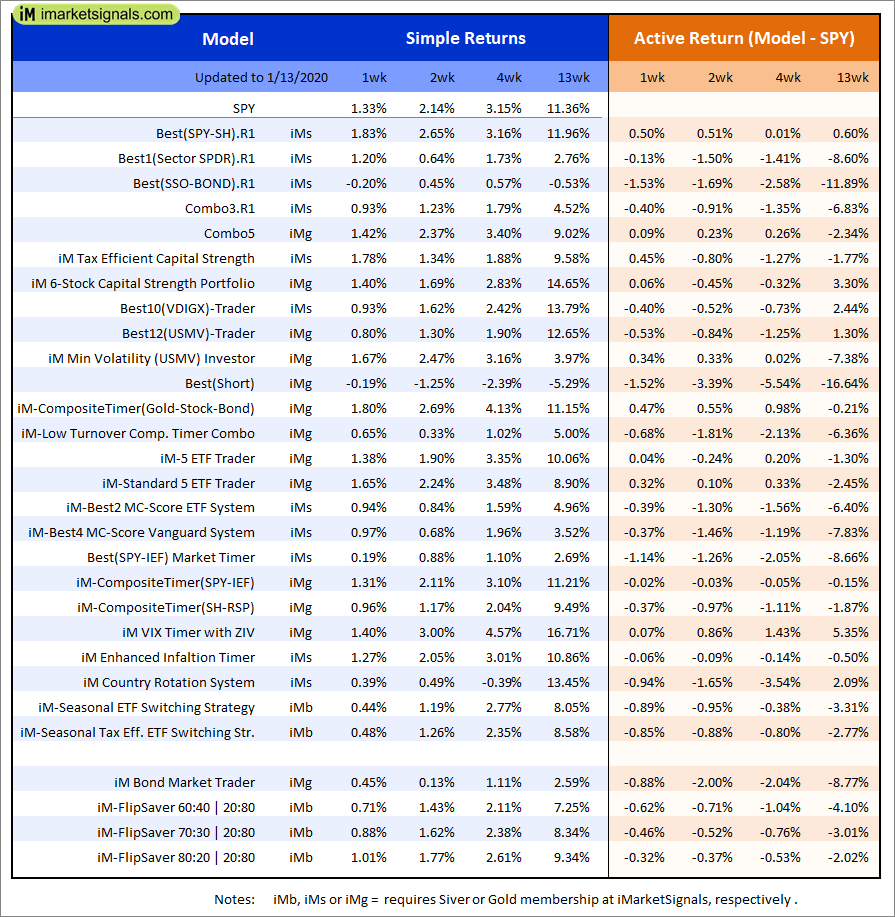
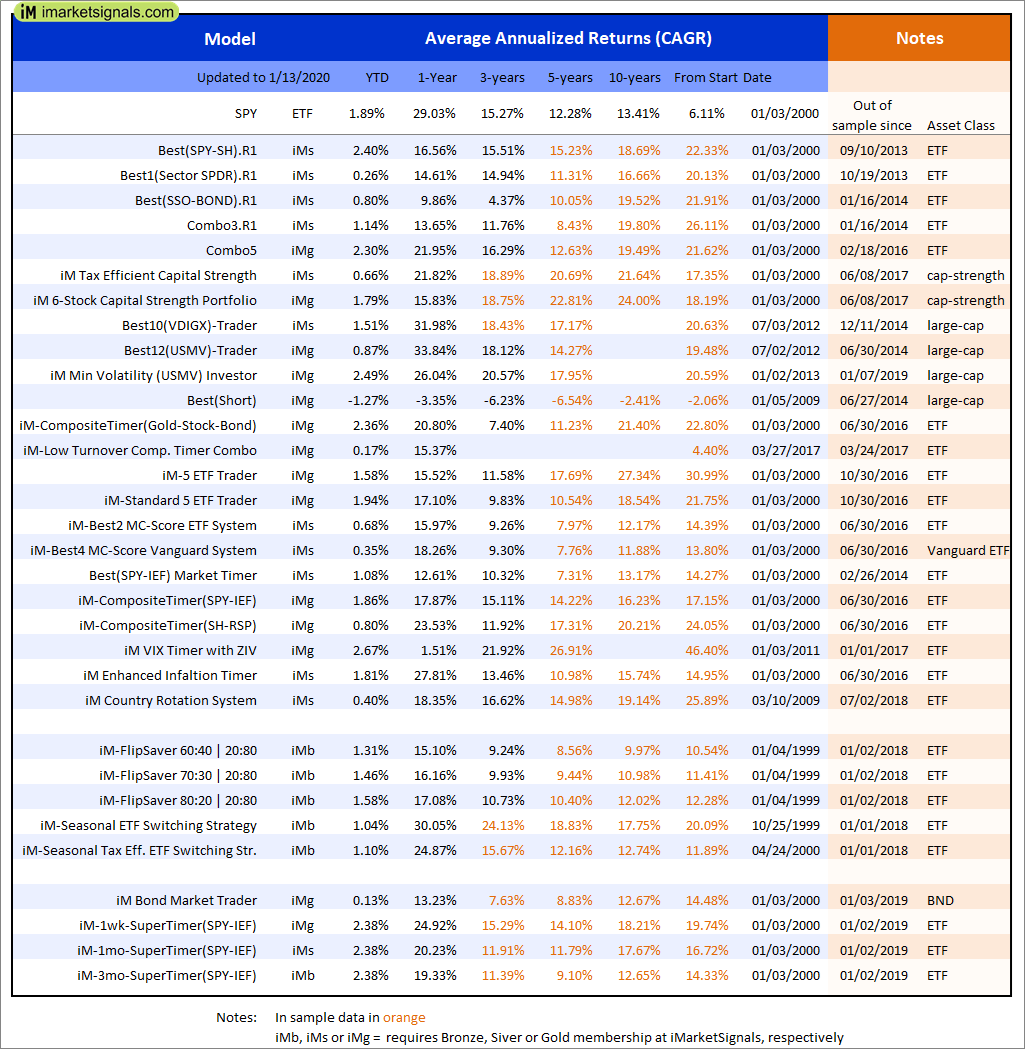
Out of sample performance summary of our models for the past 1, 2, 4 and 13 week periods. The active active return indicates how the models over- or underperformed the benchmark ETF SPY. Also the YTD, and the 1-, 3-, 5- and 10-year annualized returns are shown in the second table |
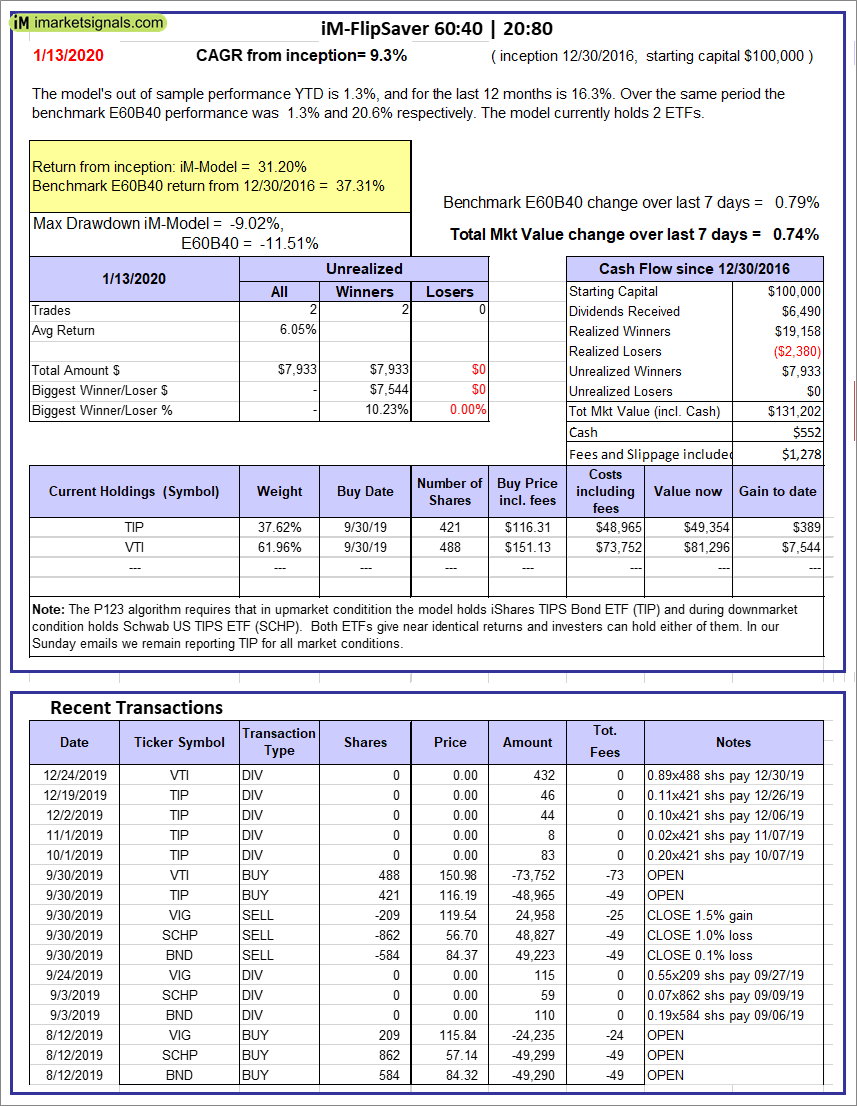 |
iM-FlipSaver 60:40 | 20:80 – 2017: The model’s out of sample performance YTD is 1.3%, and for the last 12 months is 16.3%. Over the same period the benchmark E60B40 performance was 1.3% and 20.6% respectively. Over the previous week the market value of iM-FlipSaver 80:20 | 20:80 gained 0.74% at a time when SPY gained 0.79%. A starting capital of $100,000 at inception on 7/16/2015 would have grown to $131,202 which includes $552 cash and excludes $1,278 spent on fees and slippage. |
 |
iM-FlipSaver 70:30 | 20:80 – 2017: The model’s out of sample performance YTD is 1.5%, and for the last 12 months is 17.2%. Over the same period the benchmark E60B40 performance was 1.3% and 20.6% respectively. Over the previous week the market value of iM-FlipSaver 70:30 | 20:80 gained 0.88% at a time when SPY gained 0.79%. A starting capital of $100,000 at inception on 7/15/2015 would have grown to $134,552 which includes $466 cash and excludes $1,408 spent on fees and slippage. |
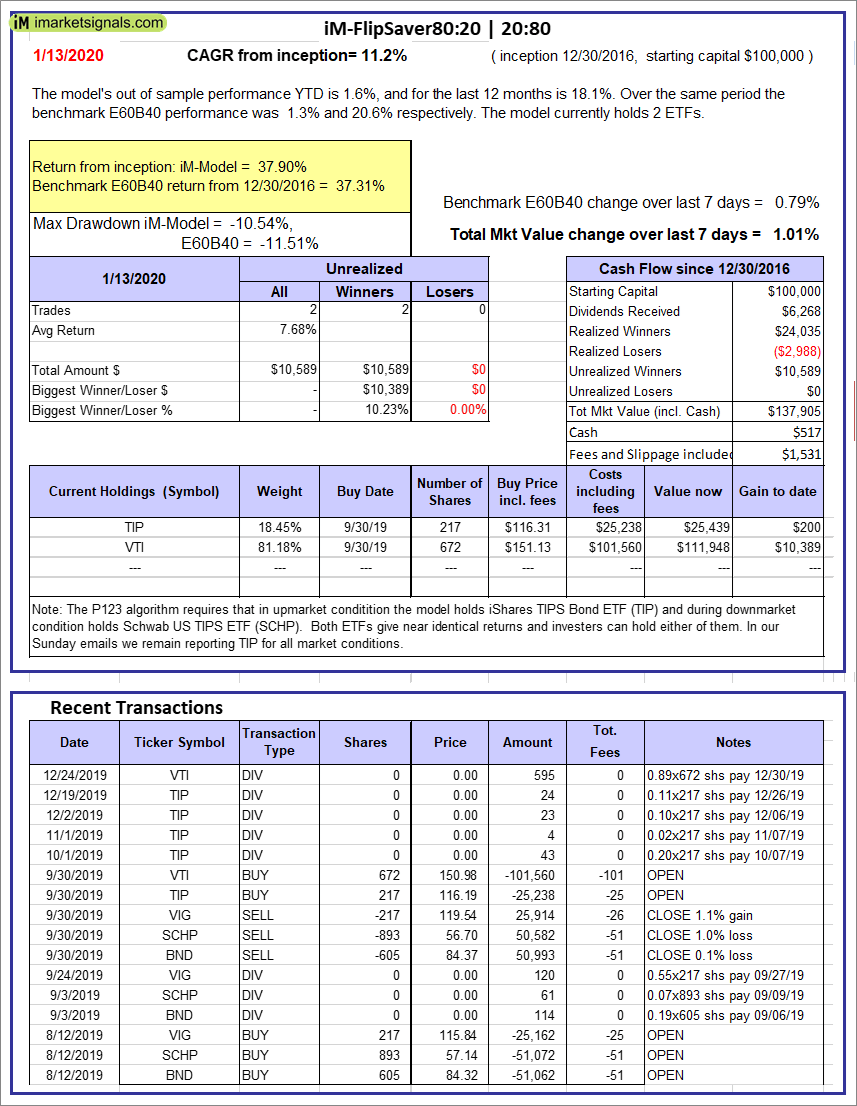 |
iM-FlipSaver 80:20 | 20:80 – 2017: The model’s out of sample performance YTD is 1.6%, and for the last 12 months is 18.1%. Over the same period the benchmark E60B40 performance was 1.3% and 20.6% respectively. Over the previous week the market value of iM-FlipSaver 80:20 | 20:80 gained 1.01% at a time when SPY gained 0.79%. A starting capital of $100,000 at inception on 1/2/2017 would have grown to $137,905 which includes $517 cash and excludes $1,531 spent on fees and slippage. |
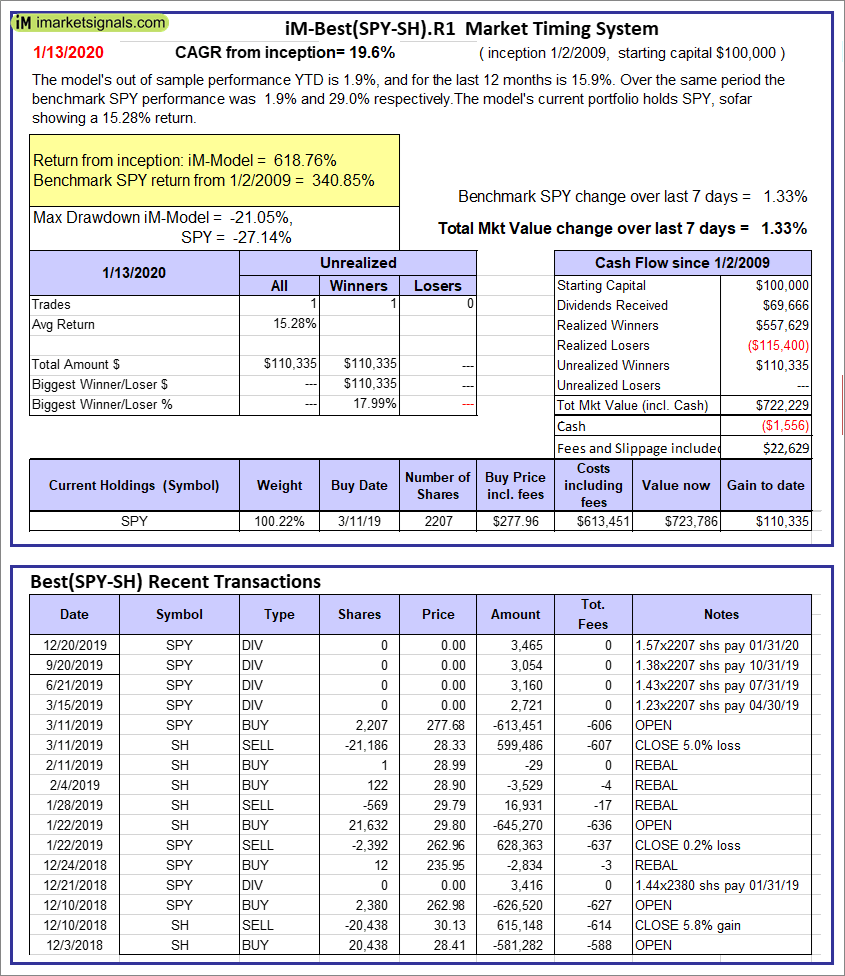 |
iM-Best(SPY-SH).R1: The model’s out of sample performance YTD is 1.9%, and for the last 12 months is 15.9%. Over the same period the benchmark SPY performance was 1.9% and 29.0% respectively. Over the previous week the market value of Best(SPY-SH) gained 1.33% at a time when SPY gained 1.33%. A starting capital of $100,000 at inception on 1/2/2009 would have grown to $722,229 which includes -$1,556 cash and excludes $22,629 spent on fees and slippage. |
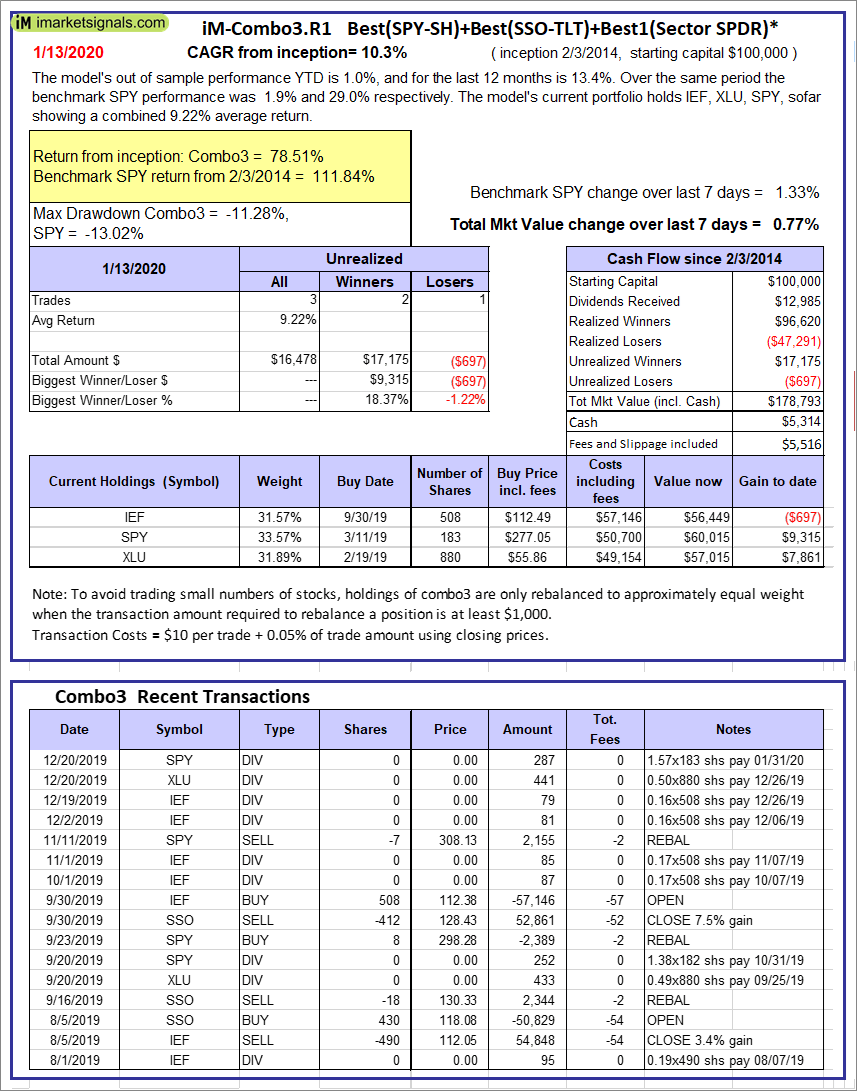 |
iM-Combo3.R1: The model’s out of sample performance YTD is 1.0%, and for the last 12 months is 13.4%. Over the same period the benchmark SPY performance was 1.9% and 29.0% respectively. Over the previous week the market value of iM-Combo3.R1 gained 0.77% at a time when SPY gained 1.33%. A starting capital of $100,000 at inception on 2/3/2014 would have grown to $178,793 which includes $5,314 cash and excludes $5,516 spent on fees and slippage. |
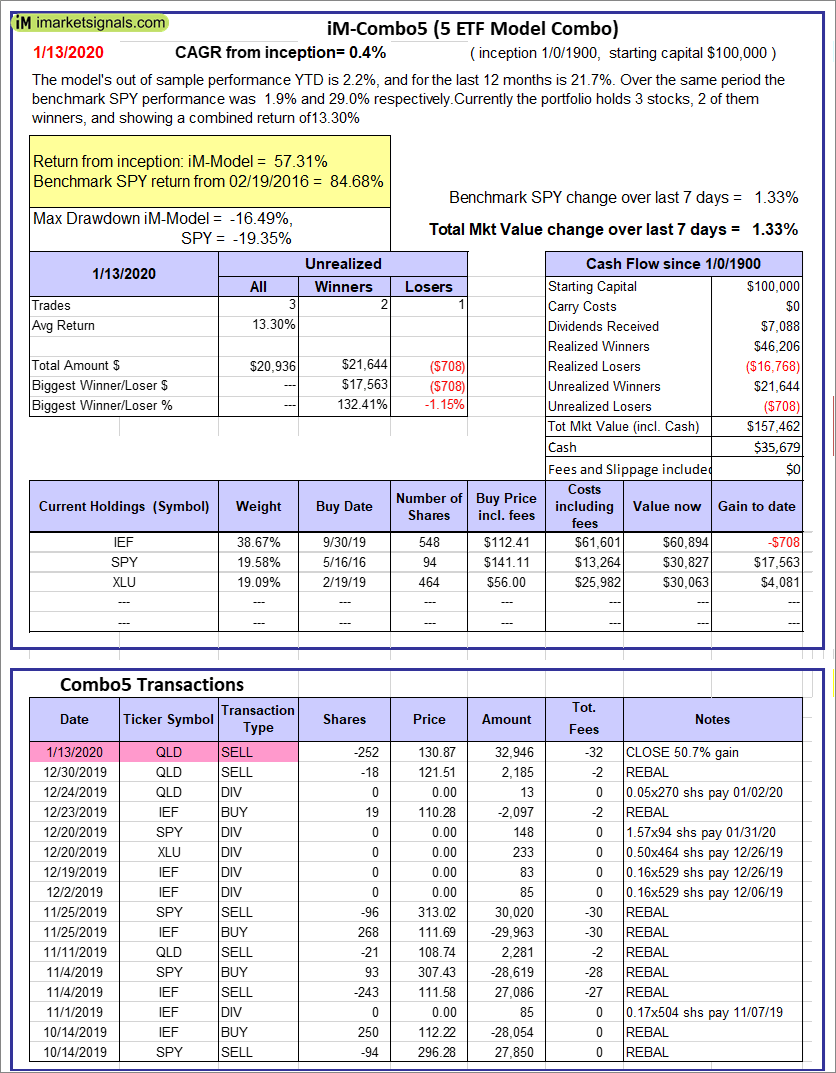 |
iM-Combo5: The model’s out of sample performance YTD is 2.2%, and for the last 12 months is 21.7%. Over the same period the benchmark SPY performance was 1.9% and 29.0% respectively. Over the previous week the market value of iM-Combo5 gained 1.33% at a time when SPY gained 1.33%. A starting capital of $100,000 at inception on 2/22/2016 would have grown to $157,462 which includes $35,679 cash and excludes $0 spent on fees and slippage. |
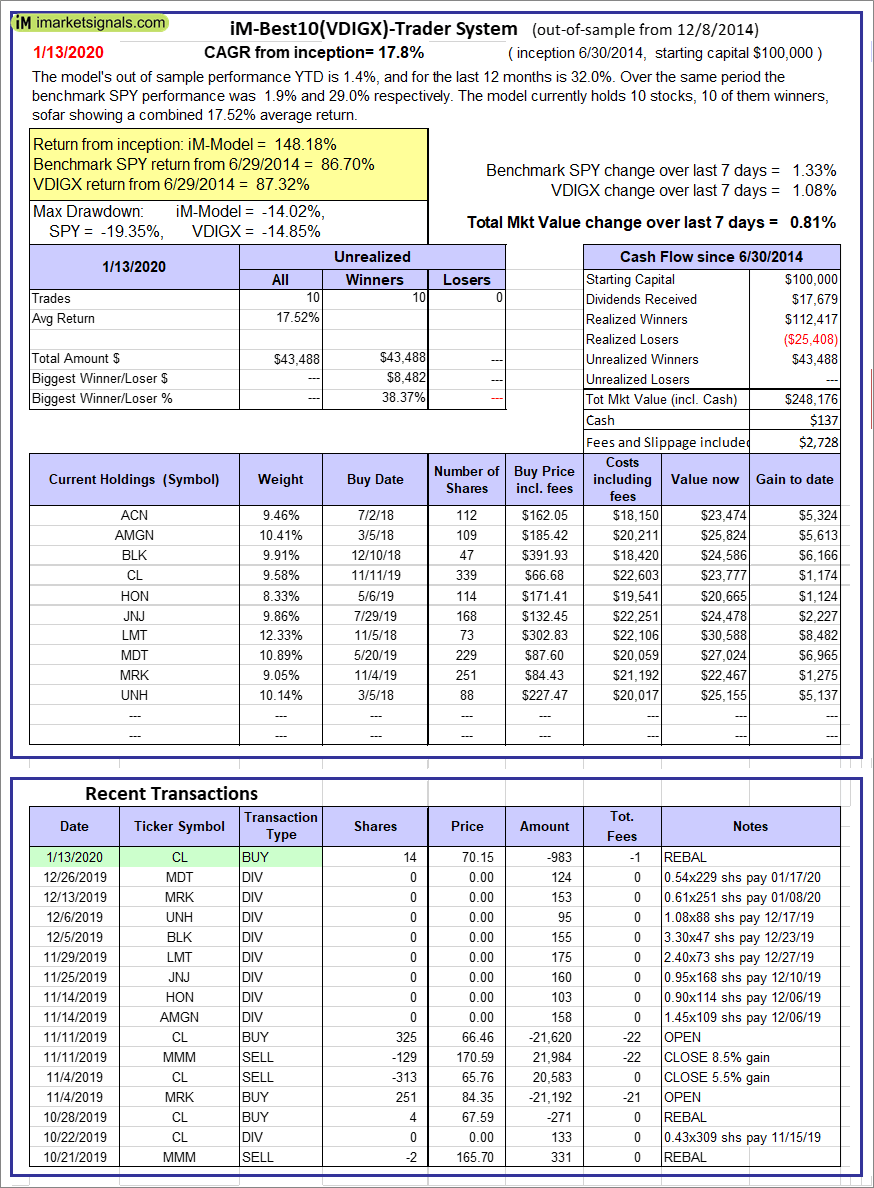 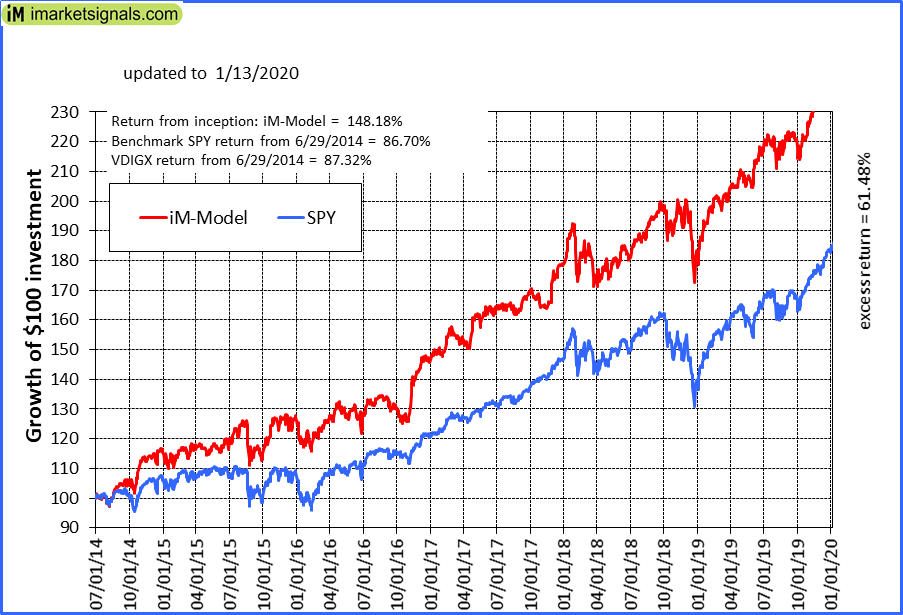 |
iM-Best10(VDIGX)-Trader: The model’s out of sample performance YTD is 1.4%, and for the last 12 months is 32.0%. Over the same period the benchmark SPY performance was 1.9% and 29.0% respectively. Since inception, on 7/1/2014, the model gained 148.18% while the benchmark SPY gained 86.70% and VDIGX gained 87.32% over the same period. Over the previous week the market value of iM-Best10(VDIGX) gained 0.81% at a time when SPY gained 1.33%. A starting capital of $100,000 at inception on 7/1/2014 would have grown to $248,176 which includes $137 cash and excludes $2,728 spent on fees and slippage. |
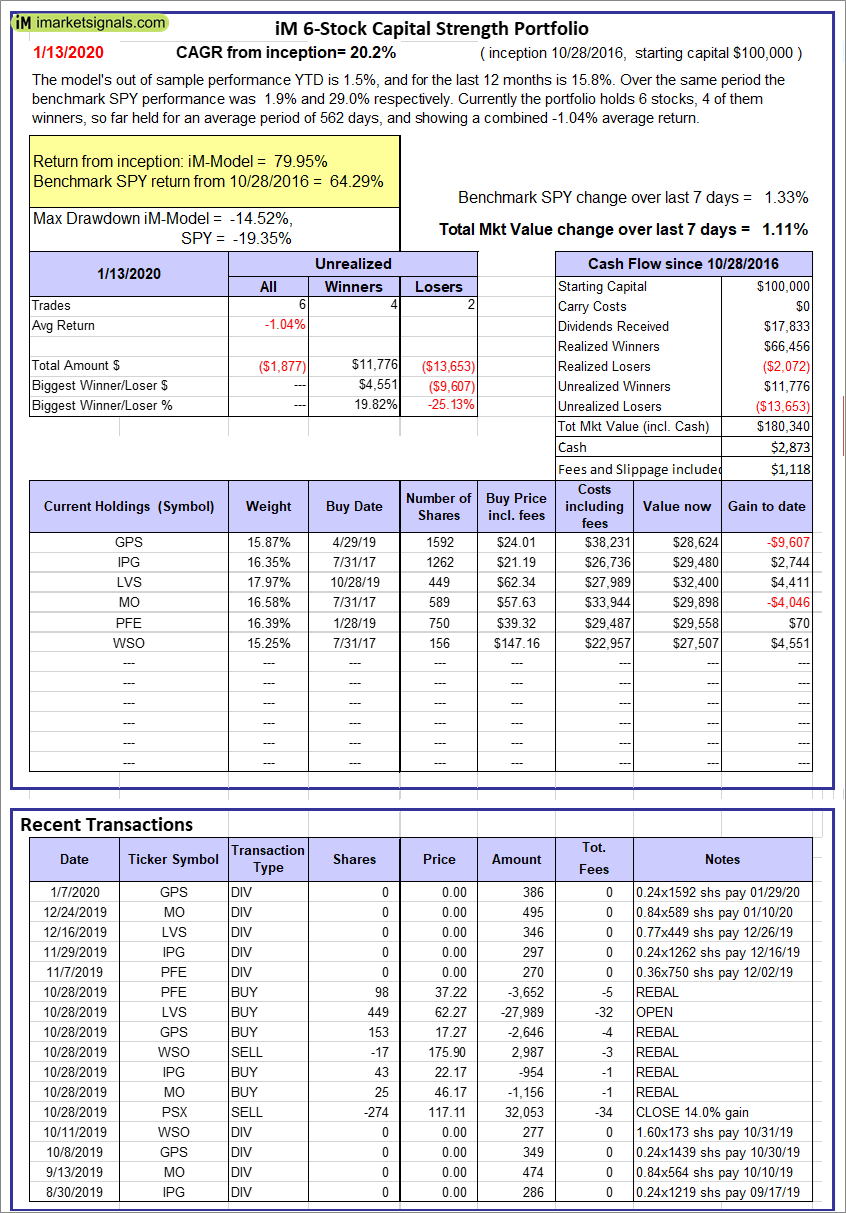 |
iM 6-Stock Capital Strength Portfolio: The model’s out of sample performance YTD is 1.5%, and for the last 12 months is 15.8%. Over the same period the benchmark SPY performance was 1.9% and 29.0% respectively. Over the previous week the market value of the iM 6-Stock Capital Strength Portfolio gained 1.11% at a time when SPY gained 1.33%. A starting capital of $100,000 at inception on 10/28/2016 would have grown to $180,340 which includes $2,873 cash and excludes $1,118 spent on fees and slippage. |
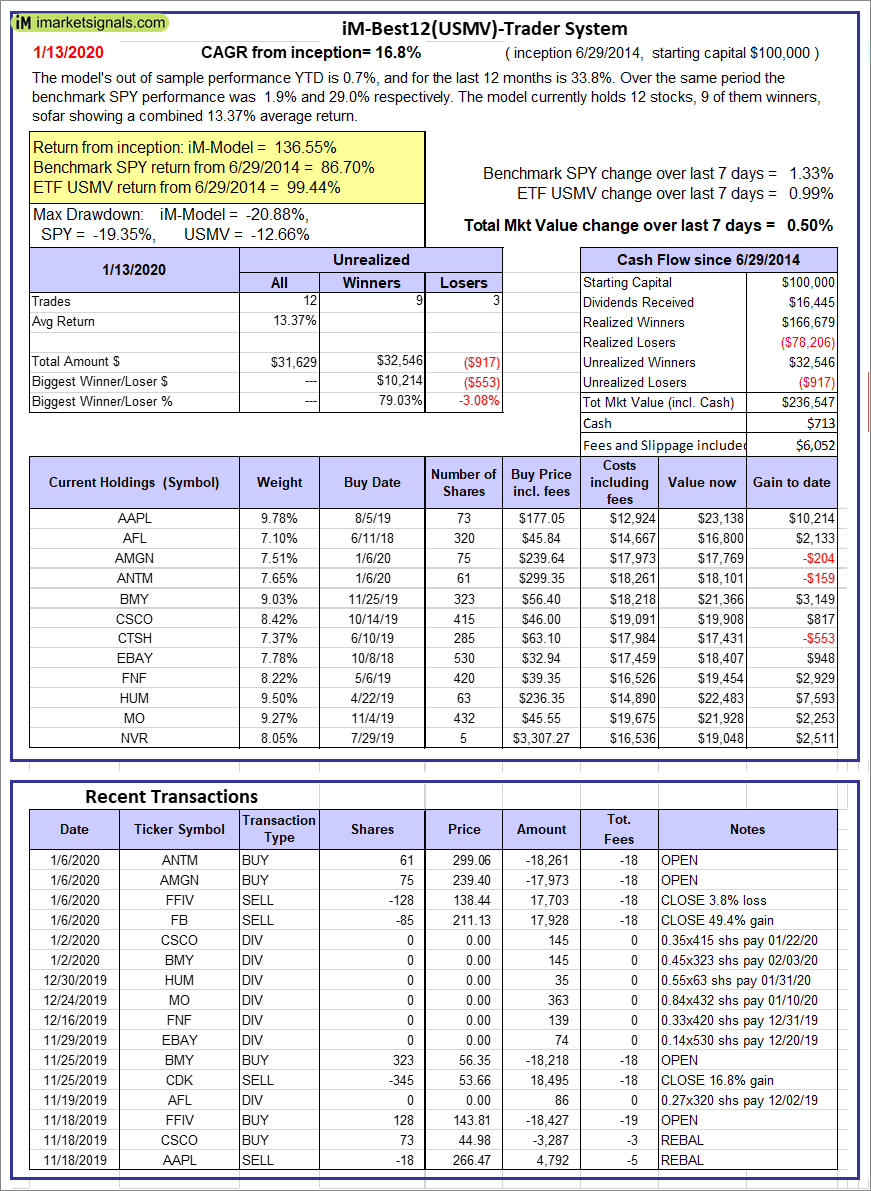 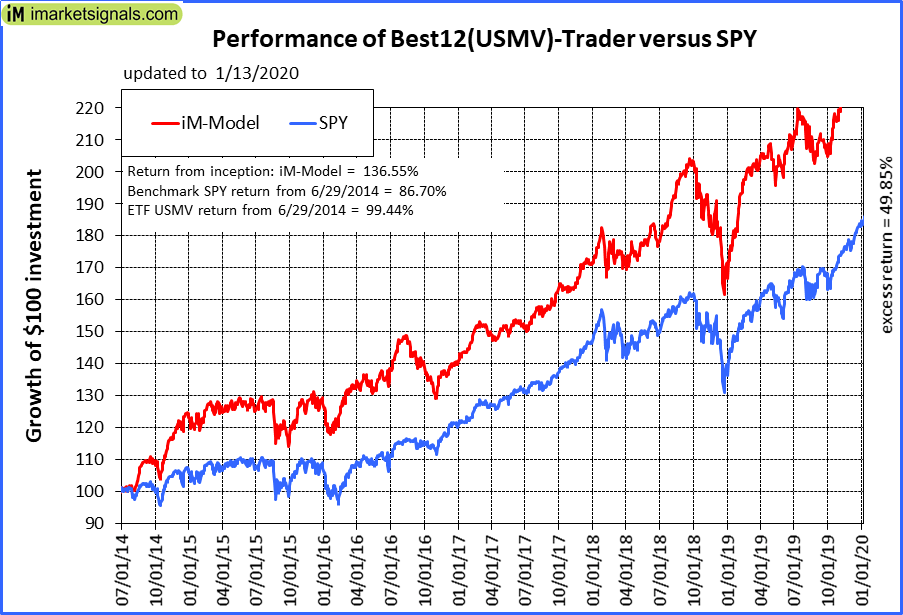 |
iM-Best12(USMV)-Trader: The model’s out of sample performance YTD is 0.7%, and for the last 12 months is 33.8%. Over the same period the benchmark SPY performance was 1.9% and 29.0% respectively. Since inception, on 6/30/2014, the model gained 136.55% while the benchmark SPY gained 86.70% and the ETF USMV gained 99.44% over the same period. Over the previous week the market value of iM-Best12(USMV)-Trader gained 0.50% at a time when SPY gained 1.33%. A starting capital of $100,000 at inception on 6/30/2014 would have grown to $236,547 which includes $713 cash and excludes $6,052 spent on fees and slippage. |
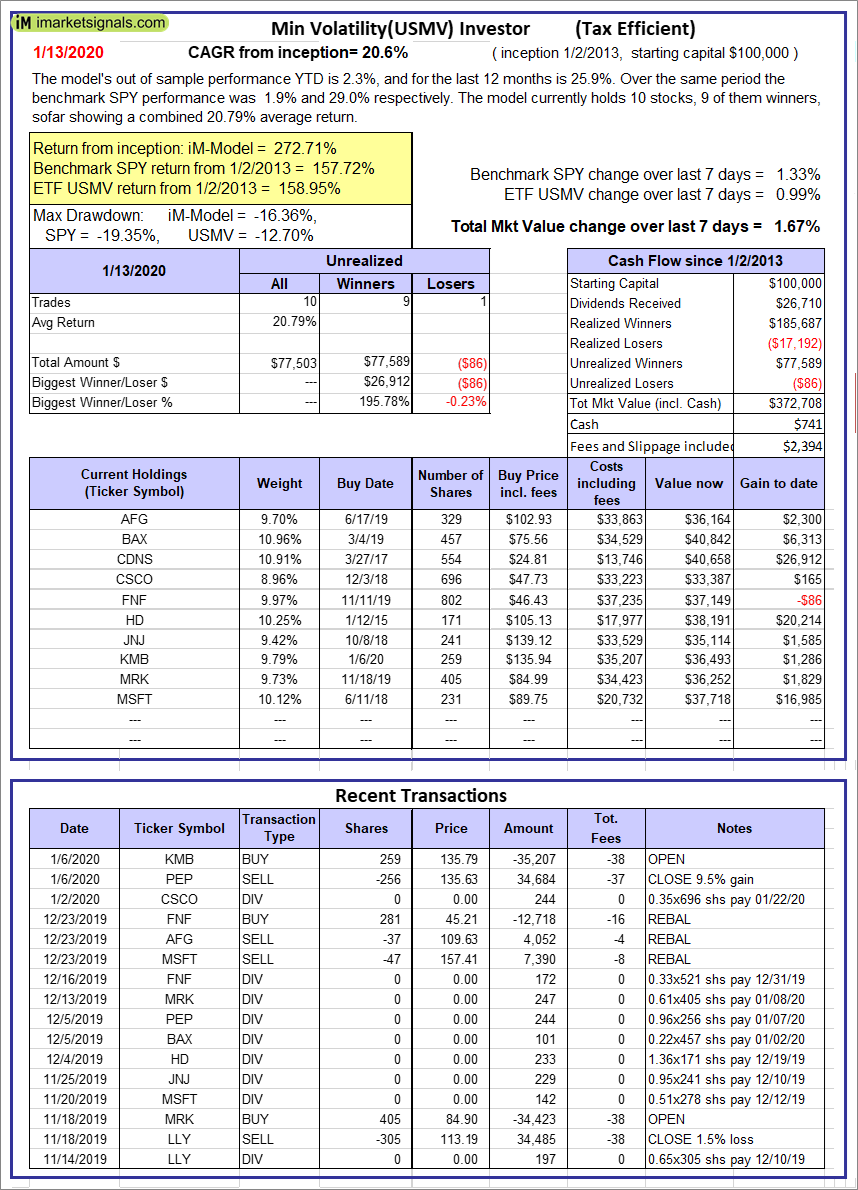 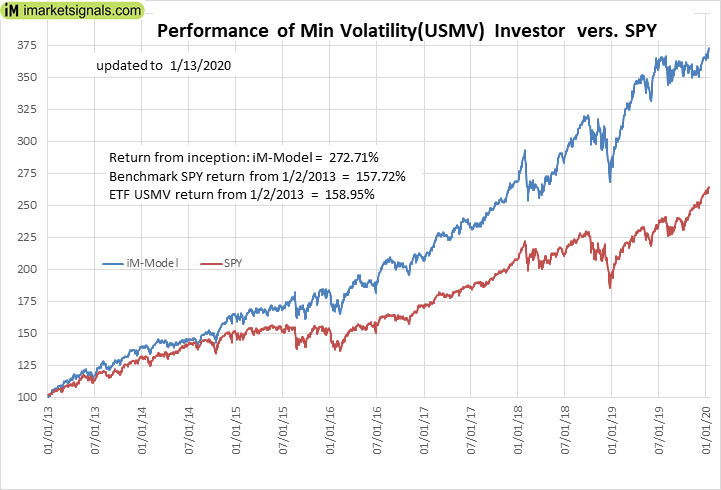 |
iM-Min Volatility(USMV) Investor (Tax Efficient): The model’s out of sample performance YTD is 2.3%, and for the last 12 months is 25.9%. Over the same period the benchmark SPY performance was 1.9% and 29.0% respectively. Since inception, on 1/3/2013, the model gained 272.71% while the benchmark SPY gained 157.72% and the ETF USMV gained 158.95% over the same period. Over the previous week the market value of iM-Best12(USMV)Q1 gained 1.67% at a time when SPY gained 1.33%. A starting capital of $100,000 at inception on 1/3/2013 would have grown to $372,708 which includes $741 cash and excludes $2,394 spent on fees and slippage. |
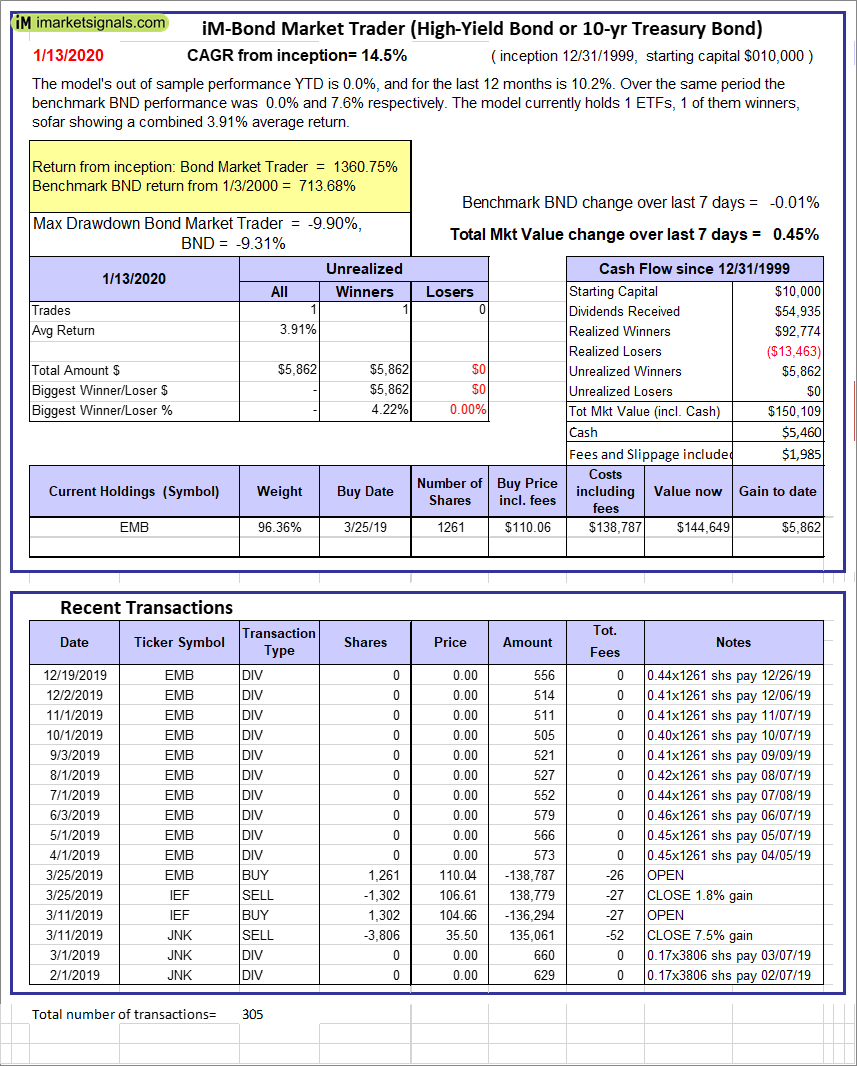 |
iM-Bond Market Trader (High-Yield Bond or 10-yr Treasury Bond): The model’s out of sample performance YTD is 1.6%, and for the last 12 months is 15.2%. Over the same period the benchmark SPY performance was 1.9% and 29.0% respectively. Over the previous week the market value of the iM-Bond Market Trader (High-Yield Bond or 10-yr Treasury Bond) gained 0.45% at a time when BND gained -0.01%. A starting capital of $100,000 at inception on 10/30/2016 would have grown to $150,109 which includes $5,460 cash and excludes $1,985 spent on fees and slippage. |
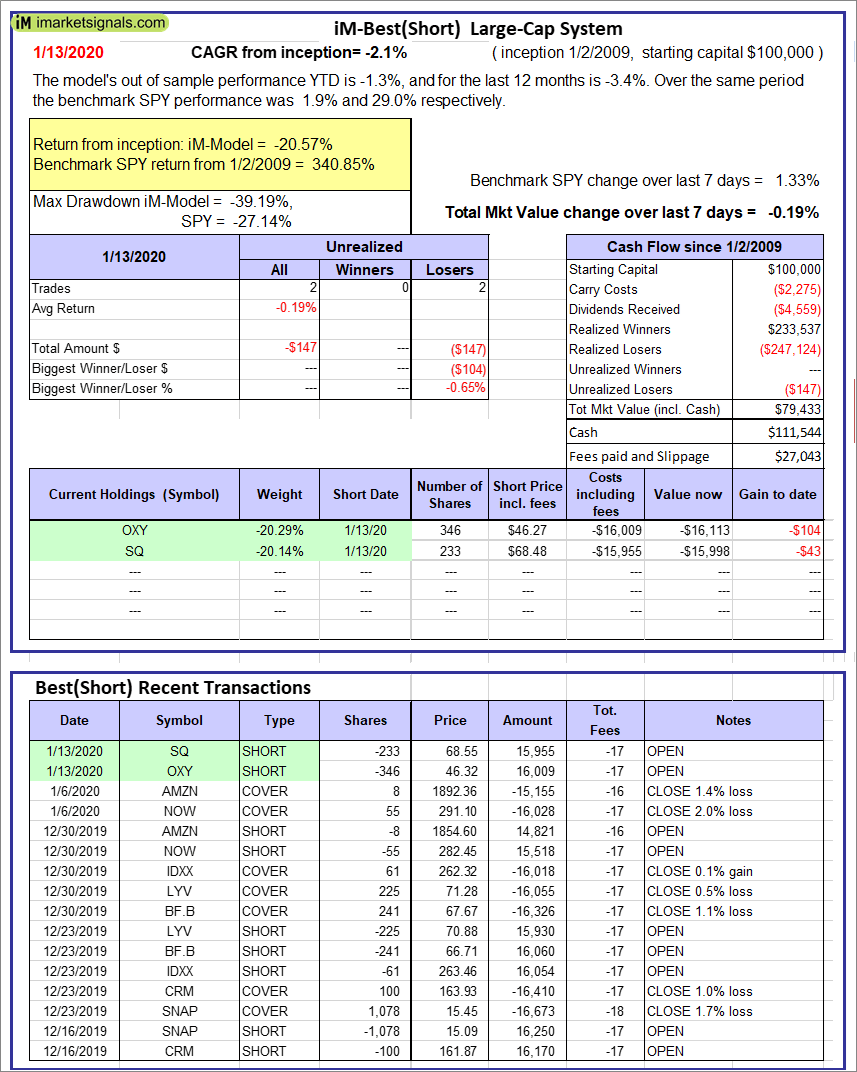 |
iM-Best(Short): The model’s out of sample performance YTD is -1.3%, and for the last 12 months is -3.4%. Over the same period the benchmark SPY performance was 1.9% and 29.0% respectively. Over the previous week the market value of iM-Best(Short) gained -0.19% at a time when SPY gained 1.33%. Over the period 1/2/2009 to 1/13/2020 the starting capital of $100,000 would have grown to $79,433 which includes $111,544 cash and excludes $27,043 spent on fees and slippage. |
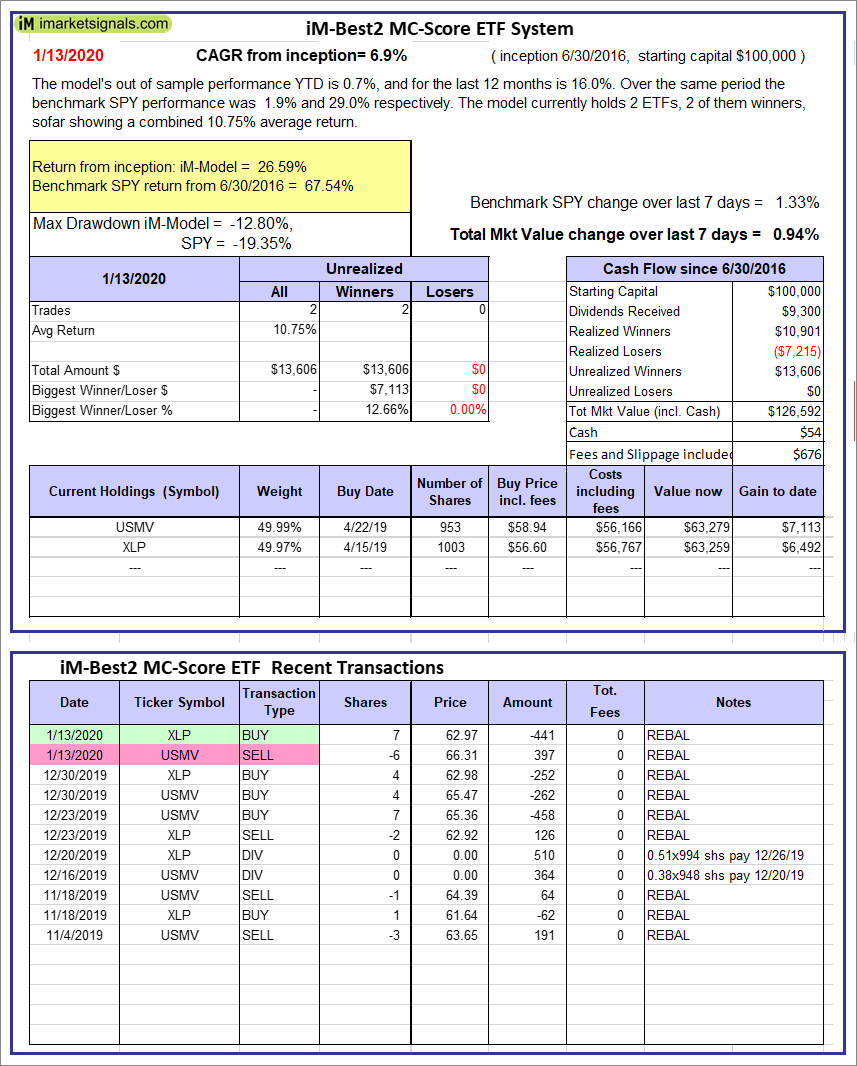 |
iM-Best2 MC-Score ETF System: The model’s out of sample performance YTD is 0.7%, and for the last 12 months is 16.0%. Over the same period the benchmark SPY performance was 1.9% and 29.0% respectively. Over the previous week the market value of the iM-Best2 MC-Score ETF System gained 0.94% at a time when SPY gained 1.33%. A starting capital of $100,000 at inception on 6/30/2016 would have grown to $126,592 which includes $54 cash and excludes $676 spent on fees and slippage. |
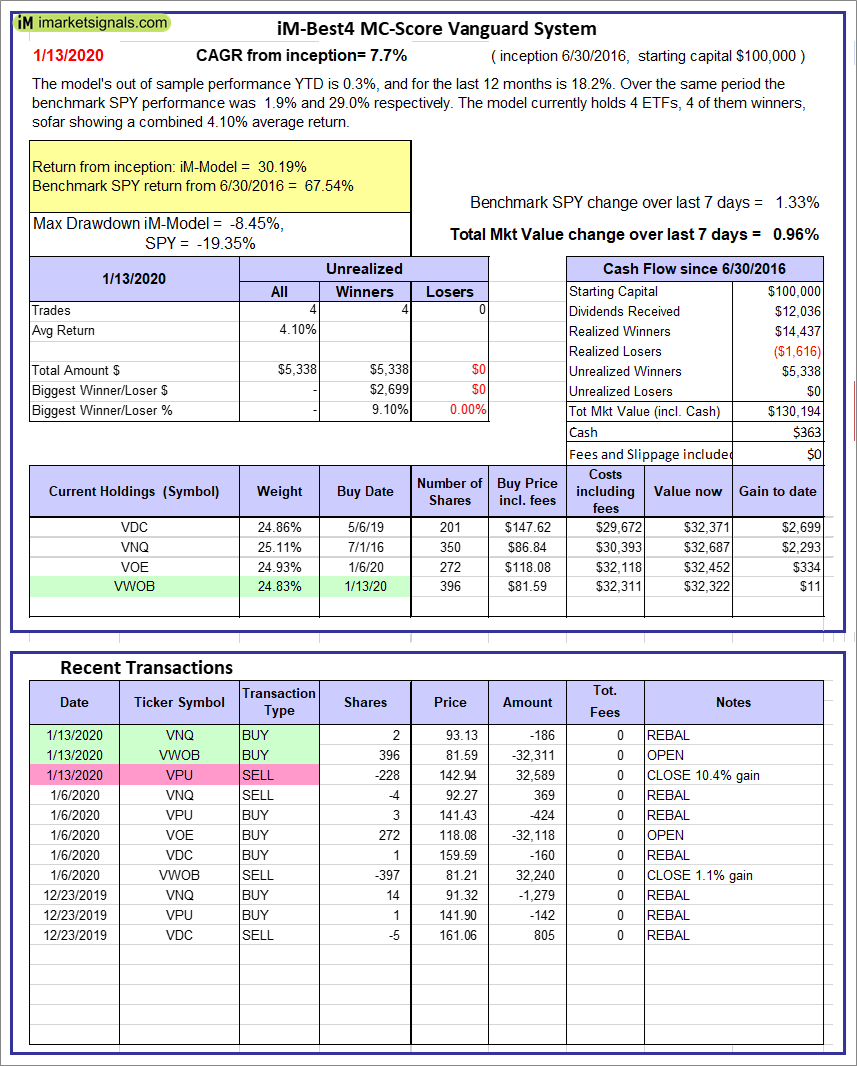 |
iM-Best4 MC-Score Vanguard System: The model’s out of sample performance YTD is 0.3%, and for the last 12 months is 18.2%. Over the same period the benchmark SPY performance was 1.9% and 29.0% respectively. Over the previous week the market value of the iM-Best4 MC-Score Vanguard System gained 0.96% at a time when SPY gained 1.33%. A starting capital of $100,000 at inception on 6/30/2016 would have grown to $130,194 which includes $363 cash and excludes $00 spent on fees and slippage. |
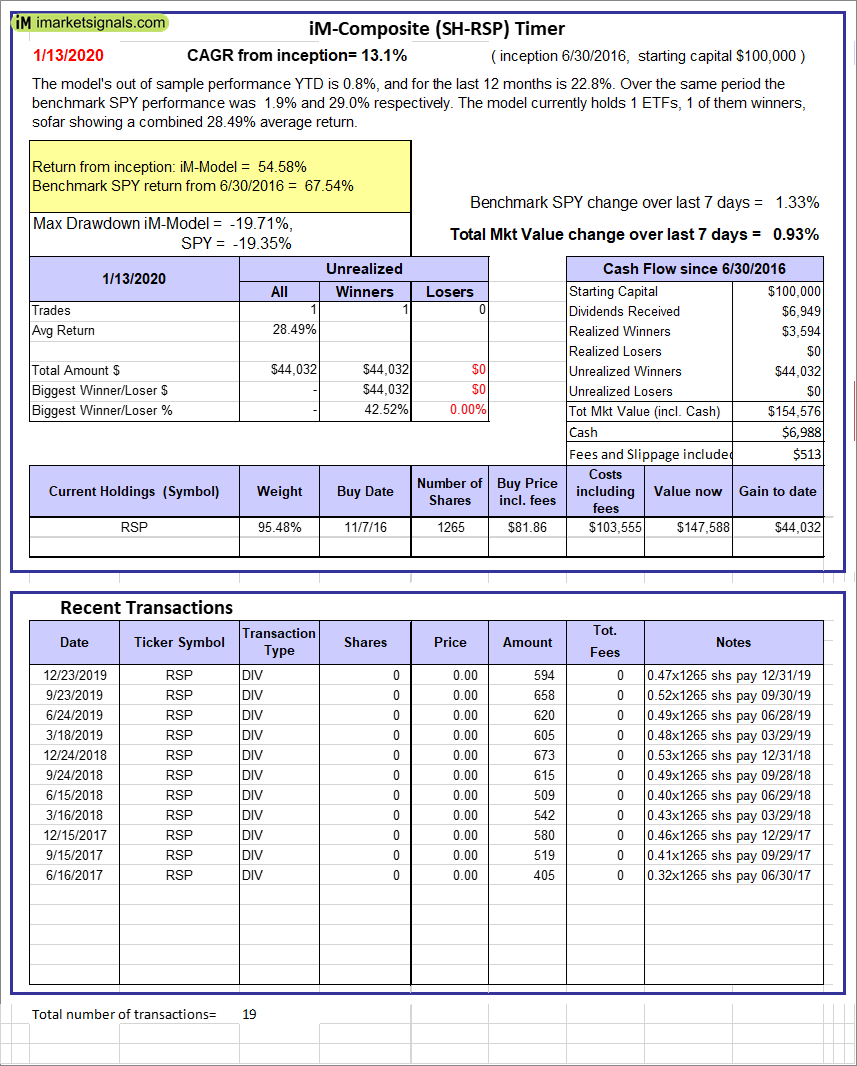 |
iM-Composite (SH-RSP) Timer: The model’s out of sample performance YTD is 0.8%, and for the last 12 months is 22.8%. Over the same period the benchmark SPY performance was 1.9% and 29.0% respectively. Over the previous week the market value of the iM-Composite (SH-RSP) Timer gained 0.93% at a time when SPY gained 1.33%. A starting capital of $100,000 at inception on 6/30/2016 would have grown to $154,576 which includes $6,988 cash and excludes $513 spent on fees and slippage. |
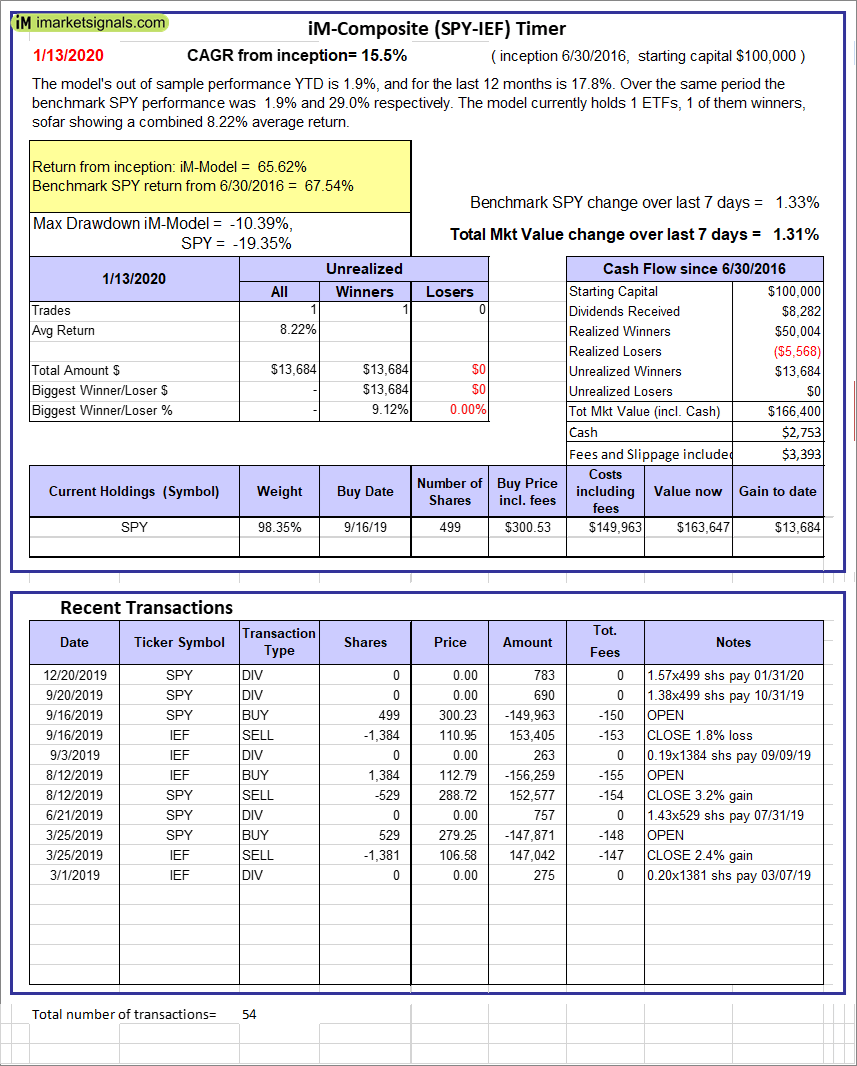 |
iM-Composite (SPY-IEF) Timer: The model’s out of sample performance YTD is 1.9%, and for the last 12 months is 17.8%. Over the same period the benchmark SPY performance was 1.9% and 29.0% respectively. Over the previous week the market value of the iM-Composite (SPY-IEF) Timer gained 1.31% at a time when SPY gained 1.33%. A starting capital of $100,000 at inception on 6/30/2016 would have grown to $166,400 which includes $2,753 cash and excludes $3,393 spent on fees and slippage. |
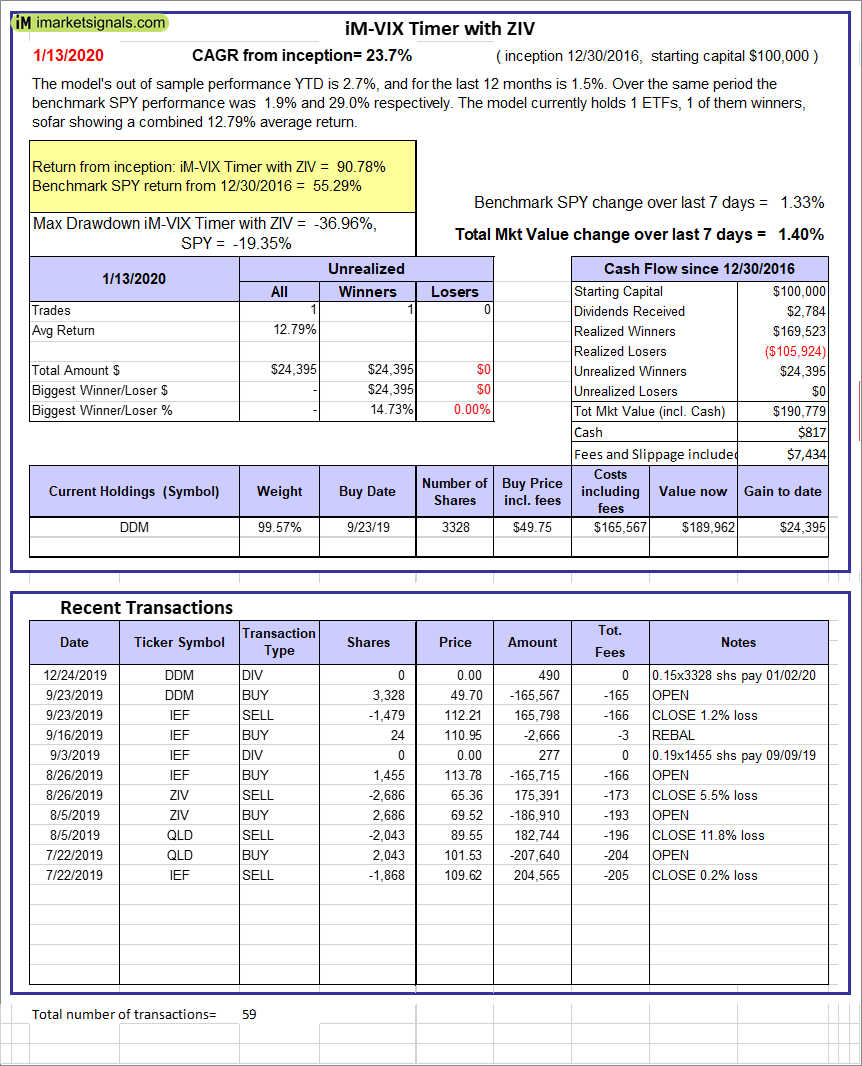 |
iM-VIX Timer with ZIV: The model’s out of sample performance YTD is 2.7%, and for the last 12 months is 1.5%. Over the same period the benchmark SPY performance was 1.9% and 29.0% respectively. Over the previous week the market value of the iM-VIX Timer with ZIV gained 1.40% at a time when SPY gained 1.33%. A starting capital of $100,000 at inception on 6/30/2016 would have grown to $190,779 which includes $817 cash and excludes $7,434 spent on fees and slippage. |
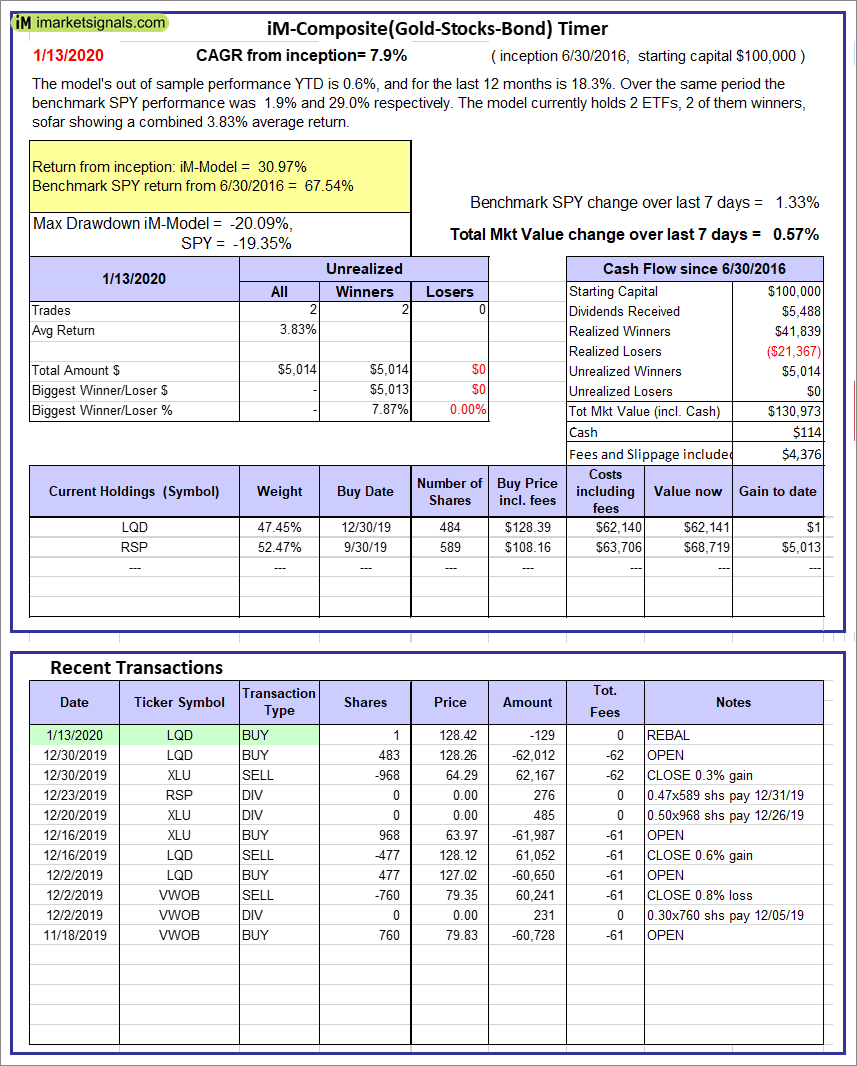 |
iM-Composite(Gold-Stocks-Bond) Timer: The model’s out of sample performance YTD is 0.6%, and for the last 12 months is 18.3%. Over the same period the benchmark SPY performance was 1.9% and 29.0% respectively. Over the previous week the market value of the iM-Composite(Gold-Stocks-Bond) Timer gained 0.57% at a time when SPY gained 1.33%. A starting capital of $100,000 at inception on 6/30/2016 would have grown to $130,973 which includes $114 cash and excludes $4,376 spent on fees and slippage. |
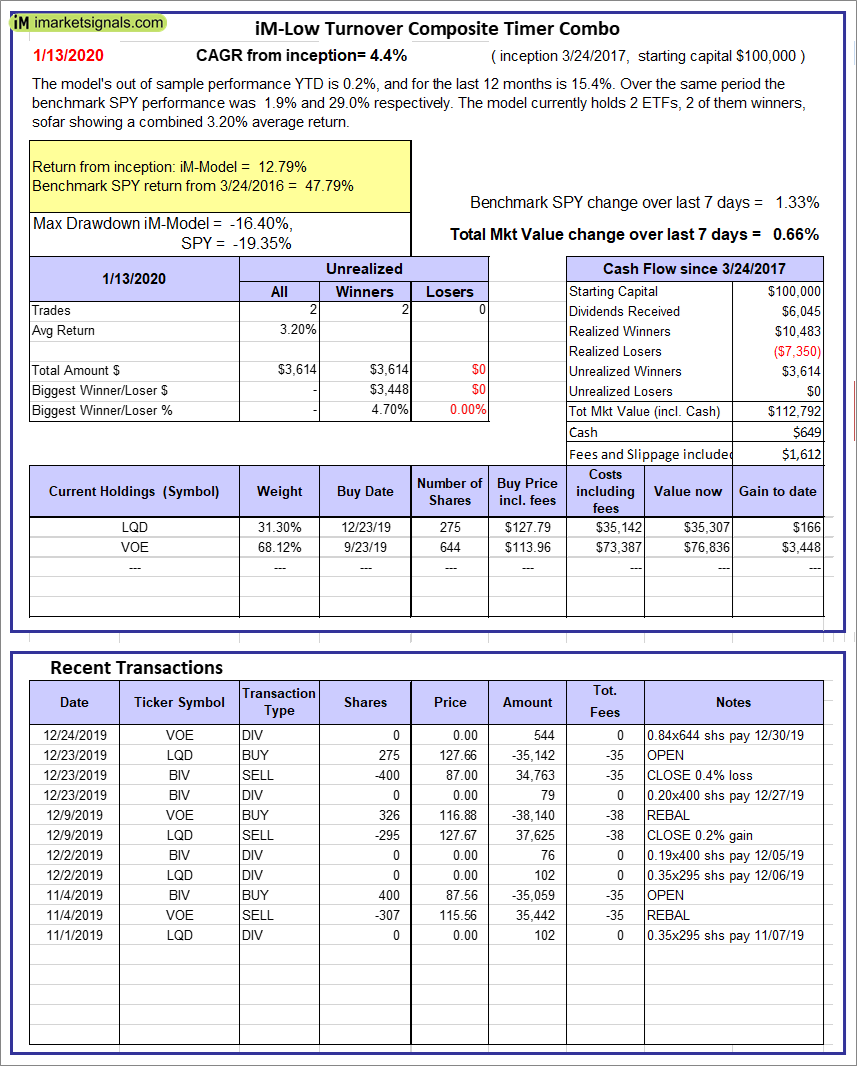 |
iM-Low Turnover Composite Timer Combo: The model’s out of sample performance YTD is 0.2%, and for the last 12 months is 15.4%. Over the same period the benchmark SPY performance was 1.9% and 29.0% respectively. Over the previous week the market value of the iM-Low Turnover Composite Timer Combo gained 0.66% at a time when SPY gained 1.33%. A starting capital of $100,000 at inception on 3/24/27 would have grown to $112,792 which includes $649 cash and excludes $1,612 spent on fees and slippage. |
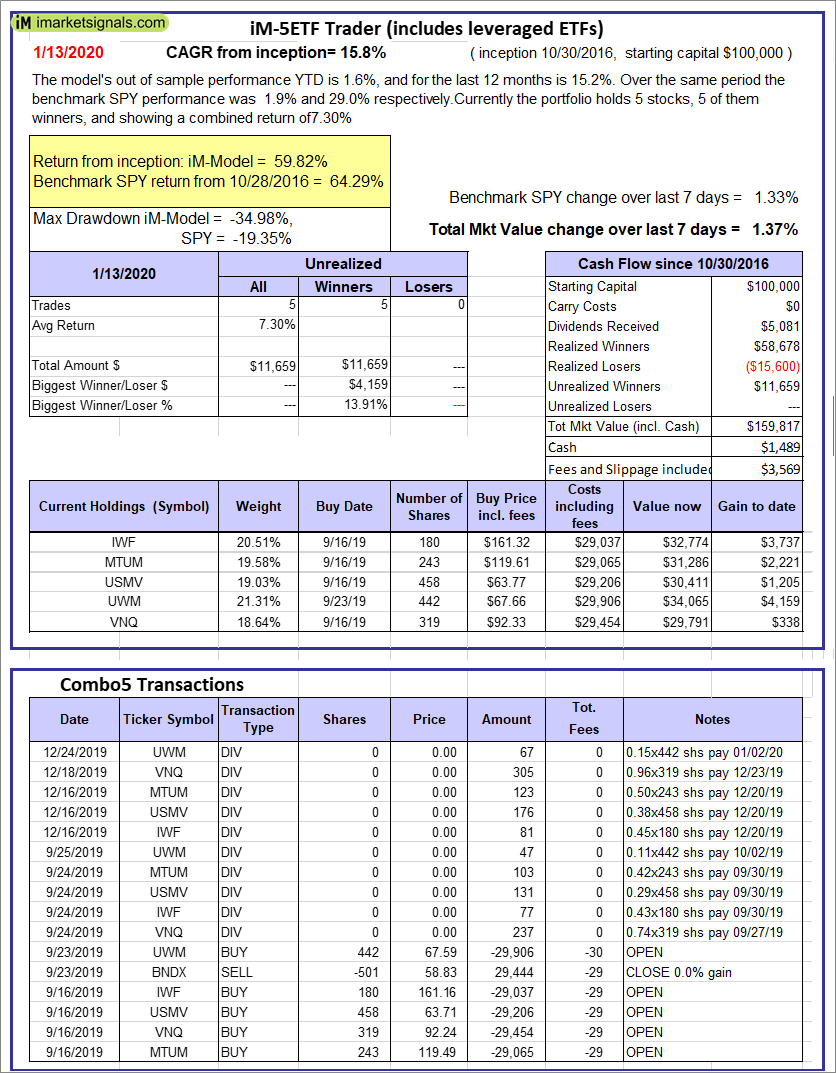 |
iM-5ETF Trader (includes leveraged ETFs): The model’s out of sample performance YTD is 1.6%, and for the last 12 months is 15.2%. Over the same period the benchmark SPY performance was 1.9% and 29.0% respectively. Over the previous week the market value of the iM-5ETF Trader (includes leveraged ETFs) gained 1.37% at a time when SPY gained 1.33%. A starting capital of $100,000 at inception on 10/30/2016 would have grown to $159,817 which includes $1,489 cash and excludes $3,569 spent on fees and slippage. |
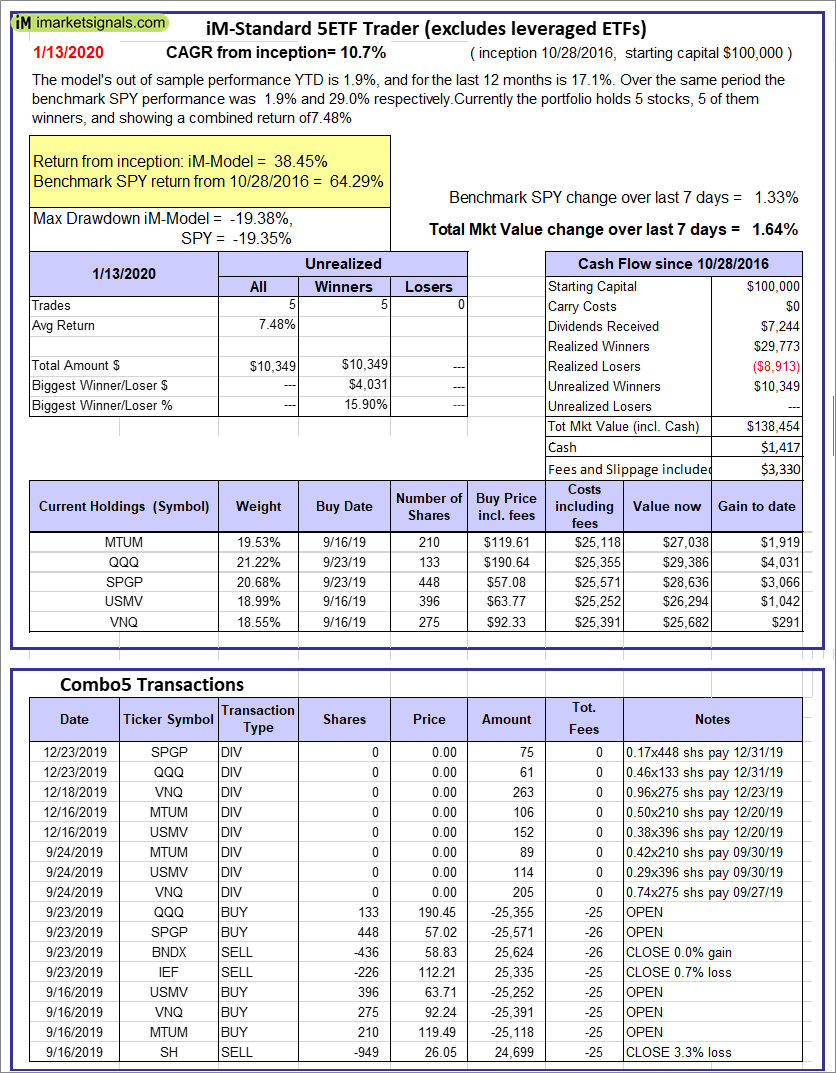 |
iM-Standard 5ETF Trader (excludes leveraged ETFs): The model’s out of sample performance YTD is 1.9%, and for the last 12 months is 17.1%. Over the same period the benchmark SPY performance was 1.9% and 29.0% respectively. Over the previous week the market value of the iM-Standard 5ETF Trader (excludes leveraged ETFs) gained 1.64% at a time when SPY gained 1.33%. A starting capital of $100,000 at inception on 10/30/2016 would have grown to $138,454 which includes $1,417 cash and excludes $3,330 spent on fees and slippage. |
iM-Best Reports – 1/13/2020
Posted in pmp SPY-SH
Leave a Reply
You must be logged in to post a comment.