
  |
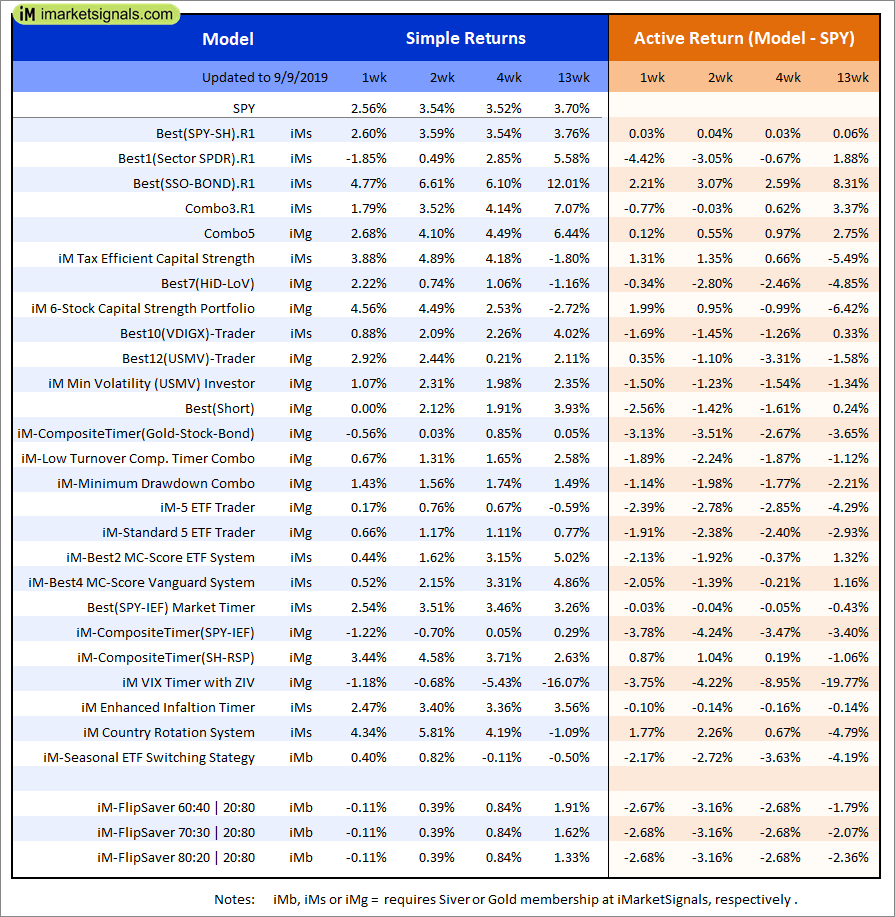
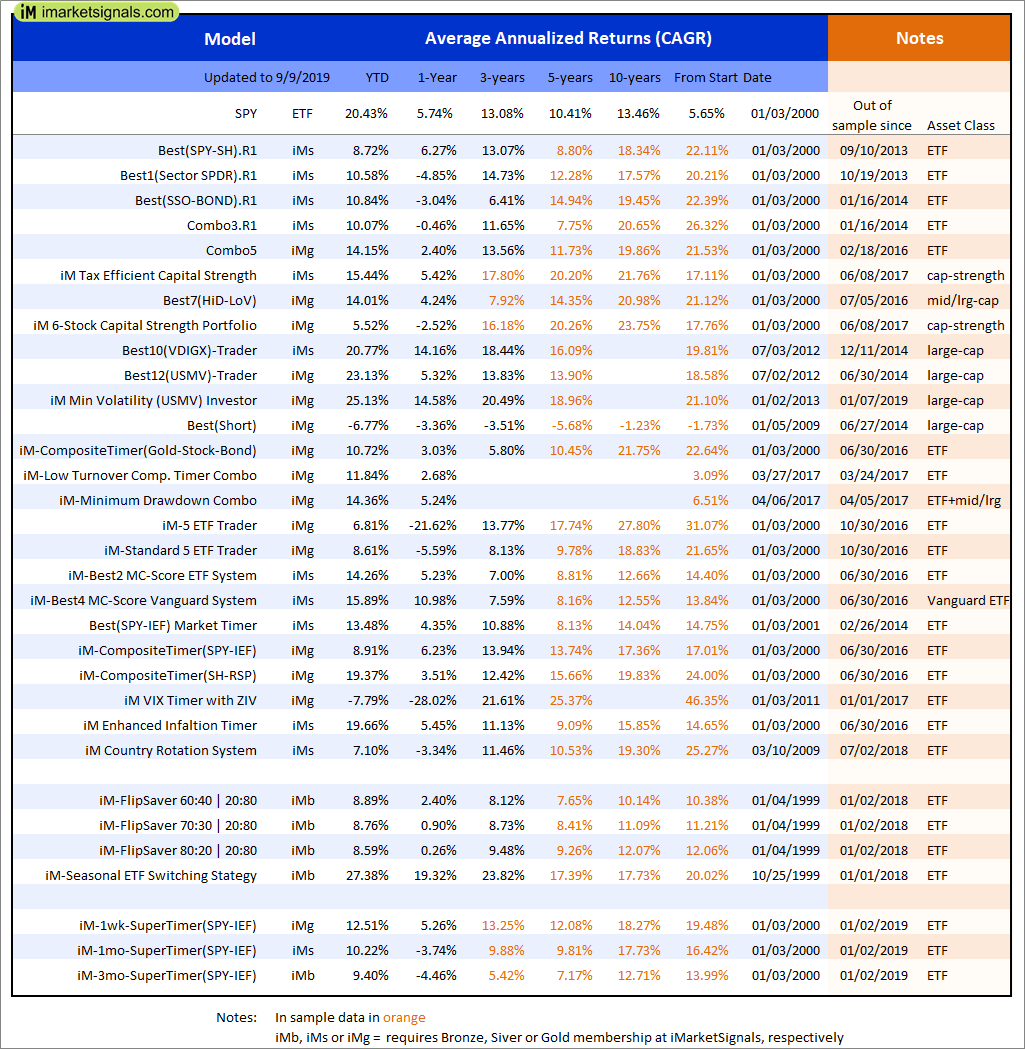
Out of sample performance summary of our models for the past 1, 2, 4 and 13 week periods. The active active return indicates how the models over- or underperformed the benchmark ETF SPY. Also the YTD, and the 1-, 3-, 5- and 10-year annualized returns are shown in the second table |
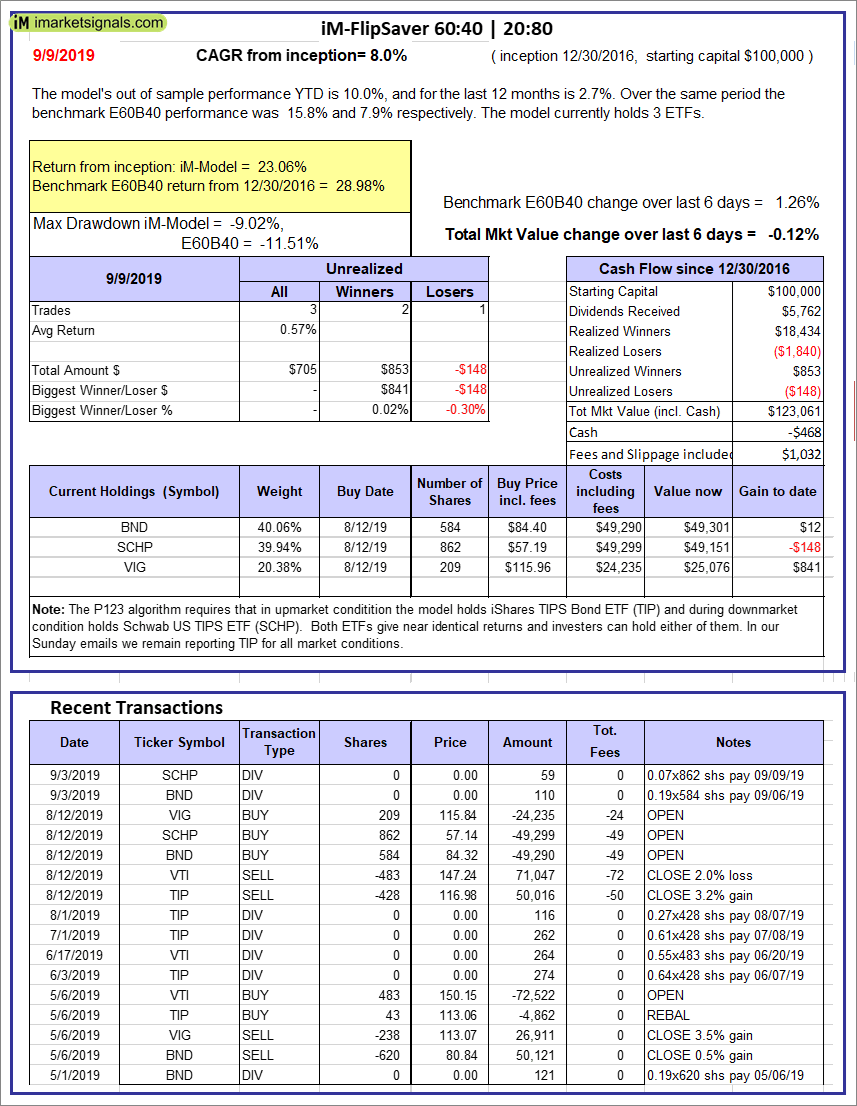 |
iM-FlipSaver 60:40 | 20:80 – 2017: The model’s out of sample performance YTD is 10.0%, and for the last 12 months is 2.7%. Over the same period the benchmark E60B40 performance was 15.8% and 7.9% respectively. Over the previous week the market value of iM-FlipSaver 80:20 | 20:80 gained -0.12% at a time when SPY gained 1.26%. A starting capital of $100,000 at inception on 7/16/2015 would have grown to $123,061 which includes -$468 cash and excludes $1,032 spent on fees and slippage. |
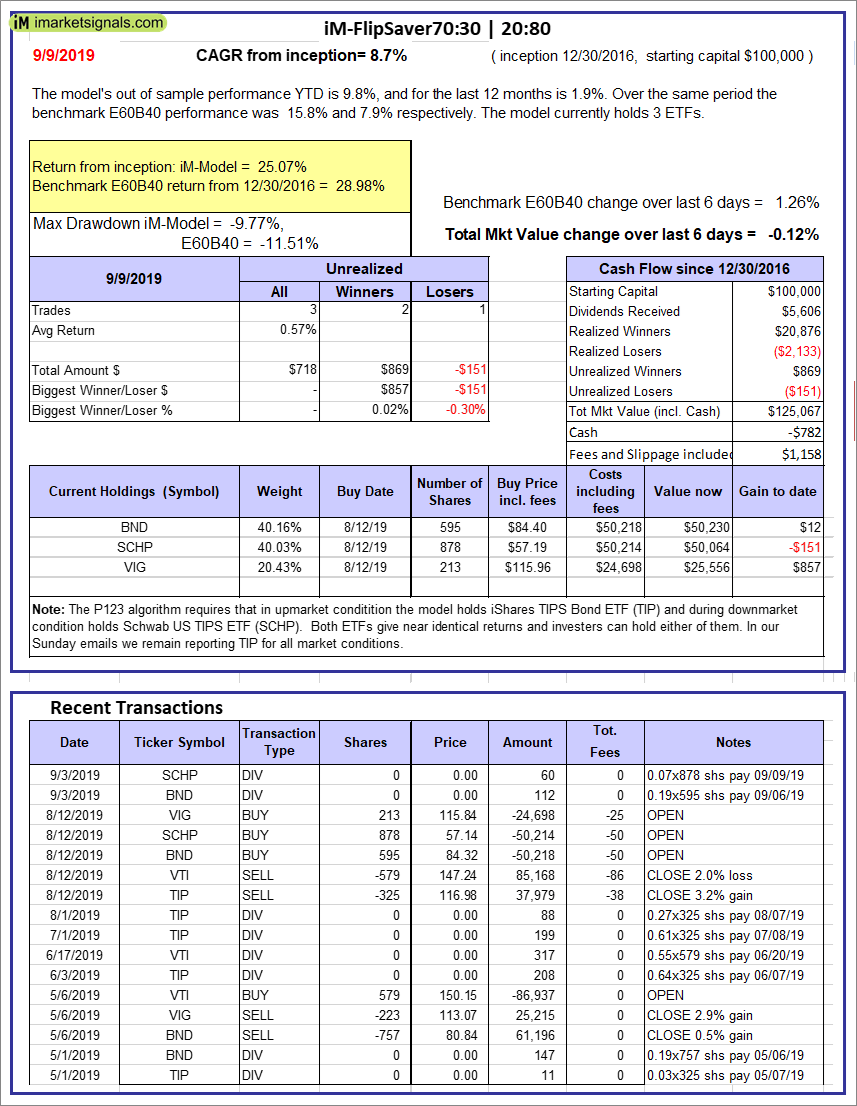 |
iM-FlipSaver 70:30 | 20:80 – 2017: The model’s out of sample performance YTD is 9.8%, and for the last 12 months is 1.9%. Over the same period the benchmark E60B40 performance was 15.8% and 7.9% respectively. Over the previous week the market value of iM-FlipSaver 70:30 | 20:80 gained -0.12% at a time when SPY gained 1.26%. A starting capital of $100,000 at inception on 7/15/2015 would have grown to $125,067 which includes -$782 cash and excludes $1,158 spent on fees and slippage. |
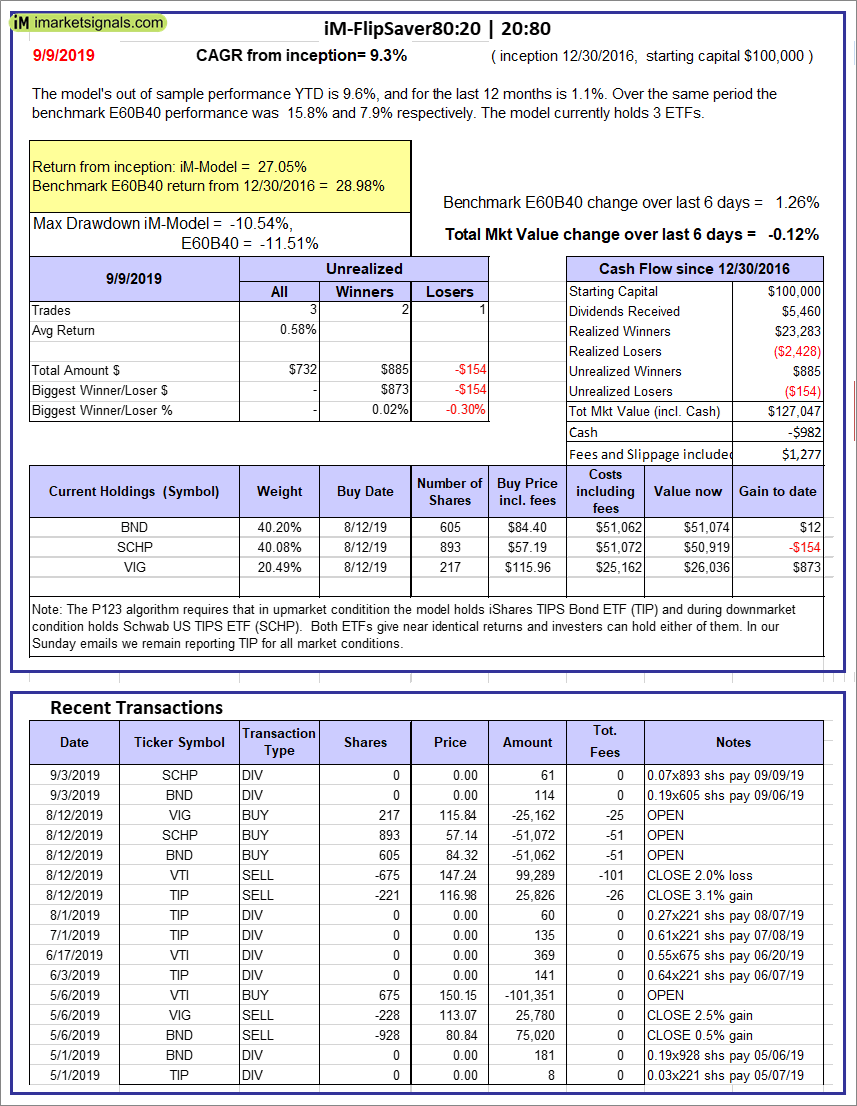 |
iM-FlipSaver 80:20 | 20:80 – 2017: The model’s out of sample performance YTD is 9.6%, and for the last 12 months is 1.1%. Over the same period the benchmark E60B40 performance was 15.8% and 7.9% respectively. Over the previous week the market value of iM-FlipSaver 80:20 | 20:80 gained -0.12% at a time when SPY gained 1.26%. A starting capital of $100,000 at inception on 1/2/2017 would have grown to $127,047 which includes -$982 cash and excludes $1,277 spent on fees and slippage. |
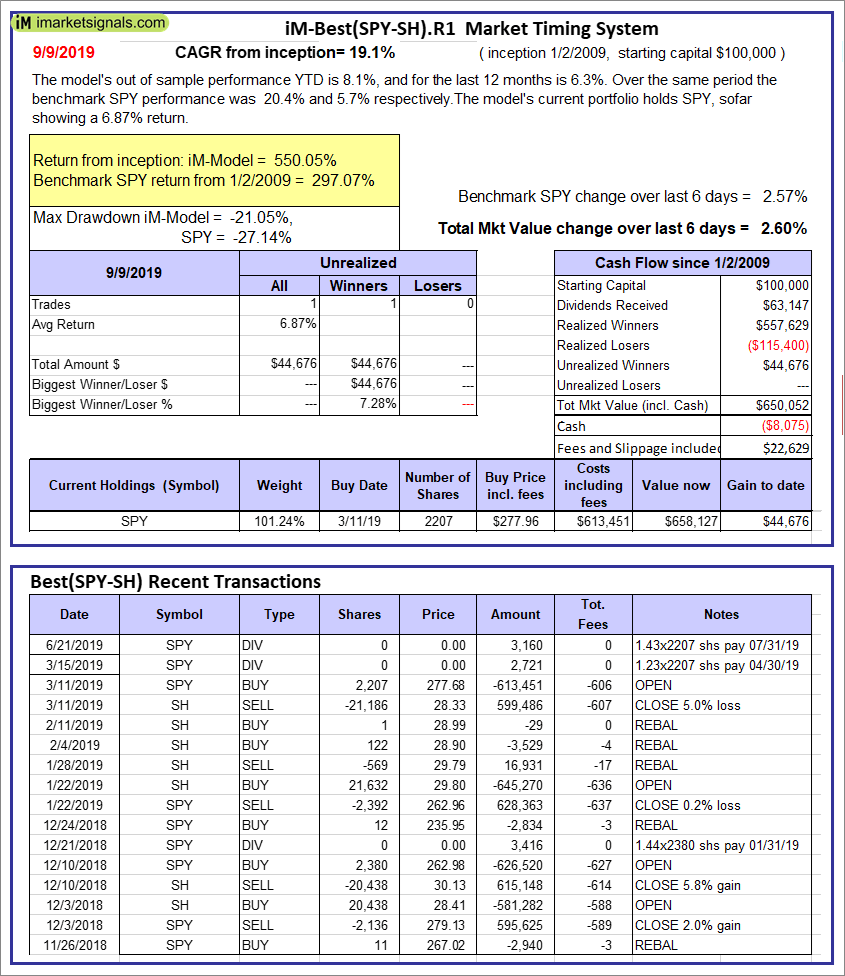 |
iM-Best(SPY-SH).R1: The model’s out of sample performance YTD is 8.1%, and for the last 12 months is 6.3%. Over the same period the benchmark SPY performance was 20.4% and 5.7% respectively. Over the previous week the market value of Best(SPY-SH) gained 2.60% at a time when SPY gained 2.57%. A starting capital of $100,000 at inception on 1/2/2009 would have grown to $650,052 which includes -$8,075 cash and excludes $22,629 spent on fees and slippage. |
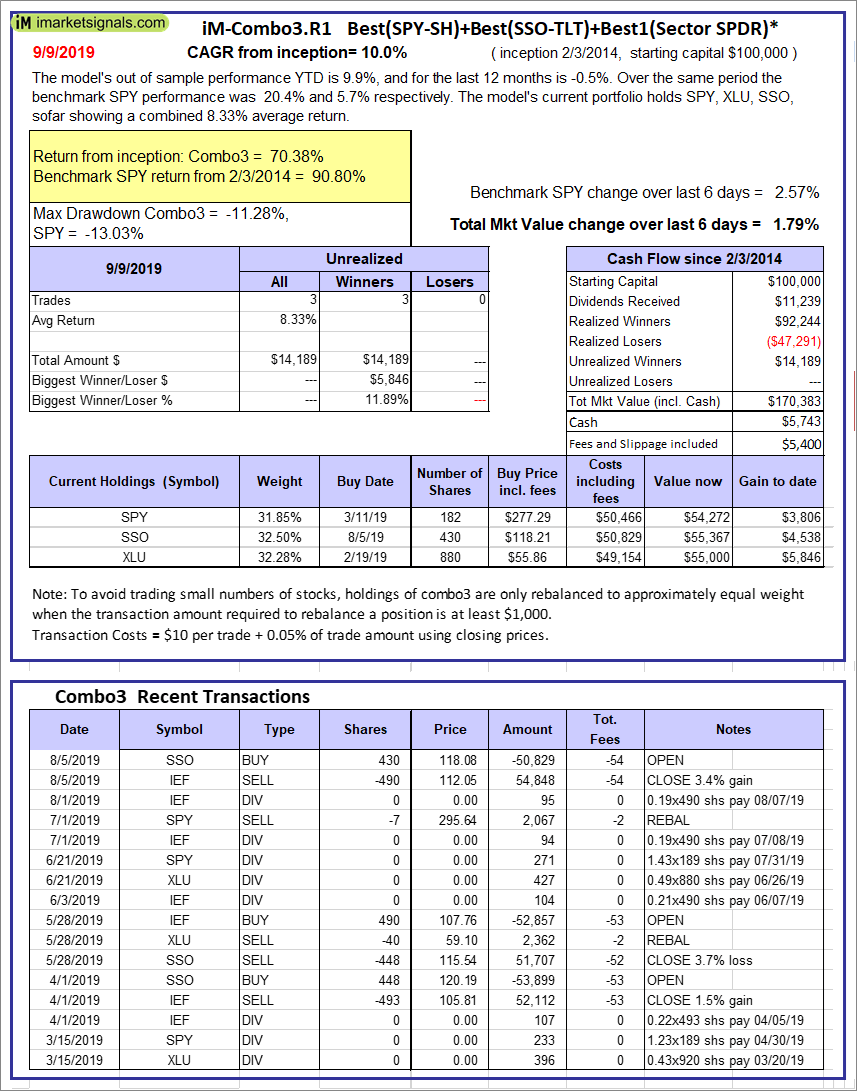 |
iM-Combo3.R1: The model’s out of sample performance YTD is 9.9%, and for the last 12 months is -0.5%. Over the same period the benchmark SPY performance was 20.4% and 5.7% respectively. Over the previous week the market value of iM-Combo3.R1 gained 1.79% at a time when SPY gained 2.57%. A starting capital of $100,000 at inception on 2/3/2014 would have grown to $170,383 which includes $5,743 cash and excludes $5,400 spent on fees and slippage. |
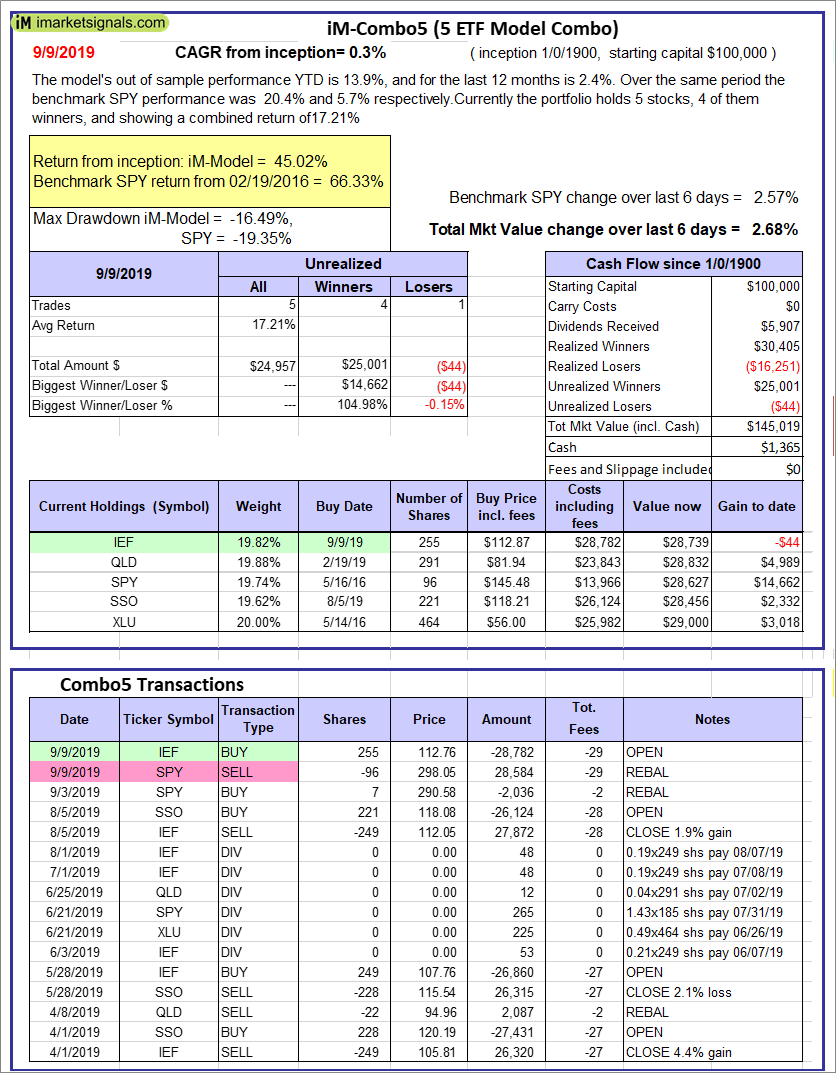 |
iM-Combo5: The model’s out of sample performance YTD is 13.9%, and for the last 12 months is 2.4%. Over the same period the benchmark SPY performance was 20.4% and 5.7% respectively. Over the previous week the market value of iM-Combo5 gained 2.68% at a time when SPY gained 2.57%. A starting capital of $100,000 at inception on 2/22/2016 would have grown to $145,019 which includes $1,365 cash and excludes $0 spent on fees and slippage. |
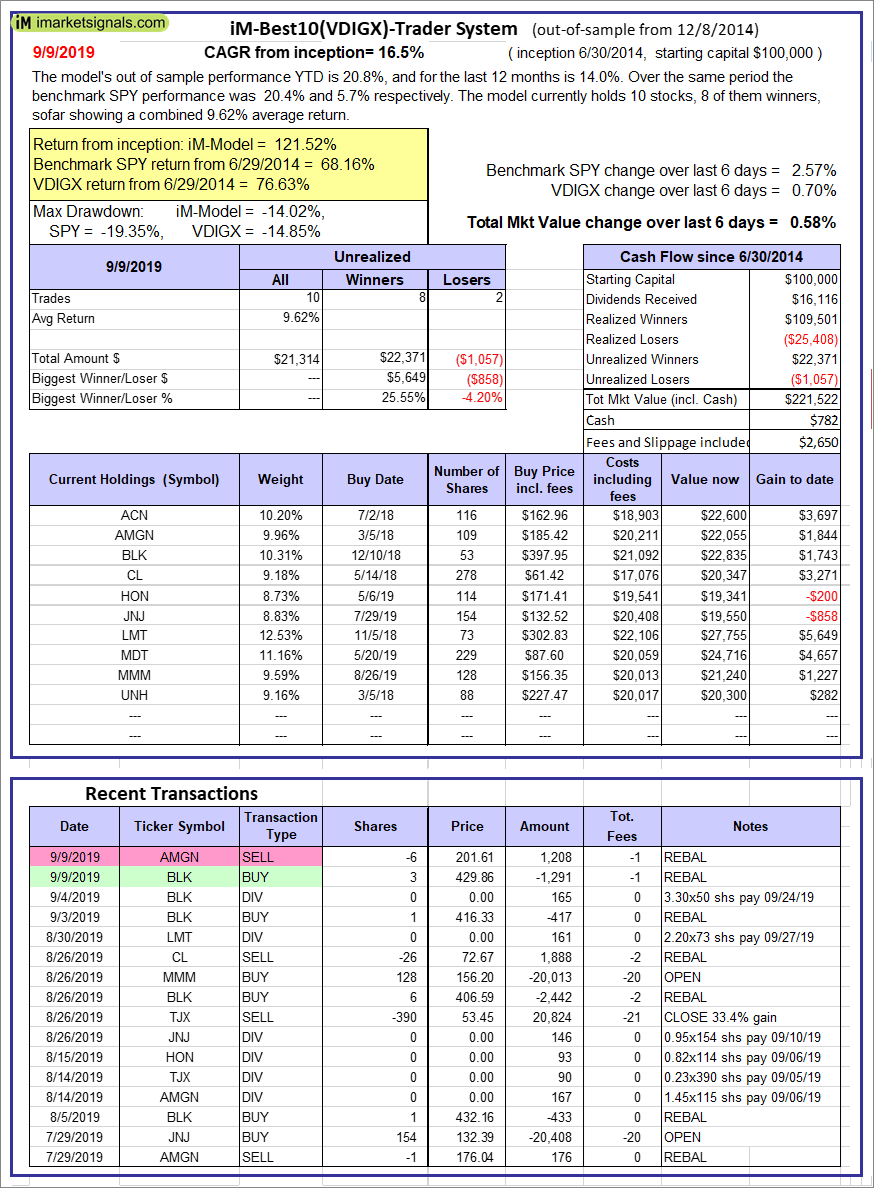 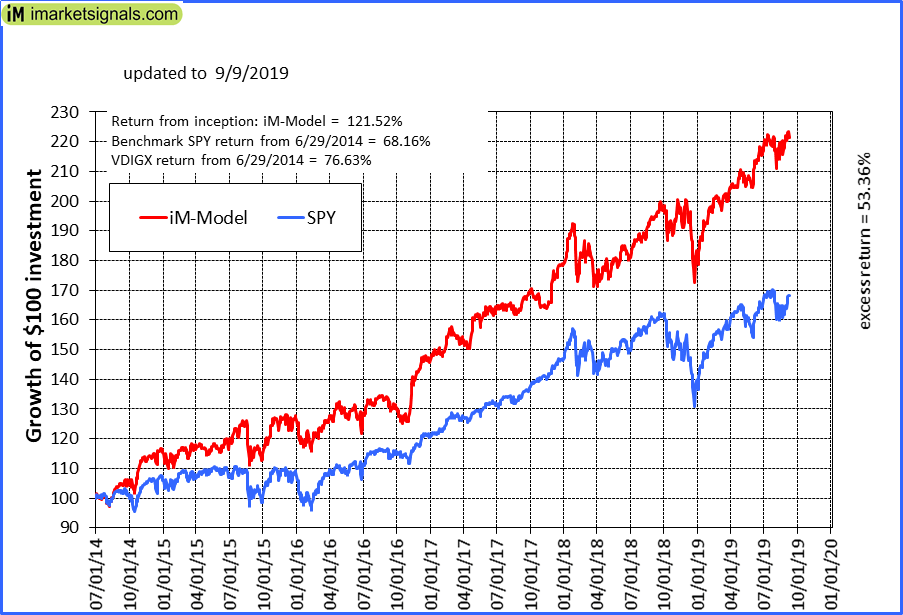 |
iM-Best10(VDIGX)-Trader: The model’s out of sample performance YTD is 20.8%, and for the last 12 months is 14.0%. Over the same period the benchmark SPY performance was 20.4% and 5.7% respectively. Since inception, on 7/1/2014, the model gained 121.52% while the benchmark SPY gained 68.16% and VDIGX gained 76.63% over the same period. Over the previous week the market value of iM-Best10(VDIGX) gained 0.58% at a time when SPY gained 2.57%. A starting capital of $100,000 at inception on 7/1/2014 would have grown to $221,522 which includes $782 cash and excludes $2,650 spent on fees and slippage. |
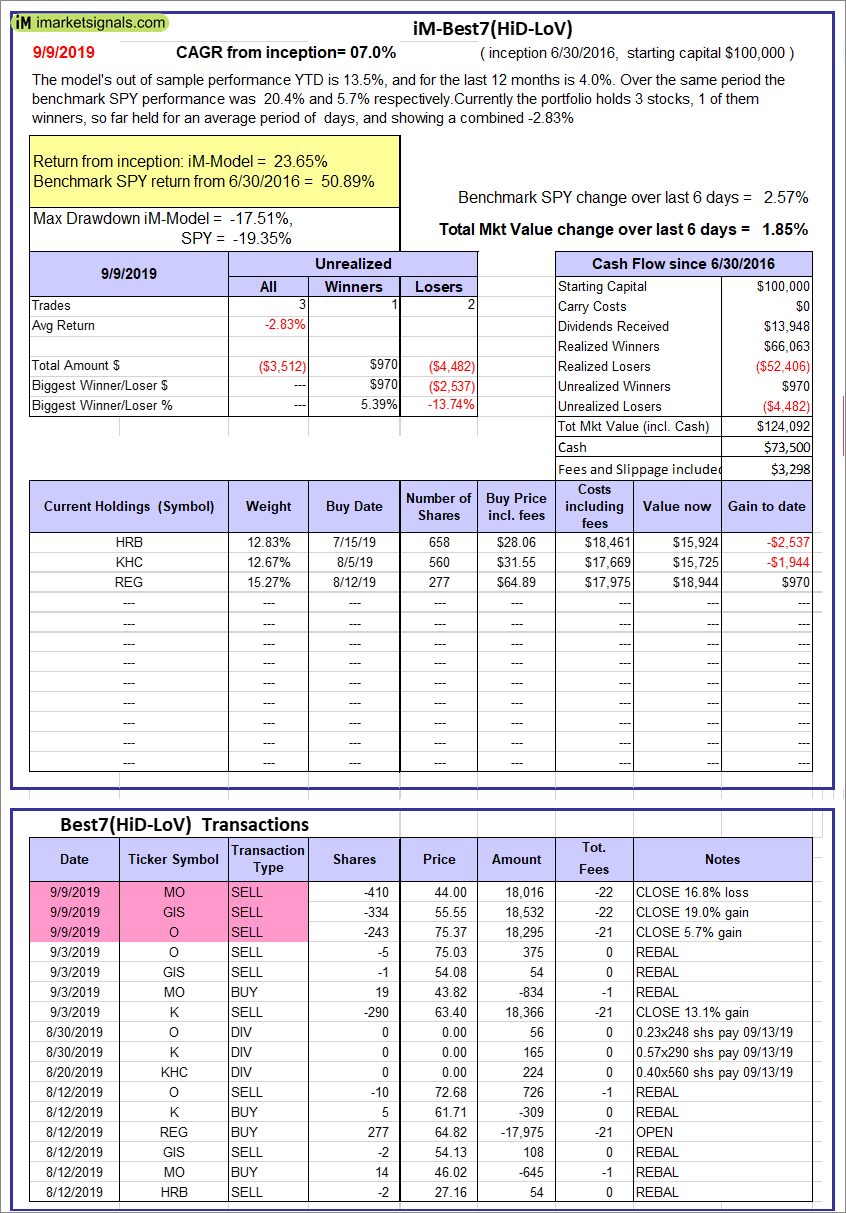 |
iM-Best7(HiD-LoV): The model’s out of sample performance YTD is 13.5%, and for the last 12 months is 4.0%. Over the same period the benchmark SPY performance was 20.4% and 5.7% respectively. Over the previous week the market value of iM-Best7(HiD-LoV) gained 1.85% at a time when SPY gained 2.57%. A starting capital of $100,000 at inception on 6/30/2016 would have grown to $124,092 which includes $73,500 cash and excludes $3,298 spent on fees and slippage. |
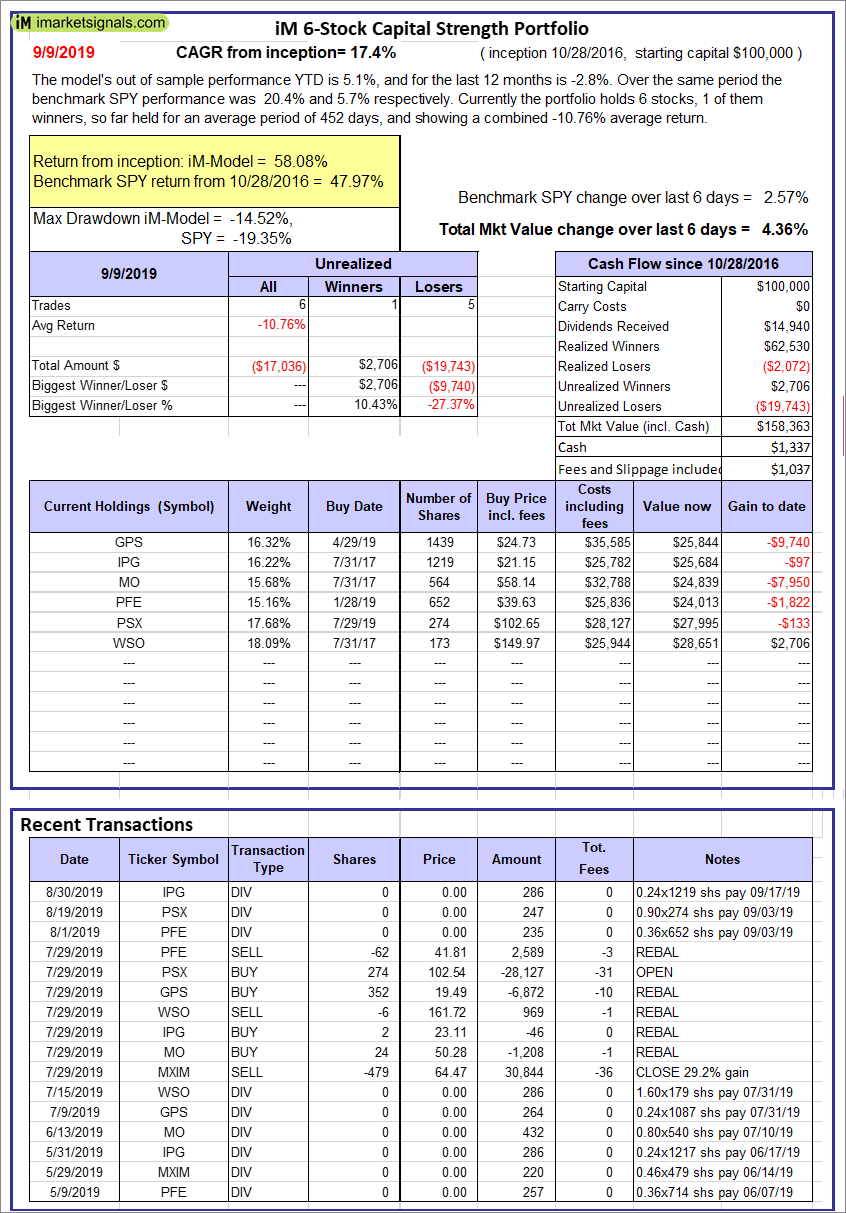 |
iM 6-Stock Capital Strength Portfolio: The model’s out of sample performance YTD is 5.1%, and for the last 12 months is -2.8%. Over the same period the benchmark SPY performance was 20.4% and 5.7% respectively. Over the previous week the market value of the iM 6-Stock Capital Strength Portfolio gained 4.36% at a time when SPY gained 2.57%. A starting capital of $100,000 at inception on 10/28/2016 would have grown to $158,363 which includes $1,337 cash and excludes $1,037 spent on fees and slippage. |
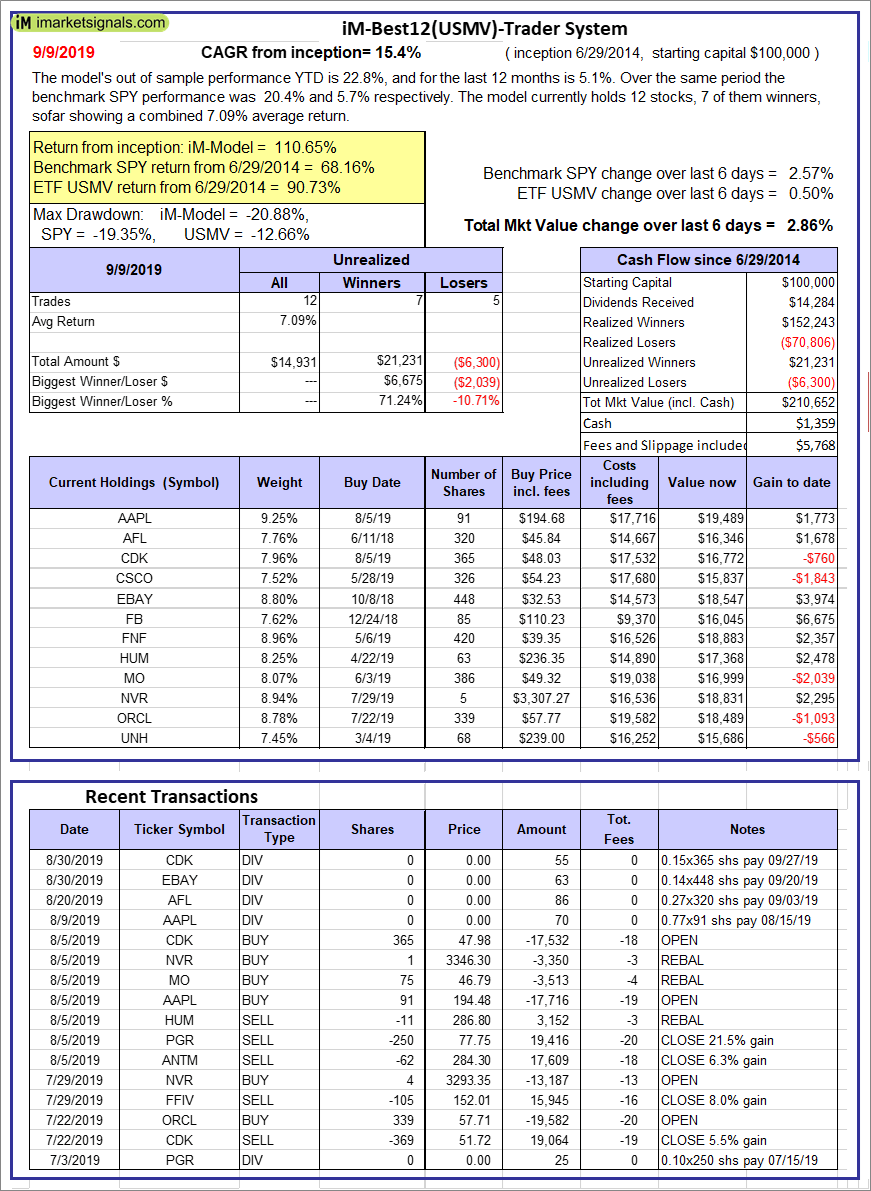 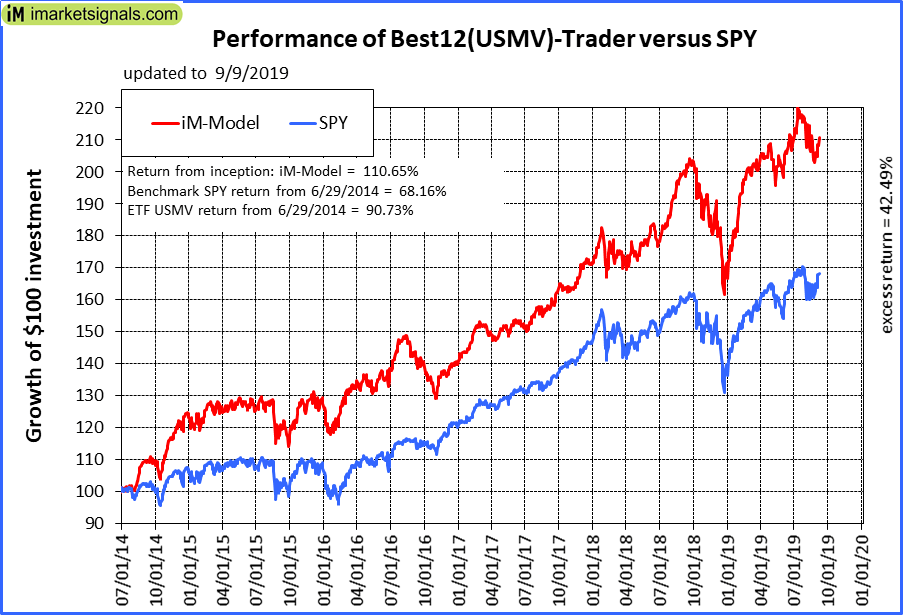 |
iM-Best12(USMV)-Trader: The model’s out of sample performance YTD is 22.8%, and for the last 12 months is 5.1%. Over the same period the benchmark SPY performance was 20.4% and 5.7% respectively. Since inception, on 6/30/2014, the model gained 110.65% while the benchmark SPY gained 68.16% and the ETF USMV gained 90.73% over the same period. Over the previous week the market value of iM-Best12(USMV)-Trader gained 2.86% at a time when SPY gained 2.57%. A starting capital of $100,000 at inception on 6/30/2014 would have grown to $210,652 which includes $1,359 cash and excludes $5,768 spent on fees and slippage. |
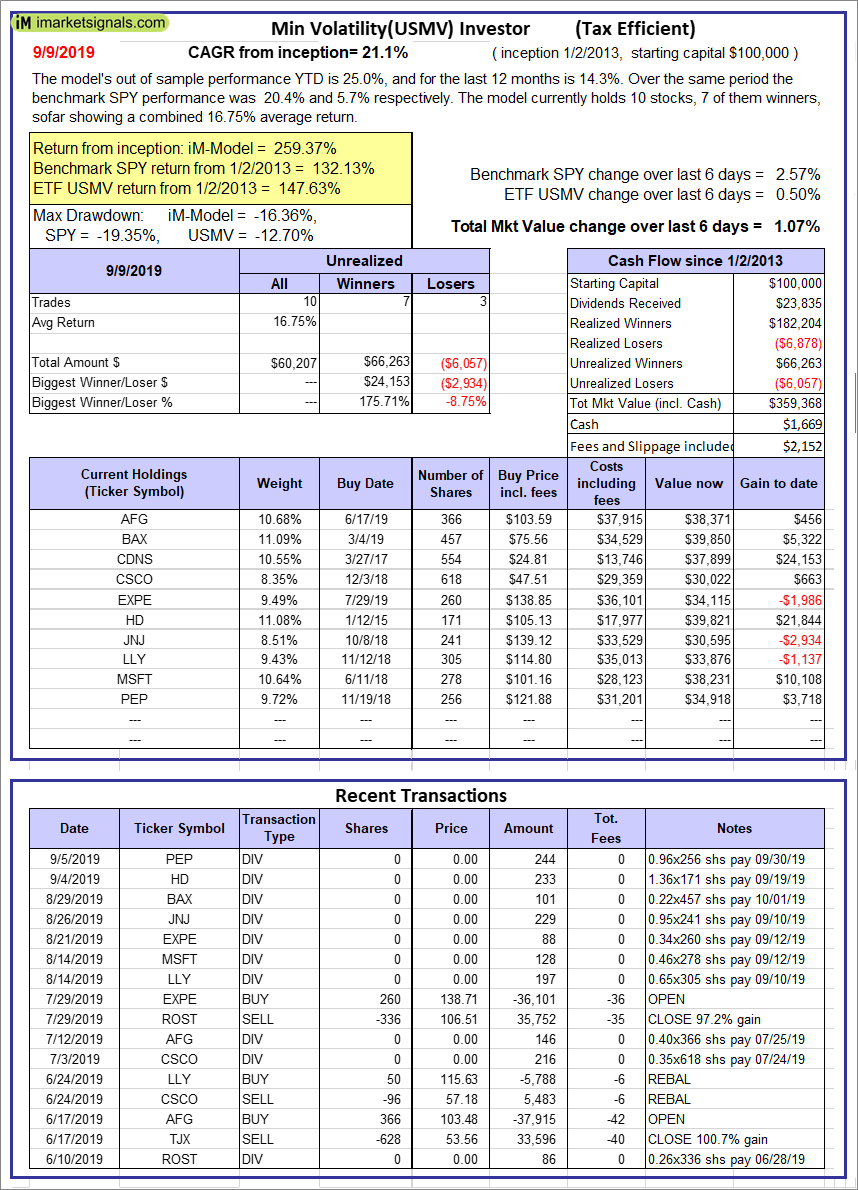  |
iM Min Volatility (USMV) Investor: The model’s out of sample performance YTD is 25.0%, and for the last 12 months is 14.3%. Over the same period the benchmark SPY performance was 20.4% and 5.7% respectively. Since inception, on 1/3/2013, the model gained 259.37% while the benchmark SPY gained 132.13% and the ETF USMV gained 147.63% over the same period. Over the previous week the market value of iM Min Volatility (USMV) Investor gained 1.07% at a time when SPY gained 2.57%. A starting capital of $100,000 at inception on 1/3/2013 would have grown to $359,368 which includes $1,669 cash and excludes $2,152 spent on fees and slippage. |
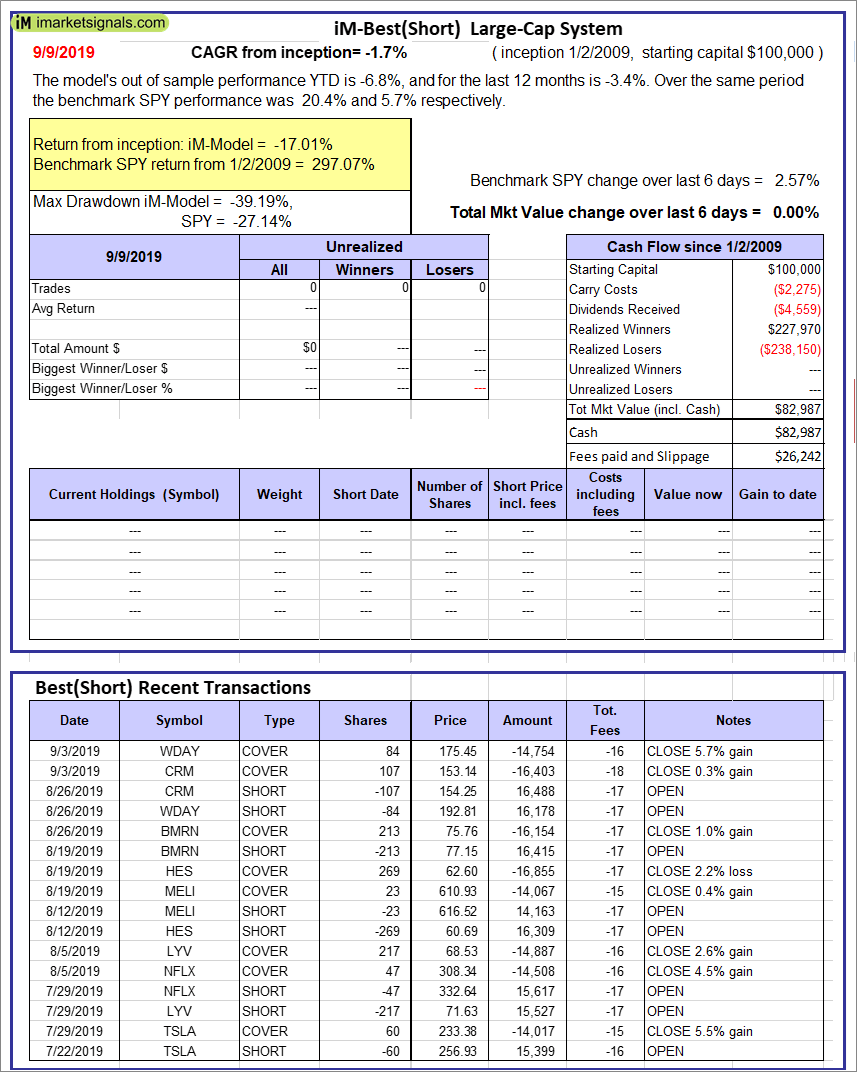 |
iM-Best(Short): The model’s out of sample performance YTD is -6.8%, and for the last 12 months is -3.4%. Over the same period the benchmark SPY performance was 20.4% and 5.7% respectively. Over the previous week the market value of iM-Best(Short) gained 0.00% at a time when SPY gained 2.57%. Over the period 1/2/2009 to 9/9/2019 the starting capital of $100,000 would have grown to $82,987 which includes $82,987 cash and excludes $26,242 spent on fees and slippage. |
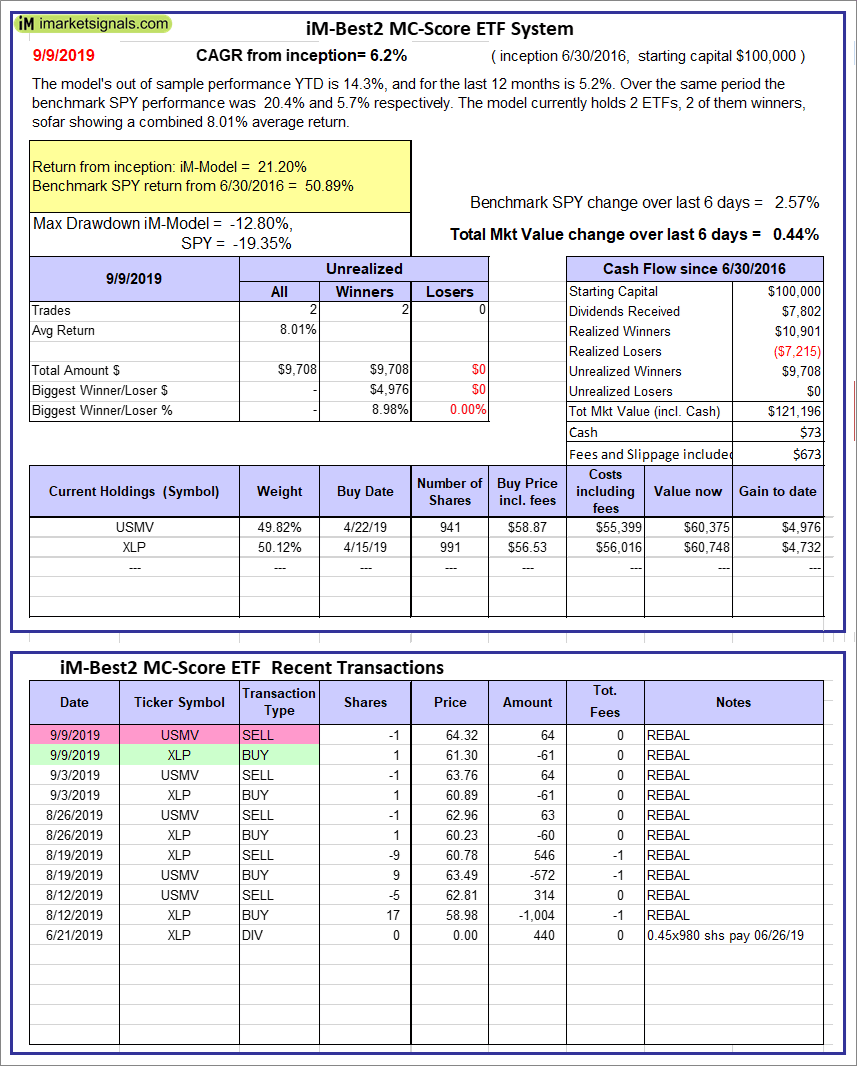 |
iM-Best2 MC-Score ETF System: The model’s out of sample performance YTD is 14.3%, and for the last 12 months is 5.2%. Over the same period the benchmark SPY performance was 20.4% and 5.7% respectively. Over the previous week the market value of the iM-Best2 MC-Score ETF System gained 0.44% at a time when SPY gained 2.57%. A starting capital of $100,000 at inception on 6/30/2016 would have grown to $121,196 which includes $73 cash and excludes $673 spent on fees and slippage. |
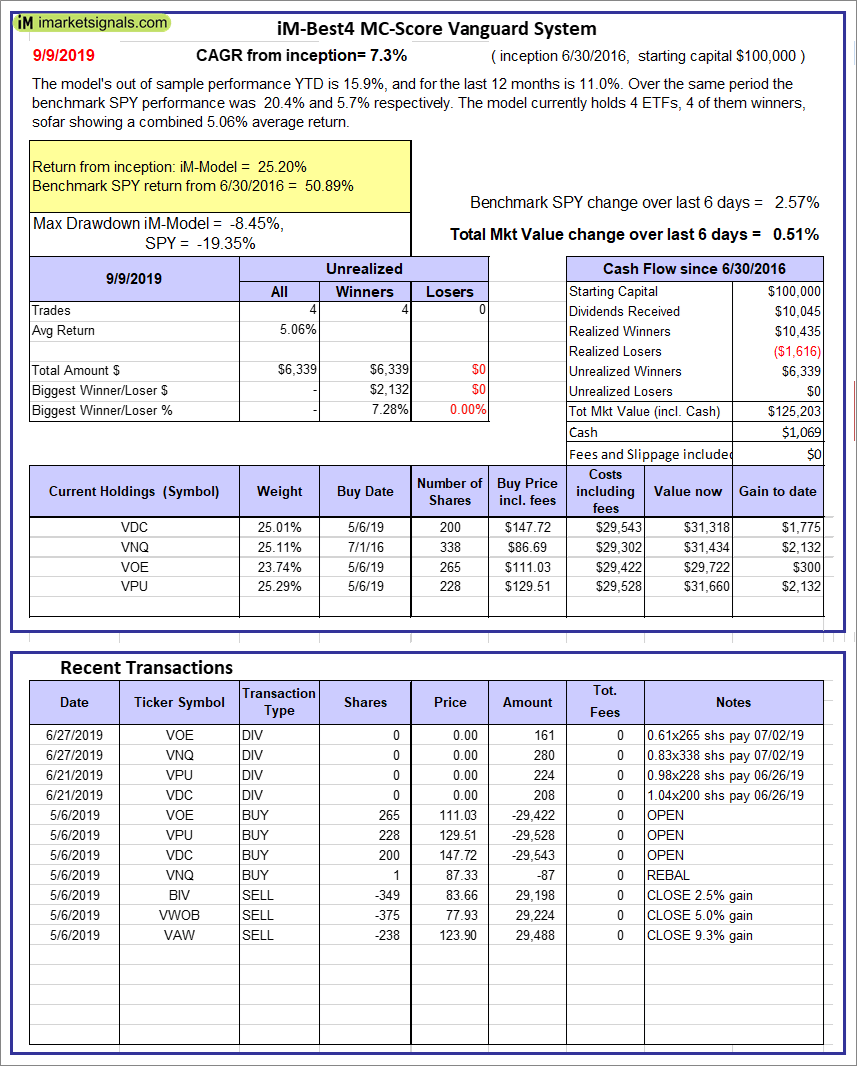 |
iM-Best4 MC-Score Vanguard System: The model’s out of sample performance YTD is 15.9%, and for the last 12 months is 11.0%. Over the same period the benchmark SPY performance was 20.4% and 5.7% respectively. Over the previous week the market value of the iM-Best4 MC-Score Vanguard System gained 0.51% at a time when SPY gained 2.57%. A starting capital of $100,000 at inception on 6/30/2016 would have grown to $125,203 which includes $1,069 cash and excludes $00 spent on fees and slippage. |
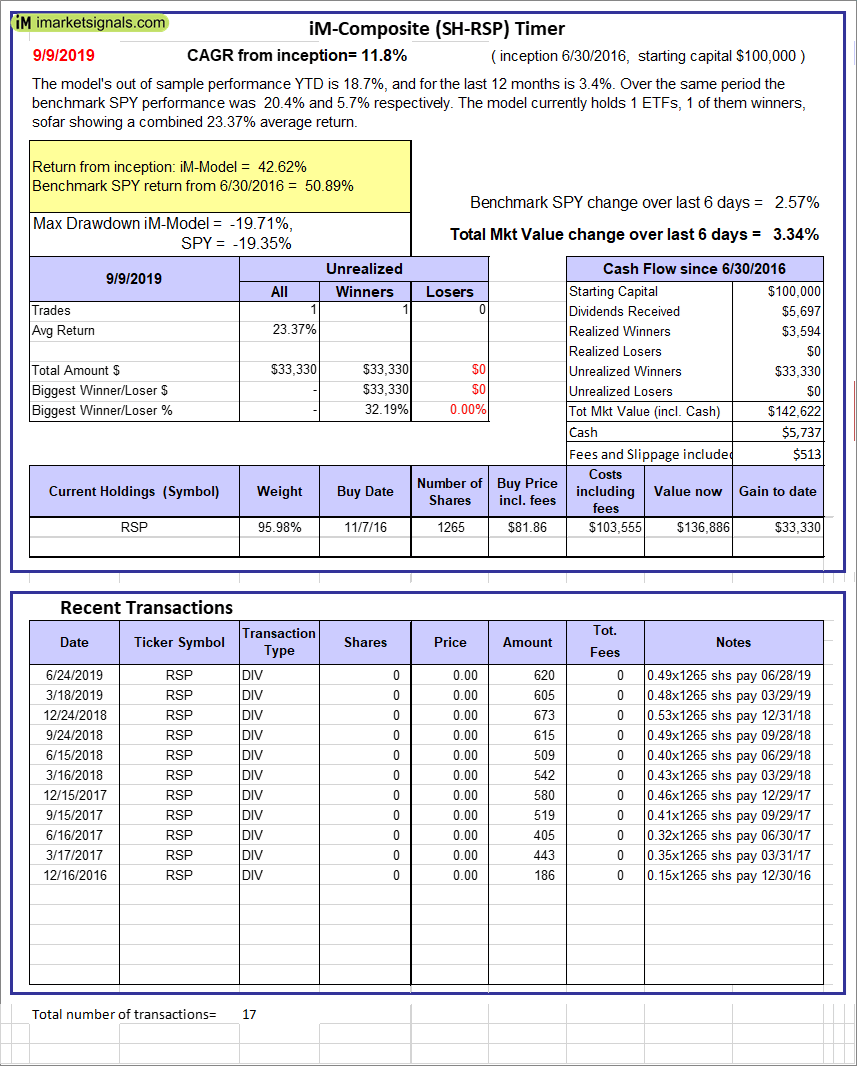 |
iM-Composite (SH-RSP) Timer: The model’s out of sample performance YTD is 18.7%, and for the last 12 months is 3.4%. Over the same period the benchmark SPY performance was 20.4% and 5.7% respectively. Over the previous week the market value of the iM-Composite (SH-RSP) Timer gained 3.34% at a time when SPY gained 2.57%. A starting capital of $100,000 at inception on 6/30/2016 would have grown to $142,622 which includes $5,737 cash and excludes $513 spent on fees and slippage. |
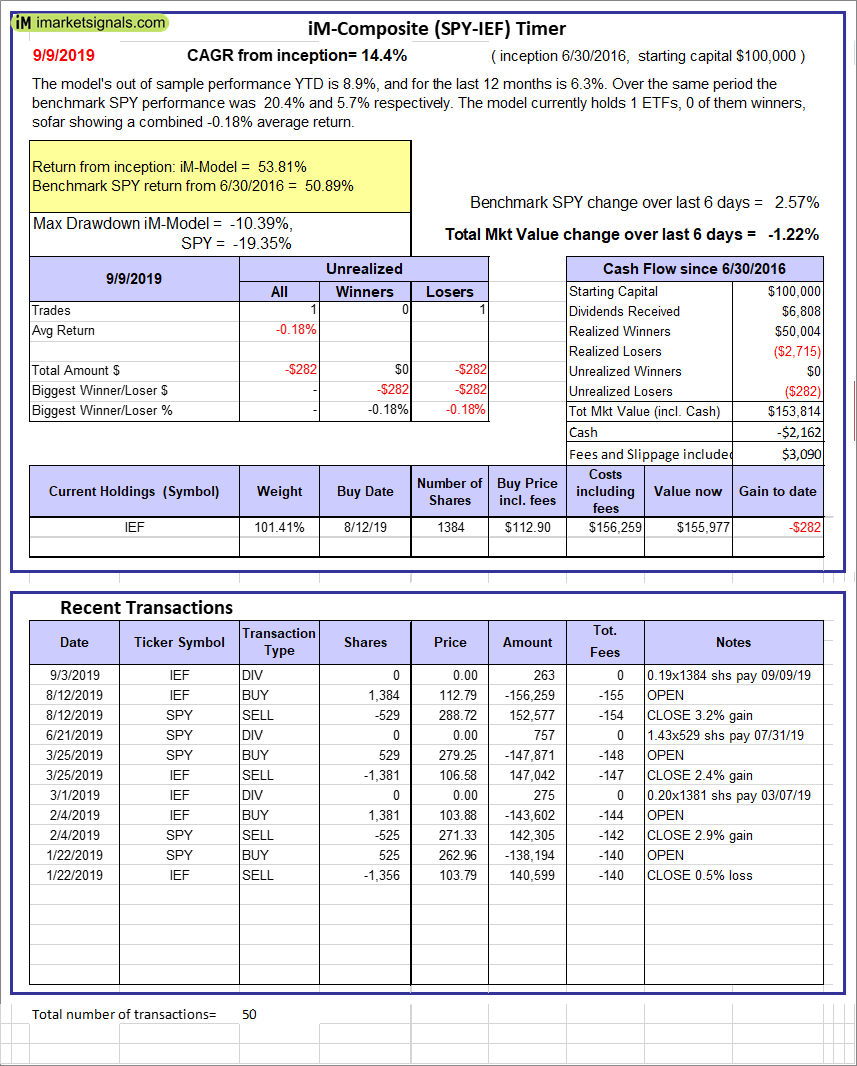 |
iM-Composite (SPY-IEF) Timer: The model’s out of sample performance YTD is 8.9%, and for the last 12 months is 6.3%. Over the same period the benchmark SPY performance was 20.4% and 5.7% respectively. Over the previous week the market value of the iM-Composite (SPY-IEF) Timer gained -1.22% at a time when SPY gained 2.57%. A starting capital of $100,000 at inception on 6/30/2016 would have grown to $153,814 which includes -$2,162 cash and excludes $3,090 spent on fees and slippage. |
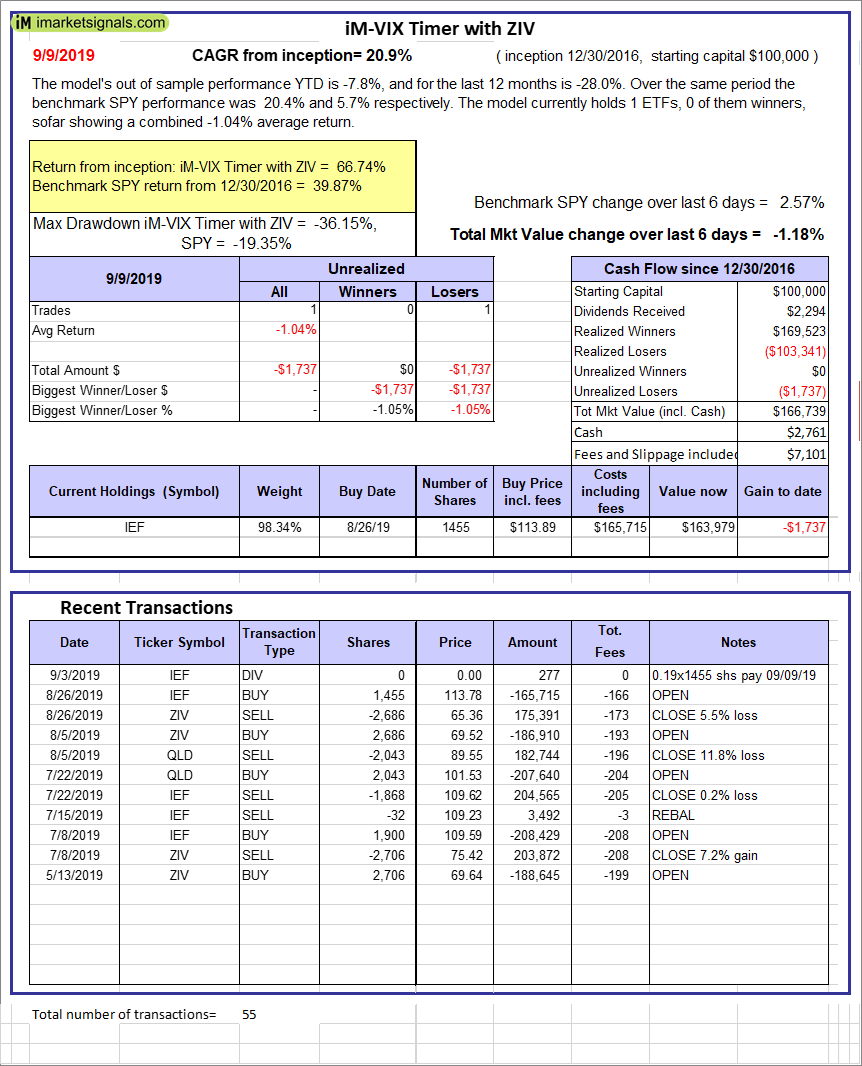 |
iM-VIX Timer with ZIV: The model’s out of sample performance YTD is -7.8%, and for the last 12 months is -28.0%. Over the same period the benchmark SPY performance was 20.4% and 5.7% respectively. Over the previous week the market value of the iM-VIX Timer with ZIV gained -1.18% at a time when SPY gained 2.57%. A starting capital of $100,000 at inception on 6/30/2016 would have grown to $166,739 which includes $2,761 cash and excludes $7,101 spent on fees and slippage. |
 |
iM-Composite(Gold-Stocks-Bond) Timer: The model’s out of sample performance YTD is 13.8%, and for the last 12 months is 5.9%. Over the same period the benchmark SPY performance was 20.4% and 5.7% respectively. Over the previous week the market value of the iM-Composite(Gold-Stocks-Bond) Timer gained -0.56% at a time when SPY gained 2.57%. A starting capital of $100,000 at inception on 6/30/2016 would have grown to $124,838 which includes -$1,119 cash and excludes $3,140 spent on fees and slippage. |
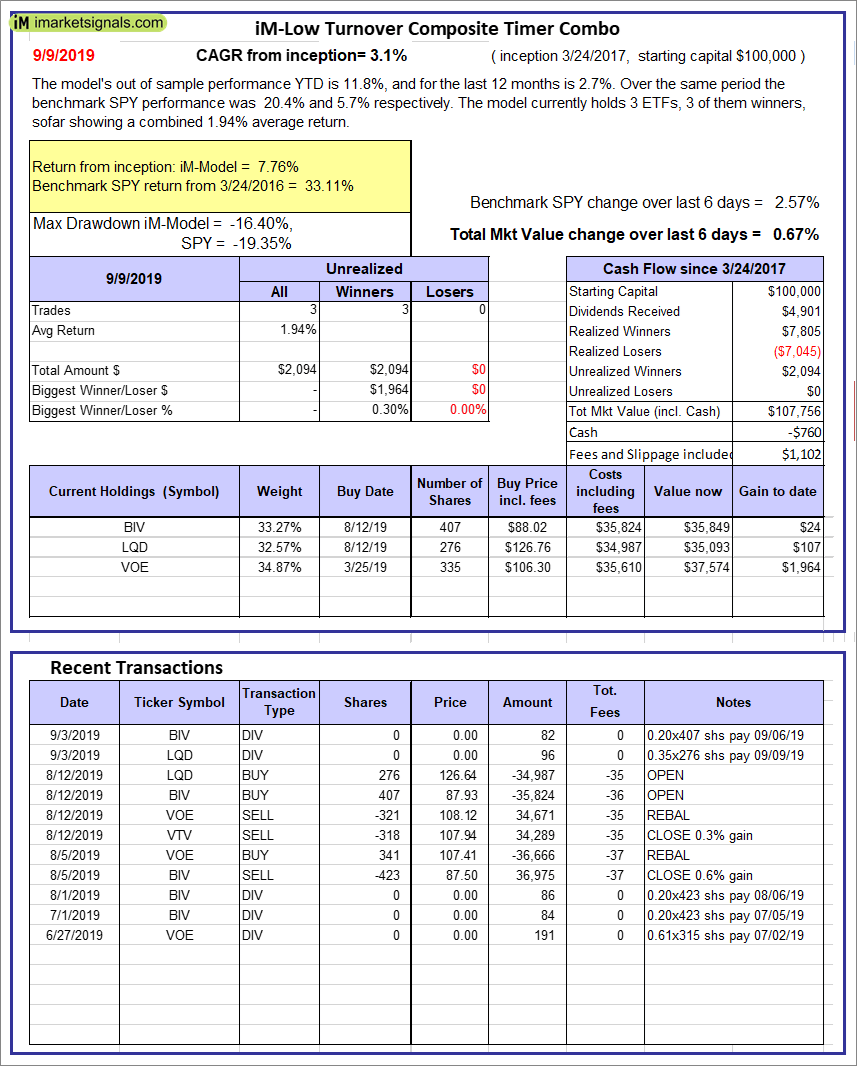 |
iM-Low Turnover Composite Timer Combo: The model’s out of sample performance YTD is 11.8%, and for the last 12 months is 2.7%. Over the same period the benchmark SPY performance was 20.4% and 5.7% respectively. Over the previous week the market value of the iM-Low Turnover Composite Timer Combo gained 0.67% at a time when SPY gained 2.57%. A starting capital of $100,000 at inception on 3/24/27 would have grown to $107,756 which includes -$760 cash and excludes $1,102 spent on fees and slippage. |
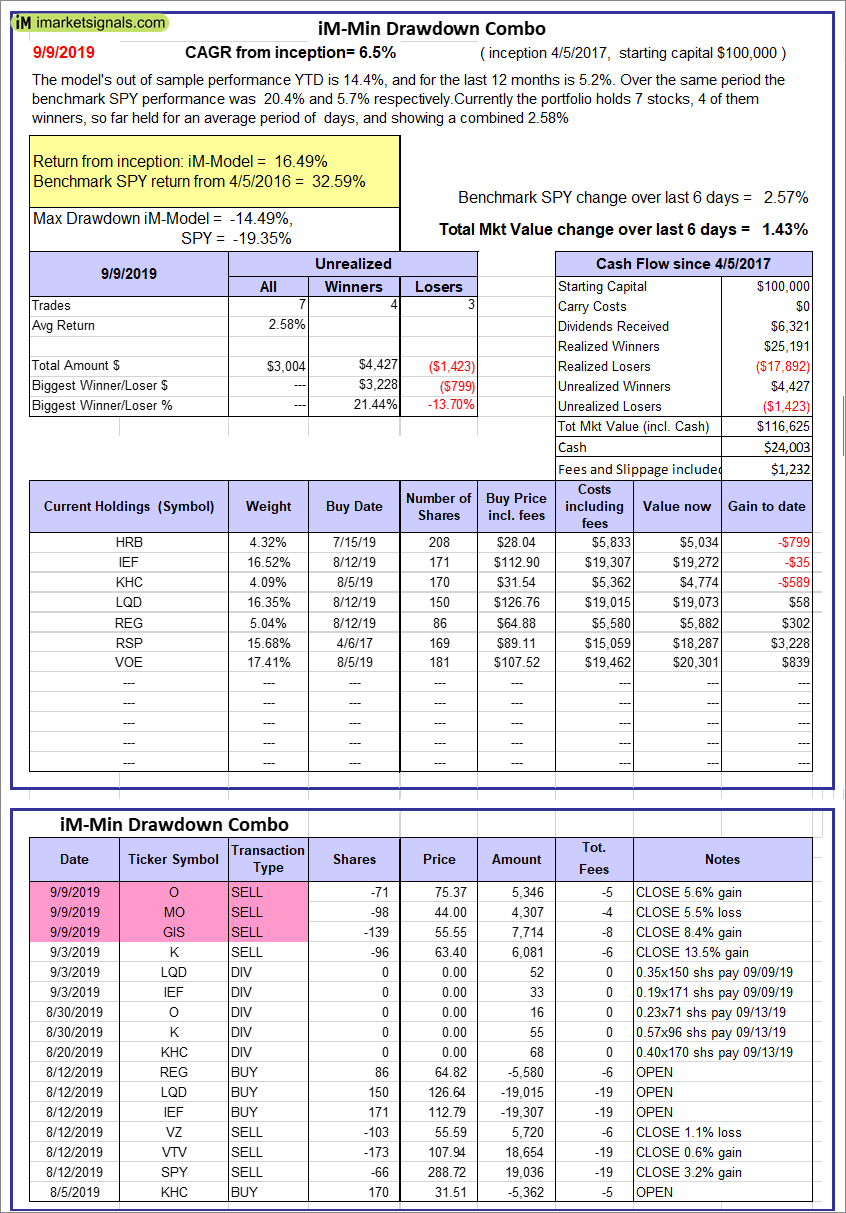 |
iM-Min Drawdown Combo: The model’s out of sample performance YTD is 14.4%, and for the last 12 months is 5.2%. Over the same period the benchmark SPY performance was 20.4% and 5.7% respectively. Over the previous week the market value of the iM-Min Drawdown Combo gained 1.43% at a time when SPY gained 2.57%. A starting capital of $100,000 at inception on 4/5/2017 would have grown to $116,625 which includes $24,003 cash and excludes $1,232 spent on fees and slippage. |
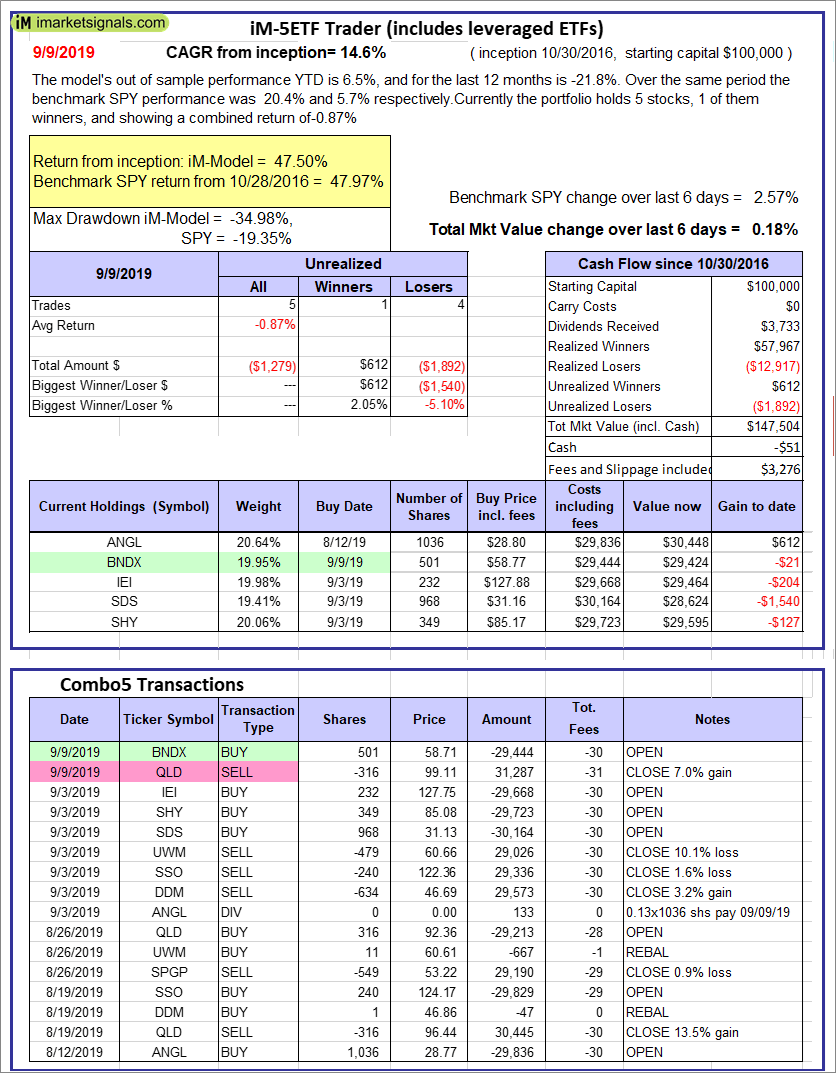 |
iM-5ETF Trader (includes leveraged ETFs): The model’s out of sample performance YTD is 6.5%, and for the last 12 months is -21.8%. Over the same period the benchmark SPY performance was 20.4% and 5.7% respectively. Over the previous week the market value of the iM-5ETF Trader (includes leveraged ETFs) gained 0.18% at a time when SPY gained 2.57%. A starting capital of $100,000 at inception on 10/30/2016 would have grown to $147,504 which includes -$51 cash and excludes $3,276 spent on fees and slippage. |
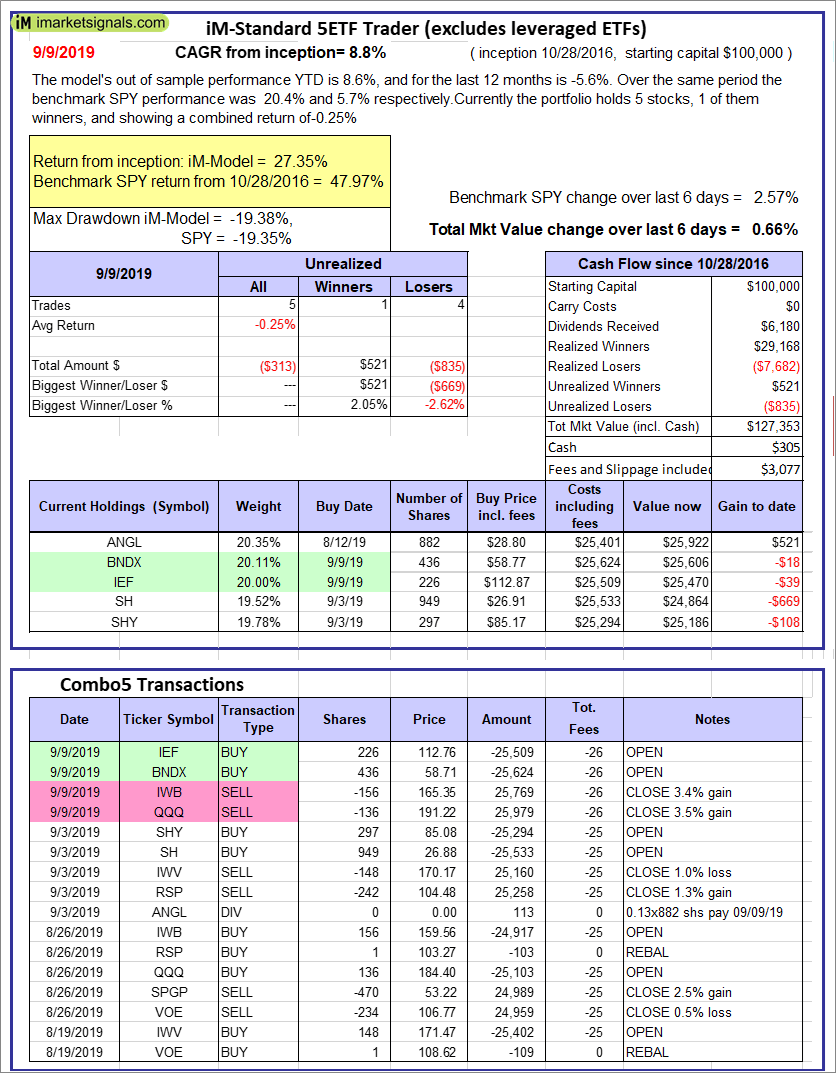 |
iM-Standard 5ETF Trader (excludes leveraged ETFs): The model’s out of sample performance YTD is 8.6%, and for the last 12 months is -5.6%. Over the same period the benchmark SPY performance was 20.4% and 5.7% respectively. Over the previous week the market value of the iM-Standard 5ETF Trader (excludes leveraged ETFs) gained 0.66% at a time when SPY gained 2.57%. A starting capital of $100,000 at inception on 10/30/2016 would have grown to $127,353 which includes $305 cash and excludes $3,077 spent on fees and slippage. |
iM-Best Reports – 9/9/2019
Posted in pmp SPY-SH
Leave a Reply
You must be logged in to post a comment.