
  |
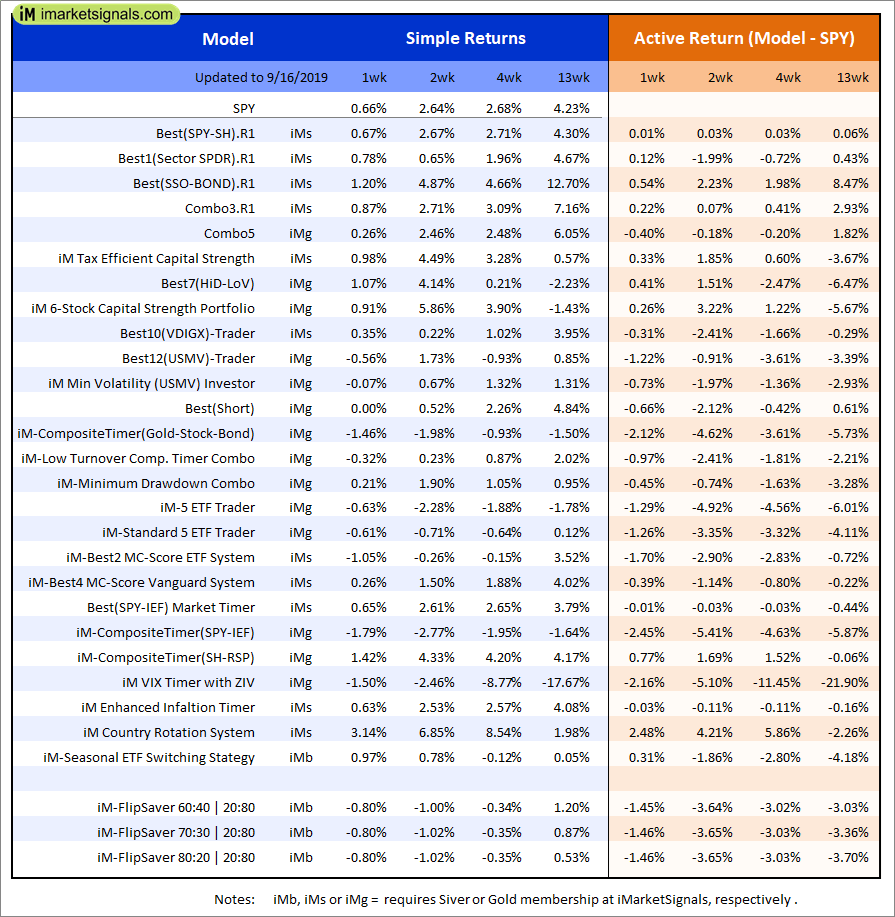
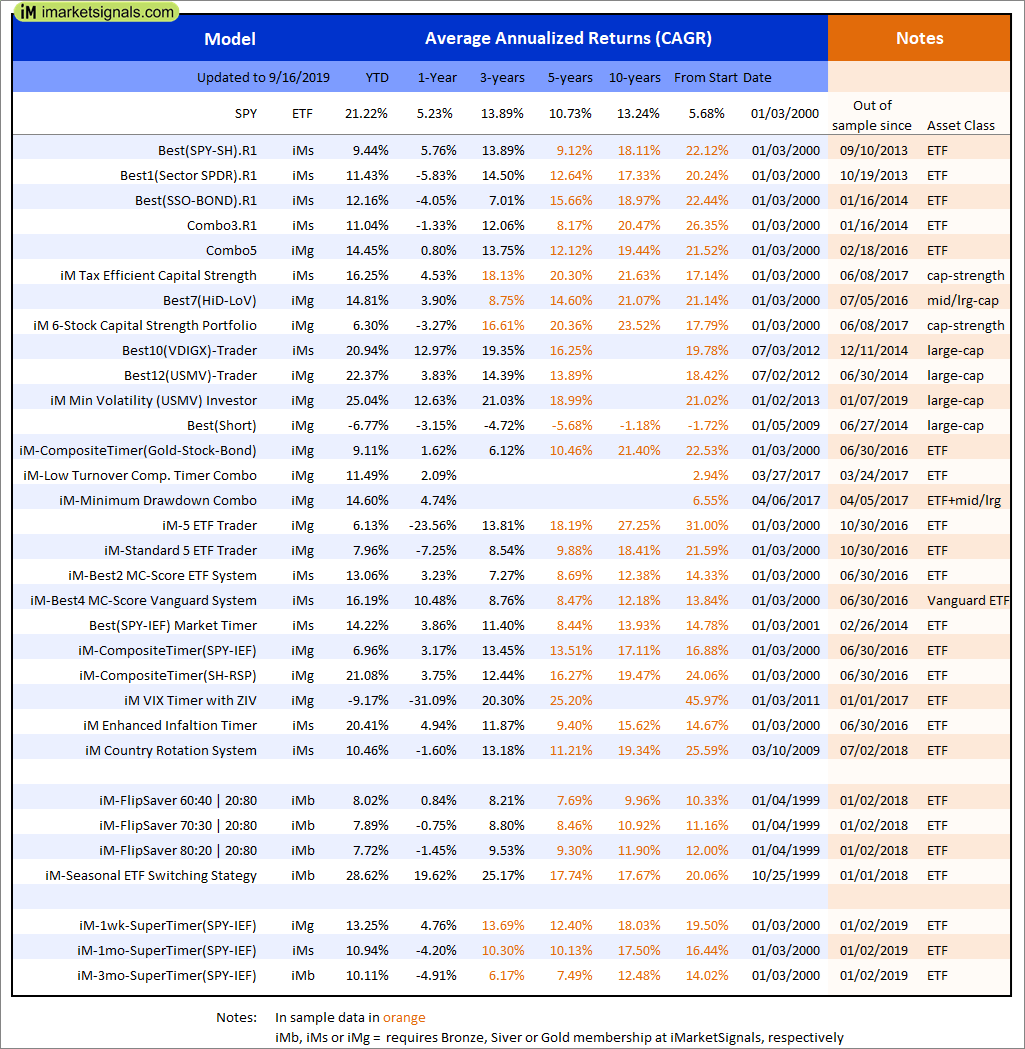
Out of sample performance summary of our models for the past 1, 2, 4 and 13 week periods. The active active return indicates how the models over- or underperformed the benchmark ETF SPY. Also the YTD, and the 1-, 3-, 5- and 10-year annualized returns are shown in the second table |
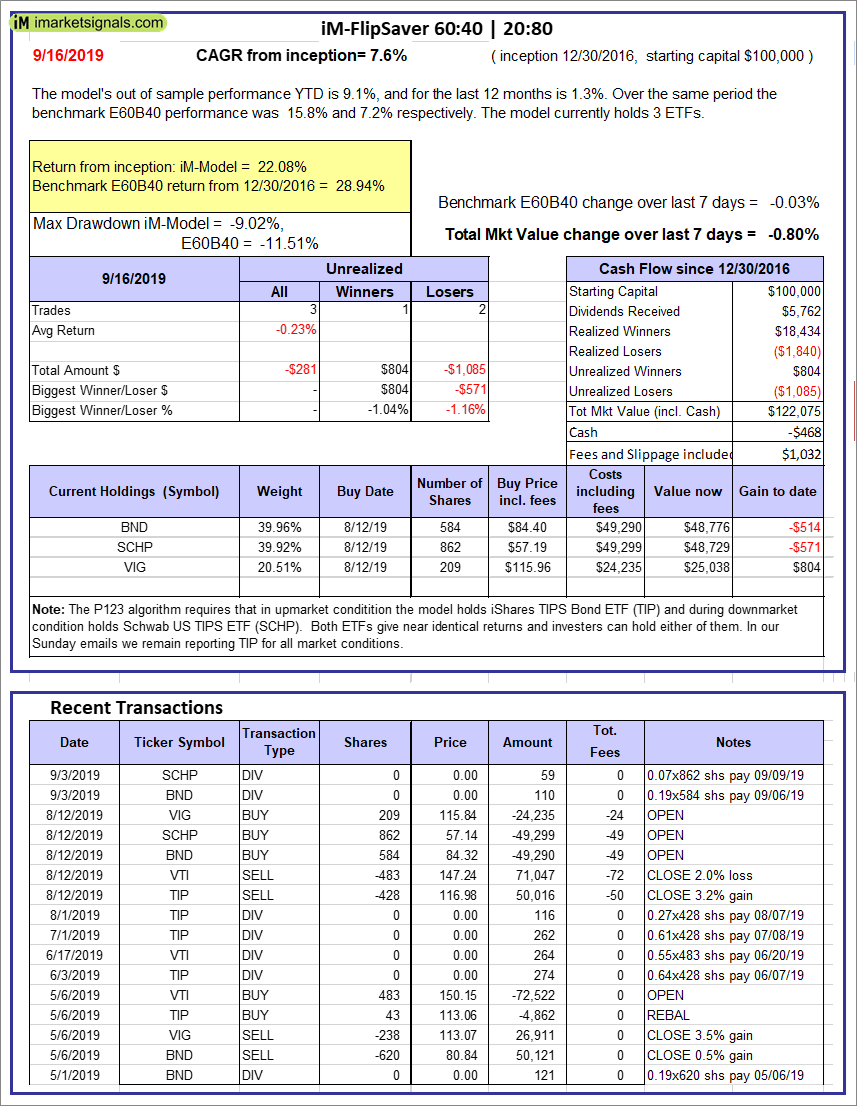 |
iM-FlipSaver 60:40 | 20:80 – 2017: The model’s out of sample performance YTD is 9.1%, and for the last 12 months is 1.3%. Over the same period the benchmark E60B40 performance was 15.8% and 7.2% respectively. Over the previous week the market value of iM-FlipSaver 80:20 | 20:80 gained -0.80% at a time when SPY gained -0.03%. A starting capital of $100,000 at inception on 7/16/2015 would have grown to $122,075 which includes -$468 cash and excludes $1,032 spent on fees and slippage. |
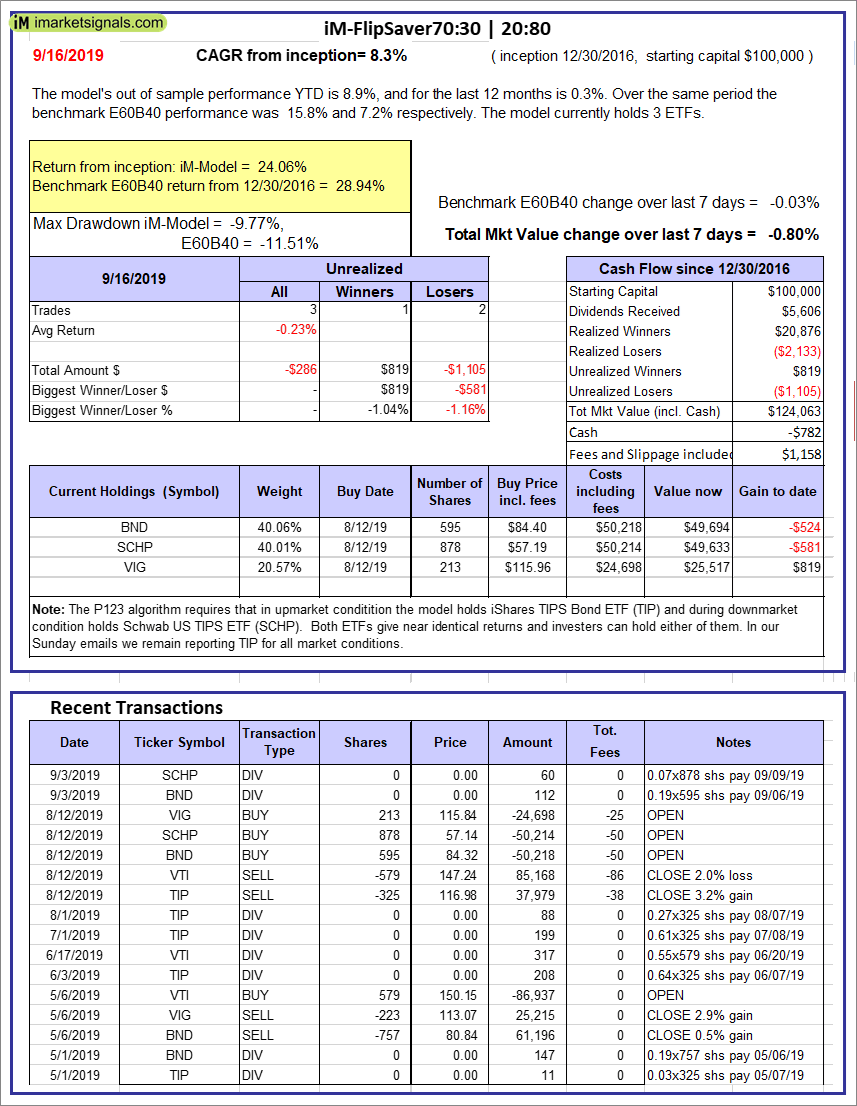 |
iM-FlipSaver 70:30 | 20:80 – 2017: The model’s out of sample performance YTD is 8.9%, and for the last 12 months is 0.3%. Over the same period the benchmark E60B40 performance was 15.8% and 7.2% respectively. Over the previous week the market value of iM-FlipSaver 70:30 | 20:80 gained -0.80% at a time when SPY gained -0.03%. A starting capital of $100,000 at inception on 7/15/2015 would have grown to $124,063 which includes -$782 cash and excludes $1,158 spent on fees and slippage. |
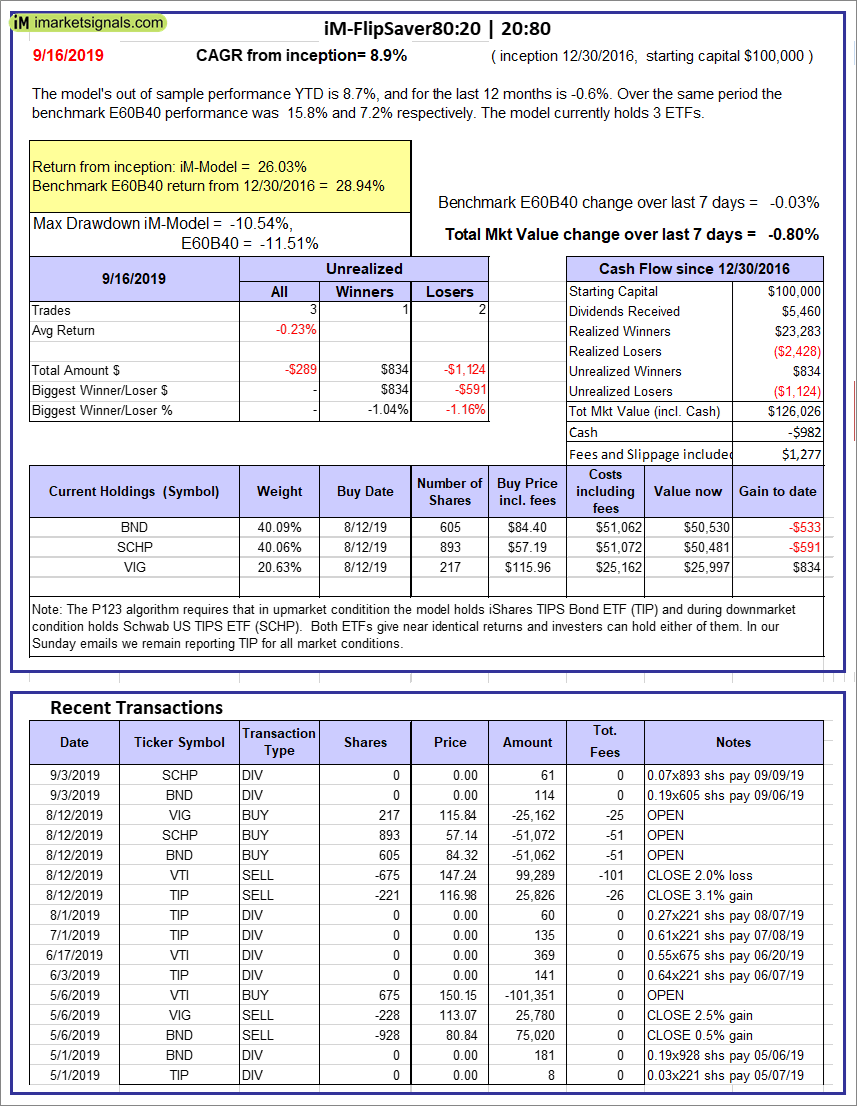 |
iM-FlipSaver 80:20 | 20:80 – 2017: The model’s out of sample performance YTD is 8.7%, and for the last 12 months is -0.6%. Over the same period the benchmark E60B40 performance was 15.8% and 7.2% respectively. Over the previous week the market value of iM-FlipSaver 80:20 | 20:80 gained -0.80% at a time when SPY gained -0.03%. A starting capital of $100,000 at inception on 1/2/2017 would have grown to $126,026 which includes -$982 cash and excludes $1,277 spent on fees and slippage. |
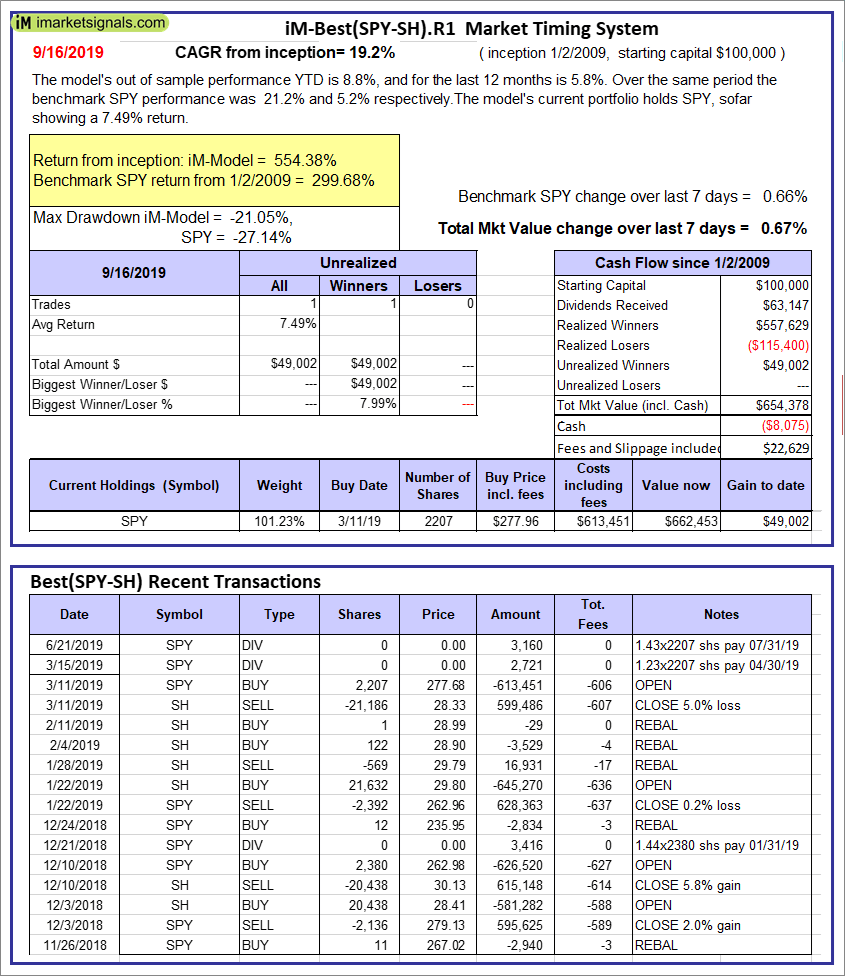 |
iM-Best(SPY-SH).R1: The model’s out of sample performance YTD is 8.8%, and for the last 12 months is 5.8%. Over the same period the benchmark SPY performance was 21.2% and 5.2% respectively. Over the previous week the market value of Best(SPY-SH) gained 0.67% at a time when SPY gained 0.66%. A starting capital of $100,000 at inception on 1/2/2009 would have grown to $654,378 which includes -$8,075 cash and excludes $22,629 spent on fees and slippage. |
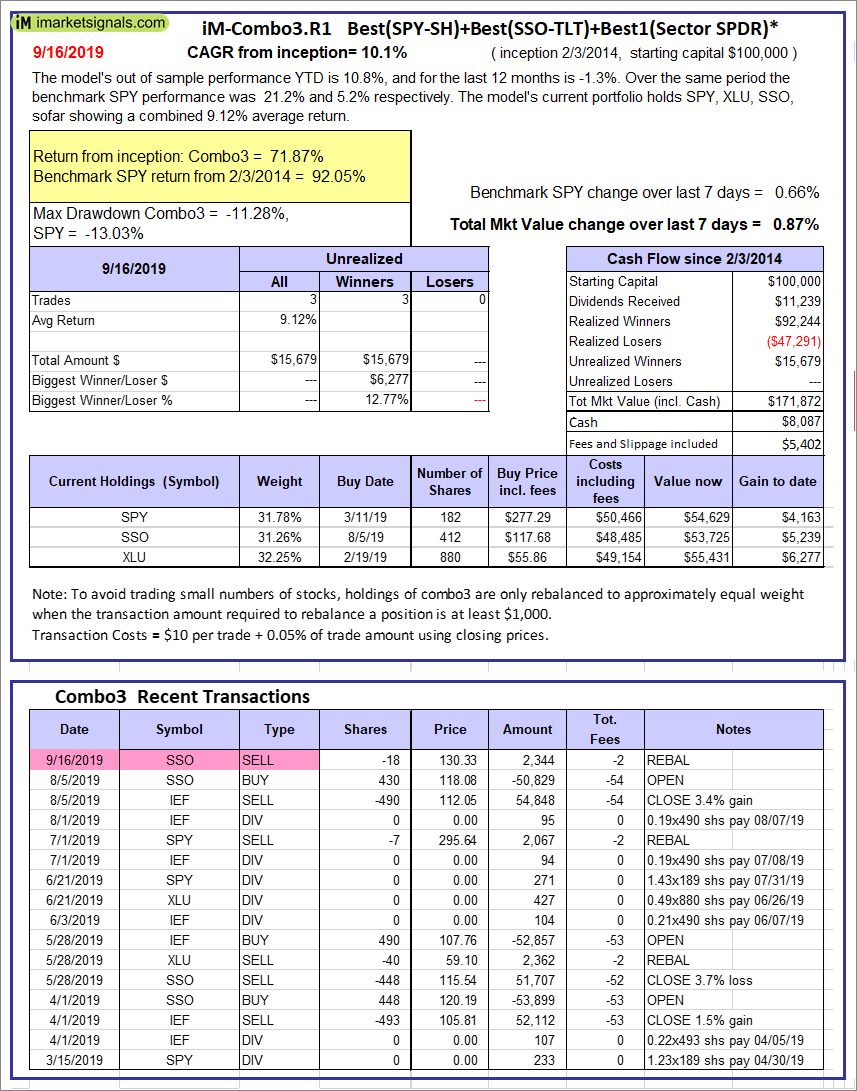 |
iM-Combo3.R1: The model’s out of sample performance YTD is 10.8%, and for the last 12 months is -1.3%. Over the same period the benchmark SPY performance was 21.2% and 5.2% respectively. Over the previous week the market value of iM-Combo3.R1 gained 0.87% at a time when SPY gained 0.66%. A starting capital of $100,000 at inception on 2/3/2014 would have grown to $171,872 which includes $8,087 cash and excludes $5,402 spent on fees and slippage. |
 |
iM-Combo5: The model’s out of sample performance YTD is 14.2%, and for the last 12 months is 0.8%. Over the same period the benchmark SPY performance was 21.2% and 5.2% respectively. Over the previous week the market value of iM-Combo5 gained 0.26% at a time when SPY gained 0.66%. A starting capital of $100,000 at inception on 2/22/2016 would have grown to $145,398 which includes $1,079 cash and excludes $0 spent on fees and slippage. |
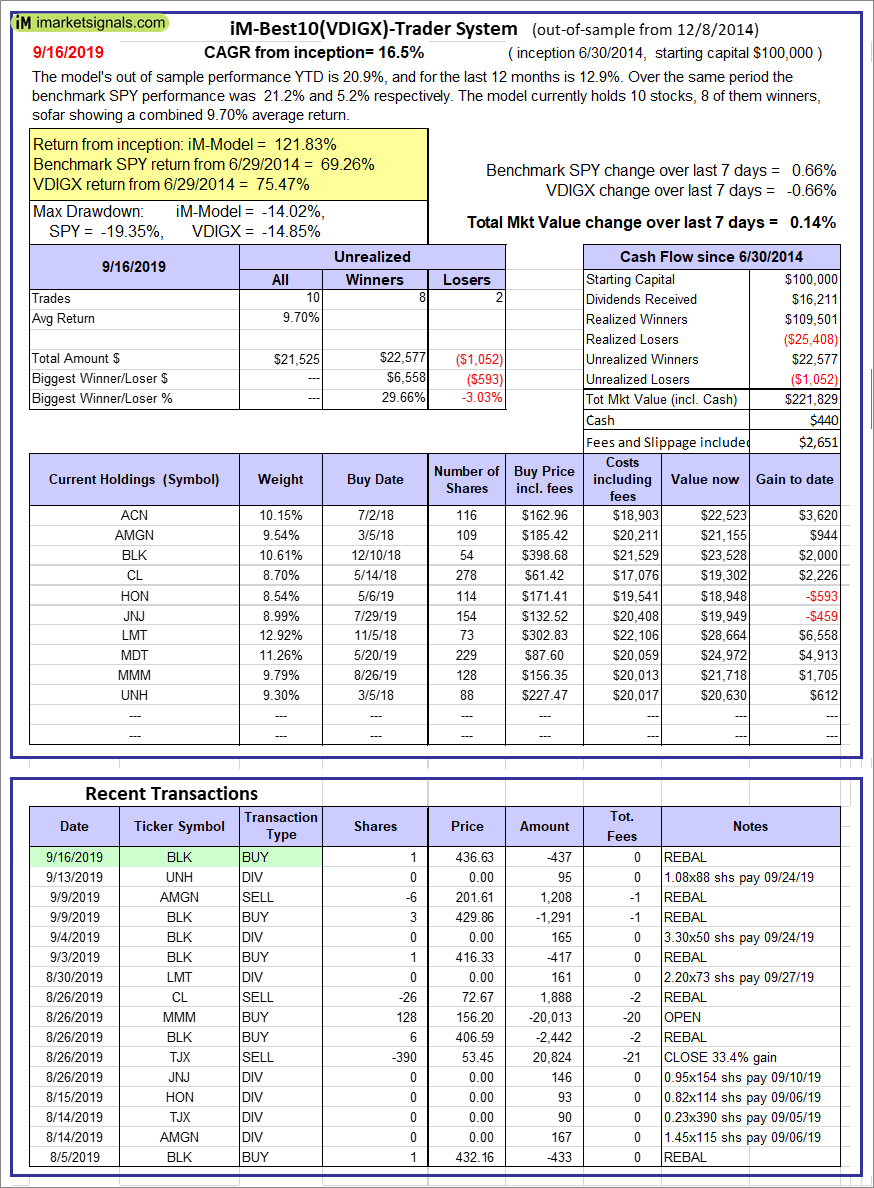 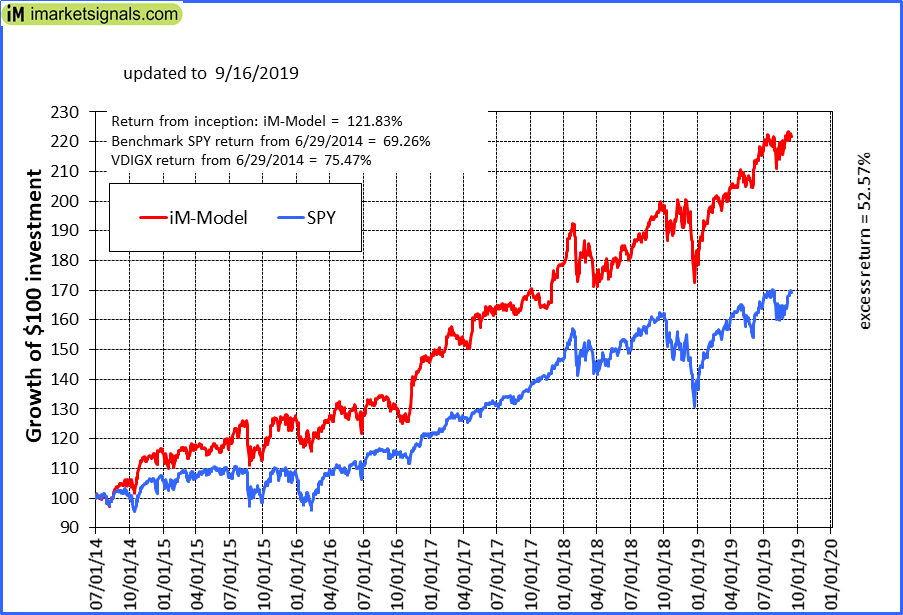 |
iM-Best10(VDIGX)-Trader: The model’s out of sample performance YTD is 20.9%, and for the last 12 months is 12.9%. Over the same period the benchmark SPY performance was 21.2% and 5.2% respectively. Since inception, on 7/1/2014, the model gained 121.83% while the benchmark SPY gained 69.26% and VDIGX gained 75.47% over the same period. Over the previous week the market value of iM-Best10(VDIGX) gained 0.14% at a time when SPY gained 0.66%. A starting capital of $100,000 at inception on 7/1/2014 would have grown to $221,829 which includes $440 cash and excludes $2,651 spent on fees and slippage. |
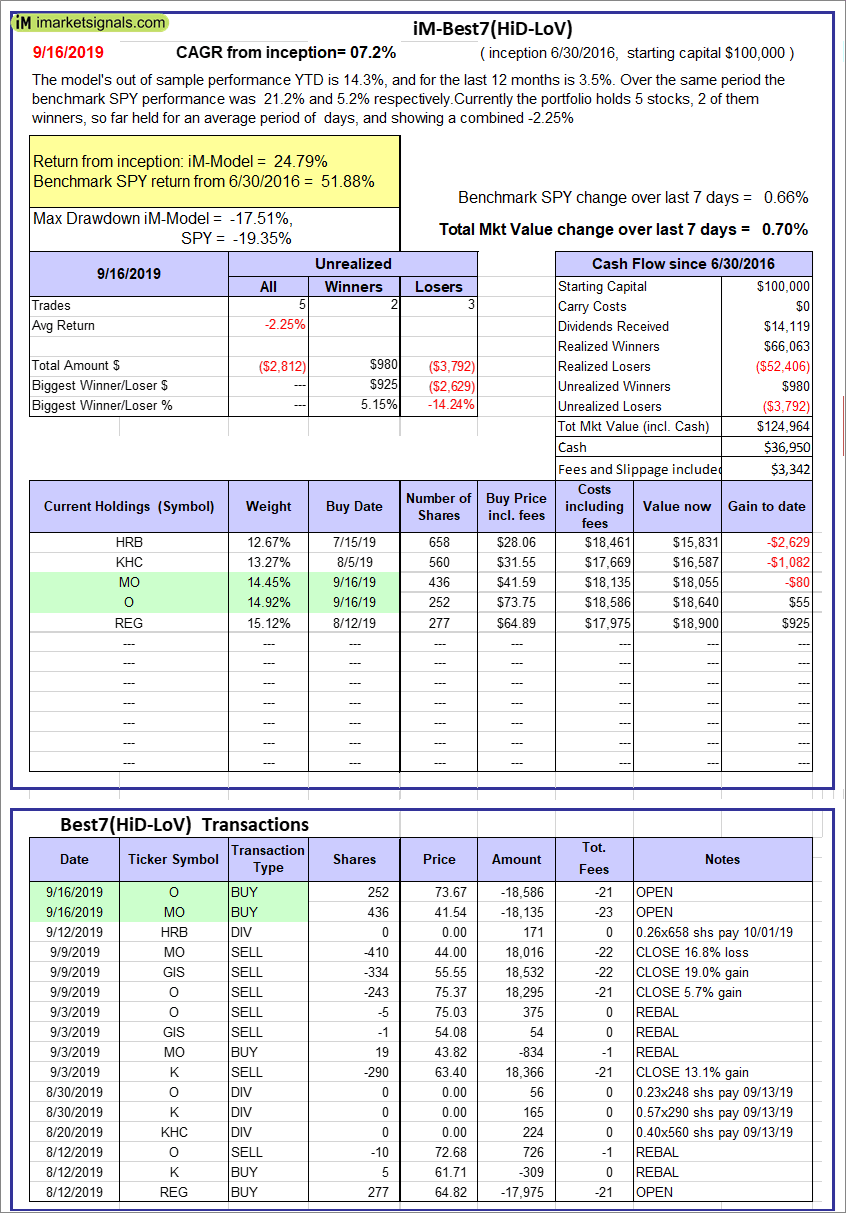 |
iM-Best7(HiD-LoV): The model’s out of sample performance YTD is 14.3%, and for the last 12 months is 3.5%. Over the same period the benchmark SPY performance was 21.2% and 5.2% respectively. Over the previous week the market value of iM-Best7(HiD-LoV) gained 0.70% at a time when SPY gained 0.66%. A starting capital of $100,000 at inception on 6/30/2016 would have grown to $124,964 which includes $36,950 cash and excludes $3,342 spent on fees and slippage. |
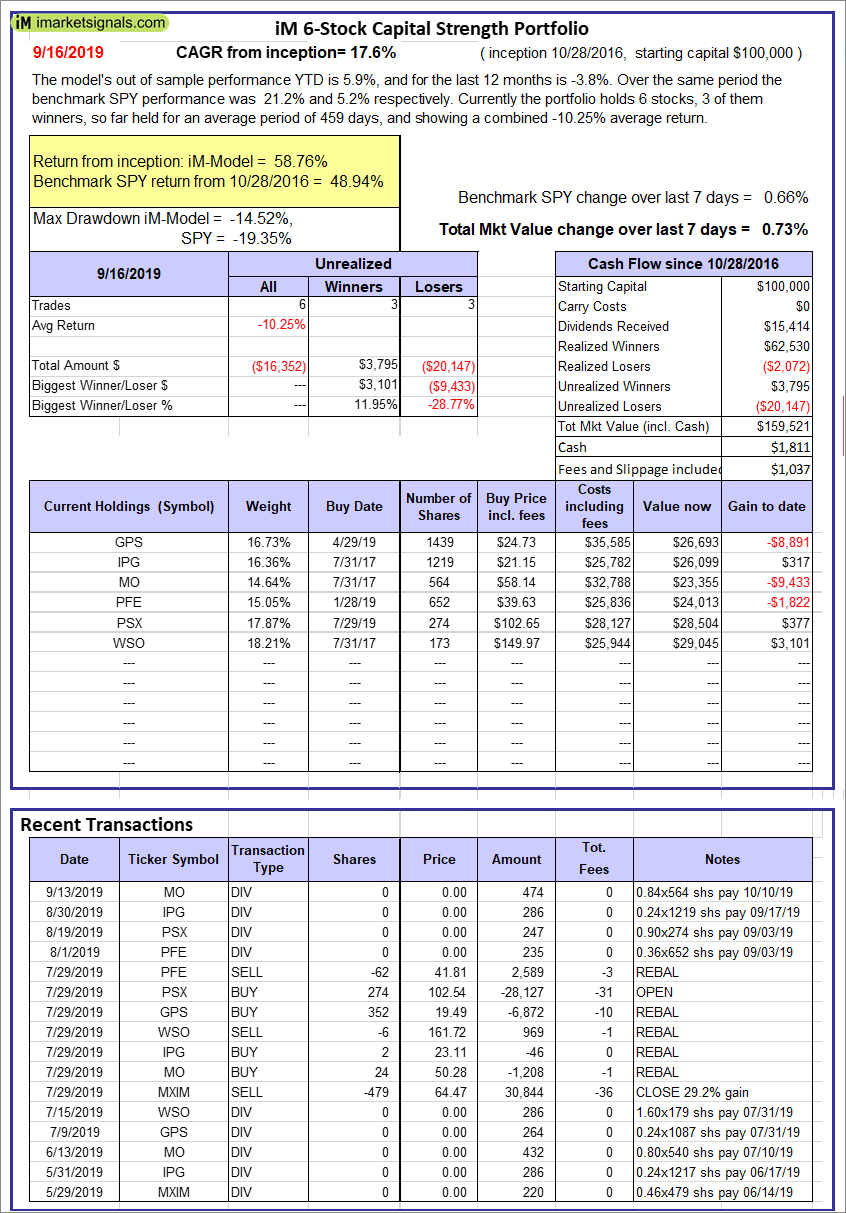 |
iM 6-Stock Capital Strength Portfolio: The model’s out of sample performance YTD is 5.9%, and for the last 12 months is -3.8%. Over the same period the benchmark SPY performance was 21.2% and 5.2% respectively. Over the previous week the market value of the iM 6-Stock Capital Strength Portfolio gained 0.73% at a time when SPY gained 0.66%. A starting capital of $100,000 at inception on 10/28/2016 would have grown to $159,521 which includes $1,811 cash and excludes $1,037 spent on fees and slippage. |
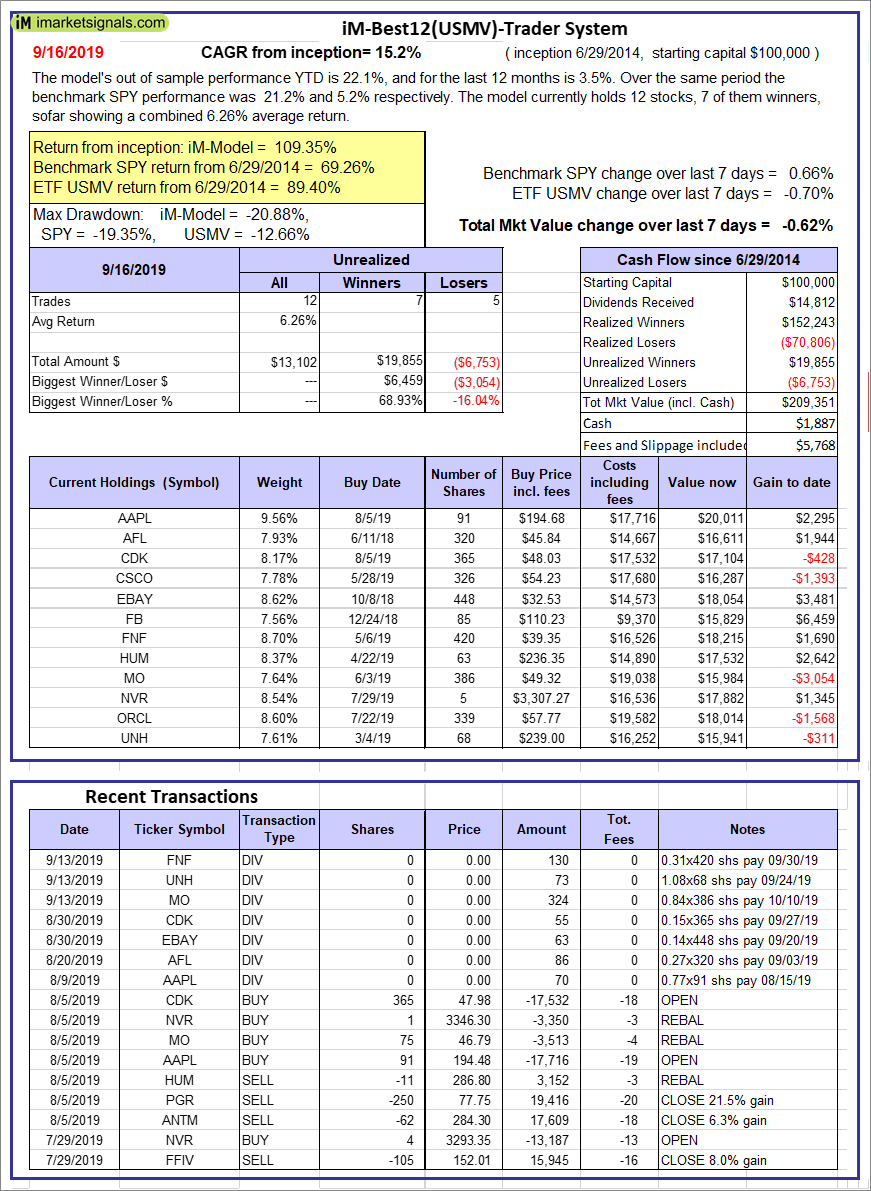 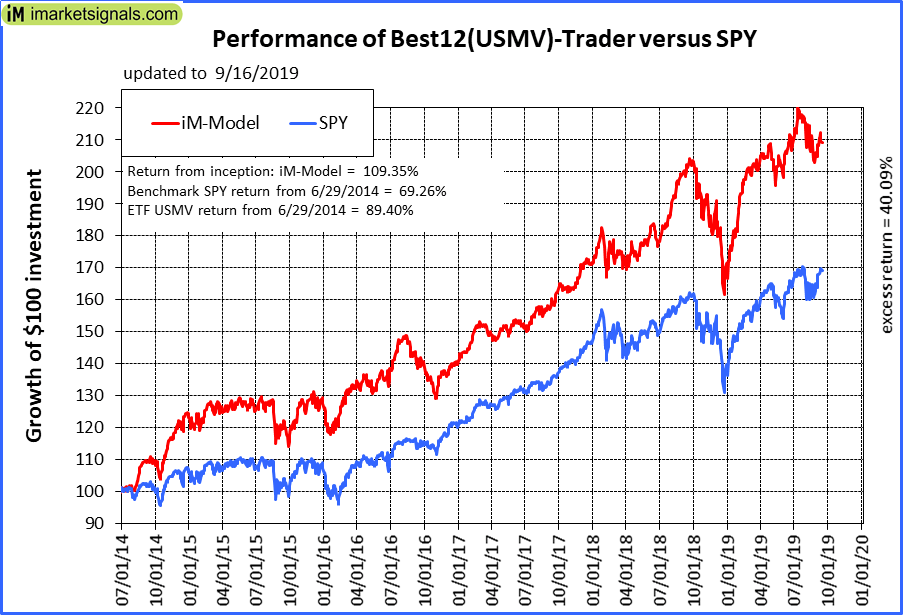 |
iM-Best12(USMV)-Trader: The model’s out of sample performance YTD is 22.1%, and for the last 12 months is 3.5%. Over the same period the benchmark SPY performance was 21.2% and 5.2% respectively. Since inception, on 6/30/2014, the model gained 109.35% while the benchmark SPY gained 69.26% and the ETF USMV gained 89.40% over the same period. Over the previous week the market value of iM-Best12(USMV)-Trader gained -0.62% at a time when SPY gained 0.66%. A starting capital of $100,000 at inception on 6/30/2014 would have grown to $209,351 which includes $1,887 cash and excludes $5,768 spent on fees and slippage. |
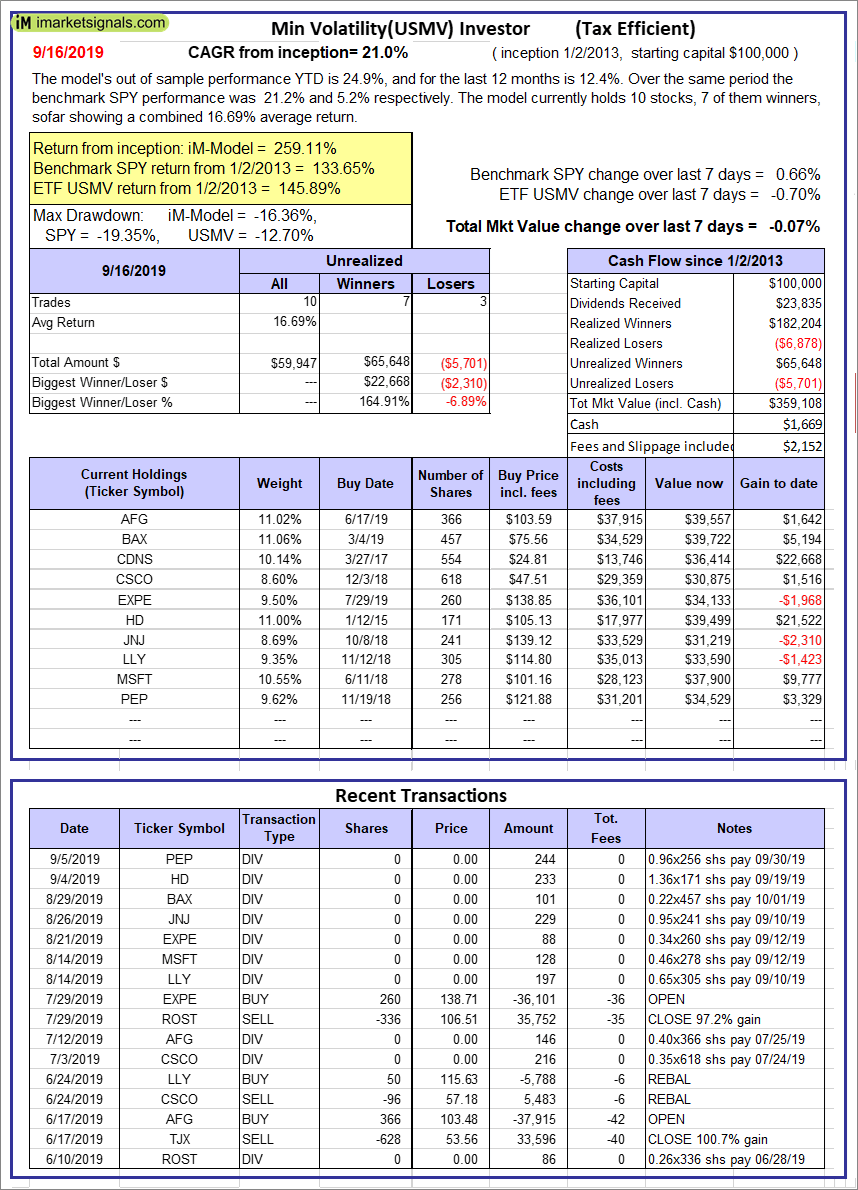 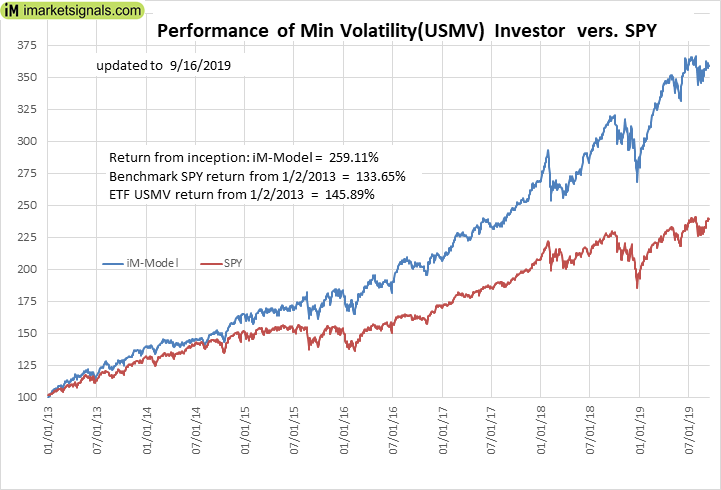 |
iM Min Volatility (USMV) Investor: The model’s out of sample performance YTD is 24.9%, and for the last 12 months is 12.4%. Over the same period the benchmark SPY performance was 21.2% and 5.2% respectively. Since inception, on 1/3/2013, the model gained 259.11% while the benchmark SPY gained 133.65% and the ETF USMV gained 145.89% over the same period. Over the previous week the market value of iM Min Volatility (USMV) Investor gained -0.07% at a time when SPY gained 0.66%. A starting capital of $100,000 at inception on 1/3/2013 would have grown to $359,108 which includes $1,669 cash and excludes $2,152 spent on fees and slippage. |
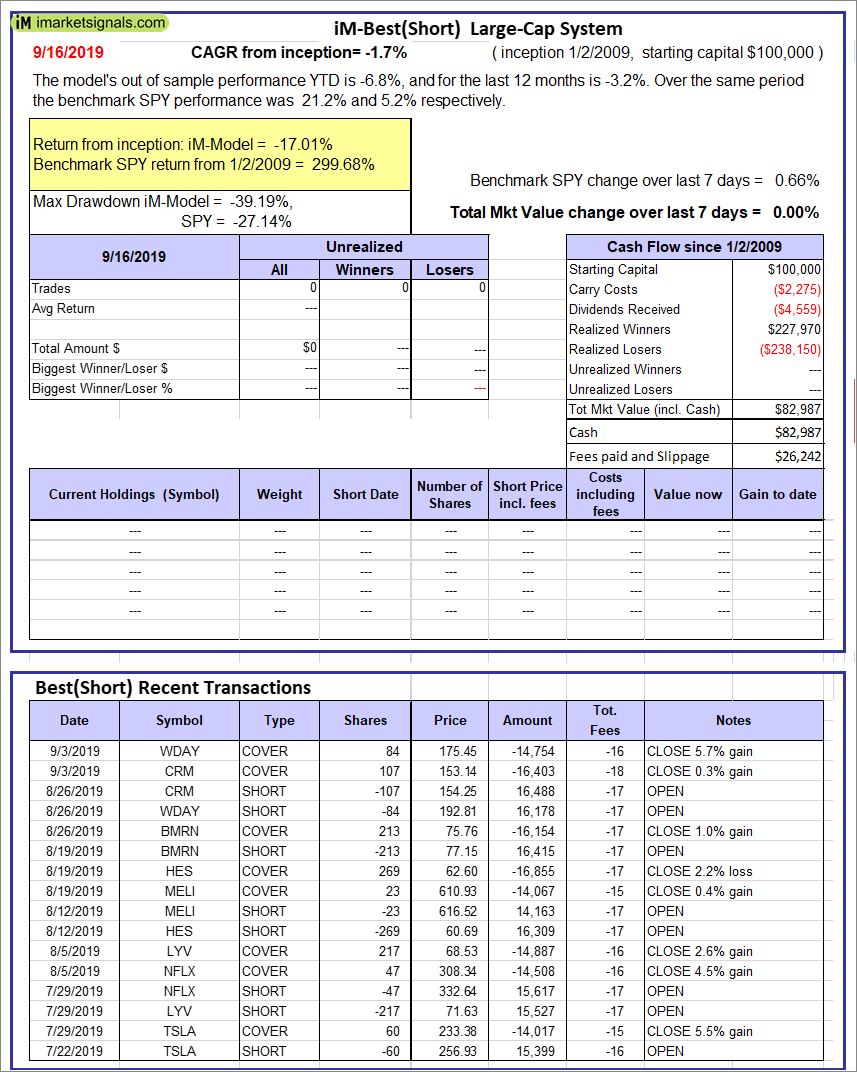 |
iM-Best(Short): The model’s out of sample performance YTD is -6.8%, and for the last 12 months is -3.2%. Over the same period the benchmark SPY performance was 21.2% and 5.2% respectively. Over the previous week the market value of iM-Best(Short) gained 0.00% at a time when SPY gained 0.66%. Over the period 1/2/2009 to 9/16/2019 the starting capital of $100,000 would have grown to $82,987 which includes $82,987 cash and excludes $26,242 spent on fees and slippage. |
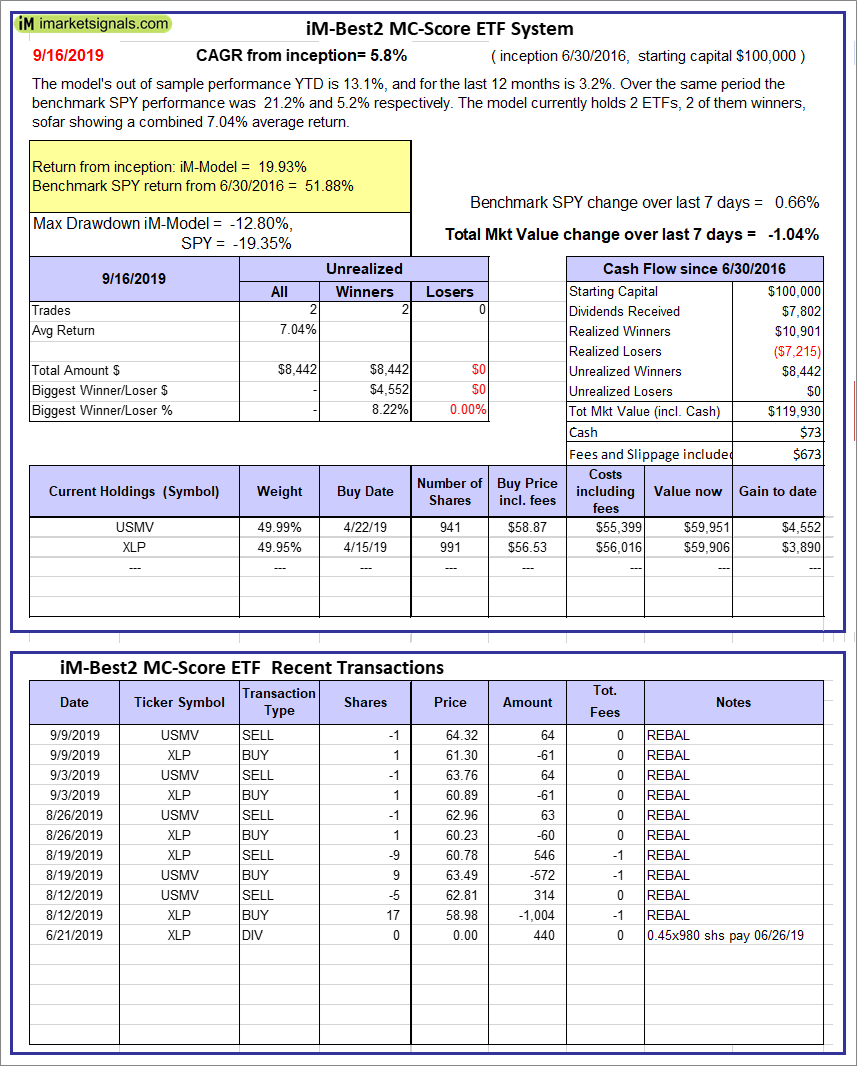 |
iM-Best2 MC-Score ETF System: The model’s out of sample performance YTD is 13.1%, and for the last 12 months is 3.2%. Over the same period the benchmark SPY performance was 21.2% and 5.2% respectively. Over the previous week the market value of the iM-Best2 MC-Score ETF System gained -1.04% at a time when SPY gained 0.66%. A starting capital of $100,000 at inception on 6/30/2016 would have grown to $119,930 which includes $73 cash and excludes $673 spent on fees and slippage. |
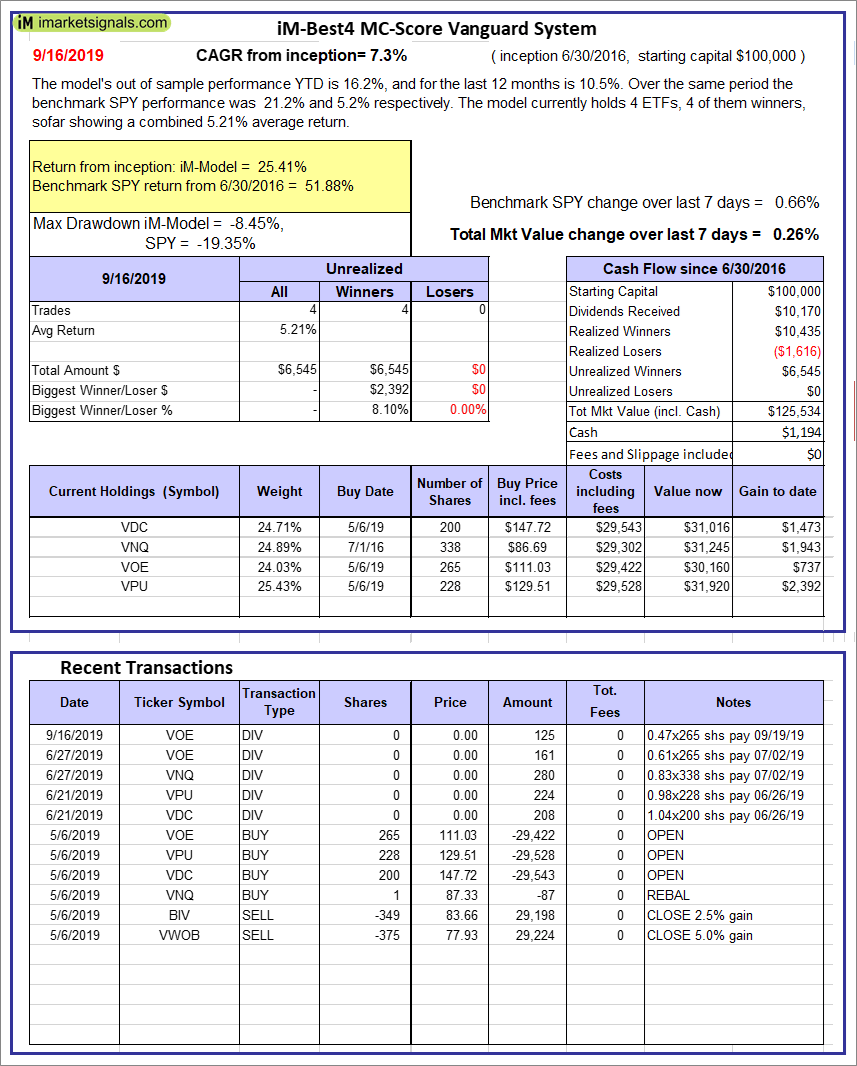 |
iM-Best4 MC-Score Vanguard System: The model’s out of sample performance YTD is 16.2%, and for the last 12 months is 10.5%. Over the same period the benchmark SPY performance was 21.2% and 5.2% respectively. Over the previous week the market value of the iM-Best4 MC-Score Vanguard System gained 0.26% at a time when SPY gained 0.66%. A starting capital of $100,000 at inception on 6/30/2016 would have grown to $125,534 which includes $1,194 cash and excludes $00 spent on fees and slippage. |
 |
iM-Composite (SH-RSP) Timer: The model’s out of sample performance YTD is 20.4%, and for the last 12 months is 3.6%. Over the same period the benchmark SPY performance was 21.2% and 5.2% respectively. Over the previous week the market value of the iM-Composite (SH-RSP) Timer gained 1.38% at a time when SPY gained 0.66%. A starting capital of $100,000 at inception on 6/30/2016 would have grown to $144,596 which includes $5,737 cash and excludes $513 spent on fees and slippage. |
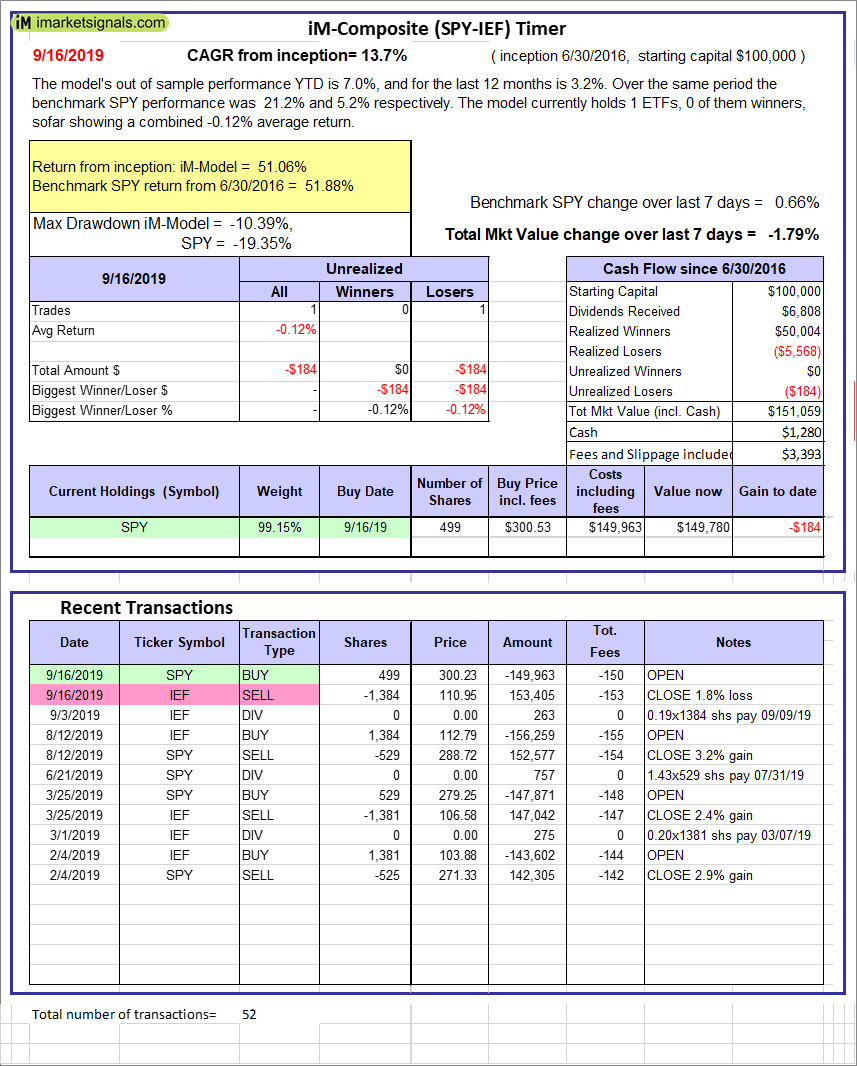 |
iM-Composite (SPY-IEF) Timer: The model’s out of sample performance YTD is 7.0%, and for the last 12 months is 3.2%. Over the same period the benchmark SPY performance was 21.2% and 5.2% respectively. Over the previous week the market value of the iM-Composite (SPY-IEF) Timer gained -1.79% at a time when SPY gained 0.66%. A starting capital of $100,000 at inception on 6/30/2016 would have grown to $151,059 which includes $1,280 cash and excludes $3,393 spent on fees and slippage. |
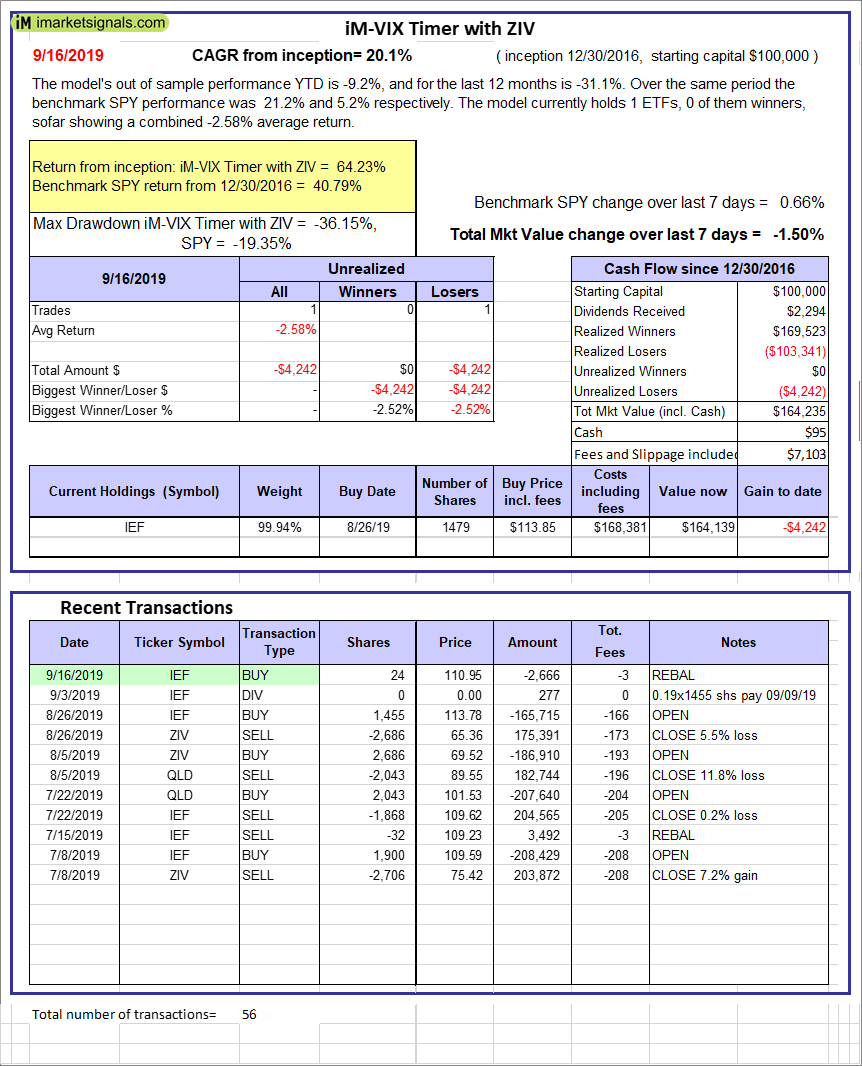 |
iM-VIX Timer with ZIV: The model’s out of sample performance YTD is -9.2%, and for the last 12 months is -31.1%. Over the same period the benchmark SPY performance was 21.2% and 5.2% respectively. Over the previous week the market value of the iM-VIX Timer with ZIV gained -1.50% at a time when SPY gained 0.66%. A starting capital of $100,000 at inception on 6/30/2016 would have grown to $164,235 which includes $95 cash and excludes $7,103 spent on fees and slippage. |
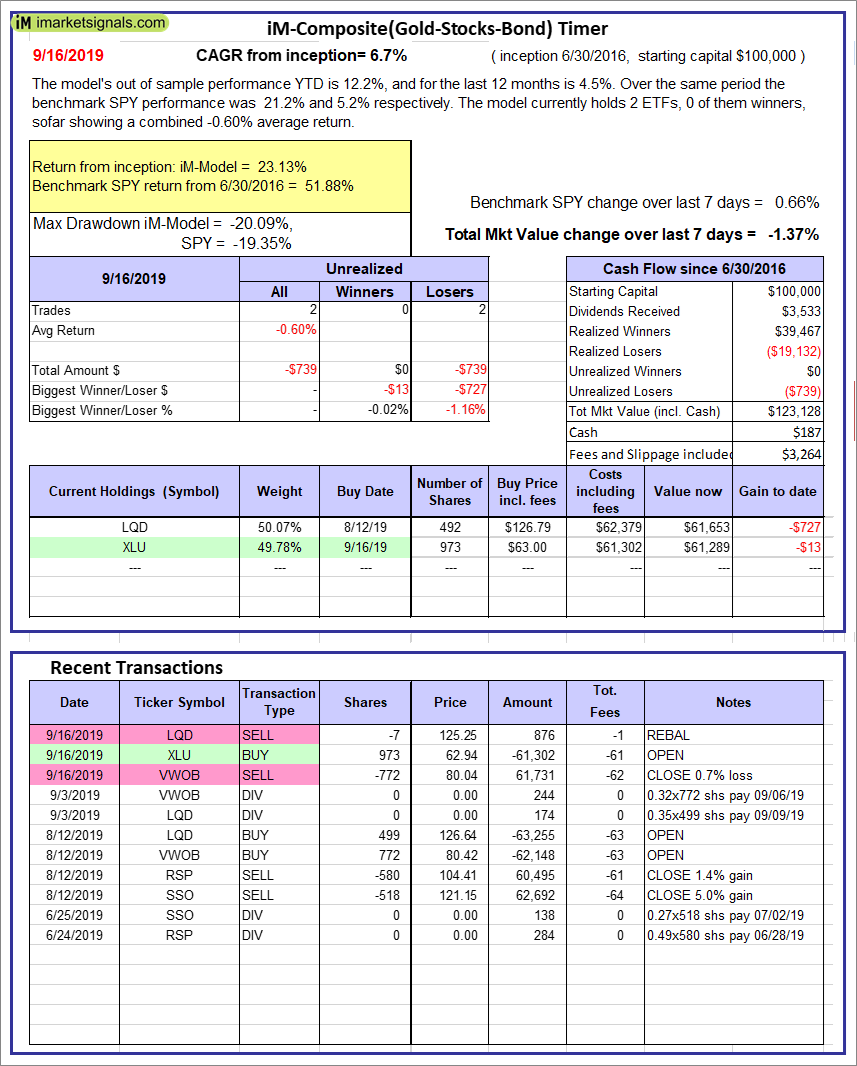 |
iM-Composite(Gold-Stocks-Bond) Timer: The model’s out of sample performance YTD is 12.2%, and for the last 12 months is 4.5%. Over the same period the benchmark SPY performance was 21.2% and 5.2% respectively. Over the previous week the market value of the iM-Composite(Gold-Stocks-Bond) Timer gained -1.37% at a time when SPY gained 0.66%. A starting capital of $100,000 at inception on 6/30/2016 would have grown to $123,128 which includes $187 cash and excludes $3,264 spent on fees and slippage. |
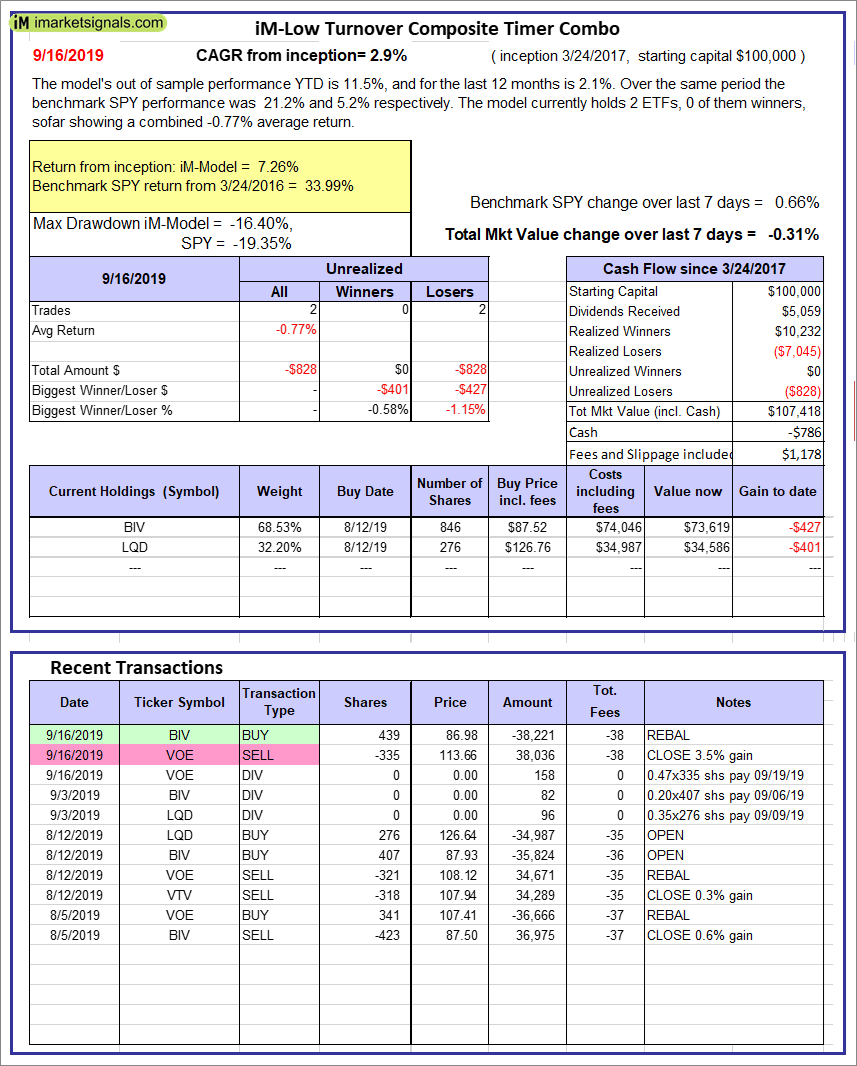 |
iM-Low Turnover Composite Timer Combo: The model’s out of sample performance YTD is 11.5%, and for the last 12 months is 2.1%. Over the same period the benchmark SPY performance was 21.2% and 5.2% respectively. Over the previous week the market value of the iM-Low Turnover Composite Timer Combo gained -0.31% at a time when SPY gained 0.66%. A starting capital of $100,000 at inception on 3/24/27 would have grown to $107,418 which includes -$786 cash and excludes $1,178 spent on fees and slippage. |
 |
iM-Min Drawdown Combo: The model’s out of sample performance YTD is 14.6%, and for the last 12 months is 4.7%. Over the same period the benchmark SPY performance was 21.2% and 5.2% respectively. Over the previous week the market value of the iM-Min Drawdown Combo gained 0.20% at a time when SPY gained 0.66%. A starting capital of $100,000 at inception on 4/5/2017 would have grown to $116,863 which includes $12,849 cash and excludes $1,322 spent on fees and slippage. |
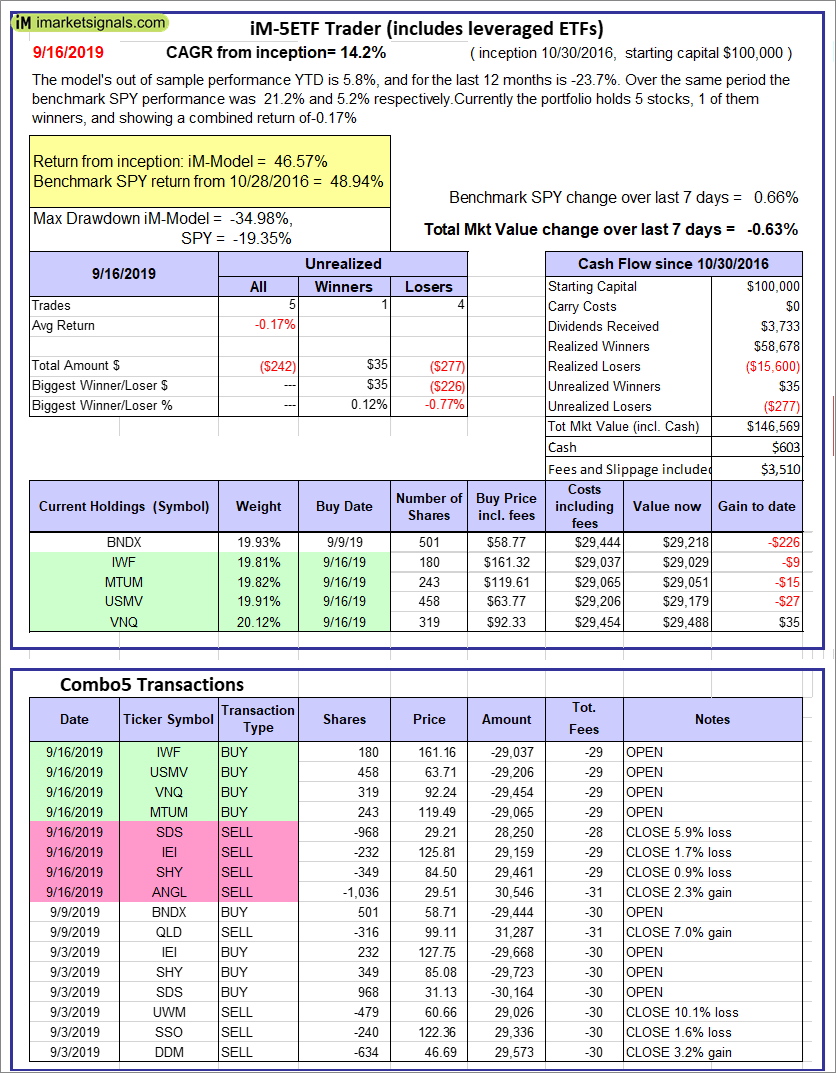 |
iM-5ETF Trader (includes leveraged ETFs): The model’s out of sample performance YTD is 5.8%, and for the last 12 months is -23.7%. Over the same period the benchmark SPY performance was 21.2% and 5.2% respectively. Over the previous week the market value of the iM-5ETF Trader (includes leveraged ETFs) gained -0.63% at a time when SPY gained 0.66%. A starting capital of $100,000 at inception on 10/30/2016 would have grown to $146,569 which includes $603 cash and excludes $3,510 spent on fees and slippage. |
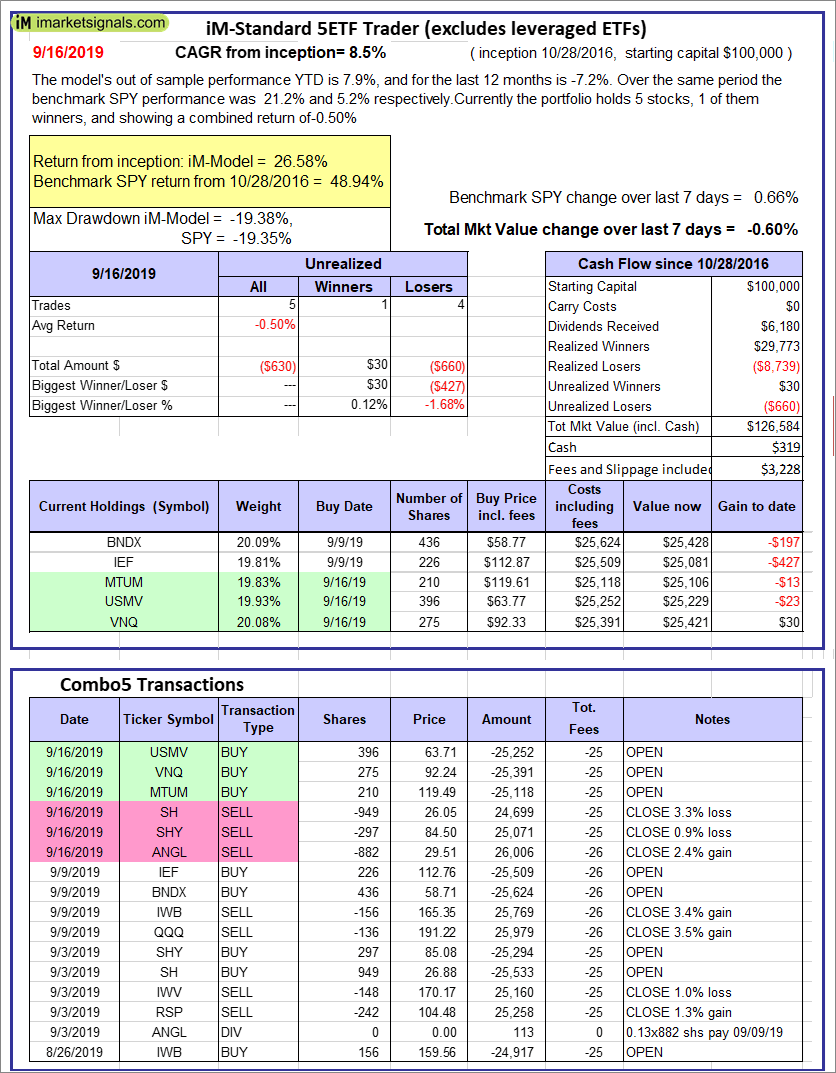 |
iM-Standard 5ETF Trader (excludes leveraged ETFs): The model’s out of sample performance YTD is 7.9%, and for the last 12 months is -7.2%. Over the same period the benchmark SPY performance was 21.2% and 5.2% respectively. Over the previous week the market value of the iM-Standard 5ETF Trader (excludes leveraged ETFs) gained -0.60% at a time when SPY gained 0.66%. A starting capital of $100,000 at inception on 10/30/2016 would have grown to $126,584 which includes $319 cash and excludes $3,228 spent on fees and slippage. |
iM-Best Reports – 9/16/2019
Posted in pmp SPY-SH
Leave a Reply
You must be logged in to post a comment.