
  |
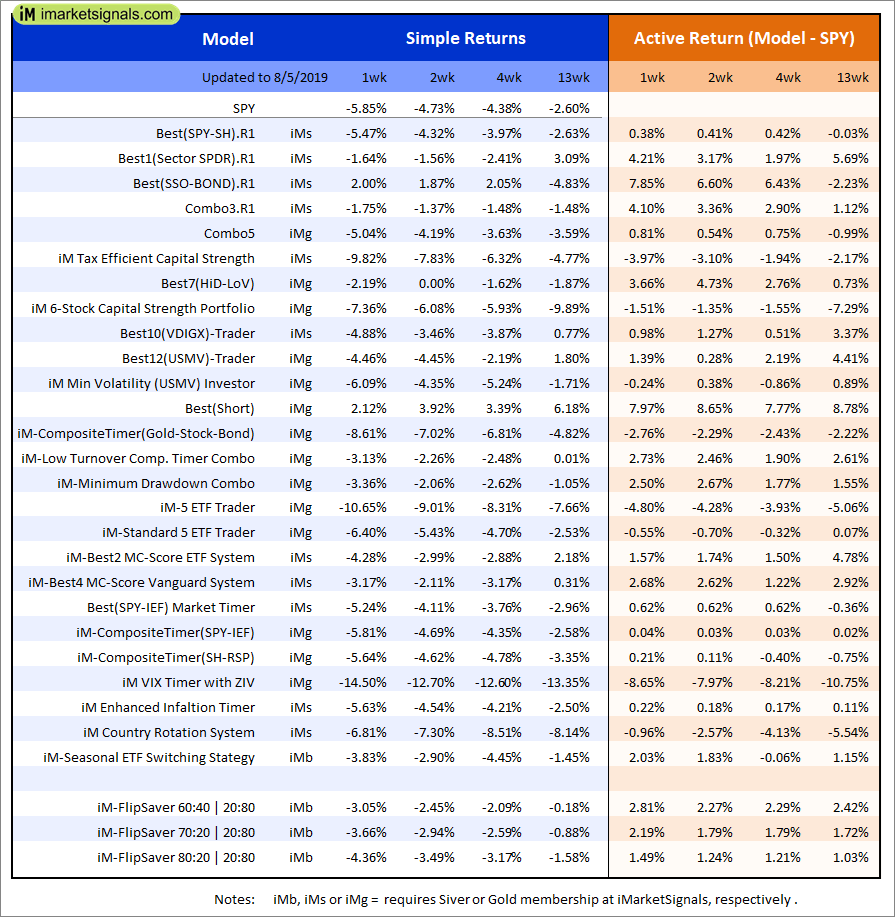
Out of sample performance summary of our models for the past 1, 2, 4 and 13 week periods. The active active return indicates how the models over- or underperformed the benchmark ETF SPY. Also the YTD, and the 1-, 3-, 5- and 10-year annualized returns are shown in the second table |
 |
iM-FlipSaver 60:40 | 20:80 – 2017: The model’s out of sample performance YTD is 8.0%, and for the last 12 months is 1.9%. Over the same period the benchmark E60B40 performance was 11.9% and 5.2% respectively. Over the previous week the market value of iM-FlipSaver 80:20 | 20:80 gained -3.02% at a time when SPY gained -3.02%. A starting capital of $100,000 at inception on 7/16/2015 would have grown to $120,820 which includes $1,125 cash and excludes $788 spent on fees and slippage. |
 |
iM-FlipSaver 70:30 | 20:80 – 2017: The model’s out of sample performance YTD is 7.7%, and for the last 12 months is 1.2%. Over the same period the benchmark E60B40 performance was 11.9% and 5.2% respectively. Over the previous week the market value of iM-FlipSaver 70:30 | 20:80 gained -3.72% at a time when SPY gained -3.02%. A starting capital of $100,000 at inception on 7/15/2015 would have grown to $122,723 which includes $1,029 cash and excludes $909 spent on fees and slippage. |
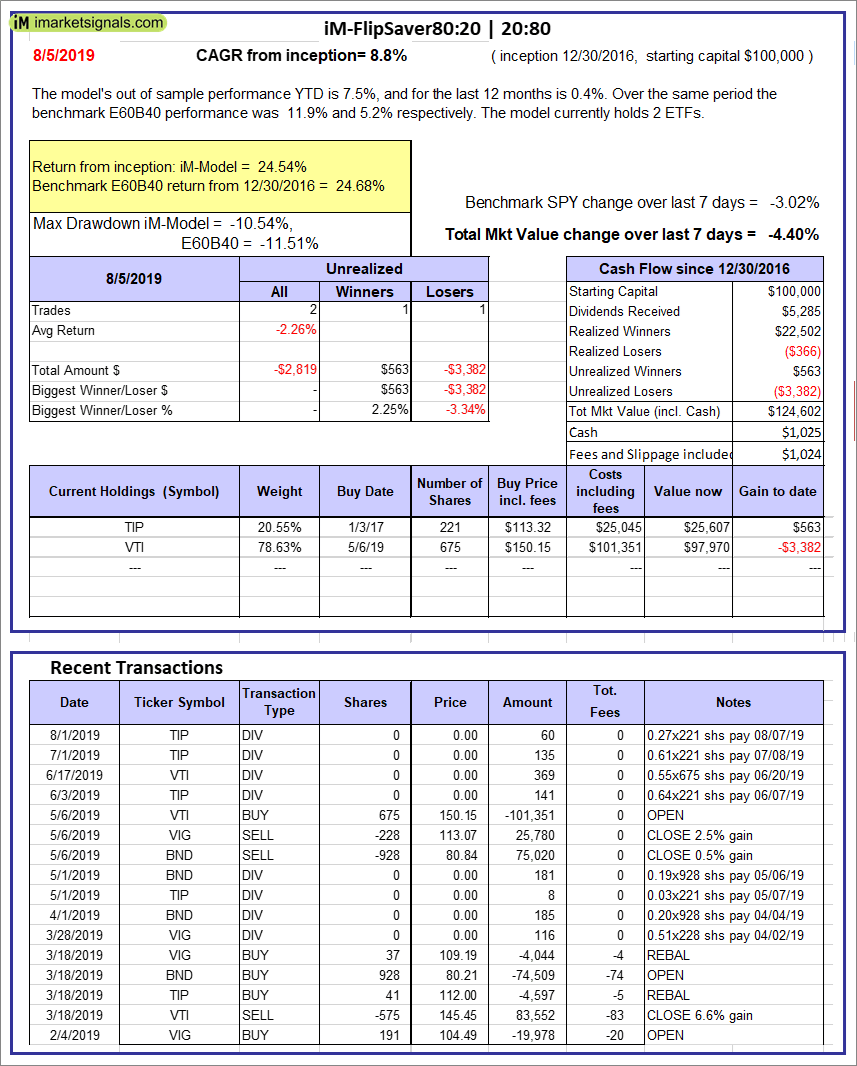 |
iM-FlipSaver 80:20 | 20:80 – 2017: The model’s out of sample performance YTD is 7.5%, and for the last 12 months is 0.4%. Over the same period the benchmark E60B40 performance was 11.9% and 5.2% respectively. Over the previous week the market value of iM-FlipSaver 80:20 | 20:80 gained -4.40% at a time when SPY gained -3.02%. A starting capital of $100,000 at inception on 1/2/2017 would have grown to $124,602 which includes $1,025 cash and excludes $1,024 spent on fees and slippage. |
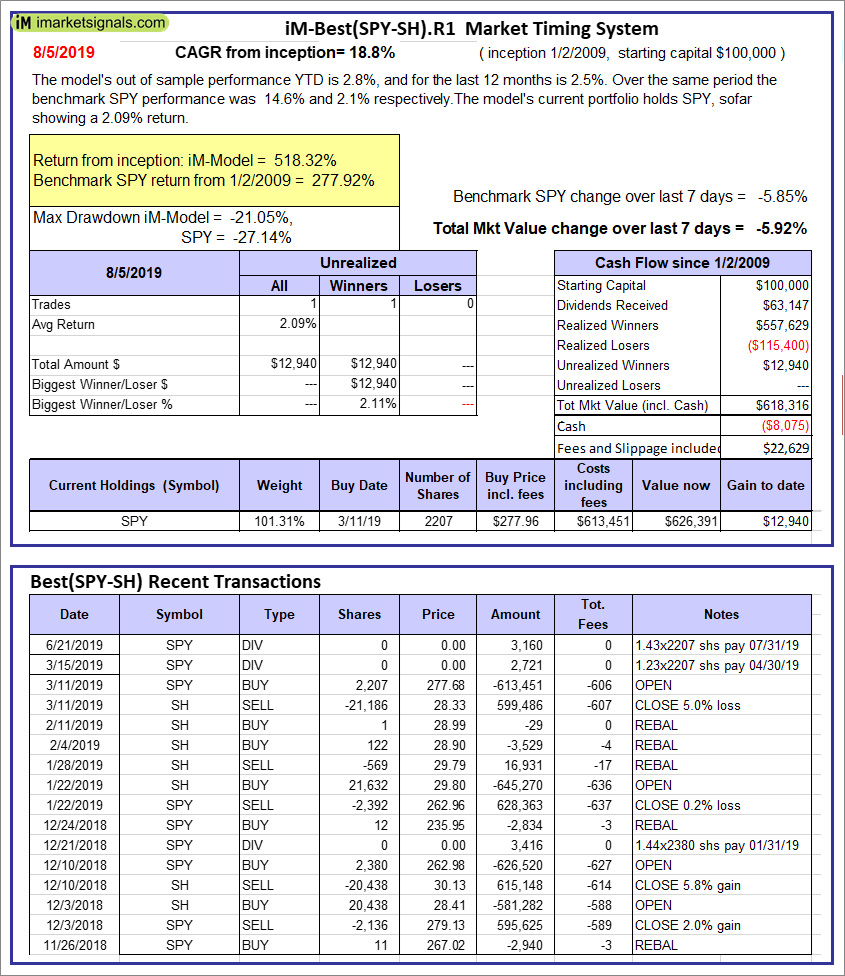 |
iM-Best(SPY-SH).R1: The model’s out of sample performance YTD is 2.8%, and for the last 12 months is 2.5%. Over the same period the benchmark SPY performance was 14.6% and 2.1% respectively. Over the previous week the market value of Best(SPY-SH) gained -5.92% at a time when SPY gained -5.85%. A starting capital of $100,000 at inception on 1/2/2009 would have grown to $618,316 which includes -$8,075 cash and excludes $22,629 spent on fees and slippage. |
 |
iM-Combo3.R1: The model’s out of sample performance YTD is 3.3%, and for the last 12 months is -6.0%. Over the same period the benchmark SPY performance was 14.6% and 2.1% respectively. Over the previous week the market value of iM-Combo3.R1 gained -1.86% at a time when SPY gained -5.85%. A starting capital of $100,000 at inception on 2/3/2014 would have grown to $160,193 which includes $5,743 cash and excludes $5,400 spent on fees and slippage. |
 |
iM-Combo5: The model’s out of sample performance YTD is 6.5%, and for the last 12 months is -3.6%. Over the same period the benchmark SPY performance was 14.6% and 2.1% respectively. Over the previous week the market value of iM-Combo5 gained -5.22% at a time when SPY gained -5.85%. A starting capital of $100,000 at inception on 2/22/2016 would have grown to $135,581 which includes $3,599 cash and excludes $0 spent on fees and slippage. |
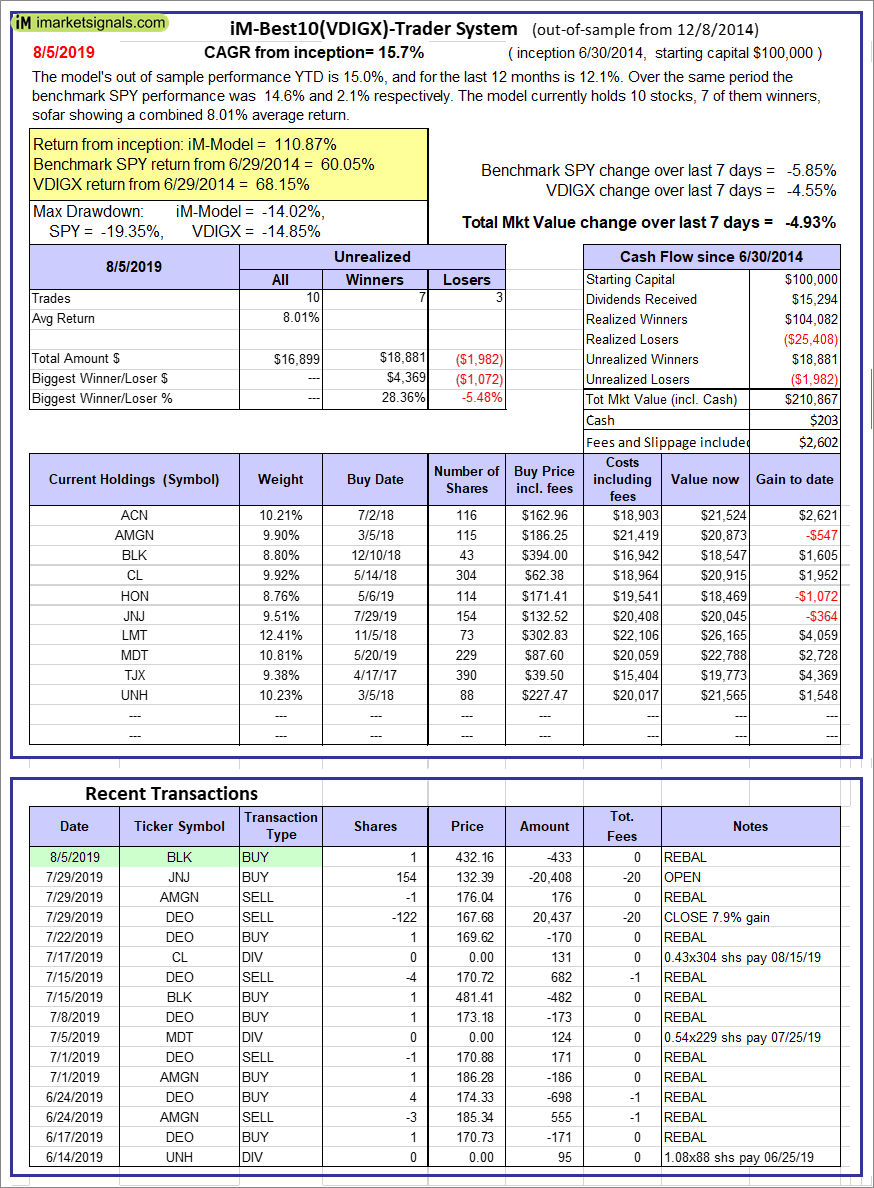  |
iM-Best10(VDIGX)-Trader: The model’s out of sample performance YTD is 15.0%, and for the last 12 months is 12.1%. Over the same period the benchmark SPY performance was 14.6% and 2.1% respectively. Since inception, on 7/1/2014, the model gained 110.87% while the benchmark SPY gained 60.05% and VDIGX gained 68.15% over the same period. Over the previous week the market value of iM-Best10(VDIGX) gained -4.93% at a time when SPY gained -5.85%. A starting capital of $100,000 at inception on 7/1/2014 would have grown to $210,867 which includes $203 cash and excludes $2,602 spent on fees and slippage. |
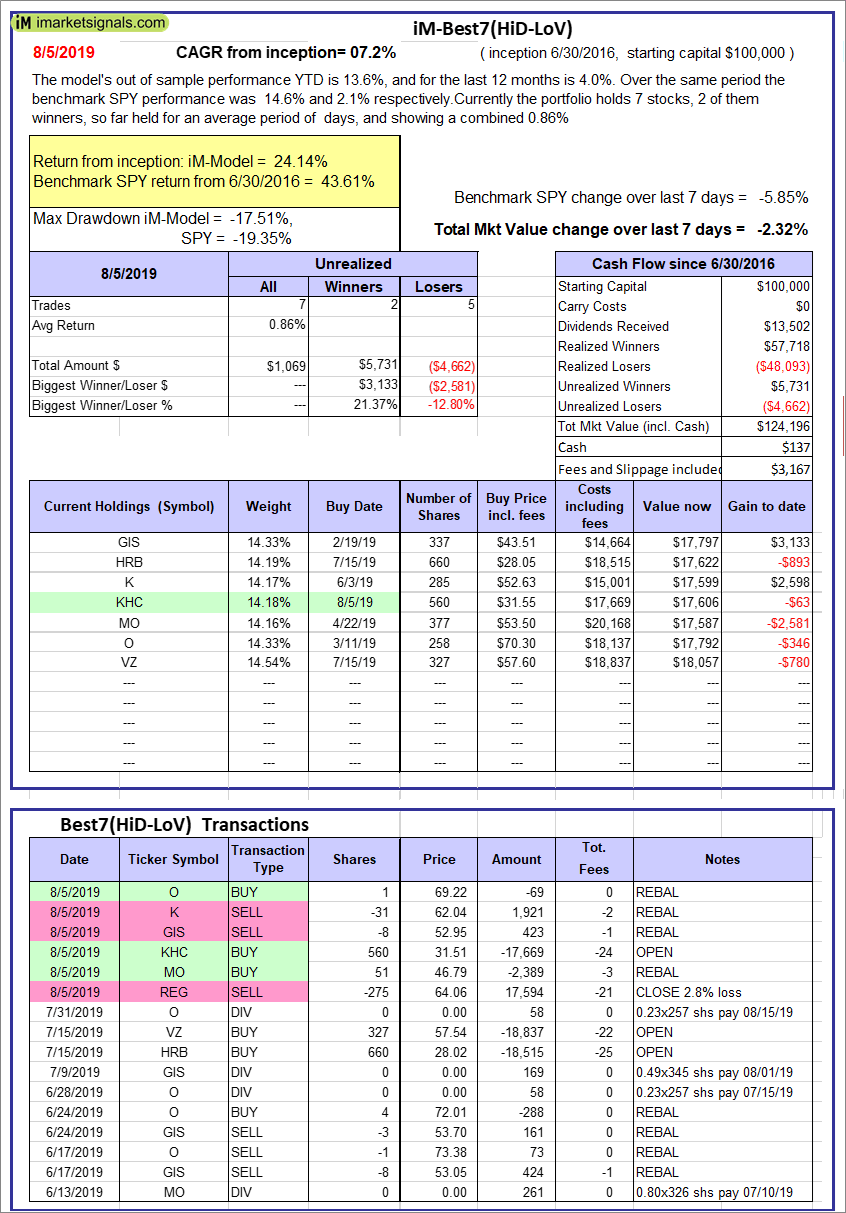 |
iM-Best7(HiD-LoV): The model’s out of sample performance YTD is 13.6%, and for the last 12 months is 4.0%. Over the same period the benchmark SPY performance was 14.6% and 2.1% respectively. Over the previous week the market value of iM-Best7(HiD-LoV) gained -2.32% at a time when SPY gained -5.85%. A starting capital of $100,000 at inception on 6/30/2016 would have grown to $124,196 which includes $137 cash and excludes $3,167 spent on fees and slippage. |
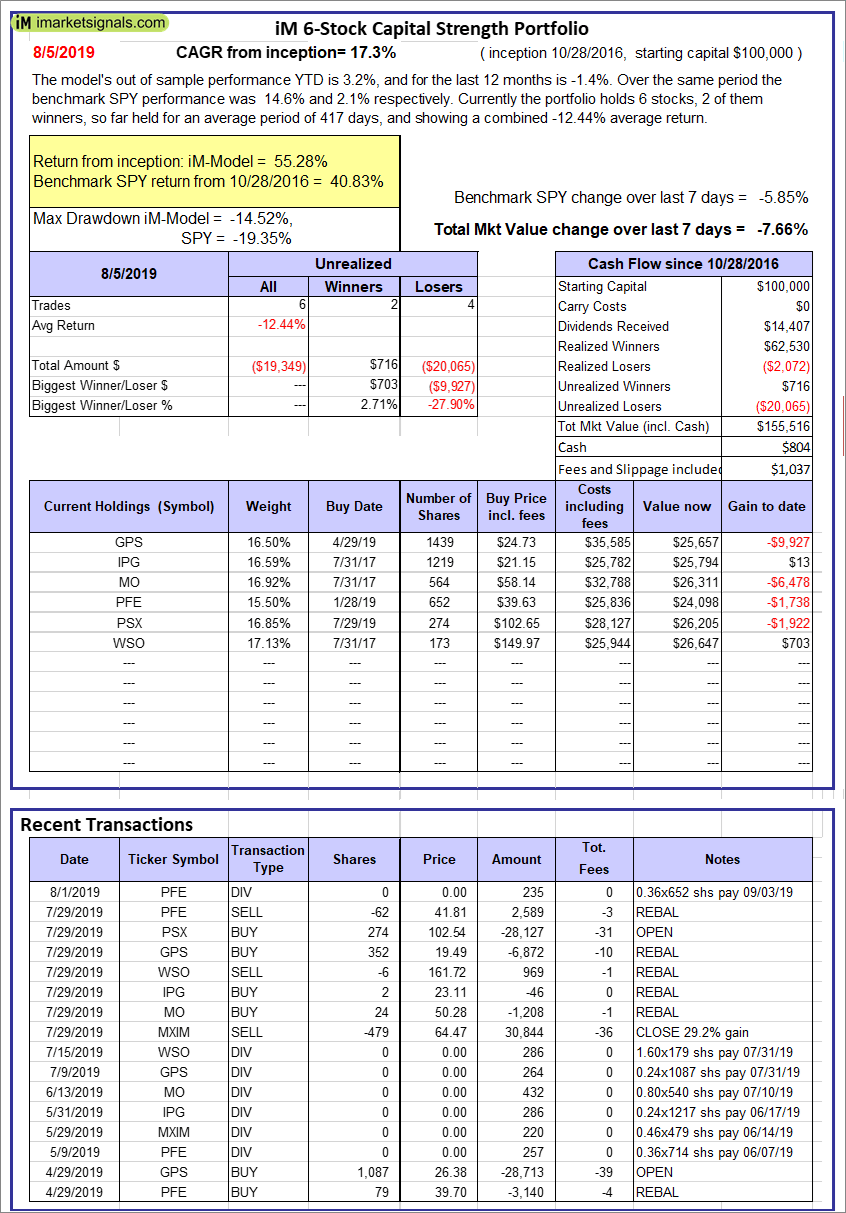 |
iM 6-Stock Capital Strength Portfolio: The model’s out of sample performance YTD is 3.2%, and for the last 12 months is -1.4%. Over the same period the benchmark SPY performance was 14.6% and 2.1% respectively. Over the previous week the market value of the iM 6-Stock Capital Strength Portfolio gained -7.66% at a time when SPY gained -5.85%. A starting capital of $100,000 at inception on 10/28/2016 would have grown to $155,516 which includes $804 cash and excludes $1,037 spent on fees and slippage. |
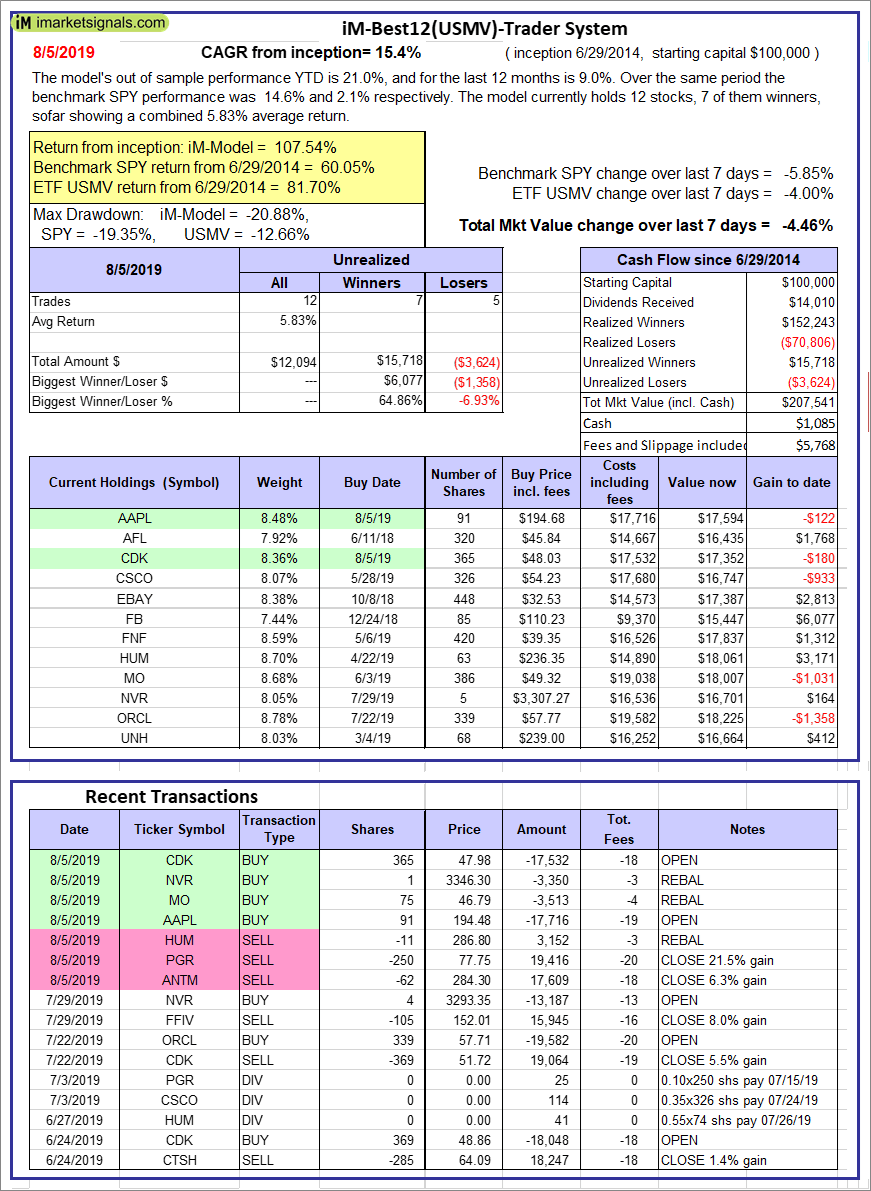 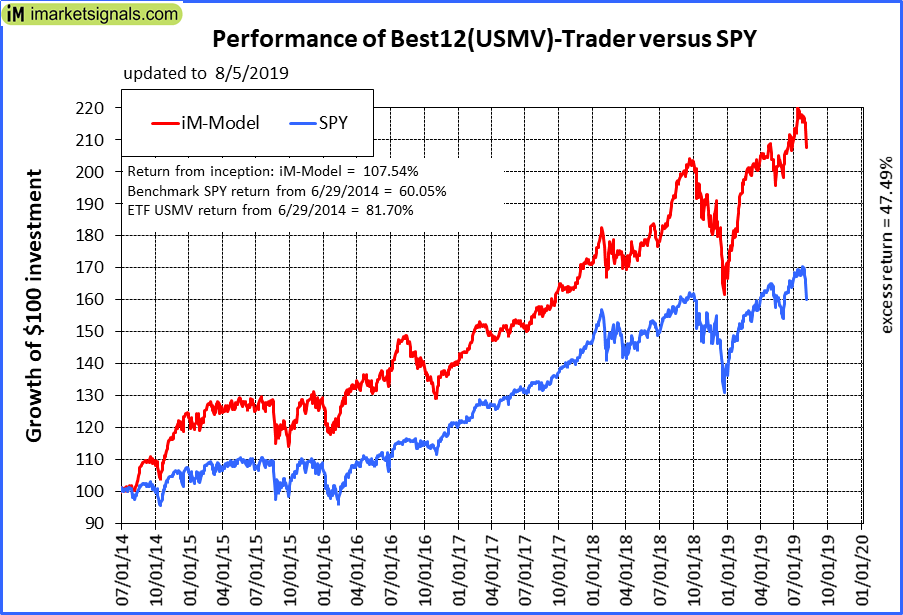 |
iM-Best12(USMV)-Trader: The model’s out of sample performance YTD is 21.0%, and for the last 12 months is 9.0%. Over the same period the benchmark SPY performance was 14.6% and 2.1% respectively. Since inception, on 6/30/2014, the model gained 107.54% while the benchmark SPY gained 60.05% and the ETF USMV gained 81.70% over the same period. Over the previous week the market value of iM-Best12(USMV)-Trader gained -4.46% at a time when SPY gained -5.85%. A starting capital of $100,000 at inception on 6/30/2014 would have grown to $207,541 which includes $1,085 cash and excludes $5,768 spent on fees and slippage. |
  |
iM Min Volatility (USMV) Investor: The model’s out of sample performance YTD is 26.2%, and for the last 12 months is 24.1%. Over the same period the benchmark SPY performance was 19.9% and 9.9% respectively. Since inception, on 1/3/2013, the model gained 262.93% while the benchmark SPY gained 131.05% and the ETF USMV gained 142.65% over the same period. Over the previous week the market value of iM Min Volatility (USMV) Investor gained 1.22% at a time when SPY gained 0.39%. A starting capital of $100,000 at inception on 1/3/2013 would have grown to $362,932 which includes $651 cash and excludes $2,081 spent on fees and slippage. |
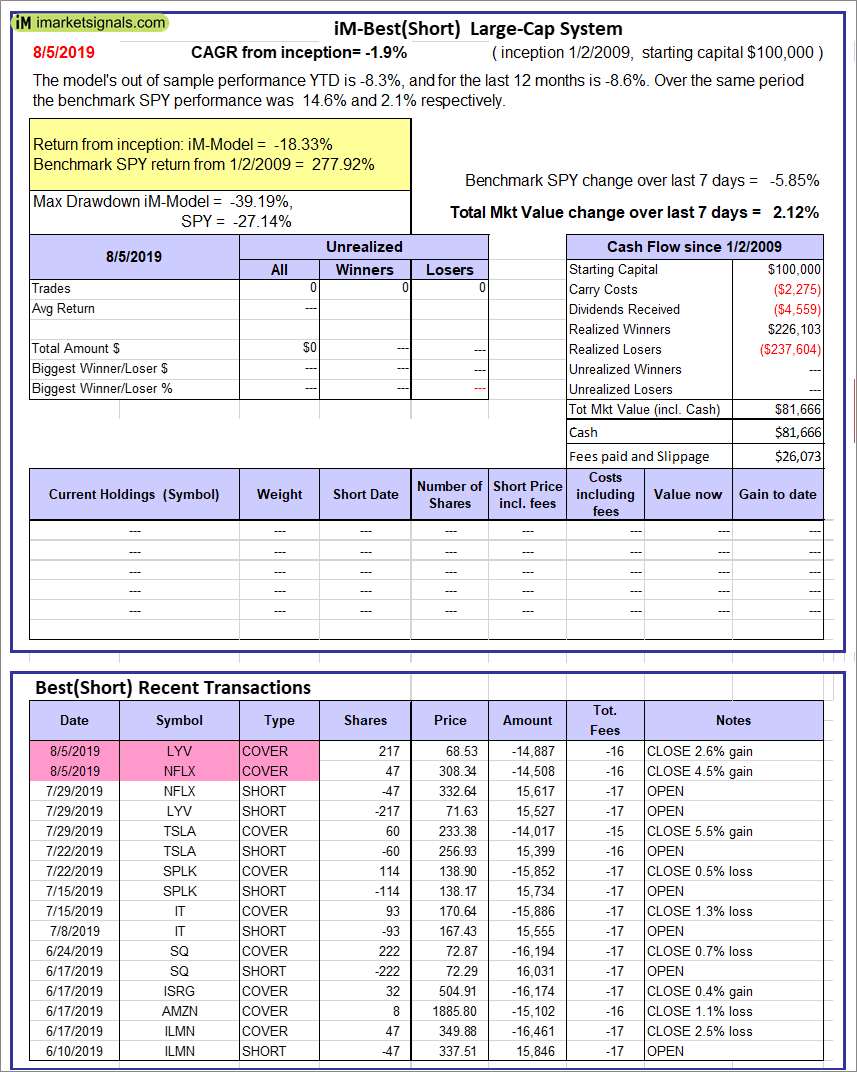 |
iM-Best(Short): The model’s out of sample performance YTD is -8.3%, and for the last 12 months is -8.6%. Over the same period the benchmark SPY performance was 14.6% and 2.1% respectively. Over the previous week the market value of iM-Best(Short) gained 2.12% at a time when SPY gained -5.85%. Over the period 1/2/2009 to 8/5/2019 the starting capital of $100,000 would have grown to $81,666 which includes $81,666 cash and excludes $26,073 spent on fees and slippage. |
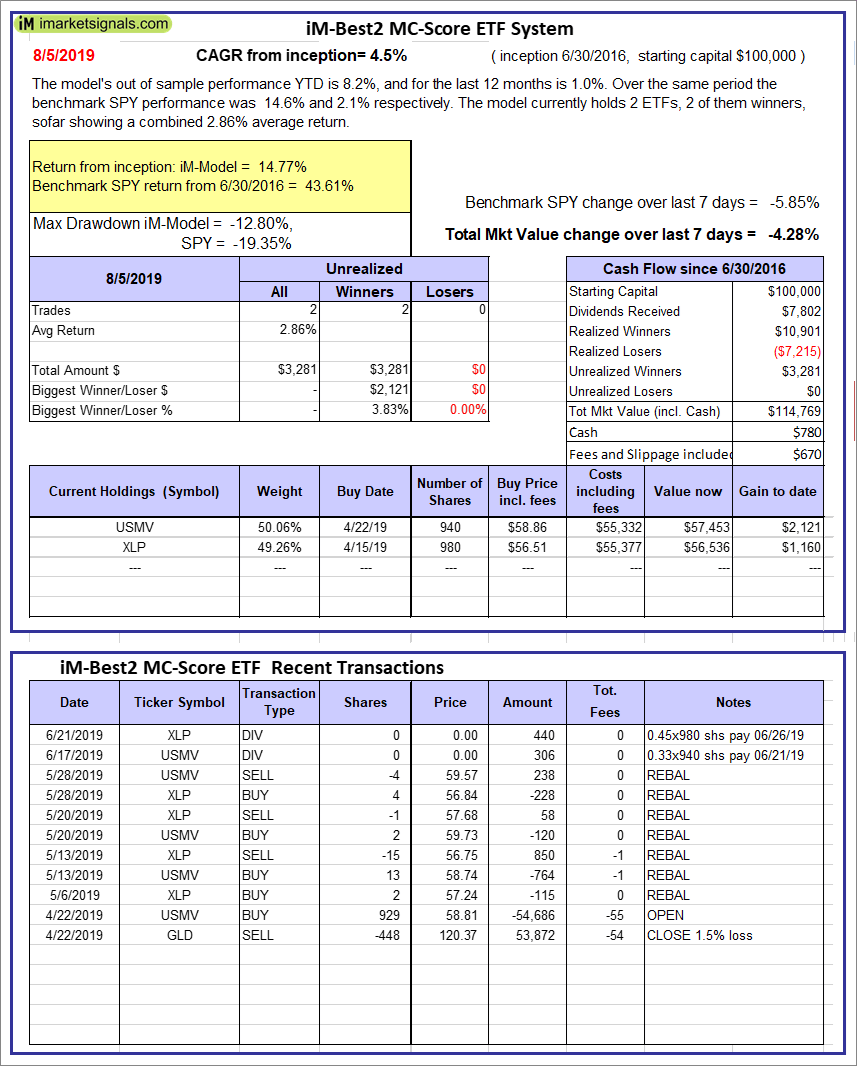 |
iM-Best2 MC-Score ETF System: The model’s out of sample performance YTD is 8.2%, and for the last 12 months is 1.0%. Over the same period the benchmark SPY performance was 14.6% and 2.1% respectively. Over the previous week the market value of the iM-Best2 MC-Score ETF System gained -4.28% at a time when SPY gained -5.85%. A starting capital of $100,000 at inception on 6/30/2016 would have grown to $114,769 which includes $780 cash and excludes $670 spent on fees and slippage. |
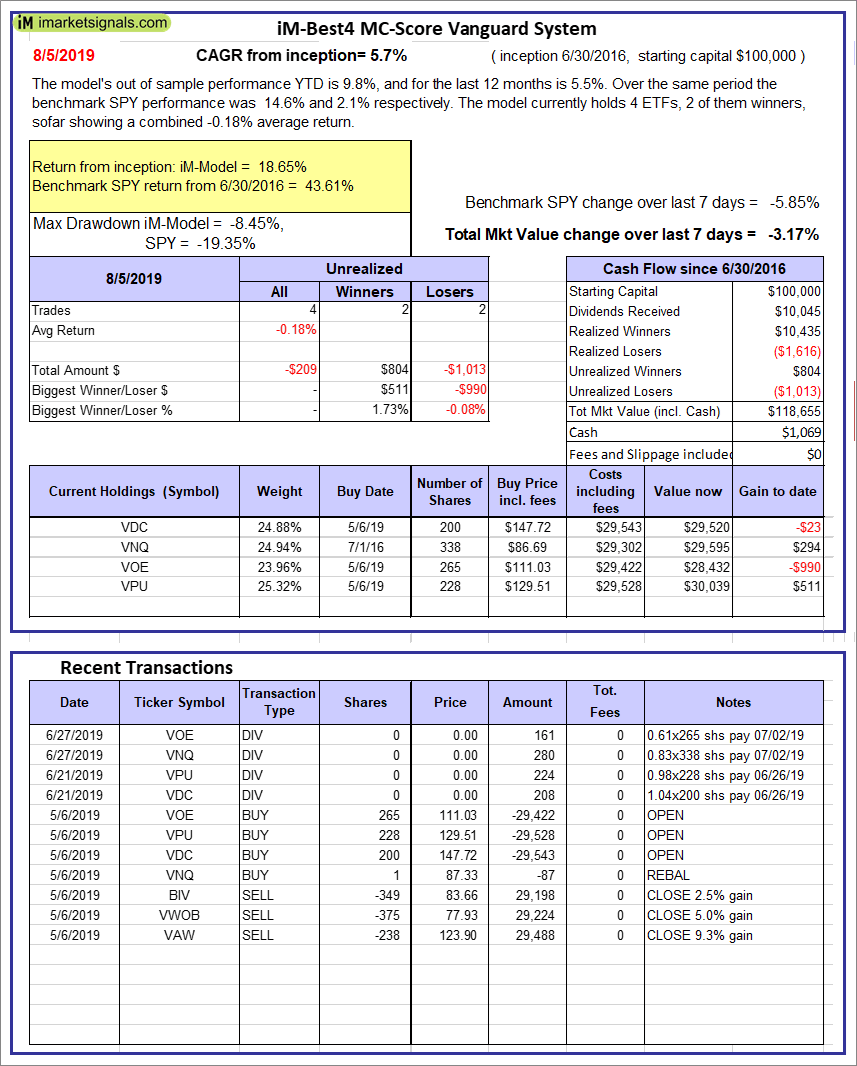 |
iM-Best4 MC-Score Vanguard System: The model’s out of sample performance YTD is 9.8%, and for the last 12 months is 5.5%. Over the same period the benchmark SPY performance was 14.6% and 2.1% respectively. Over the previous week the market value of the iM-Best4 MC-Score Vanguard System gained -3.17% at a time when SPY gained -5.85%. A starting capital of $100,000 at inception on 6/30/2016 would have grown to $118,655 which includes $1,069 cash and excludes $00 spent on fees and slippage. |
 |
iM-Composite (SH-RSP) Timer: The model’s out of sample performance YTD is 13.7%, and for the last 12 months is 0.1%. Over the same period the benchmark SPY performance was 14.6% and 2.1% respectively. Over the previous week the market value of the iM-Composite (SH-RSP) Timer gained -5.48% at a time when SPY gained -5.85%. A starting capital of $100,000 at inception on 6/30/2016 would have grown to $136,588 which includes $5,737 cash and excludes $513 spent on fees and slippage. |
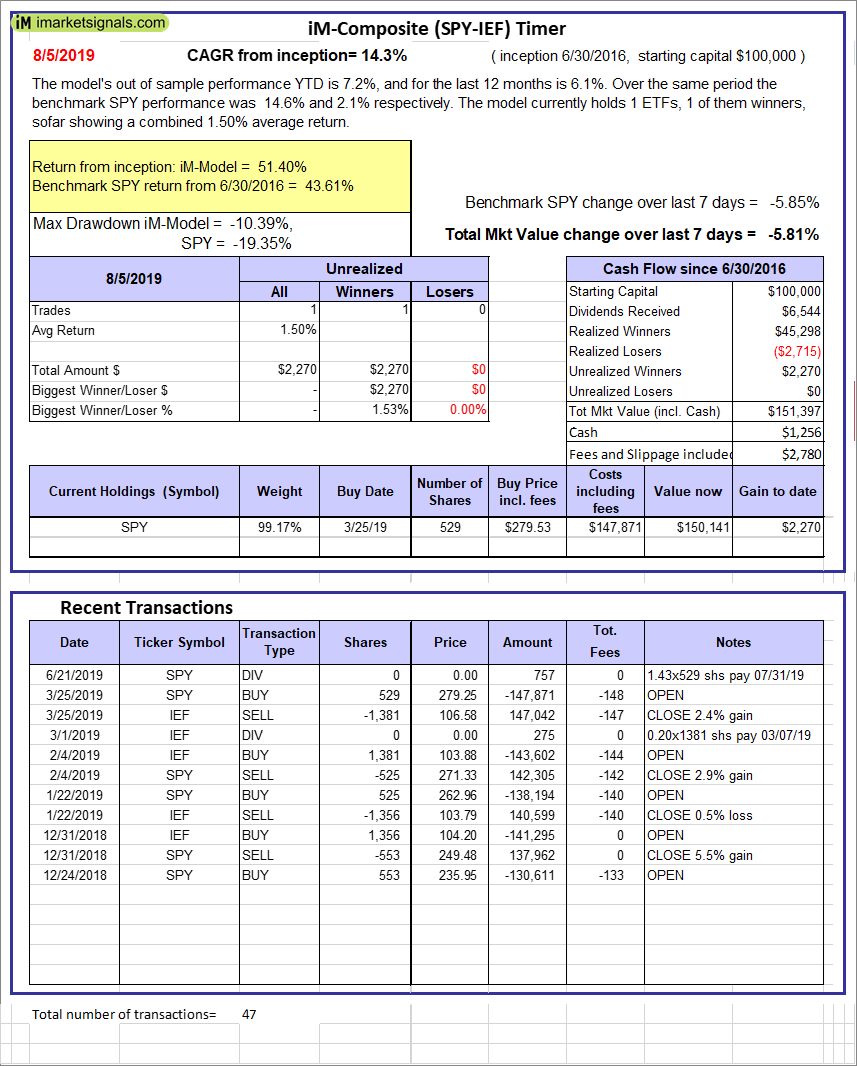 |
iM-Composite (SPY-IEF) Timer: The model’s out of sample performance YTD is 7.2%, and for the last 12 months is 6.1%. Over the same period the benchmark SPY performance was 14.6% and 2.1% respectively. Over the previous week the market value of the iM-Composite (SPY-IEF) Timer gained -5.81% at a time when SPY gained -5.85%. A starting capital of $100,000 at inception on 6/30/2016 would have grown to $151,397 which includes $1,256 cash and excludes $2,780 spent on fees and slippage. |
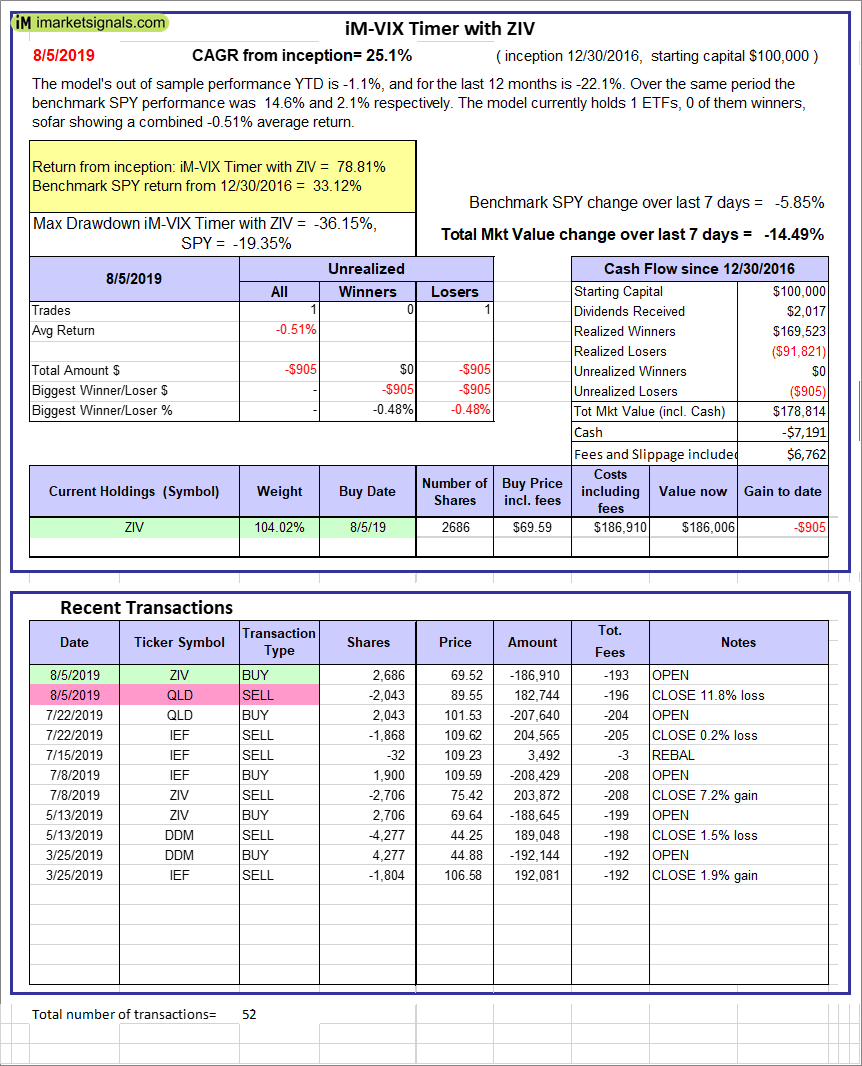 |
iM-VIX Timer with ZIV: The model’s out of sample performance YTD is -1.1%, and for the last 12 months is -22.1%. Over the same period the benchmark SPY performance was 14.6% and 2.1% respectively. Over the previous week the market value of the iM-VIX Timer with ZIV gained -14.49% at a time when SPY gained -5.85%. A starting capital of $100,000 at inception on 6/30/2016 would have grown to $178,814 which includes -$7,191 cash and excludes $6,762 spent on fees and slippage. |
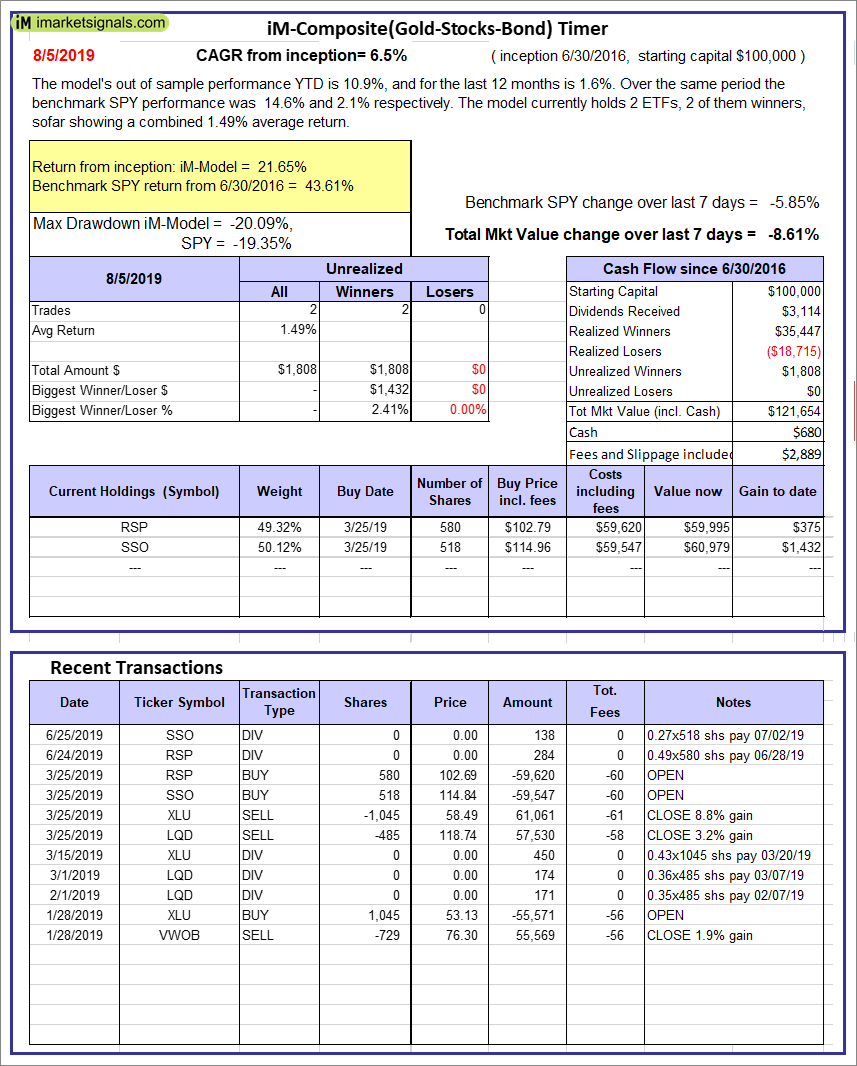 |
iM-Composite(Gold-Stocks-Bond) Timer: The model’s out of sample performance YTD is 10.9%, and for the last 12 months is 1.6%. Over the same period the benchmark SPY performance was 14.6% and 2.1% respectively. Over the previous week the market value of the iM-Composite(Gold-Stocks-Bond) Timer gained -8.61% at a time when SPY gained -5.85%. A starting capital of $100,000 at inception on 6/30/2016 would have grown to $121,654 which includes $680 cash and excludes $2,889 spent on fees and slippage. |
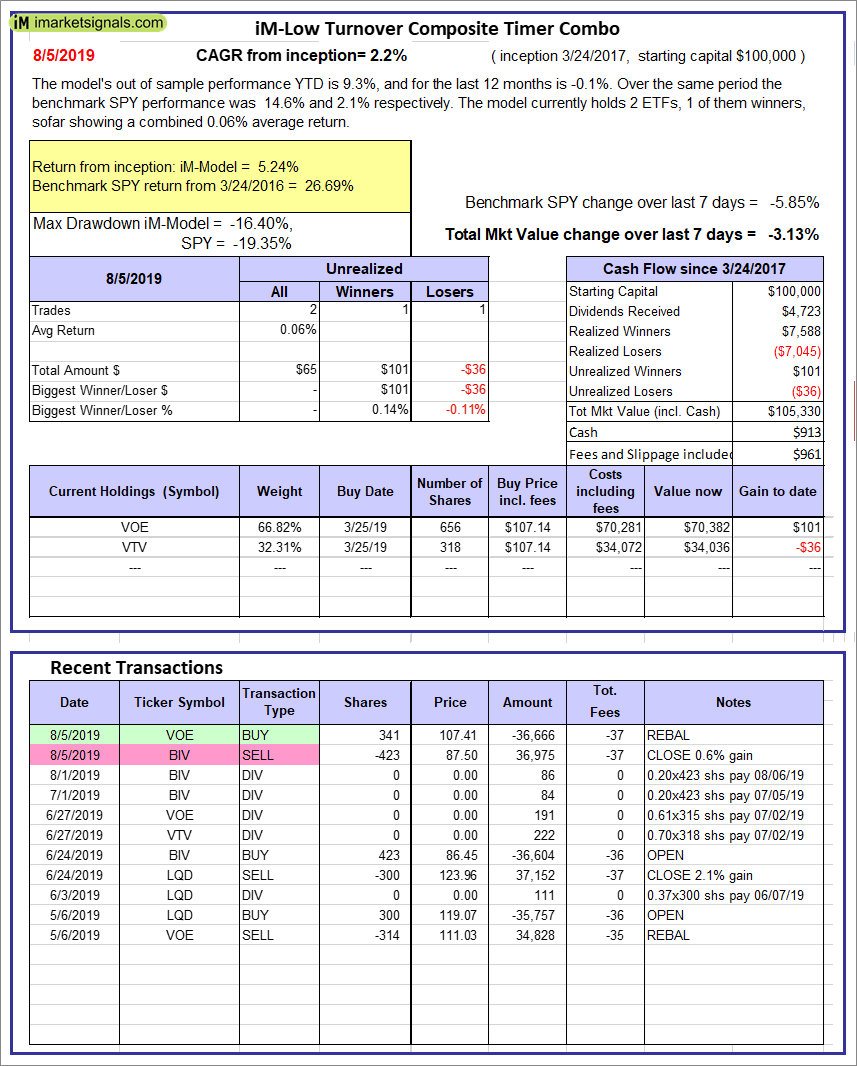 |
iM-Low Turnover Composite Timer Combo: The model’s out of sample performance YTD is 9.3%, and for the last 12 months is -0.1%. Over the same period the benchmark SPY performance was 14.6% and 2.1% respectively. Over the previous week the market value of the iM-Low Turnover Composite Timer Combo gained -3.13% at a time when SPY gained -5.85%. A starting capital of $100,000 at inception on 3/24/27 would have grown to $105,330 which includes $913 cash and excludes $961 spent on fees and slippage. |
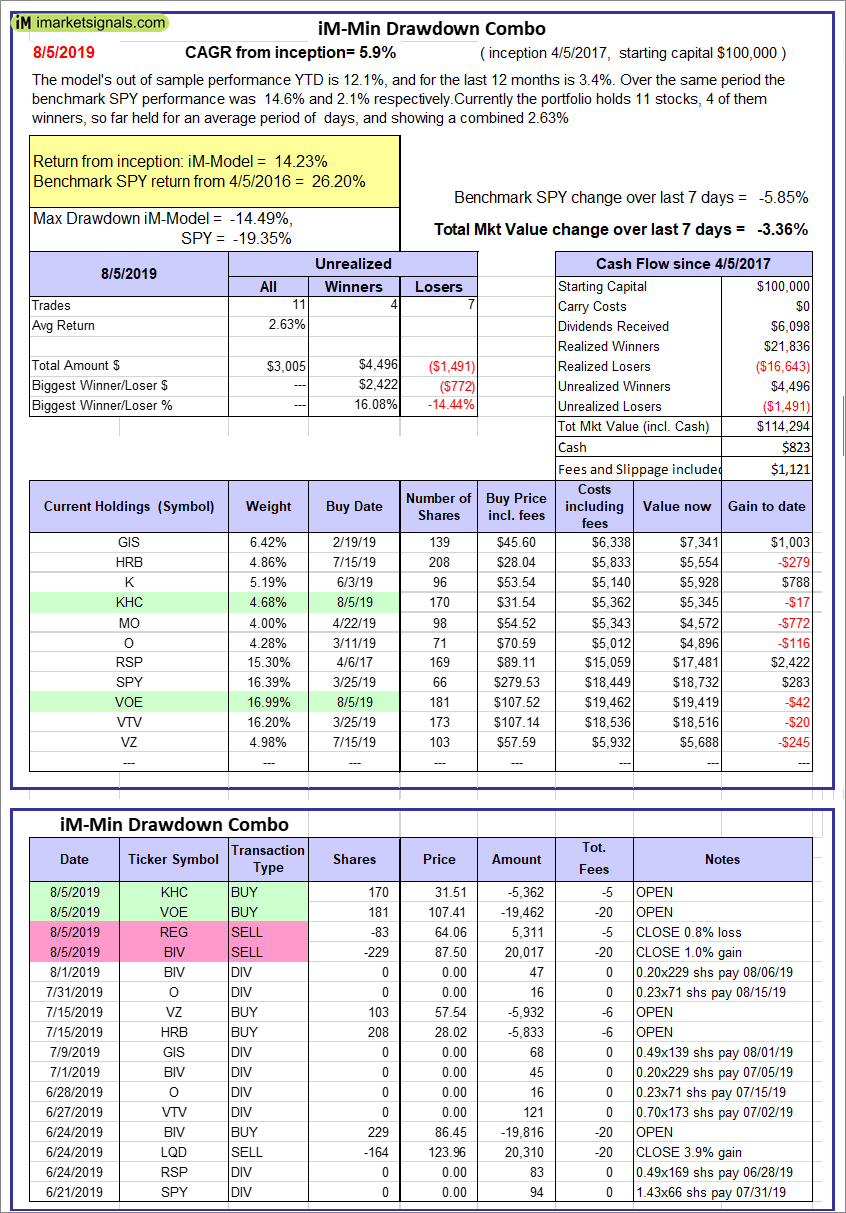 |
iM-Min Drawdown Combo: The model’s out of sample performance YTD is 12.1%, and for the last 12 months is 3.4%. Over the same period the benchmark SPY performance was 14.6% and 2.1% respectively. Over the previous week the market value of the iM-Min Drawdown Combo gained -3.36% at a time when SPY gained -5.85%. A starting capital of $100,000 at inception on 4/5/2017 would have grown to $114,294 which includes $823 cash and excludes $1,121 spent on fees and slippage. |
 |
iM-5ETF Trader (includes leveraged ETFs): The model’s out of sample performance YTD is 3.8%, and for the last 12 months is -22.0%. Over the same period the benchmark SPY performance was 14.6% and 2.1% respectively. Over the previous week the market value of the iM-5ETF Trader (includes leveraged ETFs) gained -10.64% at a time when SPY gained -5.85%. A starting capital of $100,000 at inception on 10/30/2016 would have grown to $143,729 which includes $634 cash and excludes $2,795 spent on fees and slippage. |
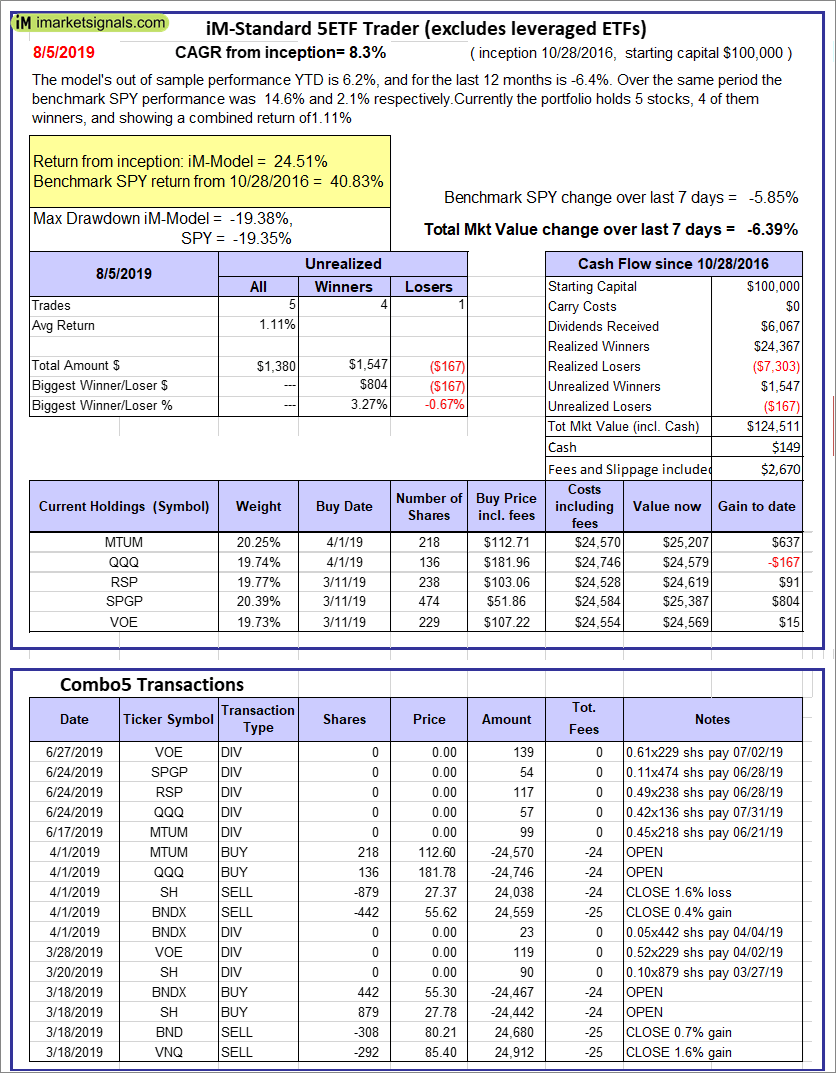 |
iM-Standard 5ETF Trader (excludes leveraged ETFs): The model’s out of sample performance YTD is 6.2%, and for the last 12 months is -6.4%. Over the same period the benchmark SPY performance was 14.6% and 2.1% respectively. Over the previous week the market value of the iM-Standard 5ETF Trader (excludes leveraged ETFs) gained -6.39% at a time when SPY gained -5.85%. A starting capital of $100,000 at inception on 10/30/2016 would have grown to $124,511 which includes $149 cash and excludes $2,670 spent on fees and slippage. |
iM-Best Reports – 8/5/2019
Posted in pmp SPY-SH
Leave a Reply
You must be logged in to post a comment.