  |
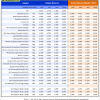
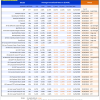
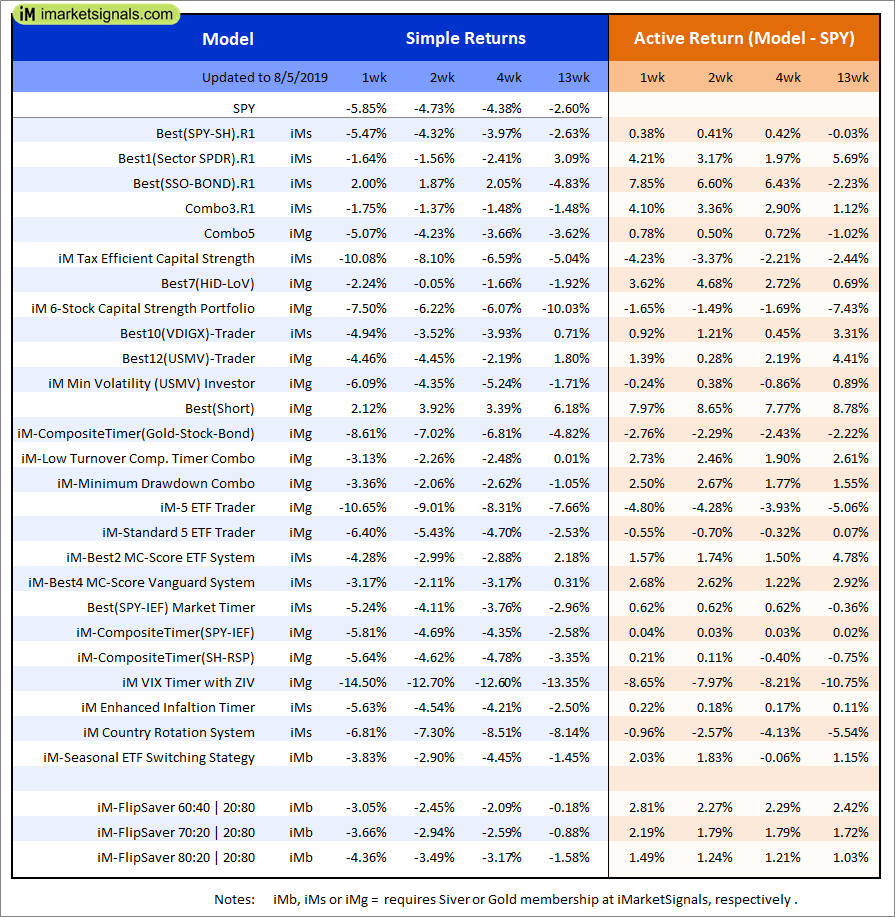
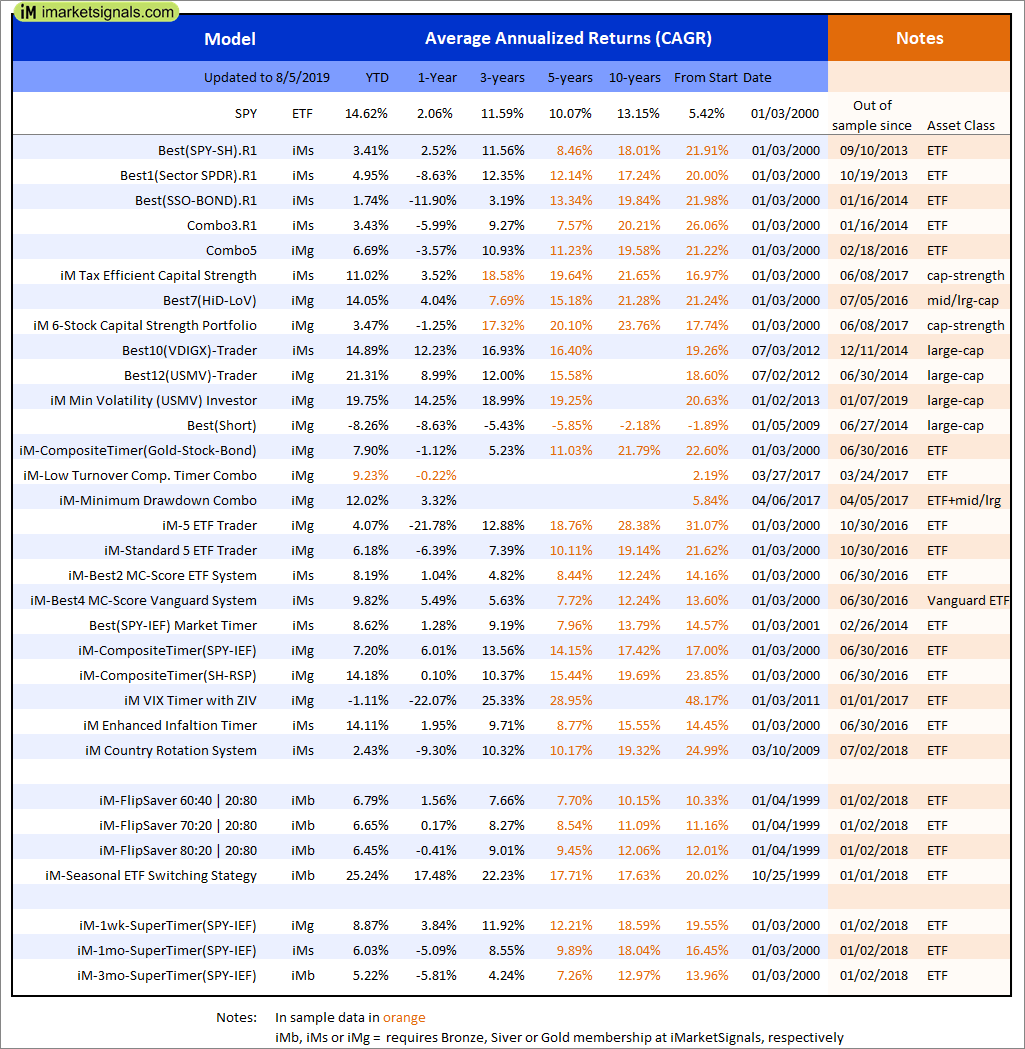
Out of sample performance summary of our models for the past 1, 2, 4 and 13 week periods. The active active return indicates how the models over- or underperformed the benchmark ETF SPY. Also the YTD, and the 1-, 3-, 5- and 10-year annualized returns are shown in the second table |
|
|
iM-FlipSaver 60:40 | 20:80 – 2017: The model’s out of sample performance YTD is 9.0%, and for the last 12 months is 2.8%. Over the same period the benchmark E60B40 performance was 13.2% and 6.4% respectively. Over the previous week the market value of iM-FlipSaver 80:20 | 20:80 gained 1.01% at a time when SPY gained 1.15%. A starting capital of $100,000 at inception on 7/16/2015 would have grown to $122,041 which includes -$637 cash and excludes $1,032 spent on fees and slippage. |
|
|
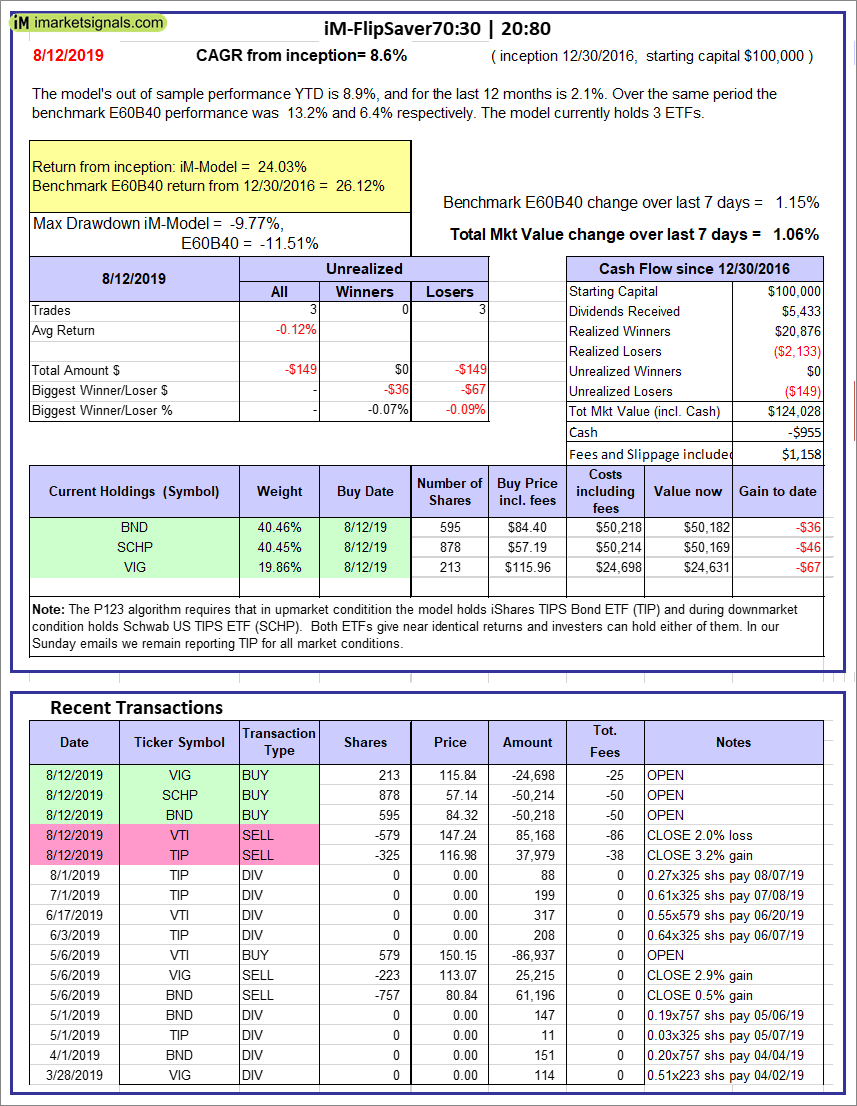
iM-FlipSaver 70:30 | 20:80 – 2017: The model’s out of sample performance YTD is 8.9%, and for the last 12 months is 2.1%. Over the same period the benchmark E60B40 performance was 13.2% and 6.4% respectively. Over the previous week the market value of iM-FlipSaver 70:30 | 20:80 gained 1.06% at a time when SPY gained 1.15%. A starting capital of $100,000 at inception on 7/15/2015 would have grown to $124,028 which includes -$955 cash and excludes $1,158 spent on fees and slippage. |
|
|
iM-FlipSaver 80:20 | 20:80 – 2017: The model’s out of sample performance YTD is 8.7%, and for the last 12 months is 1.5%. Over the same period the benchmark E60B40 performance was 13.2% and 6.4% respectively. Over the previous week the market value of iM-FlipSaver 80:20 | 20:80 gained 1.11% at a time when SPY gained 1.15%. A starting capital of $100,000 at inception on 1/2/2017 would have grown to $125,988 which includes -$1,157 cash and excludes $1,277 spent on fees and slippage. |
|
|
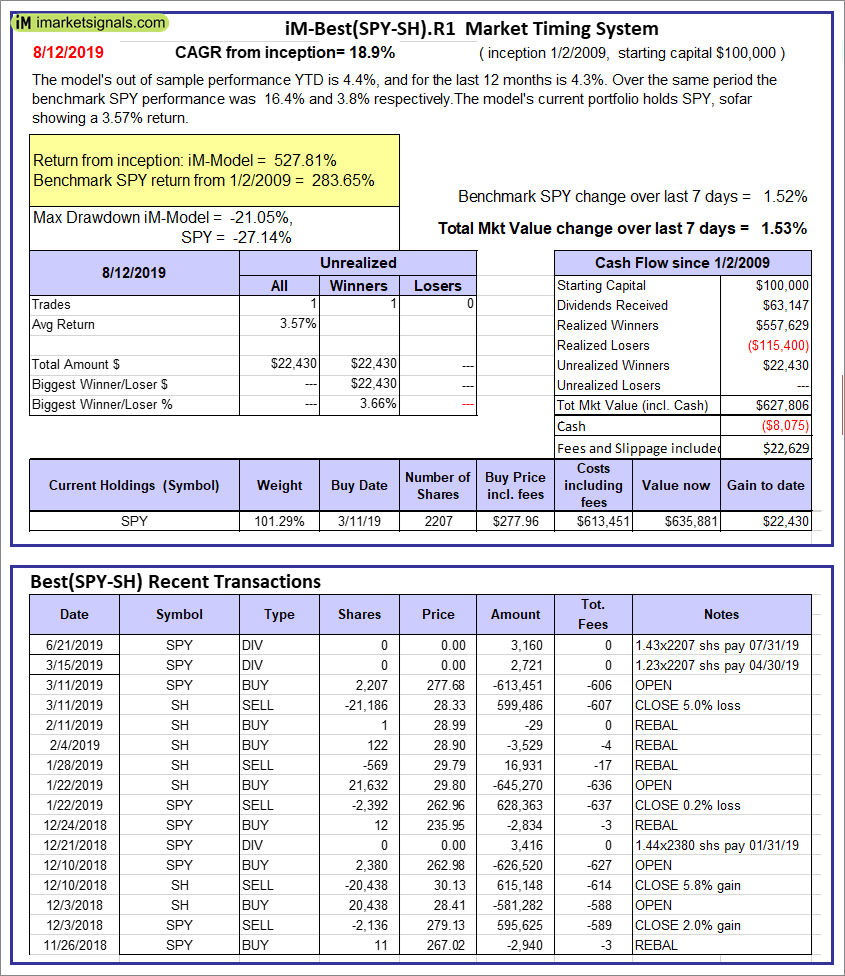
iM-Best(SPY-SH).R1: The model’s out of sample performance YTD is 4.4%, and for the last 12 months is 4.3%. Over the same period the benchmark SPY performance was 16.4% and 3.8% respectively. Over the previous week the market value of Best(SPY-SH) gained 1.53% at a time when SPY gained 1.52%. A starting capital of $100,000 at inception on 1/2/2009 would have grown to $627,806 which includes -$8,075 cash and excludes $22,629 spent on fees and slippage. |
|
|
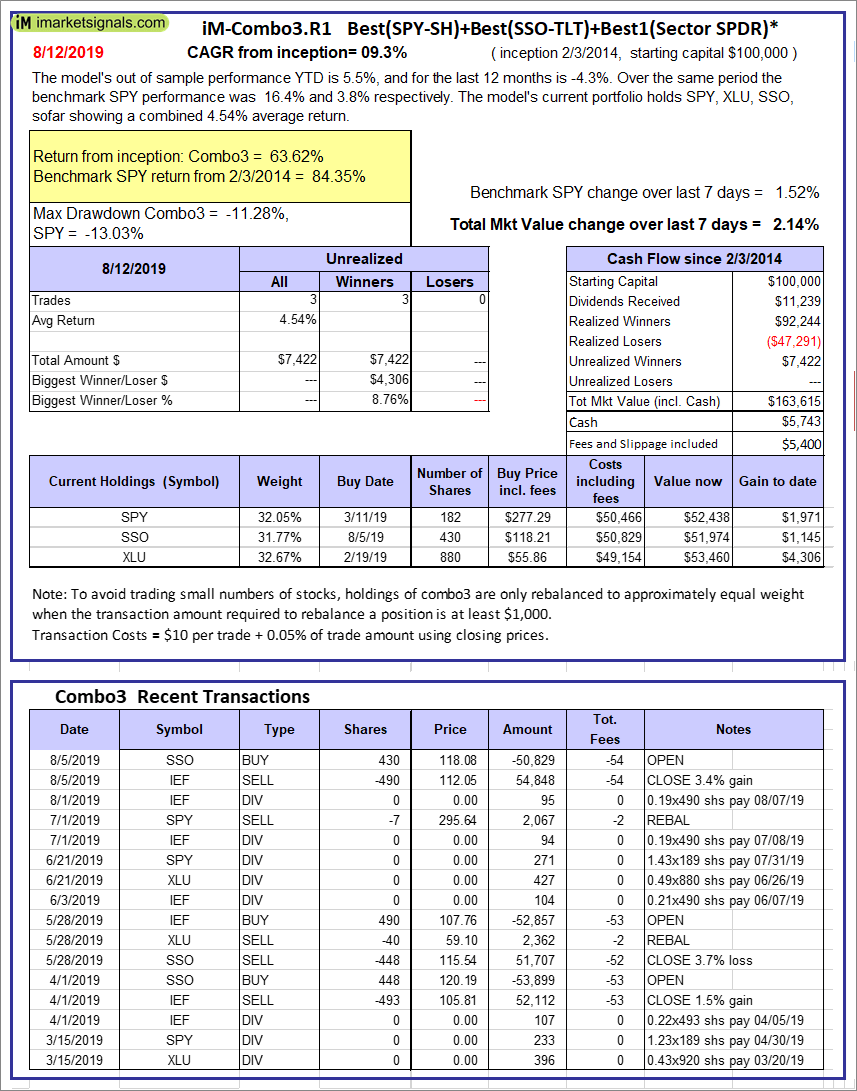
iM-Combo3.R1: The model’s out of sample performance YTD is 5.5%, and for the last 12 months is -4.3%. Over the same period the benchmark SPY performance was 16.4% and 3.8% respectively. Over the previous week the market value of iM-Combo3.R1 gained 2.14% at a time when SPY gained 1.52%. A starting capital of $100,000 at inception on 2/3/2014 would have grown to $163,615 which includes $5,743 cash and excludes $5,400 spent on fees and slippage. |
|
|
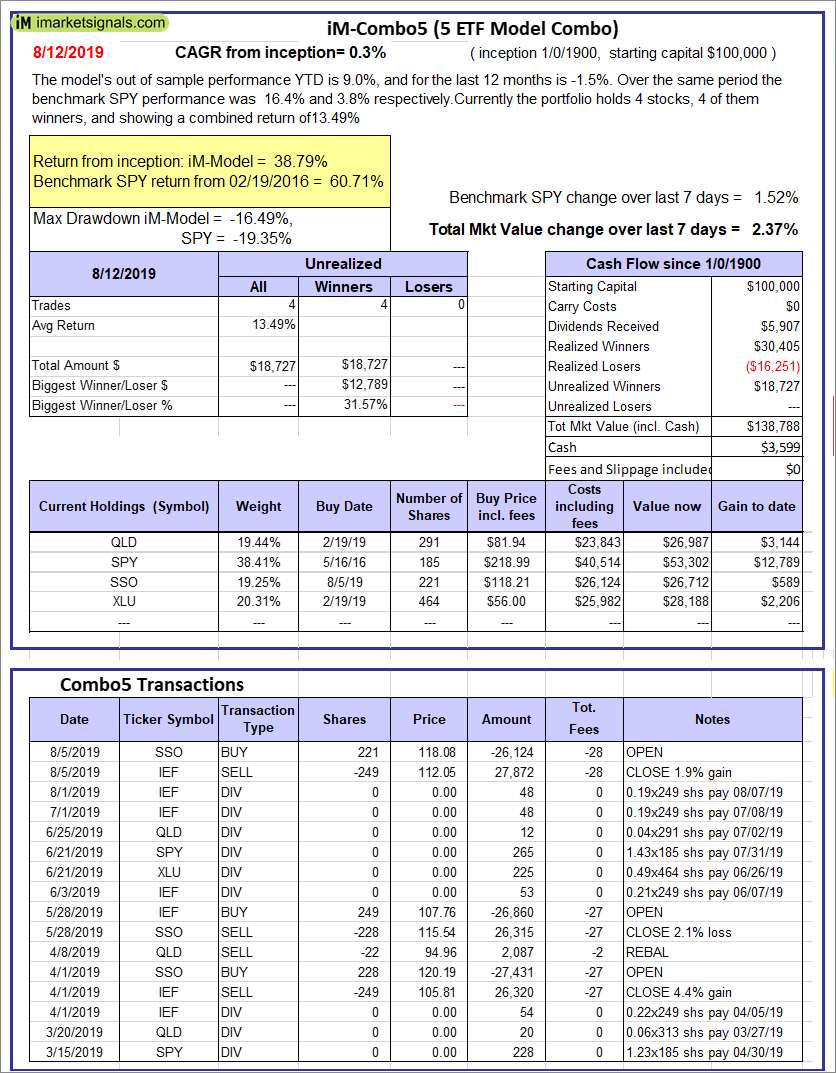
iM-Combo5: The model’s out of sample performance YTD is 9.0%, and for the last 12 months is -1.5%. Over the same period the benchmark SPY performance was 16.4% and 3.8% respectively. Over the previous week the market value of iM-Combo5 gained 2.37% at a time when SPY gained 1.52%. A starting capital of $100,000 at inception on 2/22/2016 would have grown to $138,788 which includes $3,599 cash and excludes $0 spent on fees and slippage. |
|
|
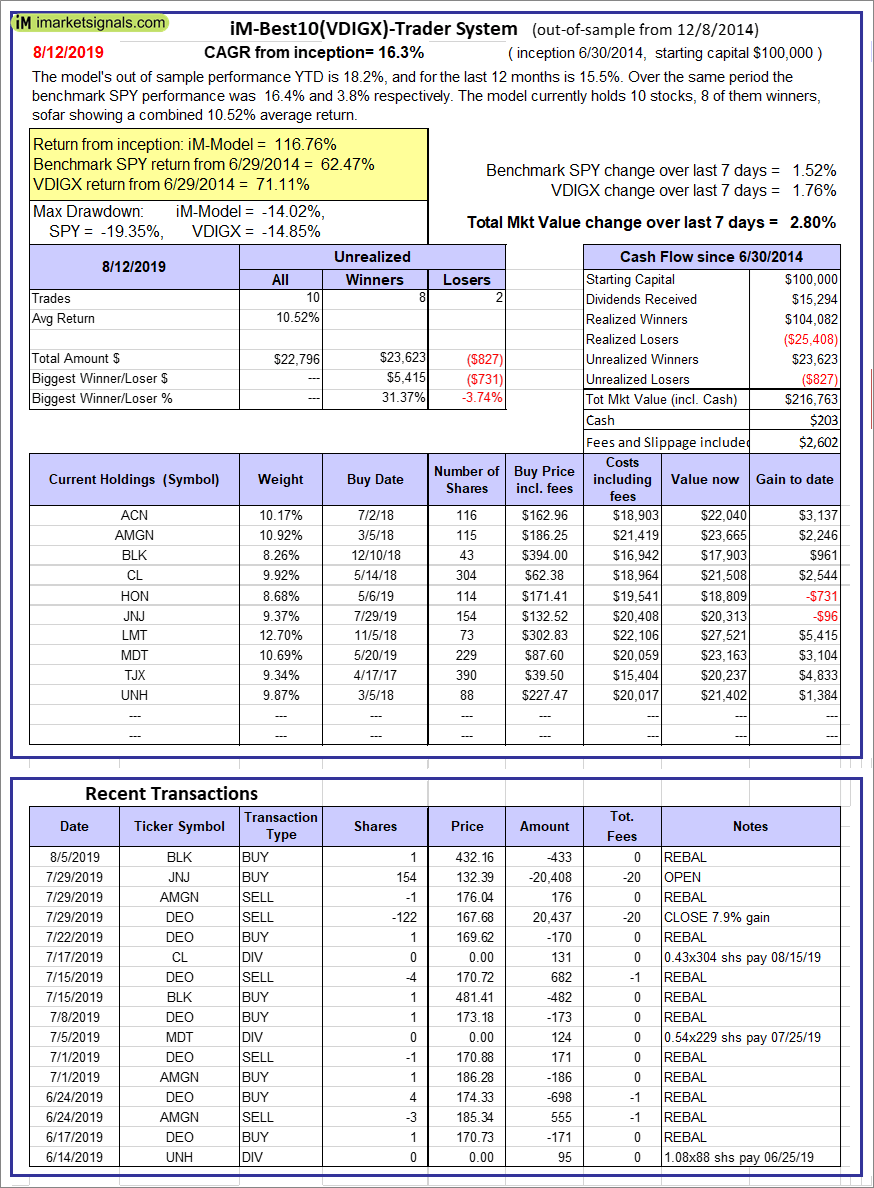
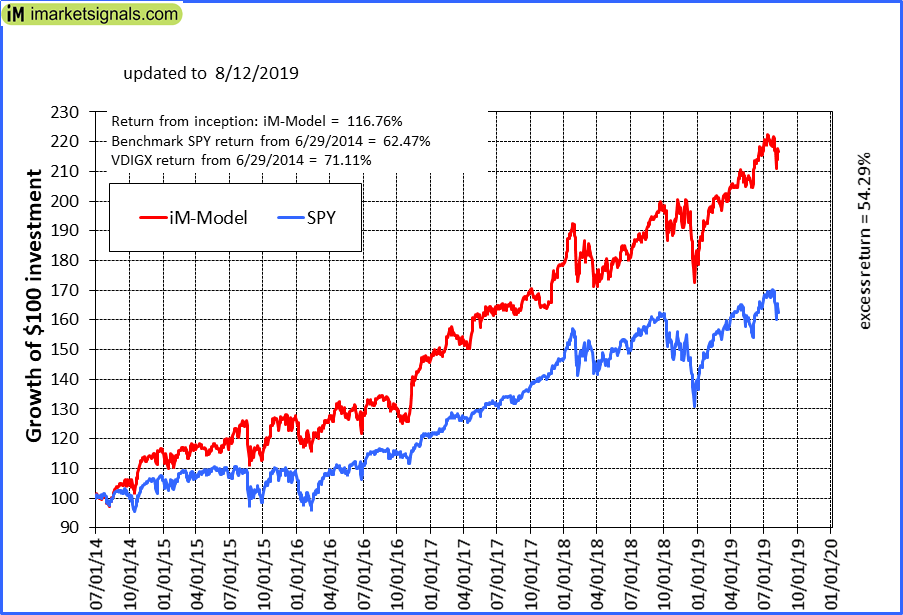
iM-Best10(VDIGX)-Trader: The model’s out of sample performance YTD is 18.2%, and for the last 12 months is 15.5%. Over the same period the benchmark SPY performance was 16.4% and 3.8% respectively. Since inception, on 7/1/2014, the model gained 116.76% while the benchmark SPY gained 62.47% and VDIGX gained 71.11% over the same period. Over the previous week the market value of iM-Best10(VDIGX) gained 2.80% at a time when SPY gained 1.52%. A starting capital of $100,000 at inception on 7/1/2014 would have grown to $216,763 which includes $203 cash and excludes $2,602 spent on fees and slippage. |
|
|
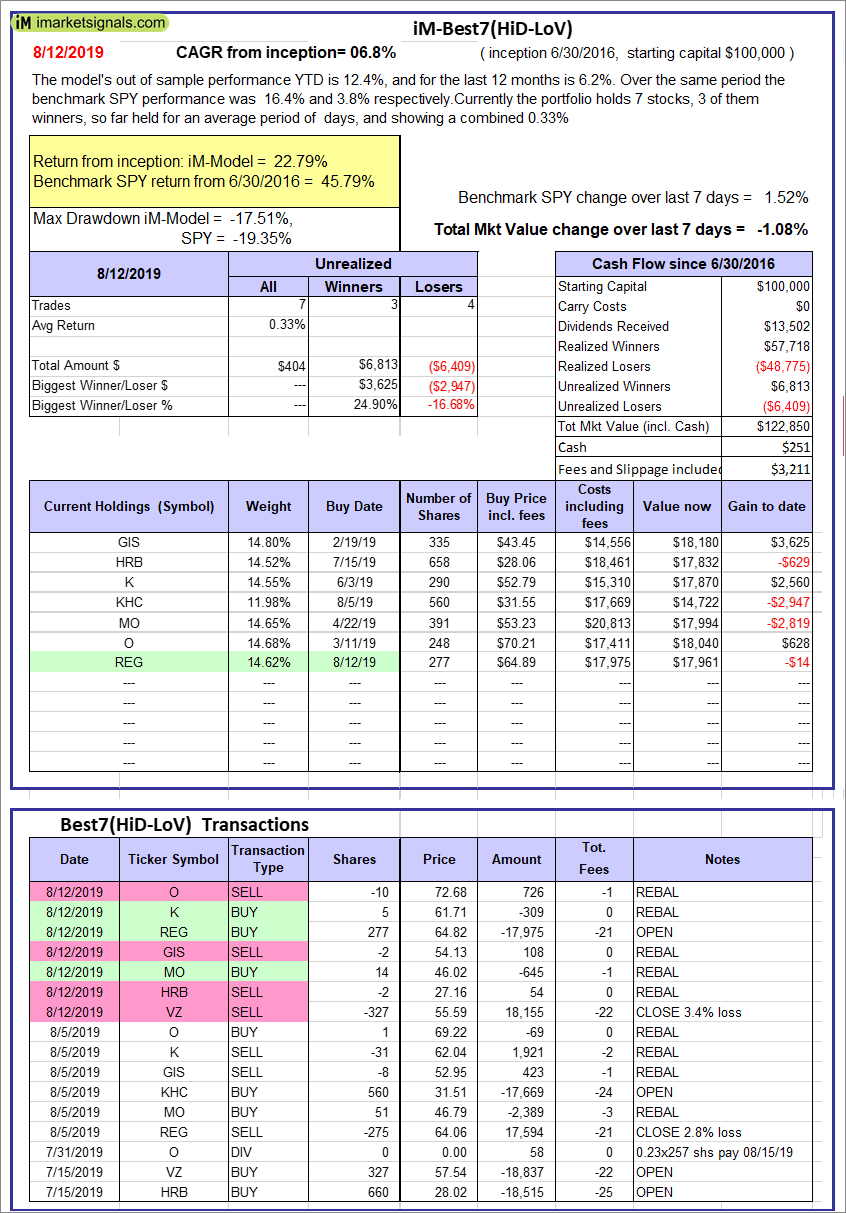
iM-Best7(HiD-LoV): The model’s out of sample performance YTD is 12.4%, and for the last 12 months is 6.2%. Over the same period the benchmark SPY performance was 16.4% and 3.8% respectively. Over the previous week the market value of iM-Best7(HiD-LoV) gained -1.08% at a time when SPY gained 1.52%. A starting capital of $100,000 at inception on 6/30/2016 would have grown to $122,850 which includes $251 cash and excludes $3,211 spent on fees and slippage. |
|
|
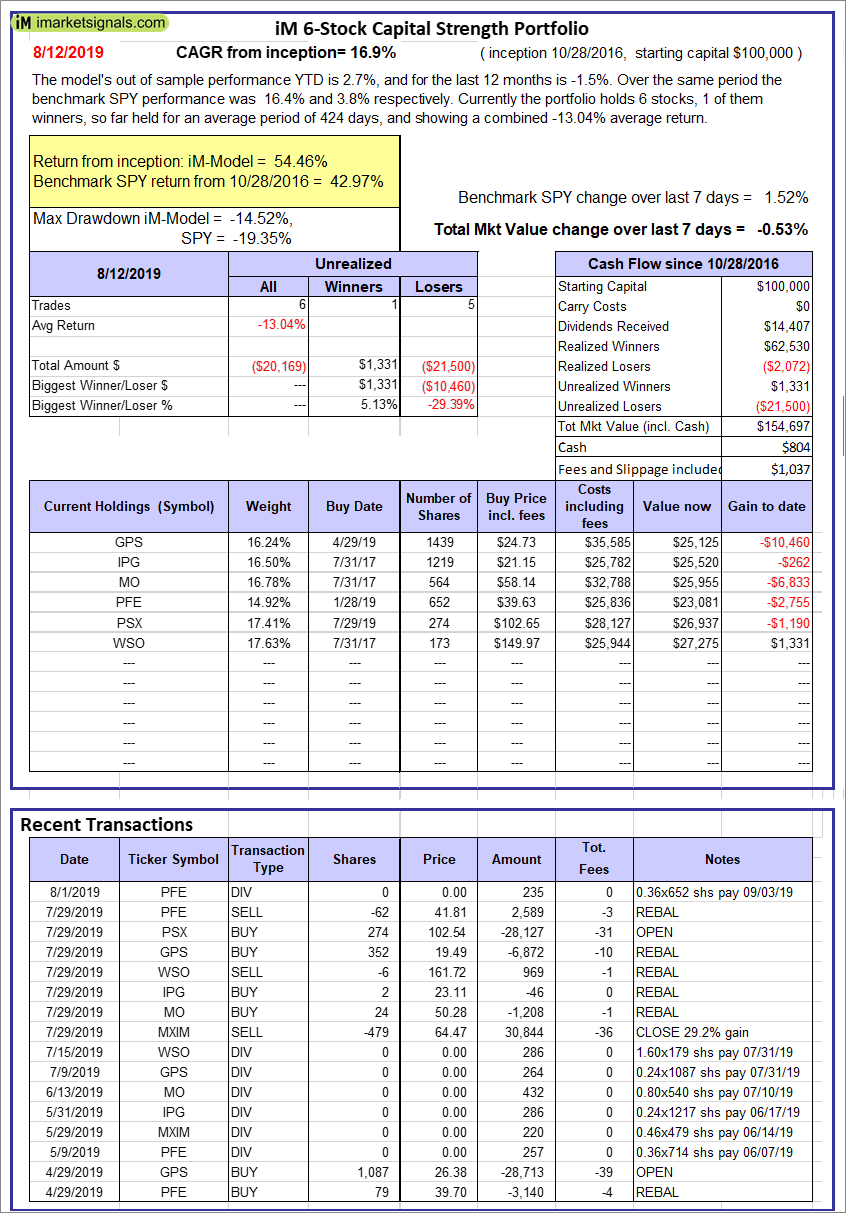
iM 6-Stock Capital Strength Portfolio: The model’s out of sample performance YTD is 2.7%, and for the last 12 months is -1.5%. Over the same period the benchmark SPY performance was 16.4% and 3.8% respectively. Over the previous week the market value of the iM 6-Stock Capital Strength Portfolio gained -0.53% at a time when SPY gained 1.52%. A starting capital of $100,000 at inception on 10/28/2016 would have grown to $154,697 which includes $804 cash and excludes $1,037 spent on fees and slippage. |
|
|
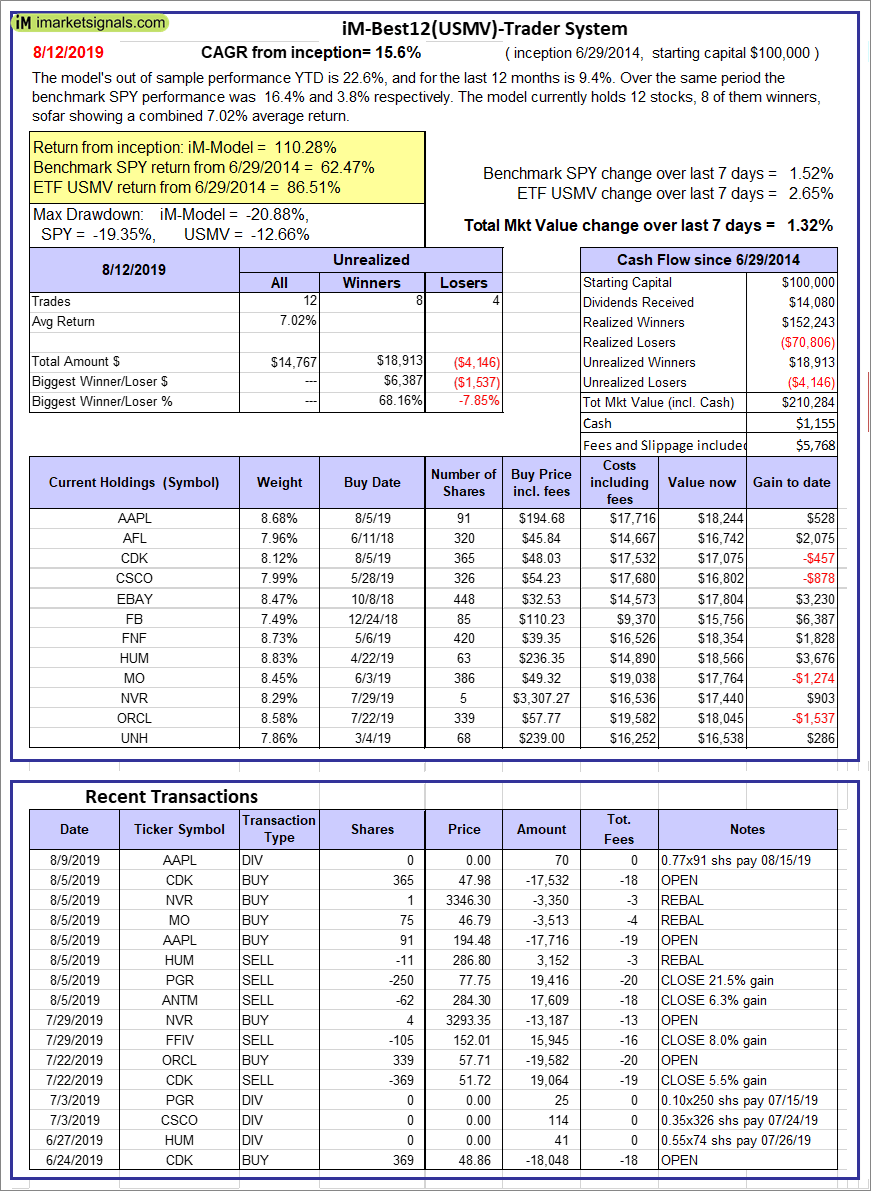
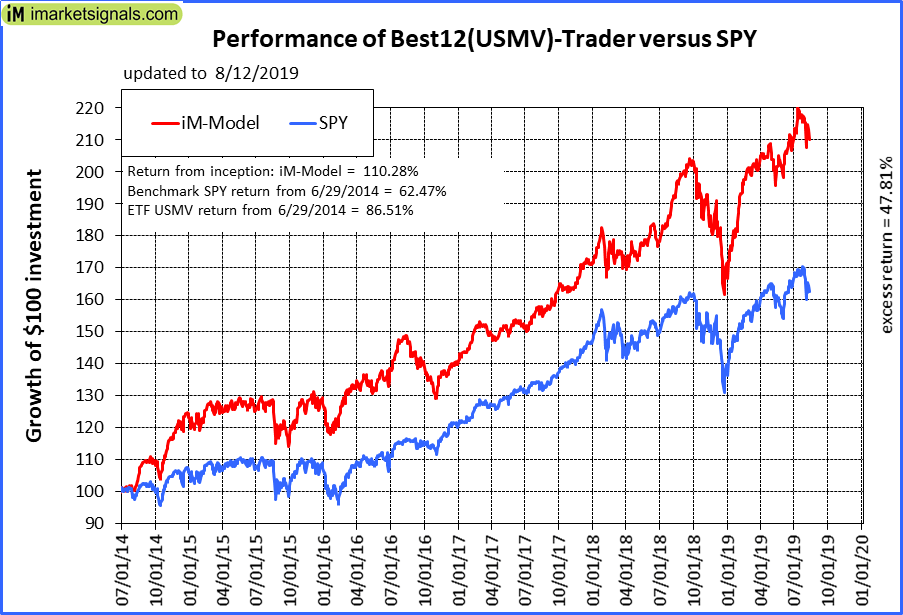
iM-Best12(USMV)-Trader: The model’s out of sample performance YTD is 22.6%, and for the last 12 months is 9.4%. Over the same period the benchmark SPY performance was 16.4% and 3.8% respectively. Since inception, on 6/30/2014, the model gained 110.28% while the benchmark SPY gained 62.47% and the ETF USMV gained 86.51% over the same period. Over the previous week the market value of iM-Best12(USMV)-Trader gained 1.32% at a time when SPY gained 1.52%. A starting capital of $100,000 at inception on 6/30/2014 would have grown to $210,284 which includes $1,155 cash and excludes $5,768 spent on fees and slippage. |
|
|
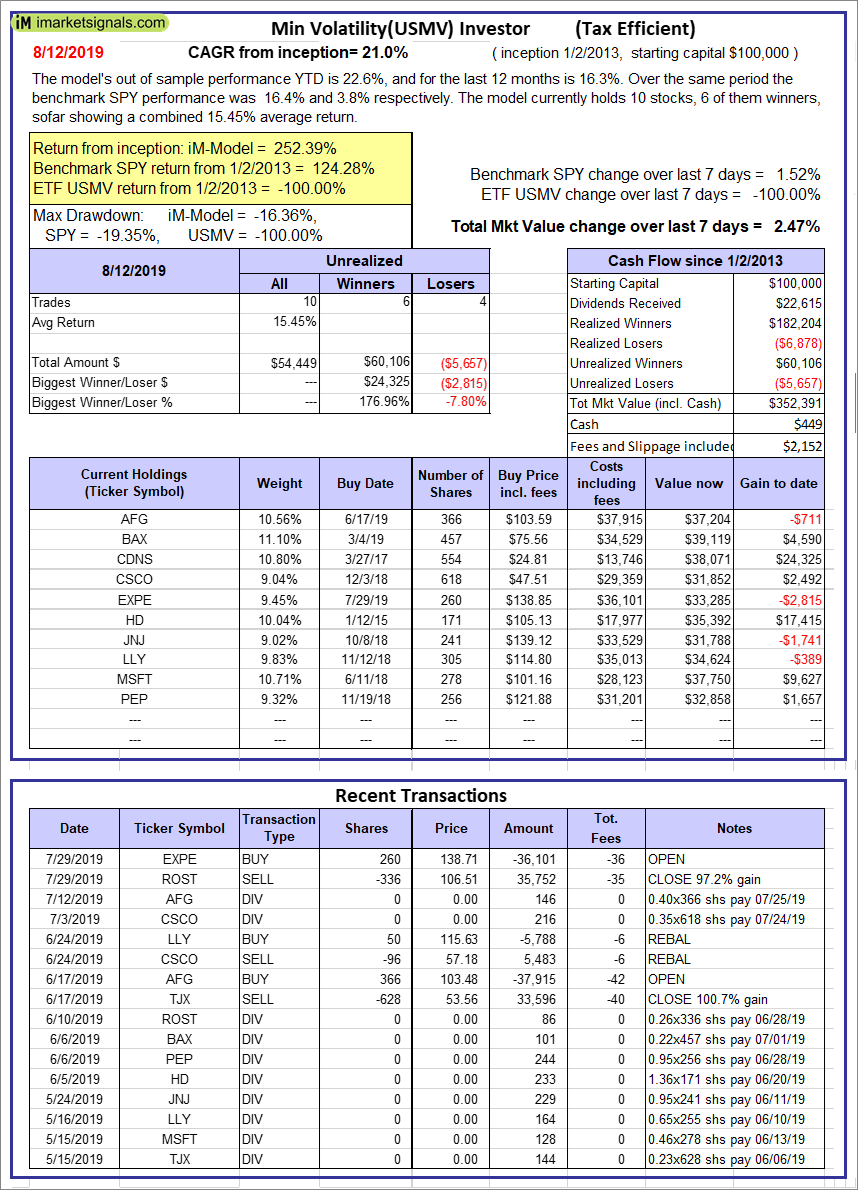
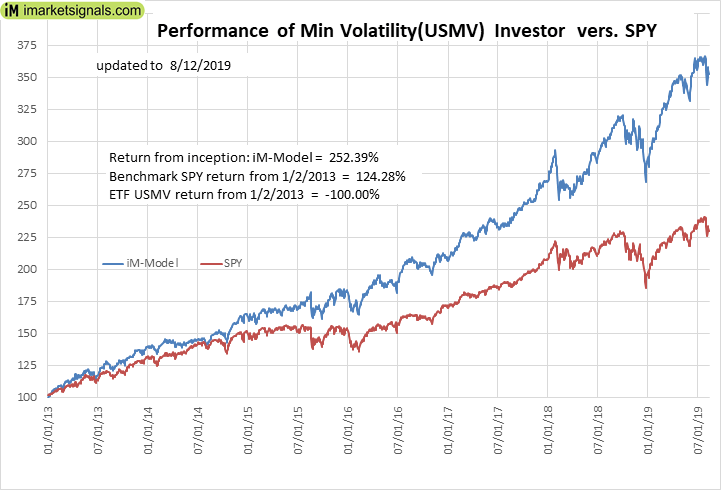
iM Min Volatility (USMV) Investor: The model’s out of sample performance YTD is 26.2%, and for the last 12 months is 24.1%. Over the same period the benchmark SPY performance was 19.9% and 9.9% respectively. Since inception, on 1/3/2013, the model gained 262.93% while the benchmark SPY gained 131.05% and the ETF USMV gained 142.65% over the same period. Over the previous week the market value of iM Min Volatility (USMV) Investor gained 1.22% at a time when SPY gained 0.39%. A starting capital of $100,000 at inception on 1/3/2013 would have grown to $362,932 which includes $651 cash and excludes $2,081 spent on fees and slippage. |
|
|
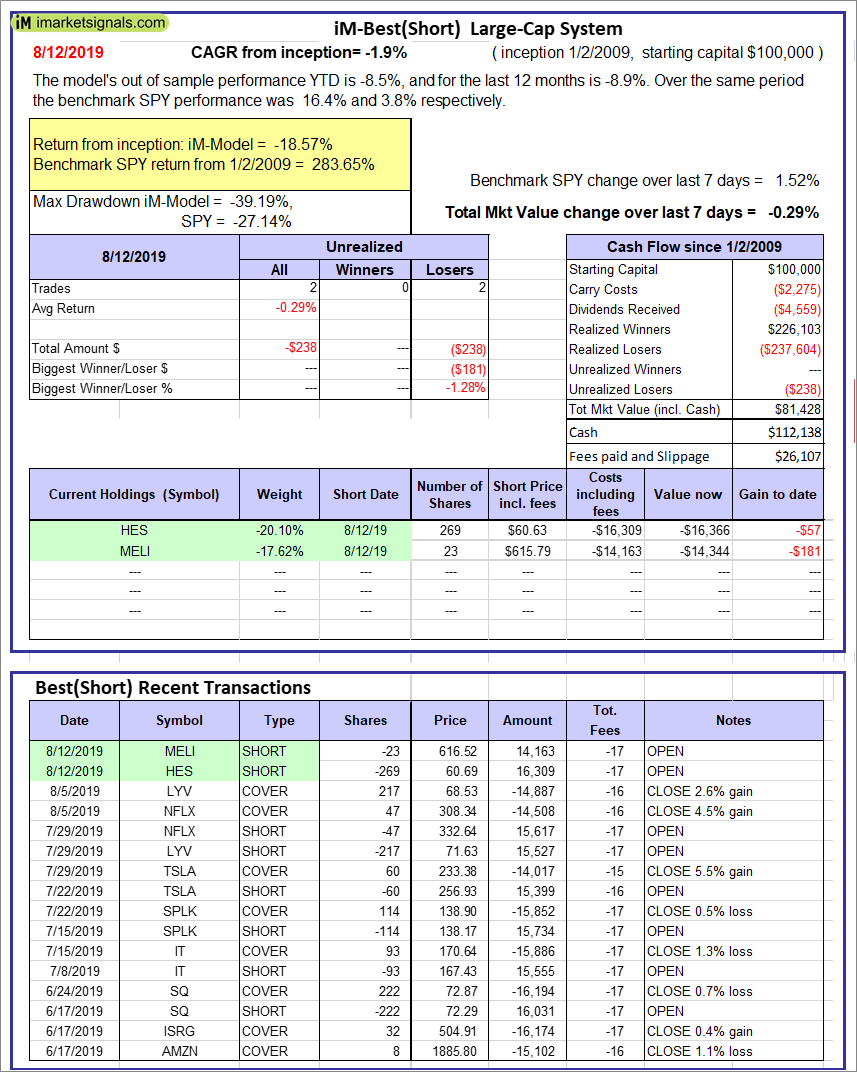
iM-Best(Short): The model’s out of sample performance YTD is -8.5%, and for the last 12 months is -8.9%. Over the same period the benchmark SPY performance was 16.4% and 3.8% respectively. Over the previous week the market value of iM-Best(Short) gained -0.29% at a time when SPY gained 1.52%. Over the period 1/2/2009 to 8/12/2019 the starting capital of $100,000 would have grown to $81,428 which includes $112,138 cash and excludes $26,107 spent on fees and slippage. |
|
|
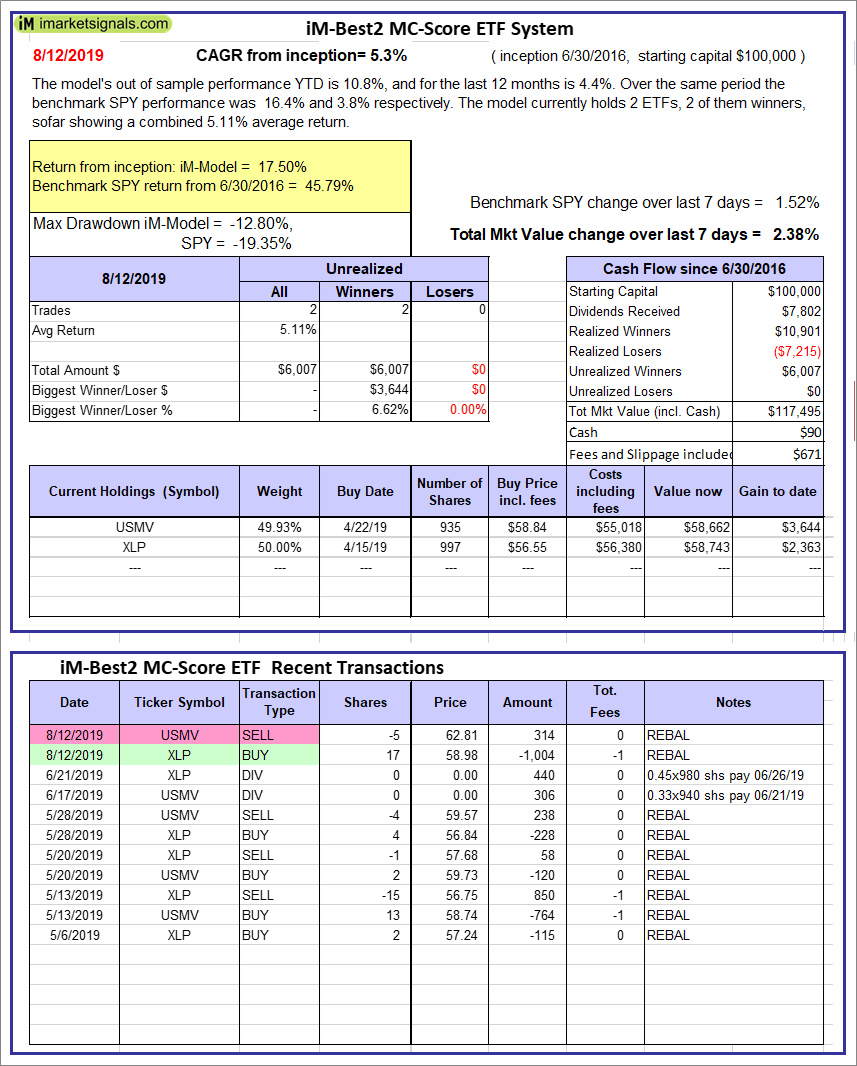
iM-Best2 MC-Score ETF System: The model’s out of sample performance YTD is 10.8%, and for the last 12 months is 4.4%. Over the same period the benchmark SPY performance was 16.4% and 3.8% respectively. Over the previous week the market value of the iM-Best2 MC-Score ETF System gained 2.38% at a time when SPY gained 1.52%. A starting capital of $100,000 at inception on 6/30/2016 would have grown to $117,495 which includes $90 cash and excludes $671 spent on fees and slippage. |
|
|
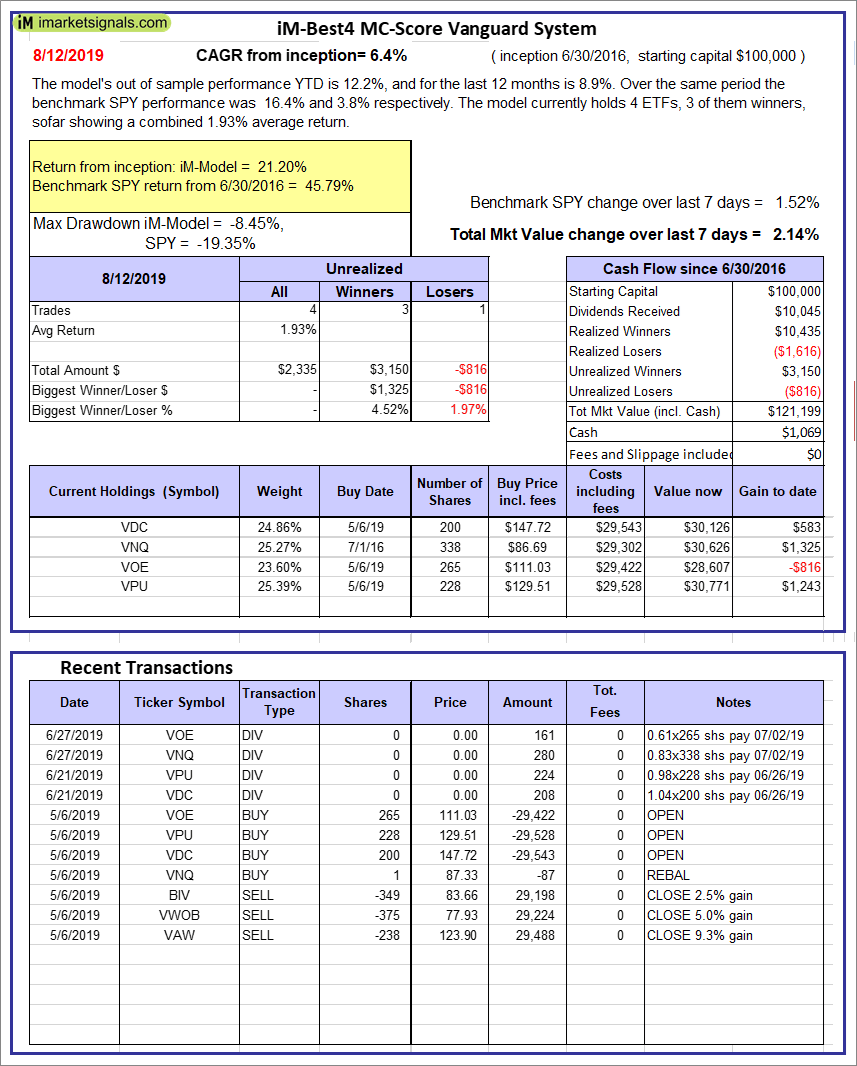
iM-Best4 MC-Score Vanguard System: The model’s out of sample performance YTD is 12.2%, and for the last 12 months is 8.9%. Over the same period the benchmark SPY performance was 16.4% and 3.8% respectively. Over the previous week the market value of the iM-Best4 MC-Score Vanguard System gained 2.14% at a time when SPY gained 1.52%. A starting capital of $100,000 at inception on 6/30/2016 would have grown to $121,199 which includes $1,069 cash and excludes $00 spent on fees and slippage. |
|
|
iM-Composite (SH-RSP) Timer: The model’s out of sample performance YTD is 14.6%, and for the last 12 months is 1.4%. Over the same period the benchmark SPY performance was 16.4% and 3.8% respectively. Over the previous week the market value of the iM-Composite (SH-RSP) Timer gained 0.79% at a time when SPY gained 1.52%. A starting capital of $100,000 at inception on 6/30/2016 would have grown to $137,663 which includes $5,737 cash and excludes $513 spent on fees and slippage. |
|
|
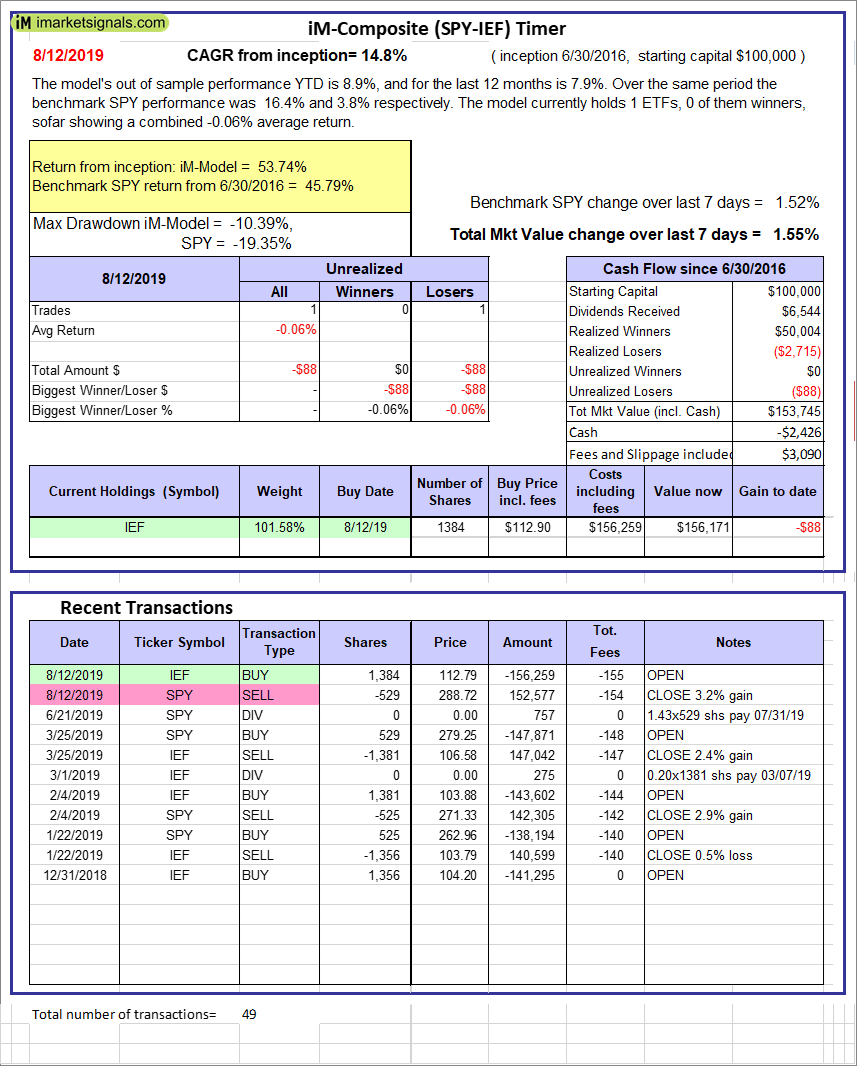
iM-Composite (SPY-IEF) Timer: The model’s out of sample performance YTD is 8.9%, and for the last 12 months is 7.9%. Over the same period the benchmark SPY performance was 16.4% and 3.8% respectively. Over the previous week the market value of the iM-Composite (SPY-IEF) Timer gained 1.55% at a time when SPY gained 1.52%. A starting capital of $100,000 at inception on 6/30/2016 would have grown to $153,745 which includes -$2,426 cash and excludes $3,090 spent on fees and slippage. |
|
|
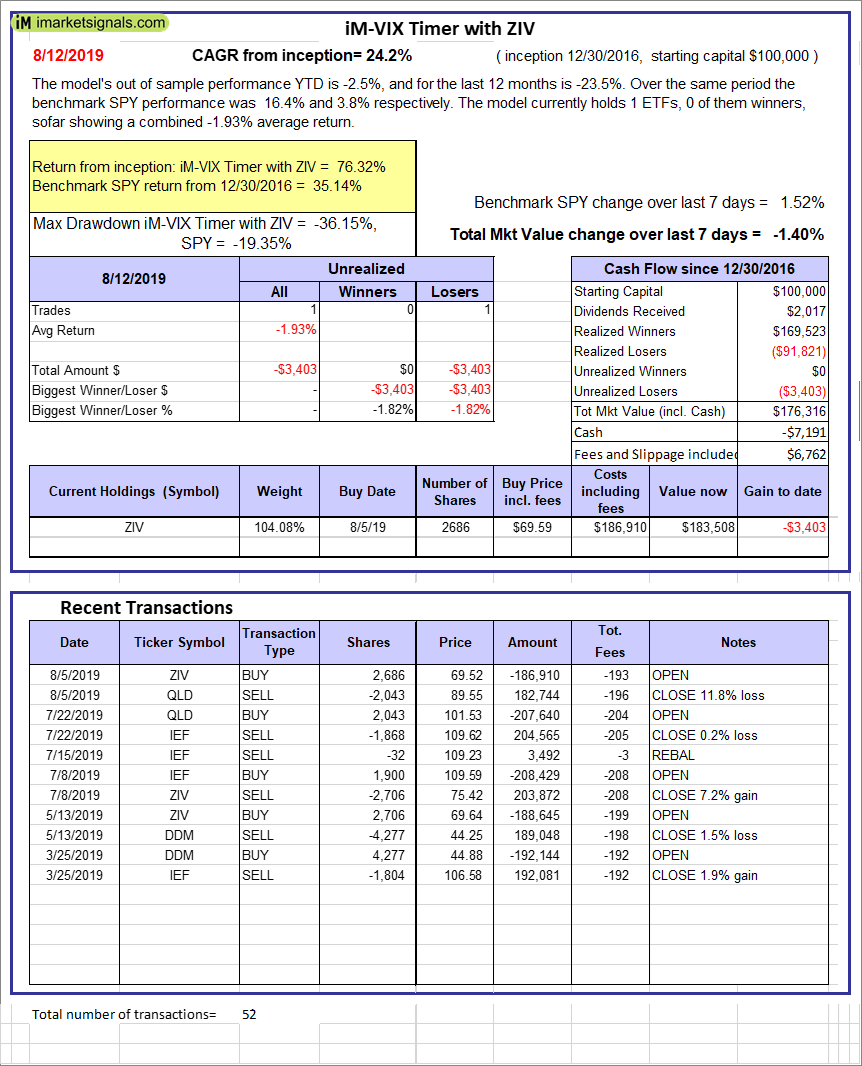
iM-VIX Timer with ZIV: The model’s out of sample performance YTD is -2.5%, and for the last 12 months is -23.5%. Over the same period the benchmark SPY performance was 16.4% and 3.8% respectively. Over the previous week the market value of the iM-VIX Timer with ZIV gained -1.40% at a time when SPY gained 1.52%. A starting capital of $100,000 at inception on 6/30/2016 would have grown to $176,316 which includes -$7,191 cash and excludes $6,762 spent on fees and slippage. |
|
|
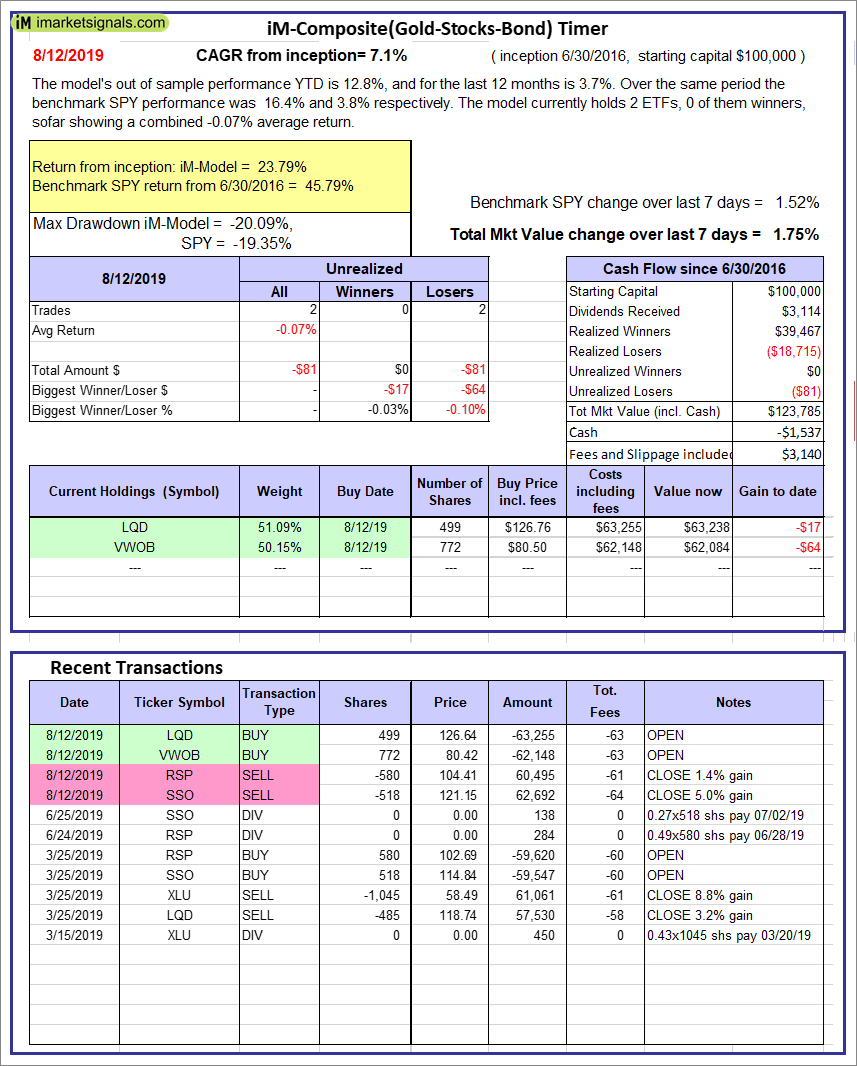
iM-Composite(Gold-Stocks-Bond) Timer: The model’s out of sample performance YTD is 12.8%, and for the last 12 months is 3.7%. Over the same period the benchmark SPY performance was 16.4% and 3.8% respectively. Over the previous week the market value of the iM-Composite(Gold-Stocks-Bond) Timer gained 1.75% at a time when SPY gained 1.52%. A starting capital of $100,000 at inception on 6/30/2016 would have grown to $123,785 which includes -$1,537 cash and excludes $3,140 spent on fees and slippage. |
|
|
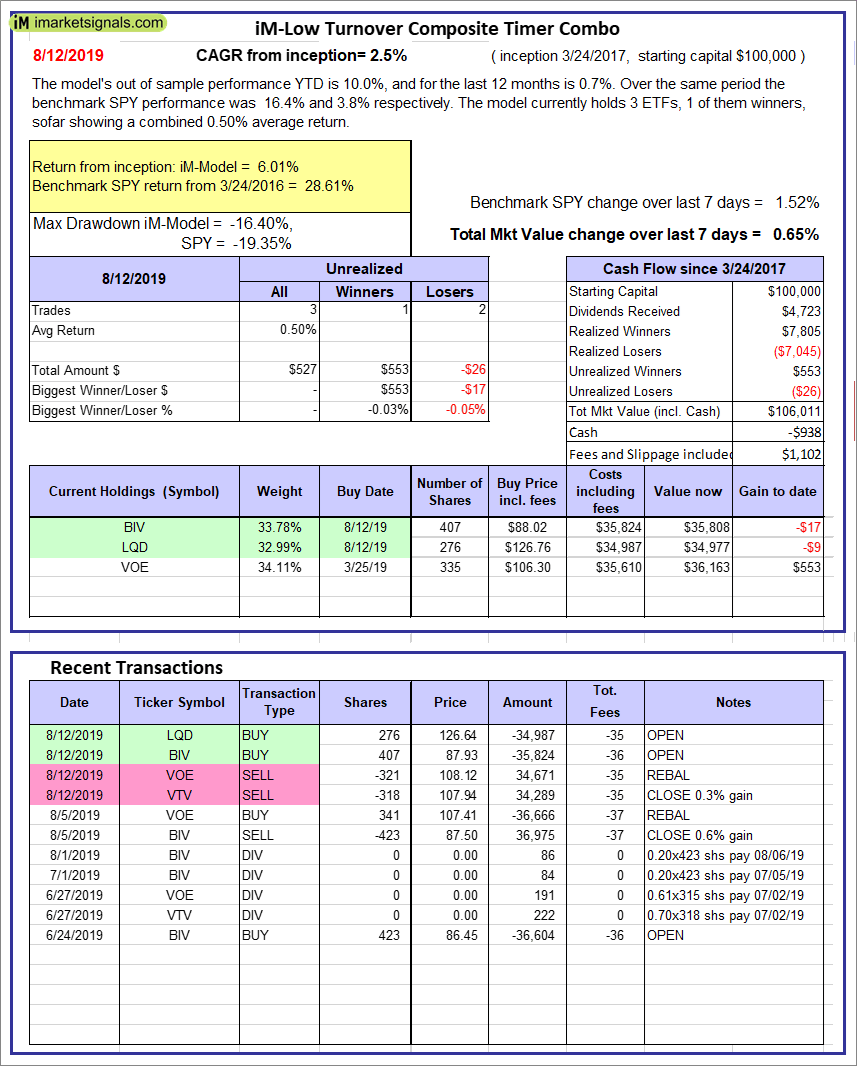
iM-Low Turnover Composite Timer Combo: The model’s out of sample performance YTD is 10.0%, and for the last 12 months is 0.7%. Over the same period the benchmark SPY performance was 16.4% and 3.8% respectively. Over the previous week the market value of the iM-Low Turnover Composite Timer Combo gained 0.65% at a time when SPY gained 1.52%. A starting capital of $100,000 at inception on 3/24/27 would have grown to $106,011 which includes -$938 cash and excludes $1,102 spent on fees and slippage. |
|
|
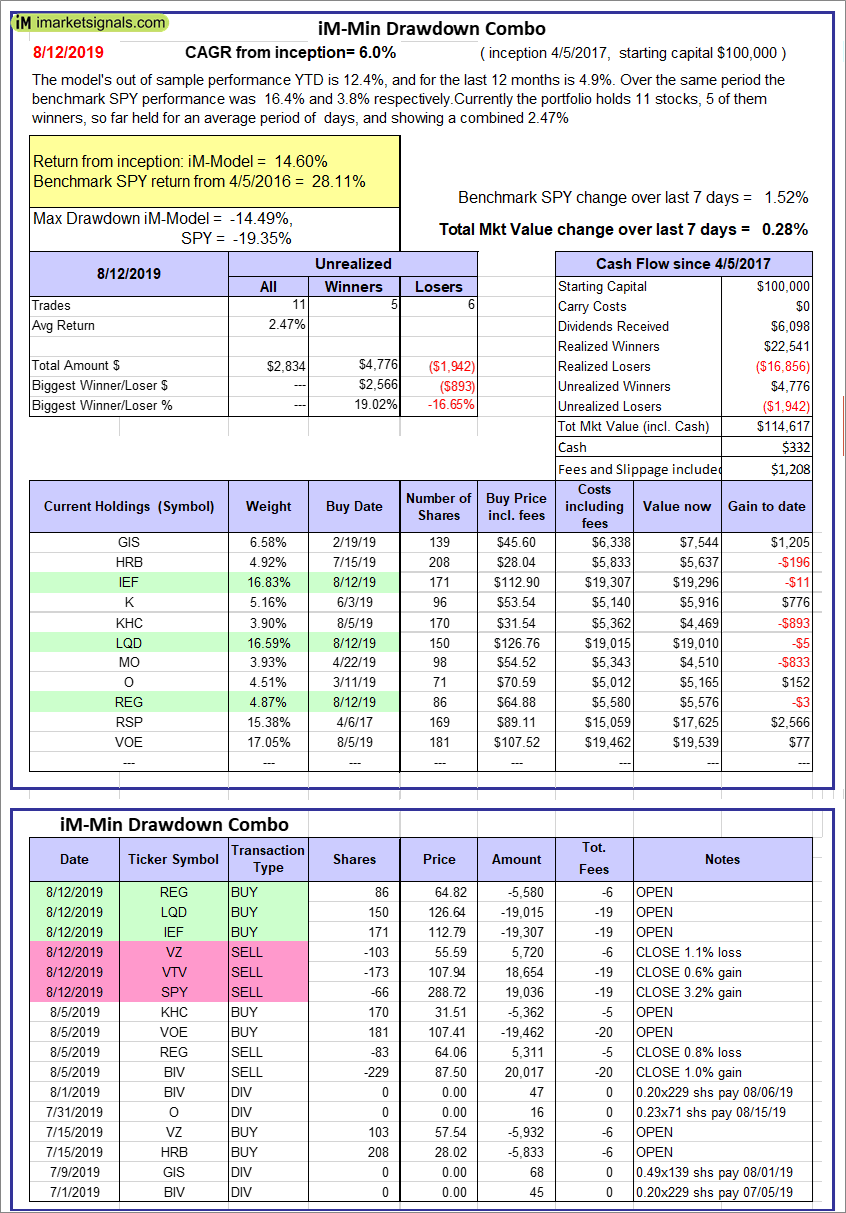
iM-Min Drawdown Combo: The model’s out of sample performance YTD is 12.4%, and for the last 12 months is 4.9%. Over the same period the benchmark SPY performance was 16.4% and 3.8% respectively. Over the previous week the market value of the iM-Min Drawdown Combo gained 0.28% at a time when SPY gained 1.52%. A starting capital of $100,000 at inception on 4/5/2017 would have grown to $114,617 which includes $332 cash and excludes $1,208 spent on fees and slippage. |
|
|
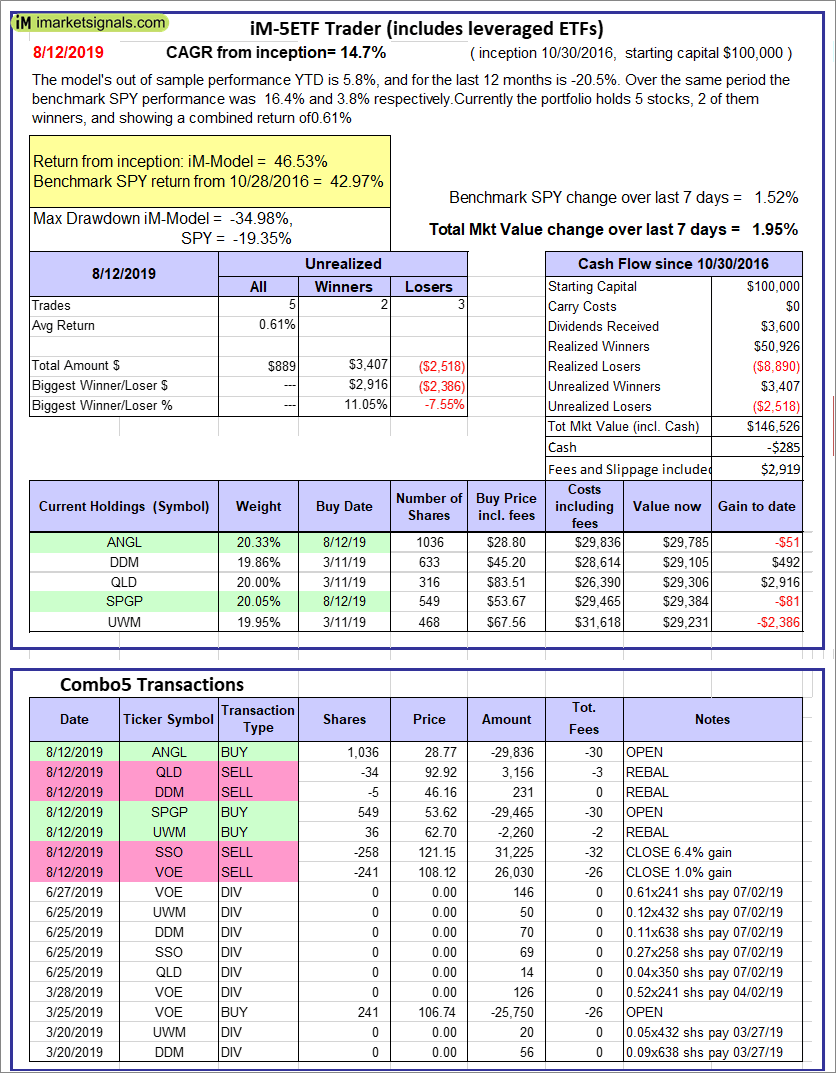
iM-5ETF Trader (includes leveraged ETFs): The model’s out of sample performance YTD is 5.8%, and for the last 12 months is -20.5%. Over the same period the benchmark SPY performance was 16.4% and 3.8% respectively. Over the previous week the market value of the iM-5ETF Trader (includes leveraged ETFs) gained 1.95% at a time when SPY gained 1.52%. A starting capital of $100,000 at inception on 10/30/2016 would have grown to $146,526 which includes -$285 cash and excludes $2,919 spent on fees and slippage. |
|
|
iM-Standard 5ETF Trader (excludes leveraged ETFs): The model’s out of sample performance YTD is 7.4%, and for the last 12 months is -5.1%. Over the same period the benchmark SPY performance was 16.4% and 3.8% respectively. Over the previous week the market value of the iM-Standard 5ETF Trader (excludes leveraged ETFs) gained 1.16% at a time when SPY gained 1.52%. A starting capital of $100,000 at inception on 10/30/2016 would have grown to $125,961 which includes $197 cash and excludes $2,722 spent on fees and slippage. |


Leave a Reply
You must be logged in to post a comment.