  |
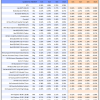
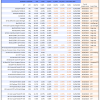
Out of sample performance summary of our models for the past 1, 2, 4 and 13 week periods. The active active return indicates how the models over- or underperformed the benchmark ETF SPY. Also the YTD, and the 1-, 3-, 5- and 10-year annualized returns are shown in the second table |
|
|
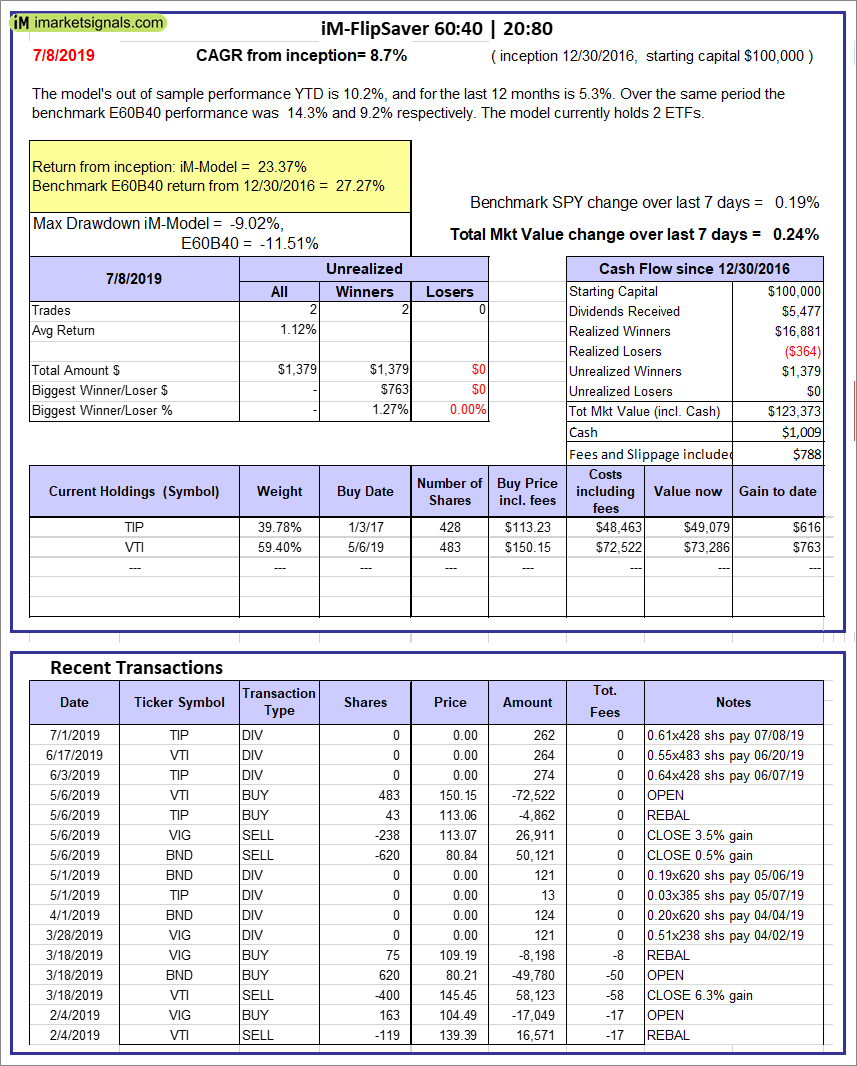
iM-FlipSaver 60:40 | 20:80 – 2017: The model’s out of sample performance YTD is 10.2%, and for the last 12 months is 5.3%. Over the same period the benchmark E60B40 performance was 14.3% and 9.2% respectively. Over the previous week the market value of iM-FlipSaver 80:20 | 20:80 gained 0.24% at a time when SPY gained 0.19%. A starting capital of $100,000 at inception on 7/16/2015 would have grown to $123,373 which includes $1,009 cash and excludes $788 spent on fees and slippage. |
|
|
iM-FlipSaver 70:30 | 20:80 – 2017: The model’s out of sample performance YTD is 10.6%, and for the last 12 months is 5.5%. Over the same period the benchmark E60B40 performance was 14.3% and 9.2% respectively. Over the previous week the market value of iM-FlipSaver 70:30 | 20:80 gained 0.27% at a time when SPY gained 0.19%. A starting capital of $100,000 at inception on 7/15/2015 would have grown to $126,061 which includes $941 cash and excludes $909 spent on fees and slippage. |
|
|
iM-FlipSaver 80:20 | 20:80 – 2017: The model’s out of sample performance YTD is 11.0%, and for the last 12 months is 5.6%. Over the same period the benchmark E60B40 performance was 14.3% and 9.2% respectively. Over the previous week the market value of iM-FlipSaver 80:20 | 20:80 gained 0.31% at a time when SPY gained 0.19%. A starting capital of $100,000 at inception on 1/2/2017 would have grown to $128,725 which includes $965 cash and excludes $1,024 spent on fees and slippage. |
|
|
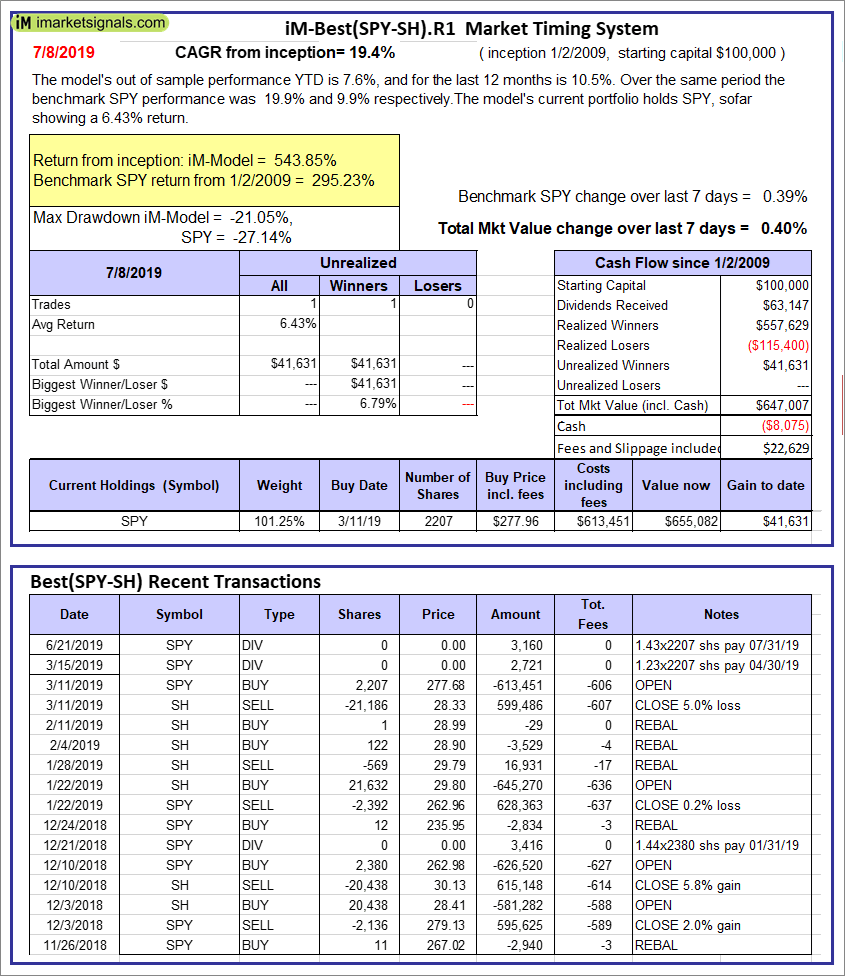
iM-Best(SPY-SH).R1: The model’s out of sample performance YTD is 7.6%, and for the last 12 months is 10.5%. Over the same period the benchmark SPY performance was 19.9% and 9.9% respectively. Over the previous week the market value of Best(SPY-SH) gained 0.40% at a time when SPY gained 0.39%. A starting capital of $100,000 at inception on 1/2/2009 would have grown to $647,007 which includes -$8,075 cash and excludes $22,629 spent on fees and slippage. |
|
|
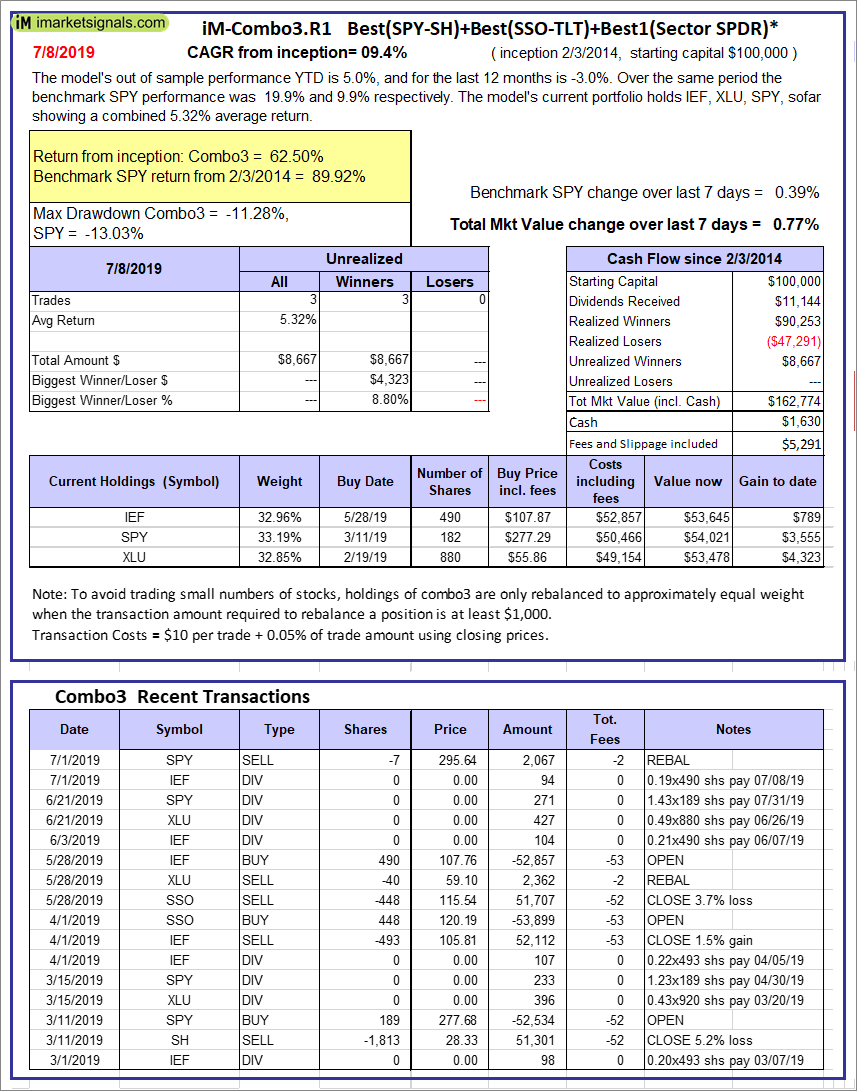
iM-Combo3.R1: The model’s out of sample performance YTD is 5.0%, and for the last 12 months is -3.0%. Over the same period the benchmark SPY performance was 19.9% and 9.9% respectively. Over the previous week the market value of iM-Combo3.R1 gained 0.77% at a time when SPY gained 0.39%. A starting capital of $100,000 at inception on 2/3/2014 would have grown to $162,774 which includes $1,630 cash and excludes $5,291 spent on fees and slippage. |
|
|
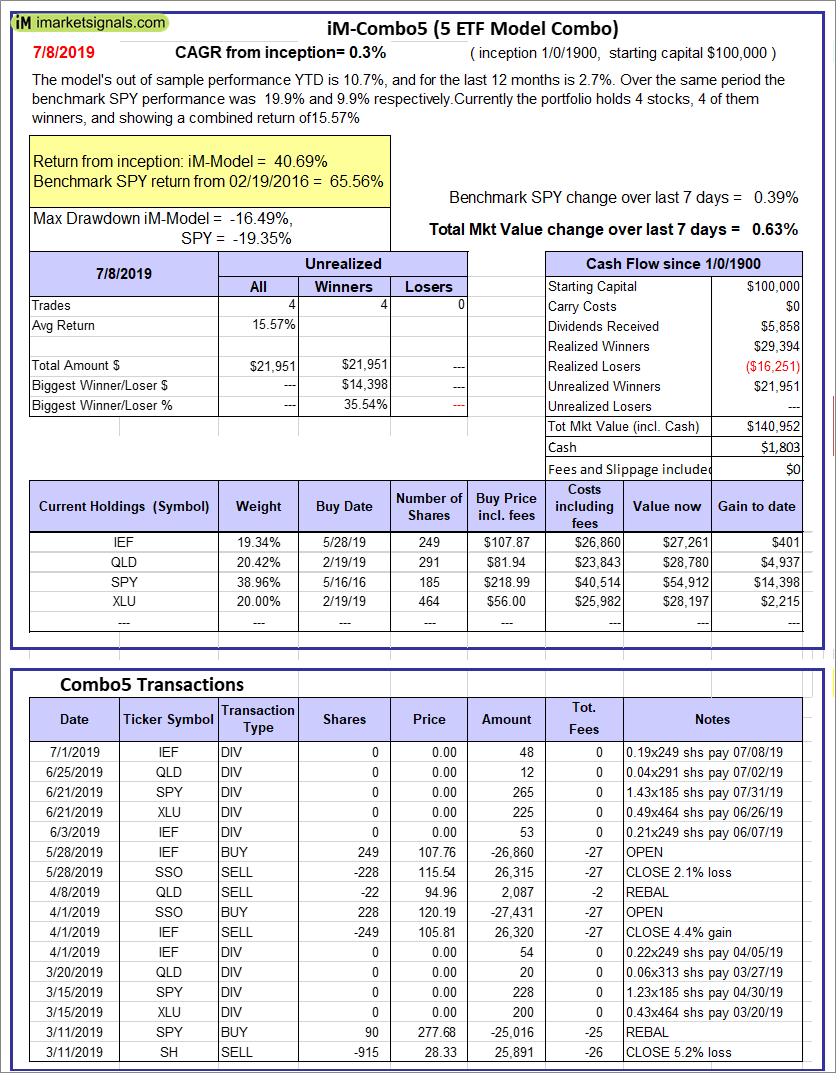
iM-Combo5: The model’s out of sample performance YTD is 10.7%, and for the last 12 months is 2.7%. Over the same period the benchmark SPY performance was 19.9% and 9.9% respectively. Over the previous week the market value of iM-Combo5 gained 0.63% at a time when SPY gained 0.39%. A starting capital of $100,000 at inception on 2/22/2016 would have grown to $140,952 which includes $1,803 cash and excludes $0 spent on fees and slippage. |
|
|
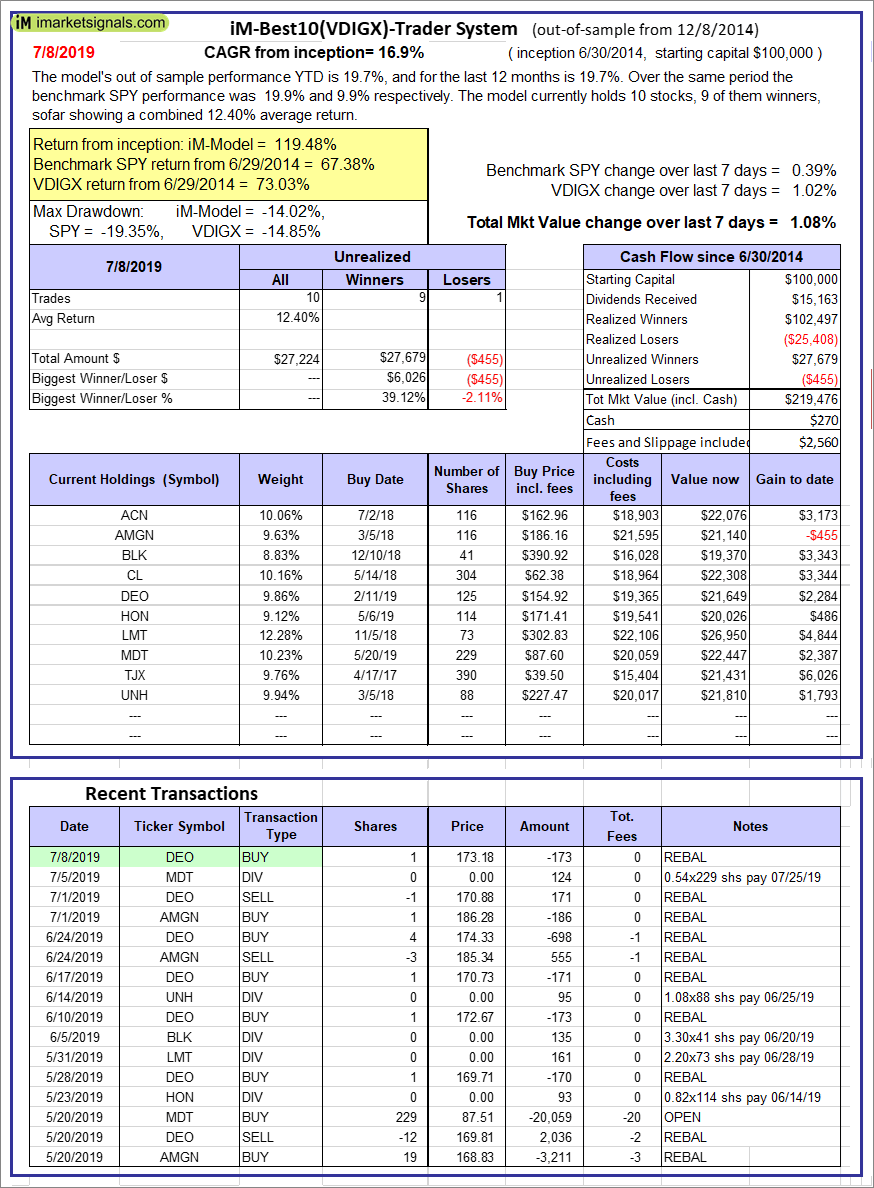
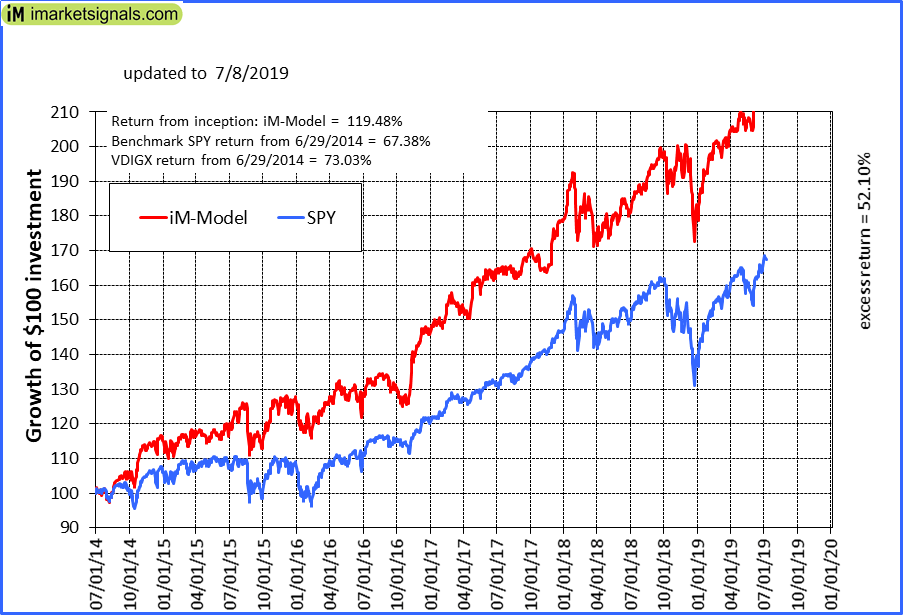
iM-Best10(VDIGX)-Trader: The model’s out of sample performance YTD is 19.7%, and for the last 12 months is 19.7%. Over the same period the benchmark SPY performance was 19.9% and 9.9% respectively. Since inception, on 7/1/2014, the model gained 119.48% while the benchmark SPY gained 67.38% and VDIGX gained 73.03% over the same period. Over the previous week the market value of iM-Best10(VDIGX) gained 1.08% at a time when SPY gained 0.39%. A starting capital of $100,000 at inception on 7/1/2014 would have grown to $219,476 which includes $270 cash and excludes $2,560 spent on fees and slippage. |
|
|
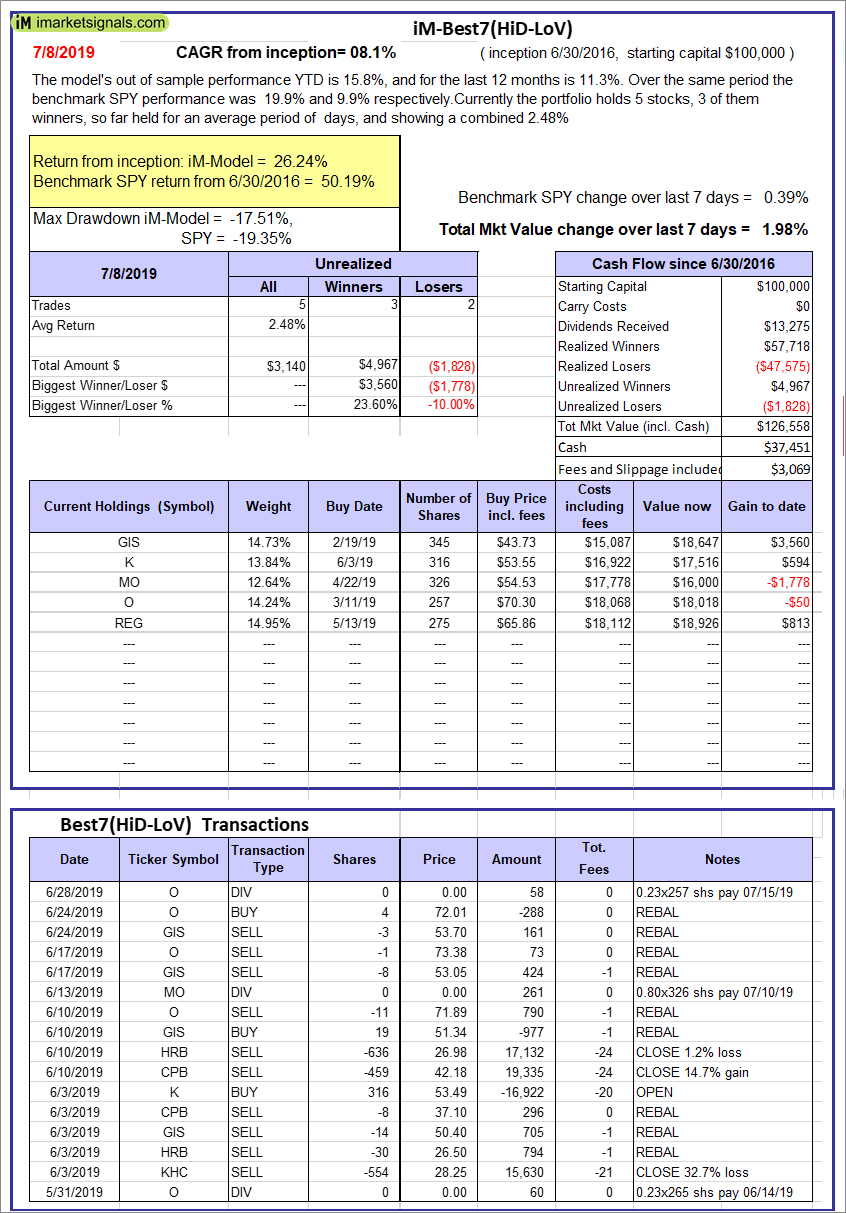
iM-Best7(HiD-LoV): The model’s out of sample performance YTD is 15.8%, and for the last 12 months is 11.3%. Over the same period the benchmark SPY performance was 19.9% and 9.9% respectively. Over the previous week the market value of iM-Best7(HiD-LoV) gained 1.98% at a time when SPY gained 0.39%. A starting capital of $100,000 at inception on 6/30/2016 would have grown to $126,558 which includes $37,451 cash and excludes $3,069 spent on fees and slippage. |
|
|
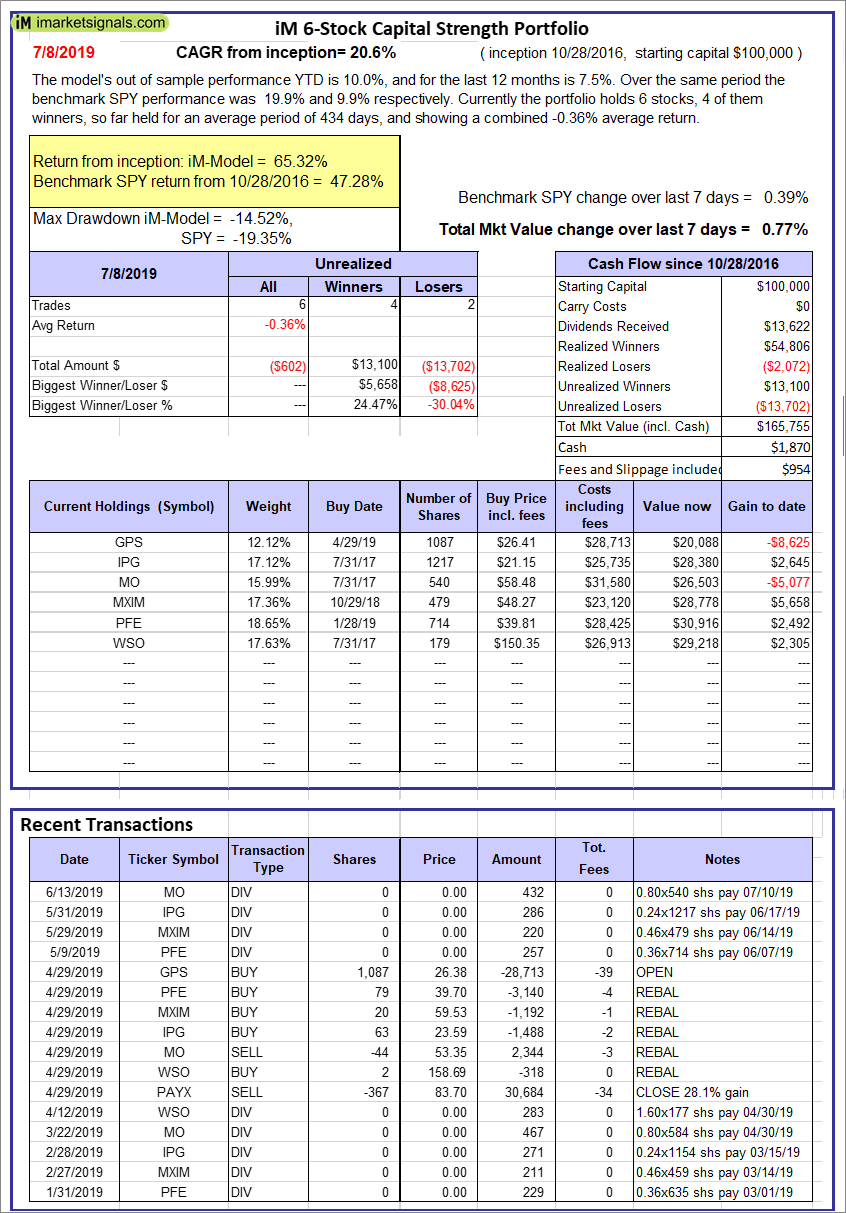
iM 6-Stock Capital Strength Portfolio: The model’s out of sample performance YTD is 10.0%, and for the last 12 months is 7.5%. Over the same period the benchmark SPY performance was 19.9% and 9.9% respectively. Over the previous week the market value of the iM 6-Stock Capital Strength Portfolio gained 0.77% at a time when SPY gained 0.39%. A starting capital of $100,000 at inception on 10/28/2016 would have grown to $165,755 which includes $1,870 cash and excludes $954 spent on fees and slippage. |
|
|
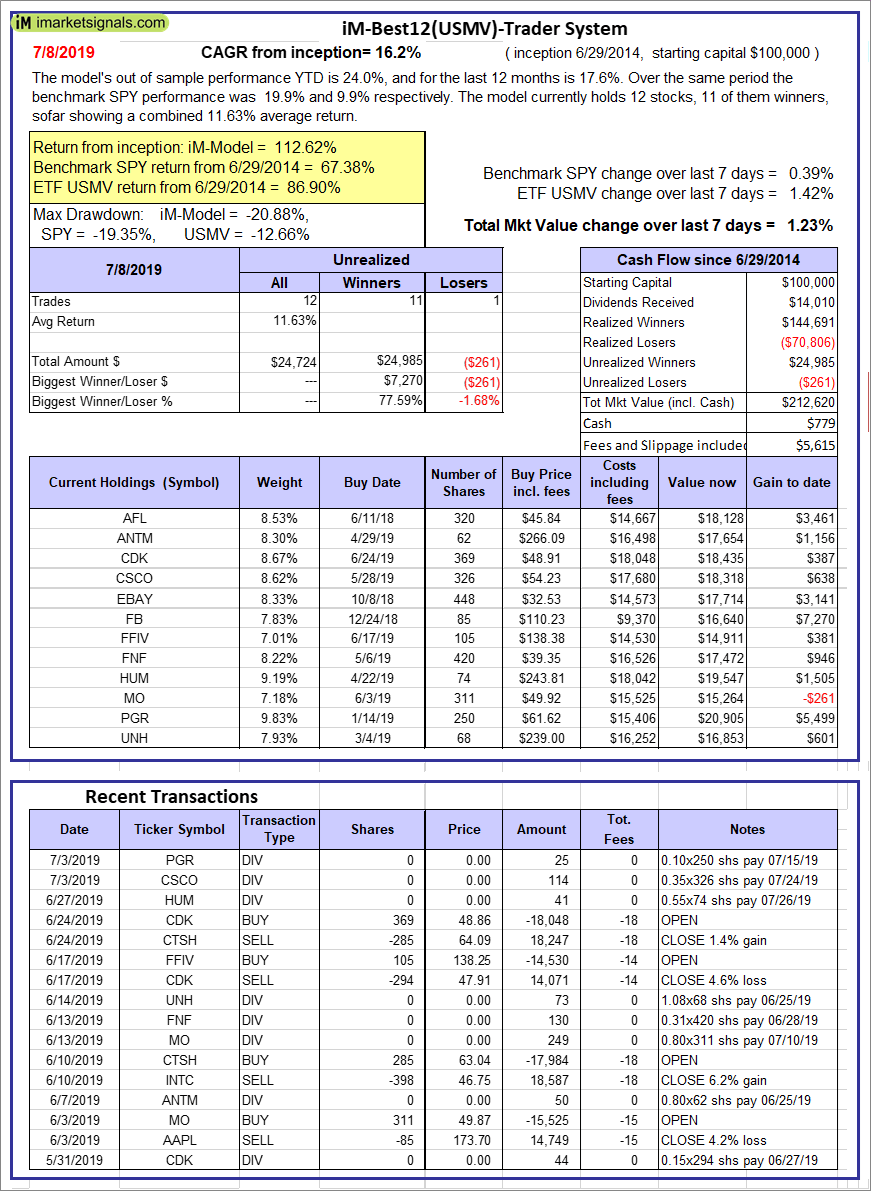
iM-Best12(USMV)-Trader: The model’s out of sample performance YTD is 24.0%, and for the last 12 months is 17.6%. Over the same period the benchmark SPY performance was 19.9% and 9.9% respectively. Since inception, on 6/30/2014, the model gained 112.62% while the benchmark SPY gained 67.38% and the ETF USMV gained 86.90% over the same period. Over the previous week the market value of iM-Best12(USMV)-Trader gained 1.23% at a time when SPY gained 0.39%. A starting capital of $100,000 at inception on 6/30/2014 would have grown to $212,620 which includes $779 cash and excludes $5,615 spent on fees and slippage. |
|
|
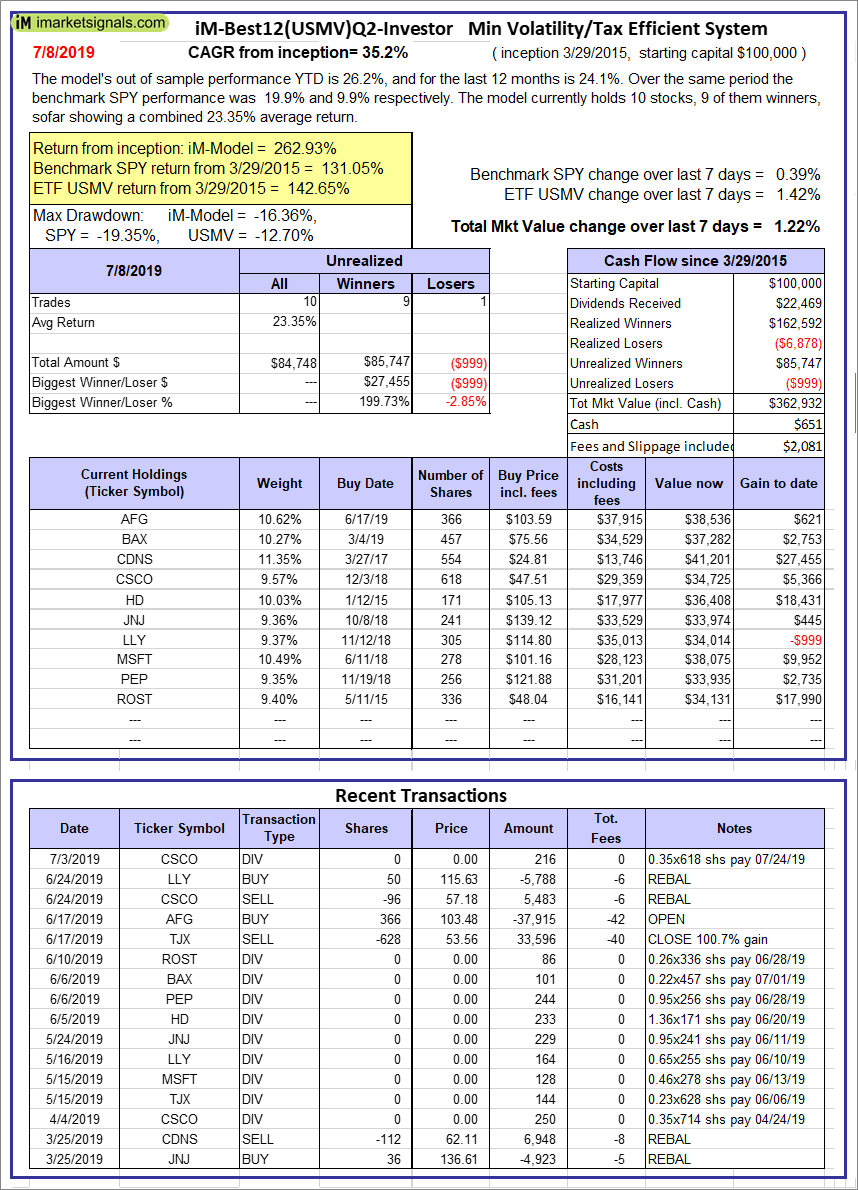
iM Min Volatility (USMV) Investor: The model’s out of sample performance YTD is 26.2%, and for the last 12 months is 24.1%. Over the same period the benchmark SPY performance was 19.9% and 9.9% respectively. Since inception, on 1/3/2013, the model gained 262.93% while the benchmark SPY gained 131.05% and the ETF USMV gained 142.65% over the same period. Over the previous week the market value of iM Min Volatility (USMV) Investor gained 1.22% at a time when SPY gained 0.39%. A starting capital of $100,000 at inception on 1/3/2013 would have grown to $362,932 which includes $651 cash and excludes $2,081 spent on fees and slippage. |
|
|
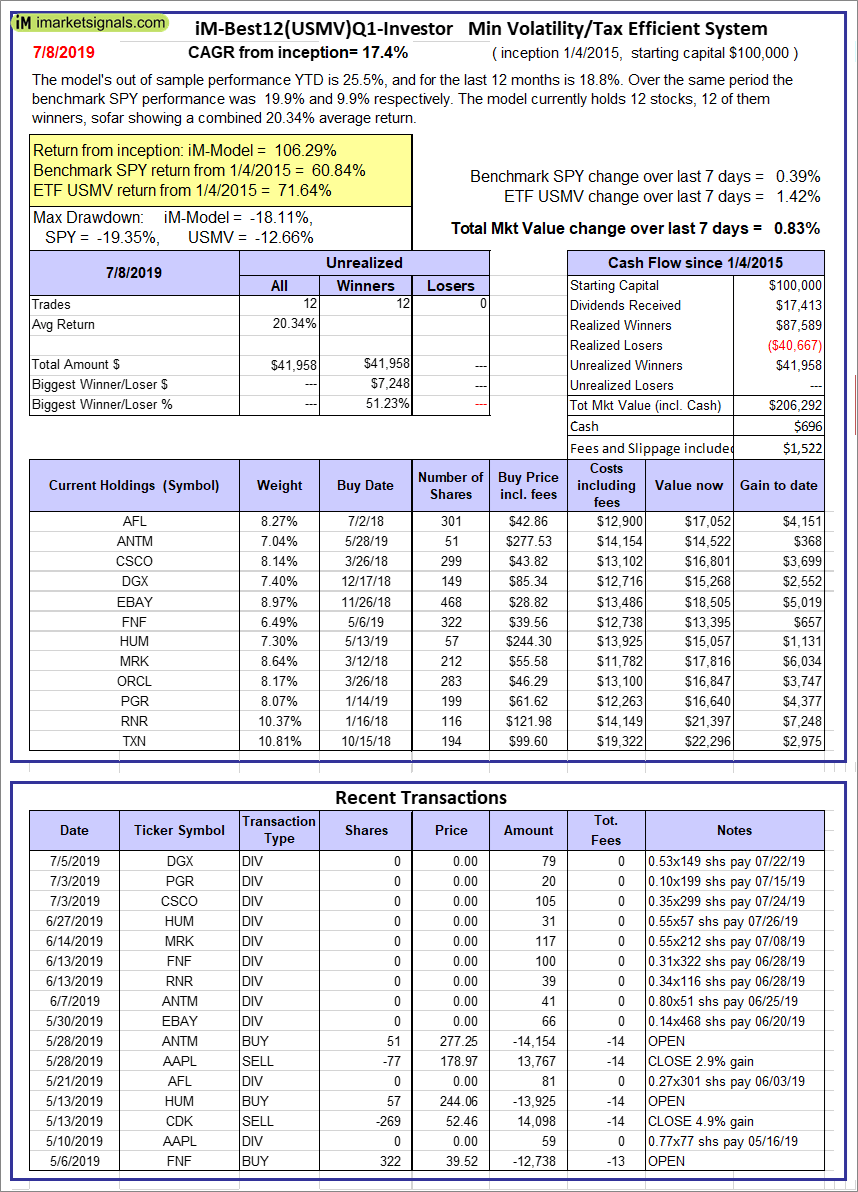
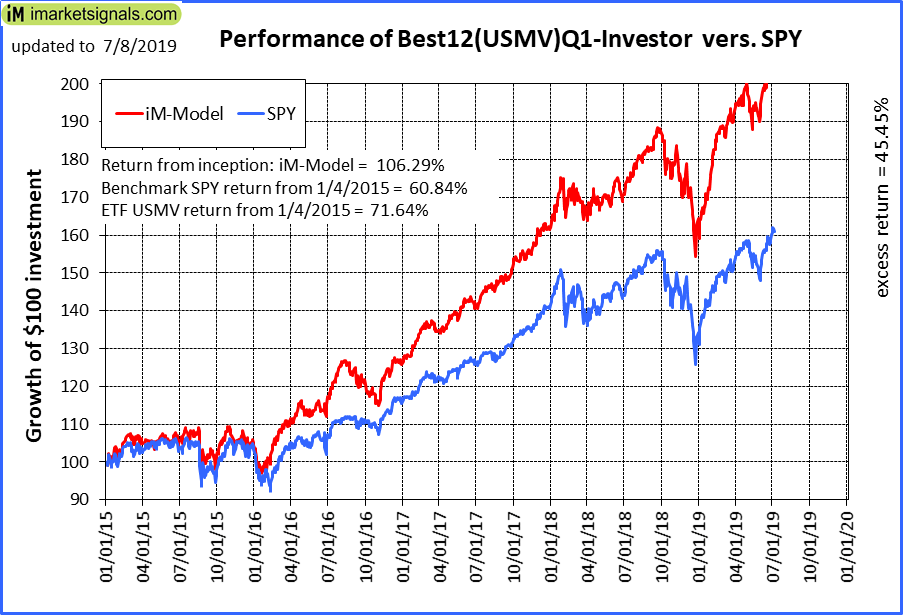
iM-Best12(USMV)Q1-Investor: To be discontinued. The model’s out of sample performance YTD is 25.5%, and for the last 12 months is 18.8%. Over the same period the benchmark SPY performance was 19.9% and 9.9% respectively. Since inception, on 1/5/2015, the model gained 106.29% while the benchmark SPY gained 60.84% and the ETF USMV gained 71.64% over the same period. Over the previous week the market value of iM-Best12(USMV)Q1 gained 0.83% at a time when SPY gained 0.39%. A starting capital of $100,000 at inception on 1/5/2015 would have grown to $206,292 which includes $696 cash and excludes $1,522 spent on fees and slippage. |
|
|
iM-Best12(USMV)Q2-Investor: To be discontinued. The model’s out of sample performance YTD is 23.6%, and for the last 12 months is 19.2%. Over the same period the benchmark SPY performance was 19.9% and 9.9% respectively. Since inception, on 3/30/2015, the model gained 71.69% while the benchmark SPY gained 55.11% and the ETF USMV gained 65.78% over the same period. Over the previous week the market value of iM-Best12(USMV)Q2 gained 1.18% at a time when SPY gained 0.39%. A starting capital of $100,000 at inception on 3/30/2015 would have grown to $171,687 which includes $492 cash and excludes $1,431 spent on fees and slippage. |
|
|
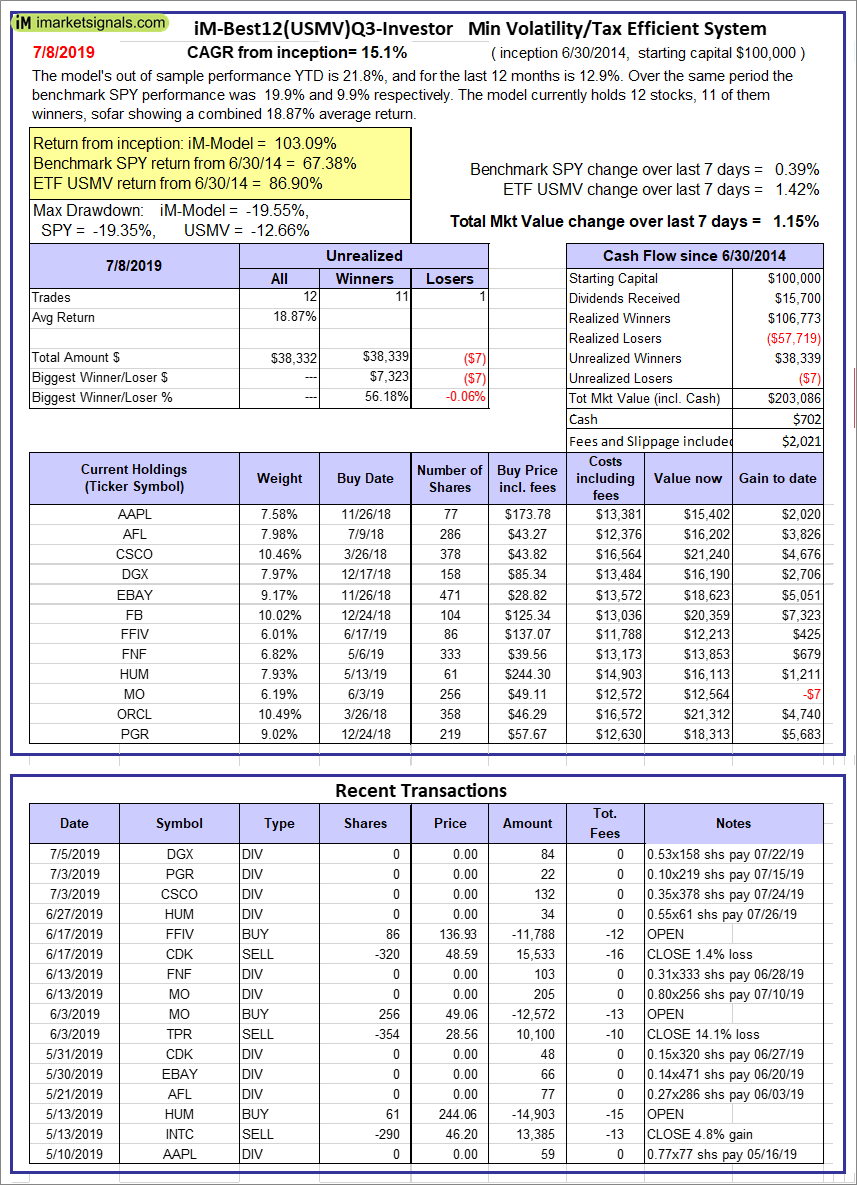
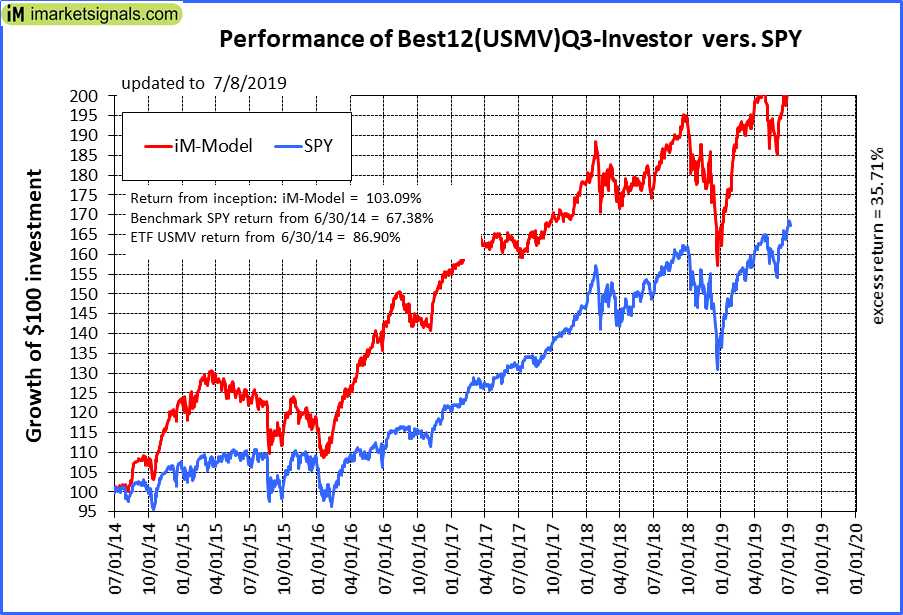
iM-Best12(USMV)Q3-Investor: To be discontinued. The model’s out of sample performance YTD is 21.8%, and for the last 12 months is 12.9%. Over the same period the benchmark SPY performance was 19.9% and 9.9% respectively. Since inception, on 7/1/2014, the model gained 103.09% while the benchmark SPY gained 67.38% and the ETF USMV gained 86.90% over the same period. Over the previous week the market value of iM-Best12(USMV)Q3 gained 1.15% at a time when SPY gained 0.39%. A starting capital of $100,000 at inception on 7/1/2014 would have grown to $203,086 which includes $702 cash and excludes $2,021 spent on fees and slippage. |
|
|
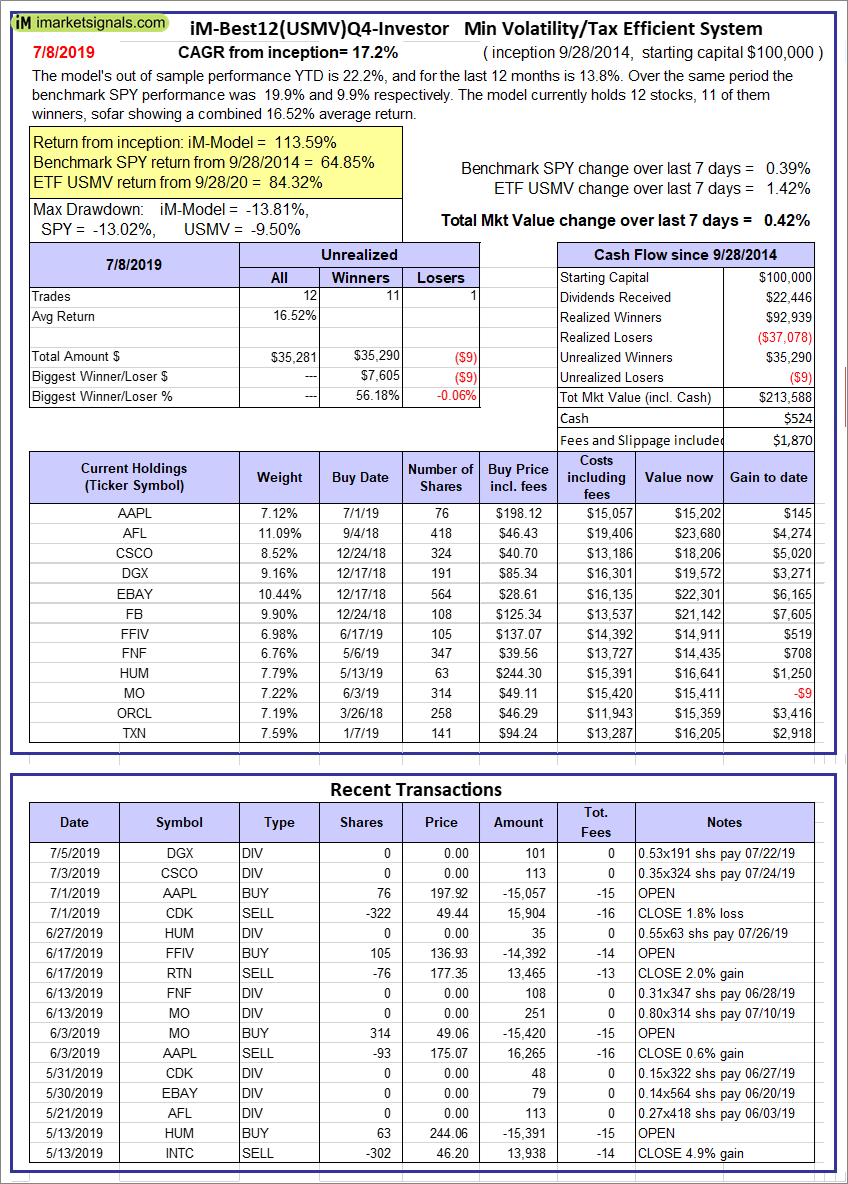
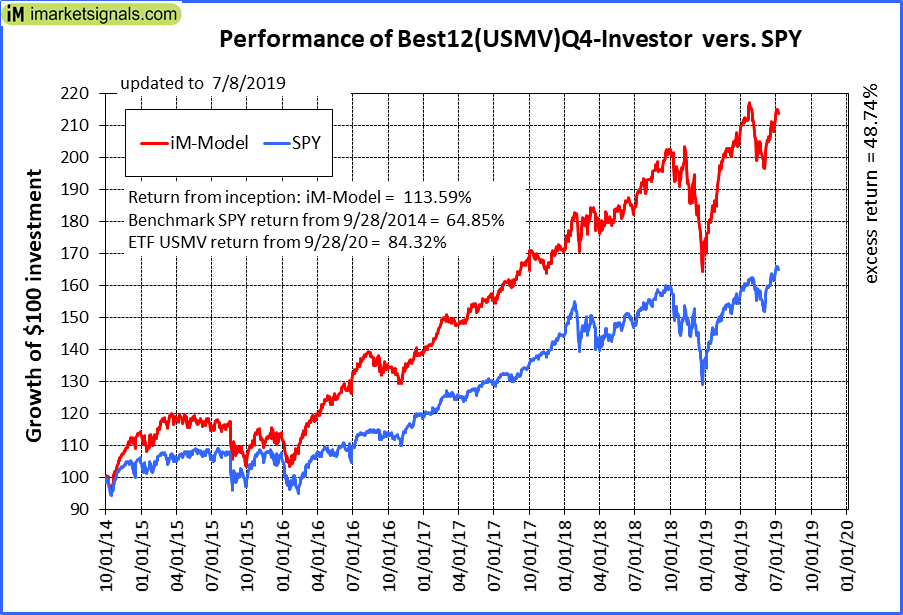
iM-Best12(USMV)Q4-Investor: To be discontinued. Since inception, on 9/29/2014, the model gained 113.59% while the benchmark SPY gained 64.85% and the ETF USMV gained 84.32% over the same period. Over the previous week the market value of iM-Best12(USMV)Q4 gained 0.42% at a time when SPY gained 0.39%. A starting capital of $100,000 at inception on 9/29/2014 would have grown to $213,588 which includes $524 cash and excludes $1,870 spent on fees and slippage. |
|
|
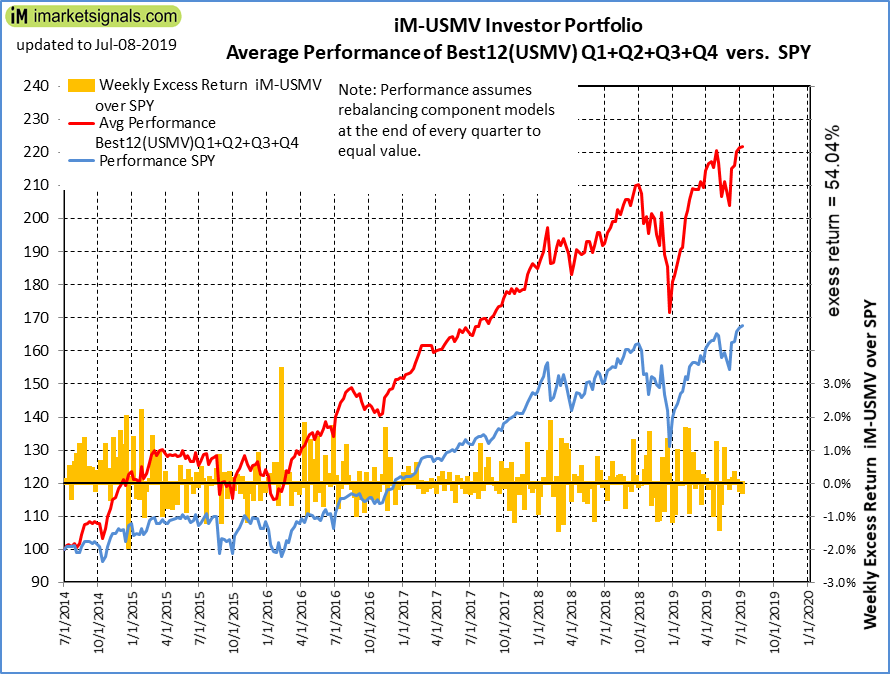
Average Performance of iM-Best12(USMV)Q1+Q2+Q3+Q4-Investor resulted in an excess return of 54.44% over SPY. (see iM-USMV Investor Portfolio) |
|
|
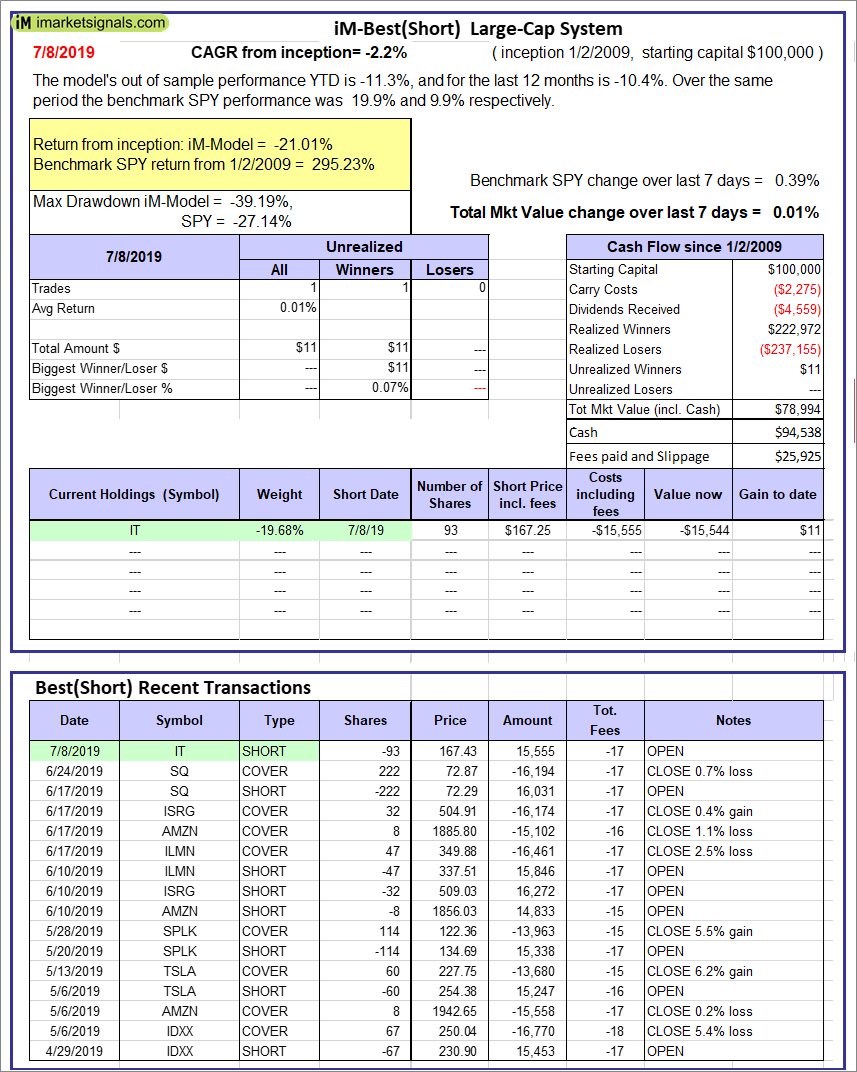
iM-Best(Short): The model’s out of sample performance YTD is -11.3%, and for the last 12 months is -10.4%. Over the same period the benchmark SPY performance was 19.9% and 9.9% respectively. Over the previous week the market value of iM-Best(Short) gained 0.01% at a time when SPY gained 0.39%. Over the period 1/2/2009 to 7/8/2019 the starting capital of $100,000 would have grown to $78,994 which includes $94,538 cash and excludes $25,925 spent on fees and slippage. |
|
|
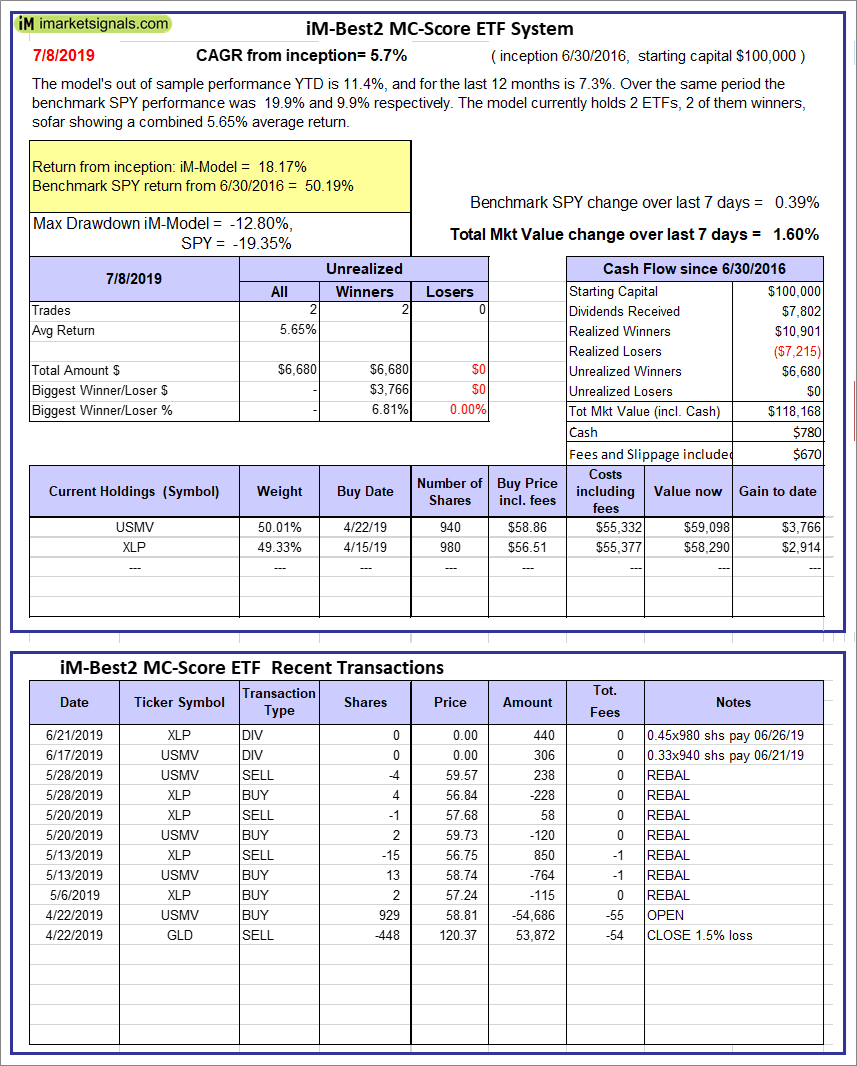
iM-Best2 MC-Score ETF System: The model’s out of sample performance YTD is 11.4%, and for the last 12 months is 7.3%. Over the same period the benchmark SPY performance was 19.9% and 9.9% respectively. Over the previous week the market value of the iM-Best2 MC-Score ETF System gained 1.60% at a time when SPY gained 0.39%. A starting capital of $100,000 at inception on 6/30/2016 would have grown to $118,168 which includes $780 cash and excludes $670 spent on fees and slippage. |
|
|
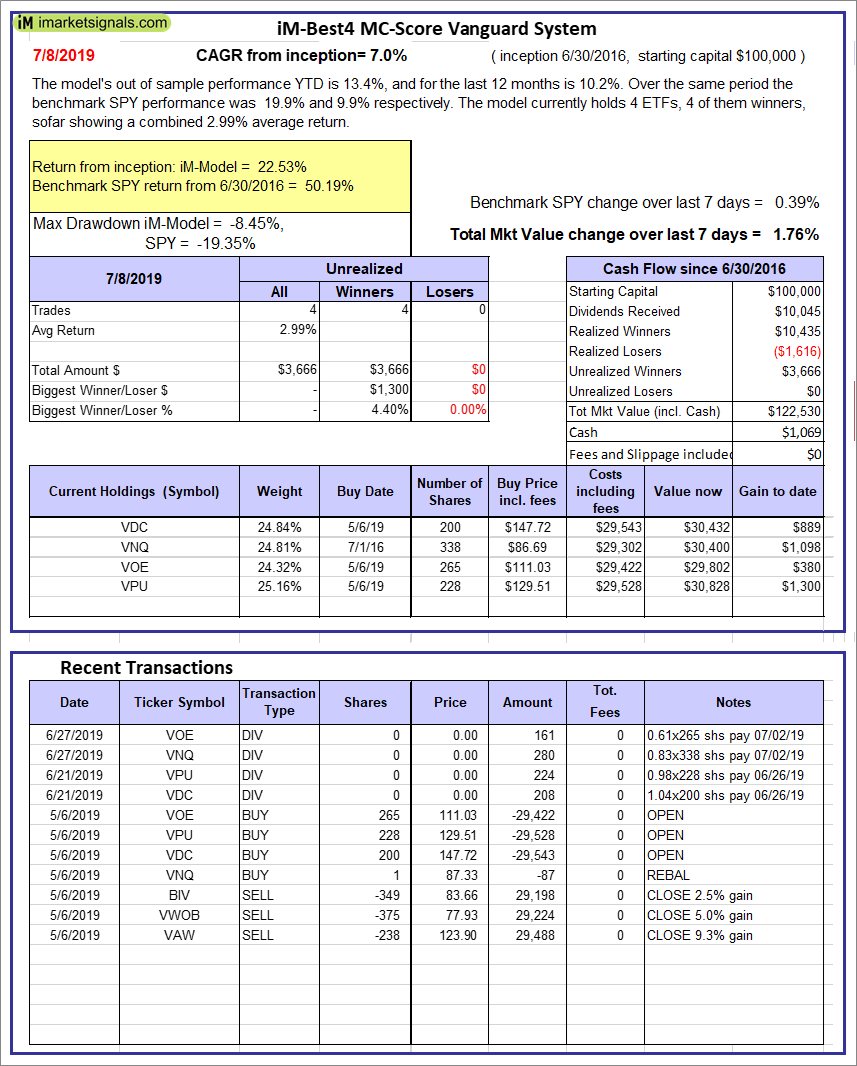
iM-Best4 MC-Score Vanguard System: The model’s out of sample performance YTD is 13.4%, and for the last 12 months is 10.2%. Over the same period the benchmark SPY performance was 19.9% and 9.9% respectively. Over the previous week the market value of the iM-Best4 MC-Score Vanguard System gained 1.76% at a time when SPY gained 0.39%. A starting capital of $100,000 at inception on 6/30/2016 would have grown to $122,530 which includes $1,069 cash and excludes $00 spent on fees and slippage. |
|
|
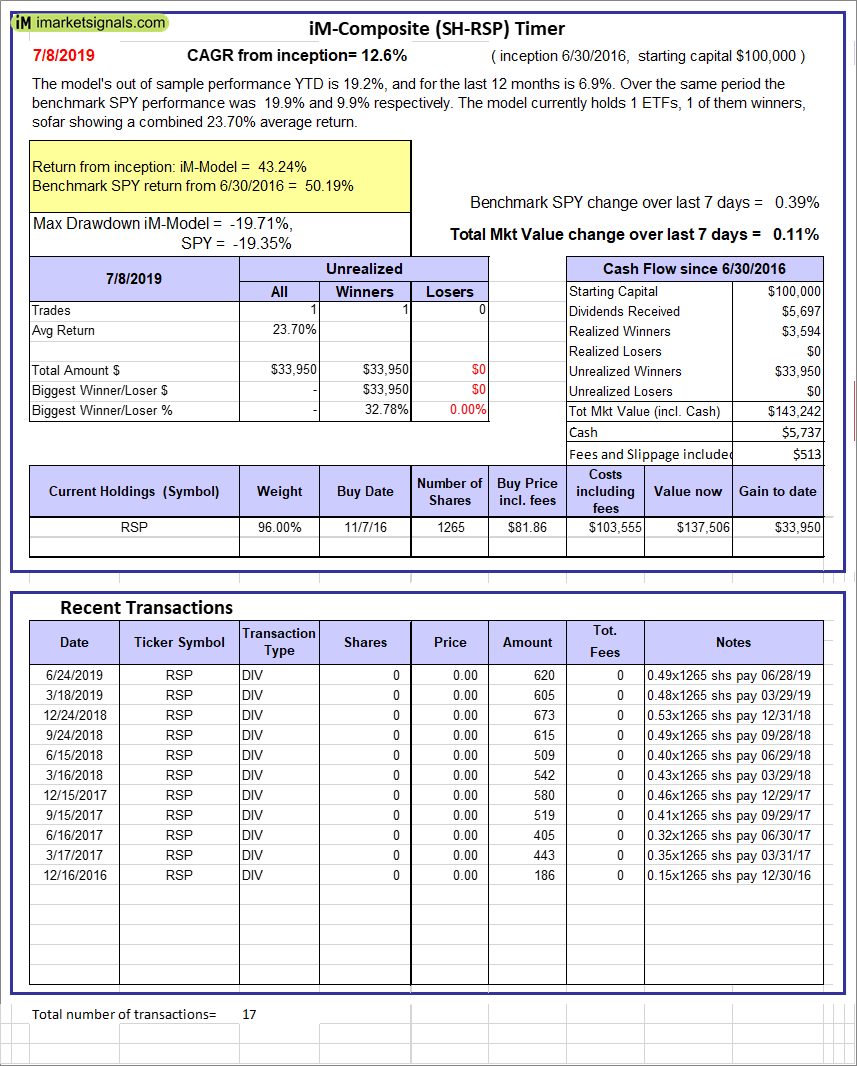
iM-Composite (SH-RSP) Timer: The model’s out of sample performance YTD is 19.2%, and for the last 12 months is 6.9%. Over the same period the benchmark SPY performance was 19.9% and 9.9% respectively. Over the previous week the market value of the iM-Composite (SH-RSP) Timer gained 0.11% at a time when SPY gained 0.39%. A starting capital of $100,000 at inception on 6/30/2016 would have grown to $143,242 which includes $5,737 cash and excludes $513 spent on fees and slippage. |
|
|
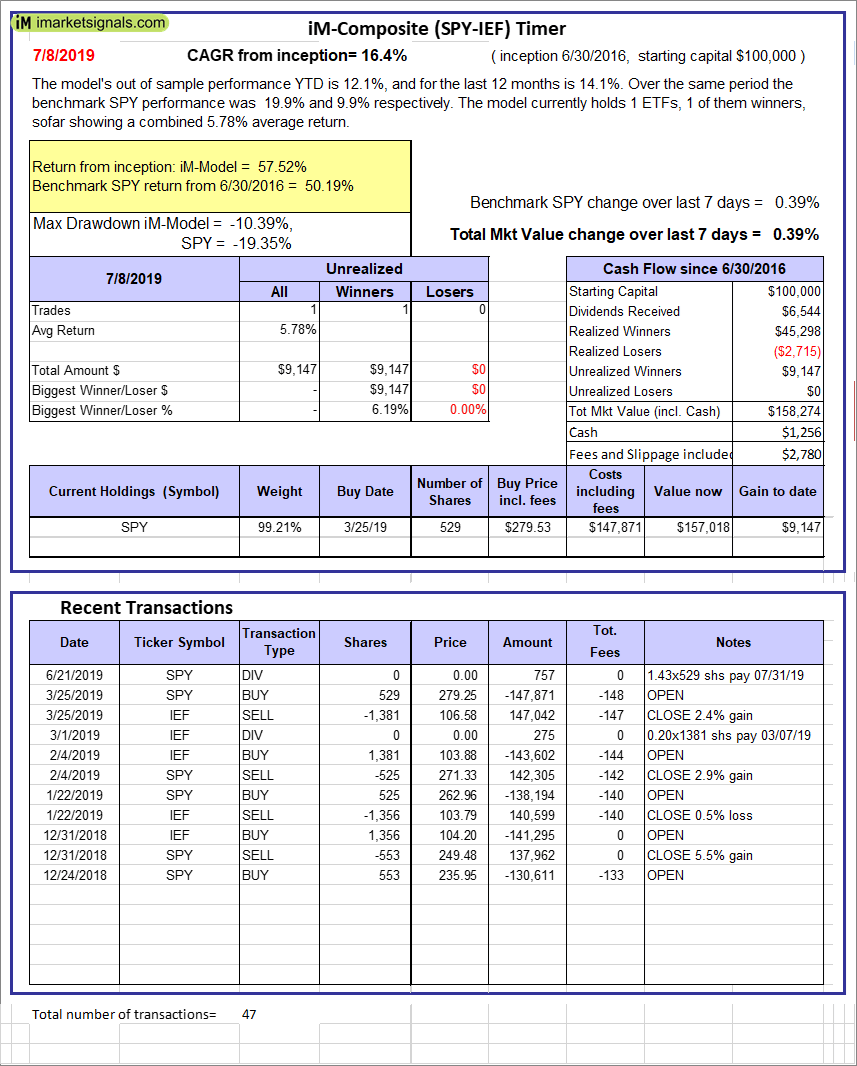
iM-Composite (SPY-IEF) Timer: The model’s out of sample performance YTD is 12.1%, and for the last 12 months is 14.1%. Over the same period the benchmark SPY performance was 19.9% and 9.9% respectively. Over the previous week the market value of the iM-Composite (SPY-IEF) Timer gained 0.39% at a time when SPY gained 0.39%. A starting capital of $100,000 at inception on 6/30/2016 would have grown to $158,274 which includes $1,256 cash and excludes $2,780 spent on fees and slippage. |
|
|
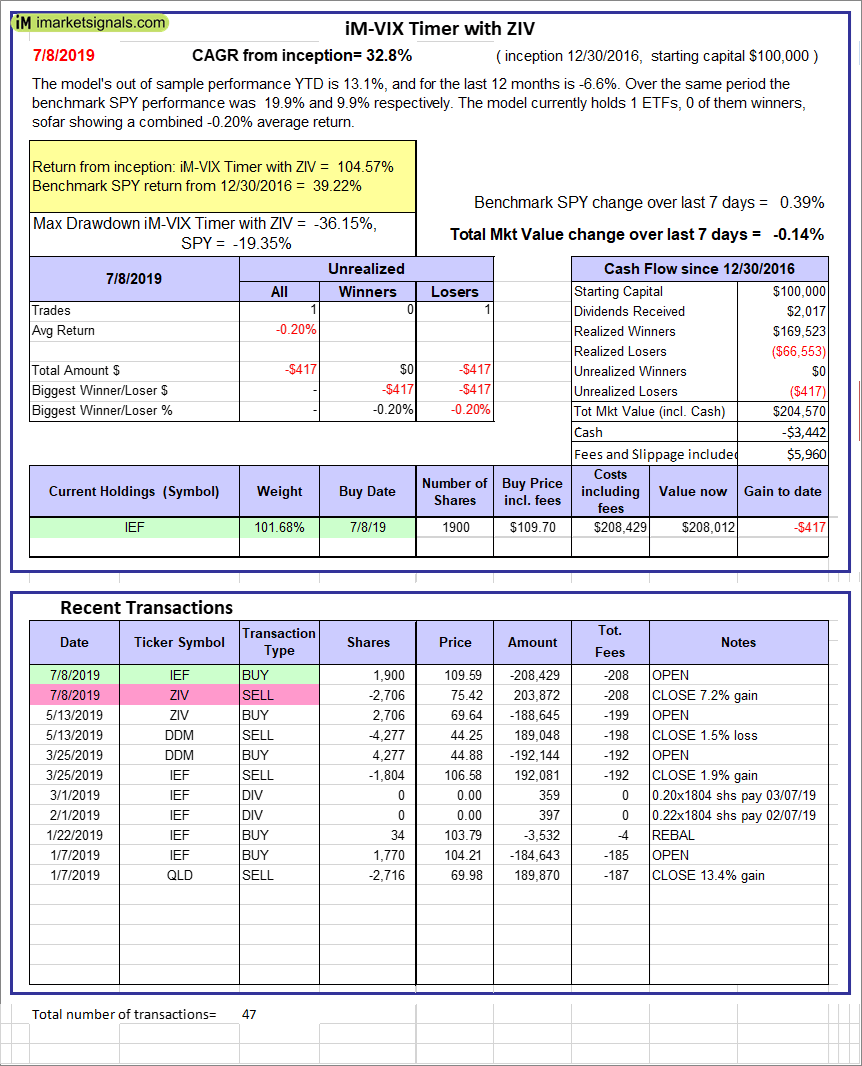
iM-VIX Timer with ZIV: The model’s out of sample performance YTD is 13.1%, and for the last 12 months is -6.6%. Over the same period the benchmark SPY performance was 19.9% and 9.9% respectively. Over the previous week the market value of the iM-VIX Timer with ZIV gained -0.14% at a time when SPY gained 0.39%. A starting capital of $100,000 at inception on 6/30/2016 would have grown to $204,570 which includes -$3,442 cash and excludes $5,960 spent on fees and slippage. |
|
|
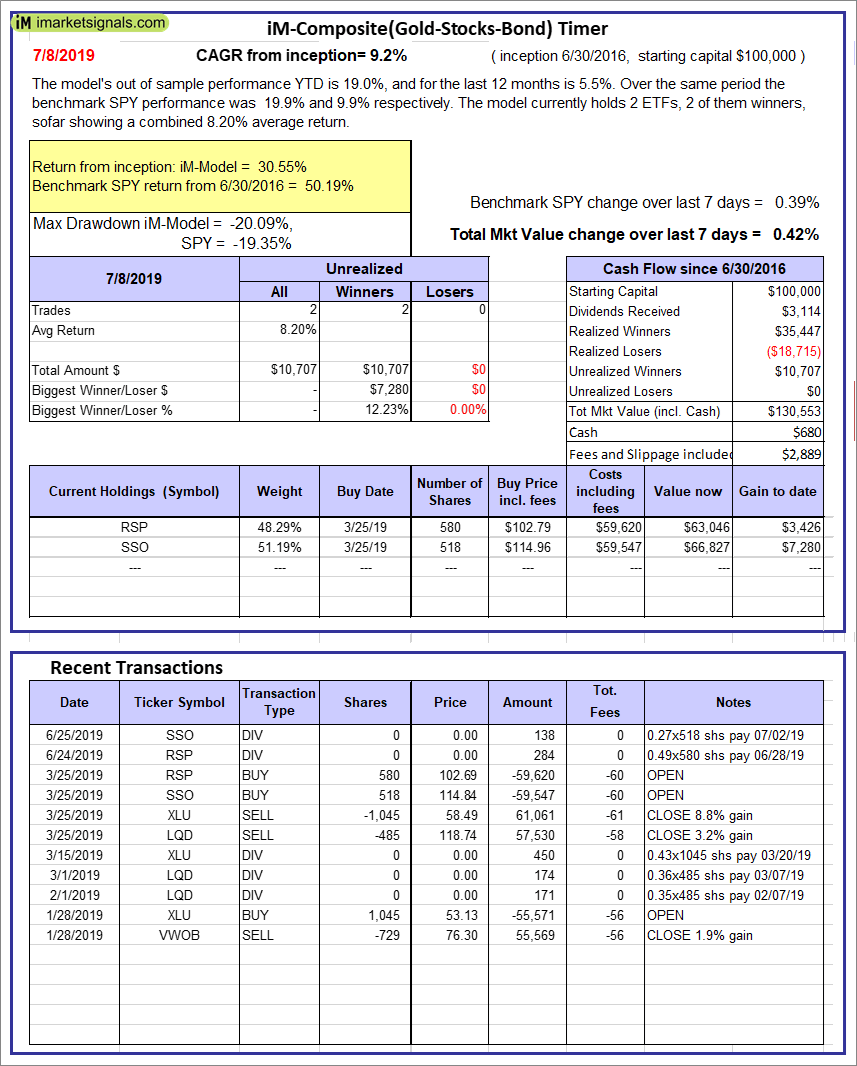
iM-Composite(Gold-Stocks-Bond) Timer: The model’s out of sample performance YTD is 19.0%, and for the last 12 months is 5.5%. Over the same period the benchmark SPY performance was 19.9% and 9.9% respectively. Over the previous week the market value of the iM-Composite(Gold-Stocks-Bond) Timer gained 0.42% at a time when SPY gained 0.39%. A starting capital of $100,000 at inception on 6/30/2016 would have grown to $130,553 which includes $680 cash and excludes $2,889 spent on fees and slippage. |
|
|
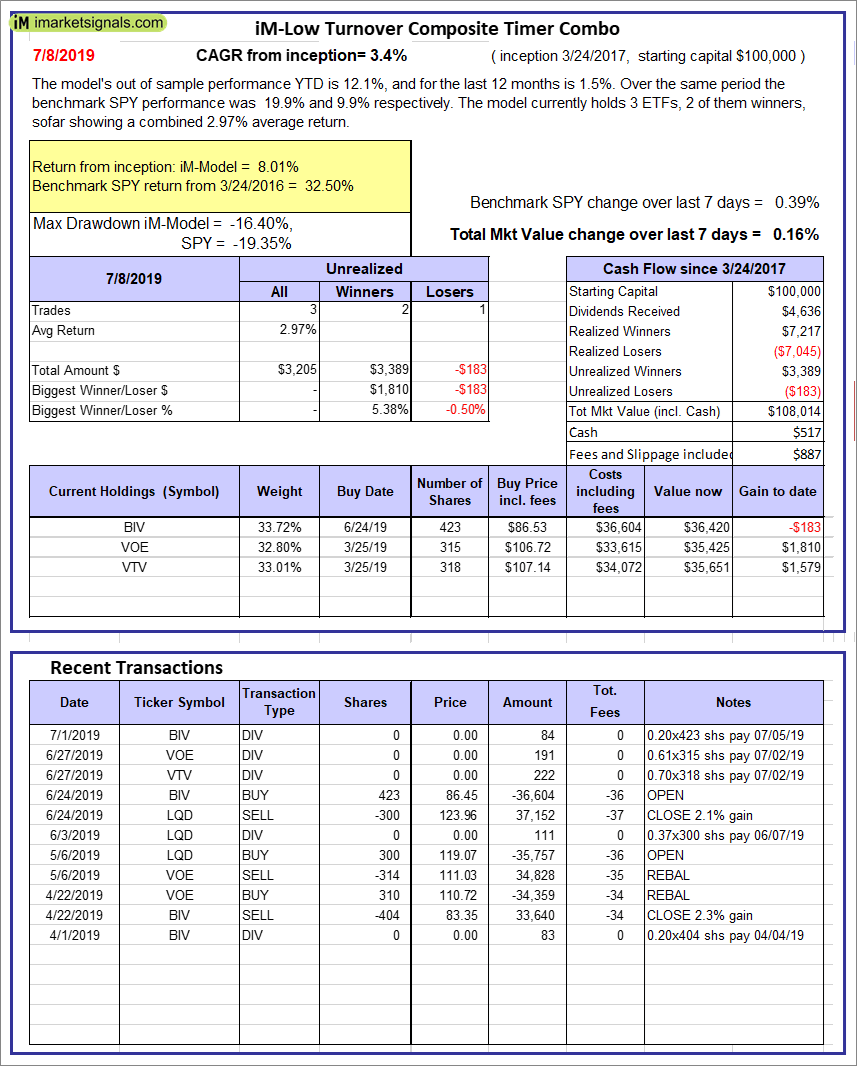
iM-Low Turnover Composite Timer Combo: The model’s out of sample performance YTD is 12.1%, and for the last 12 months is 1.5%. Over the same period the benchmark SPY performance was 19.9% and 9.9% respectively. Over the previous week the market value of the iM-Low Turnover Composite Timer Combo gained 0.16% at a time when SPY gained 0.39%. A starting capital of $100,000 at inception on 3/24/27 would have grown to $108,014 which includes $517 cash and excludes $887 spent on fees and slippage. |
|
|
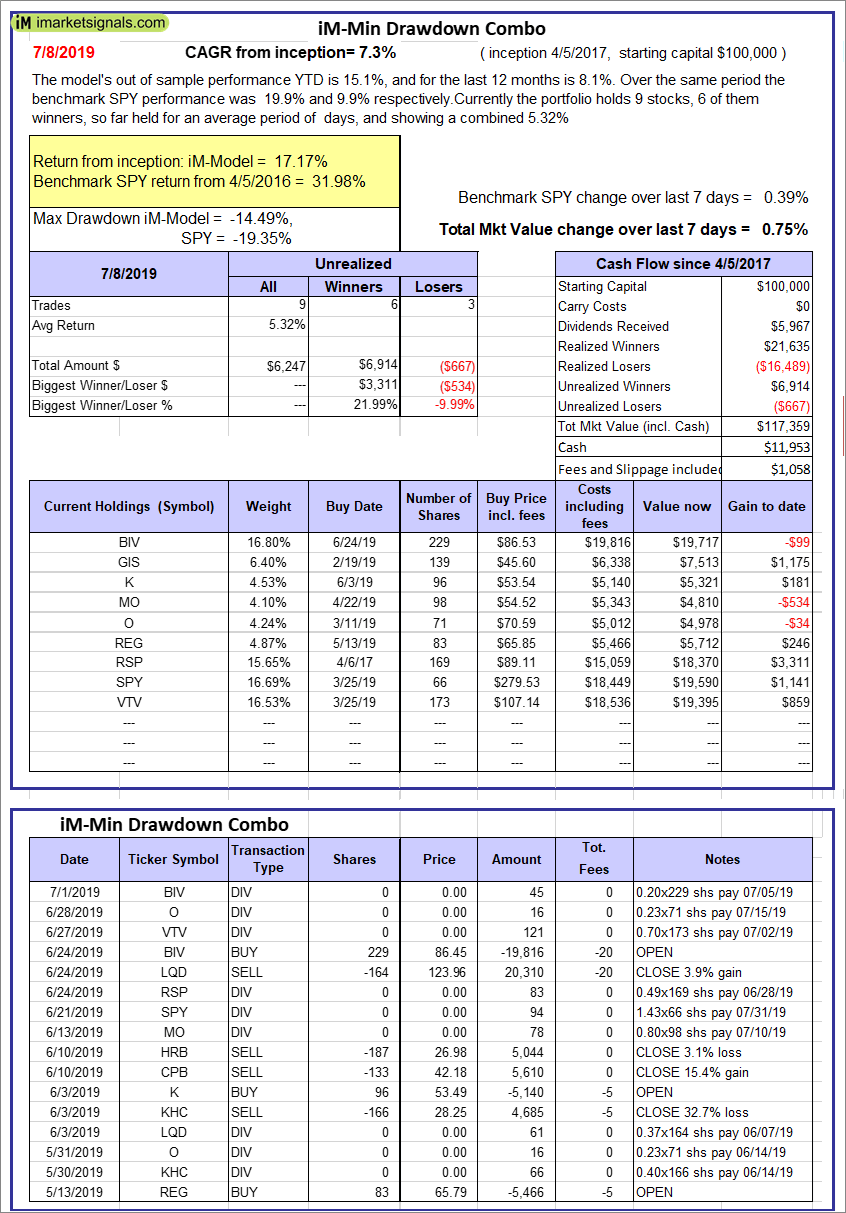
iM-Min Drawdown Combo: The model’s out of sample performance YTD is 15.1%, and for the last 12 months is 8.1%. Over the same period the benchmark SPY performance was 19.9% and 9.9% respectively. Over the previous week the market value of the iM-Min Drawdown Combo gained 0.75% at a time when SPY gained 0.39%. A starting capital of $100,000 at inception on 4/5/2017 would have grown to $117,359 which includes $11,953 cash and excludes $1,058 spent on fees and slippage. |
|
|
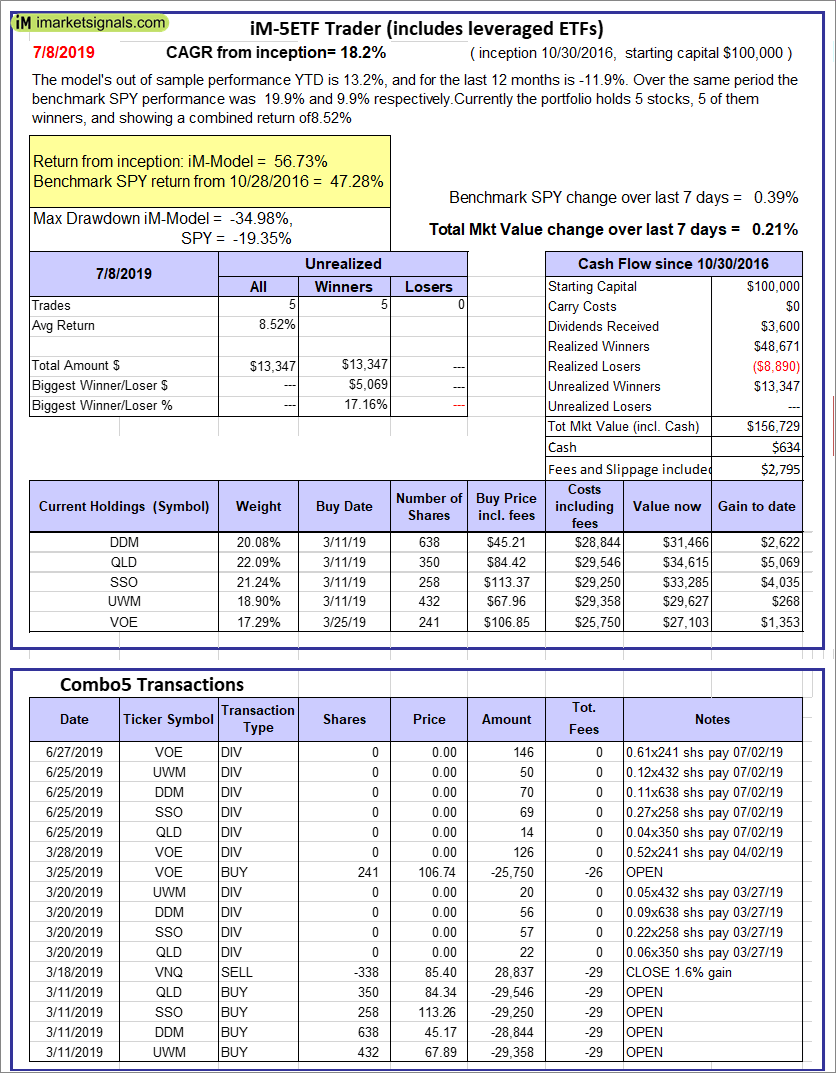
iM-5ETF Trader (includes leveraged ETFs): The model’s out of sample performance YTD is 13.2%, and for the last 12 months is -11.9%. Over the same period the benchmark SPY performance was 19.9% and 9.9% respectively. Over the previous week the market value of the iM-5ETF Trader (includes leveraged ETFs) gained 0.21% at a time when SPY gained 0.39%. A starting capital of $100,000 at inception on 10/30/2016 would have grown to $156,729 which includes $634 cash and excludes $2,795 spent on fees and slippage. |
|
|
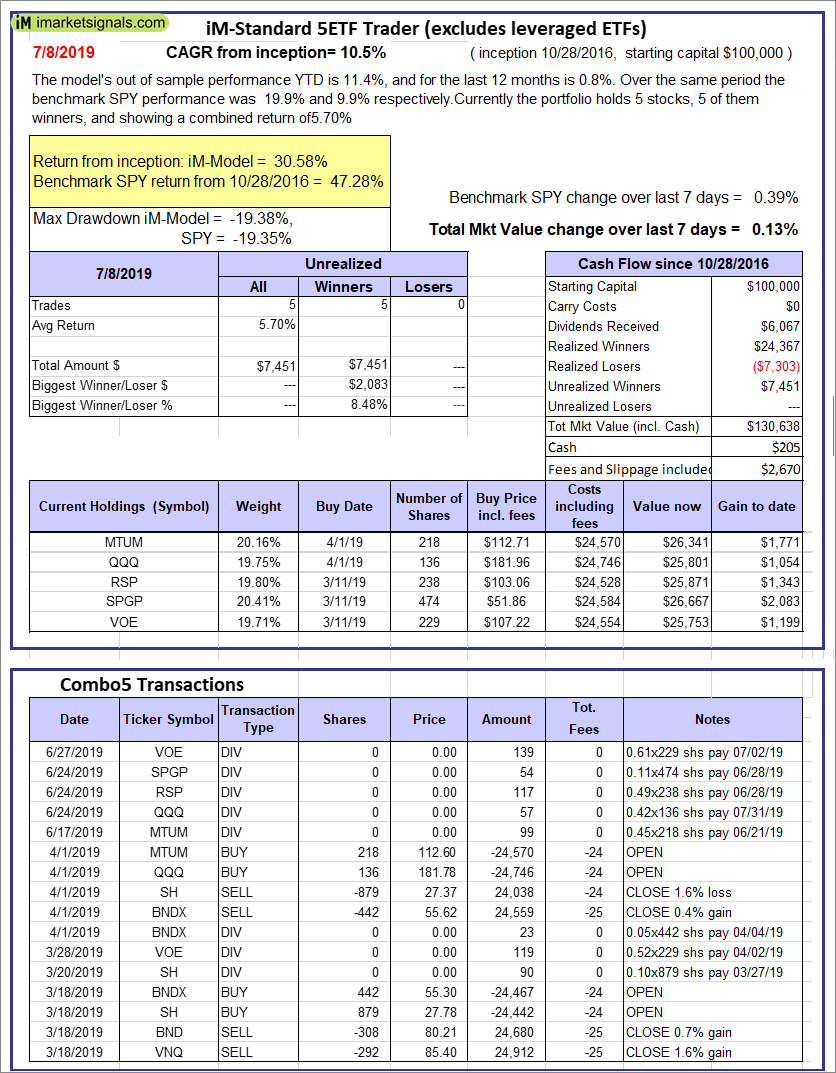
iM-Standard 5ETF Trader (excludes leveraged ETFs): The model’s out of sample performance YTD is 11.4%, and for the last 12 months is 0.8%. Over the same period the benchmark SPY performance was 19.9% and 9.9% respectively. Over the previous week the market value of the iM-Standard 5ETF Trader (excludes leveraged ETFs) gained 0.13% at a time when SPY gained 0.39%. A starting capital of $100,000 at inception on 10/30/2016 would have grown to $130,638 which includes $205 cash and excludes $2,670 spent on fees and slippage. |


Leave a Reply
You must be logged in to post a comment.