  |
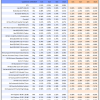
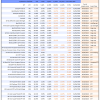
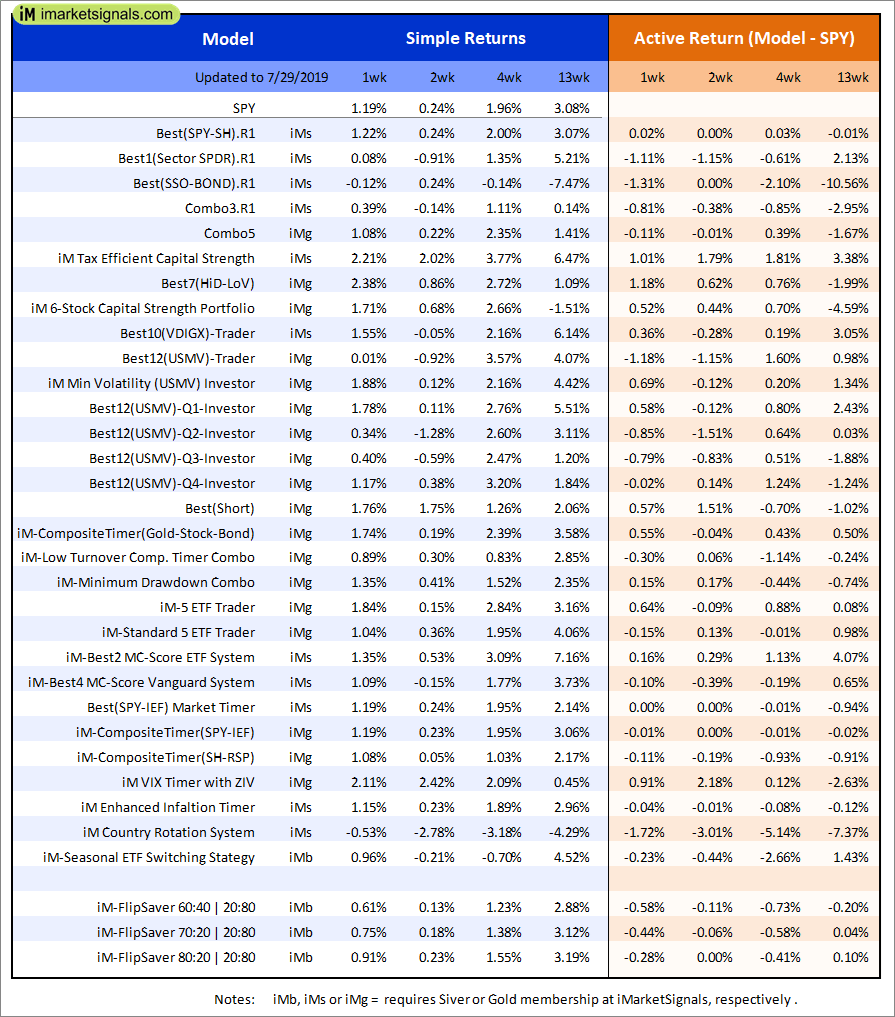
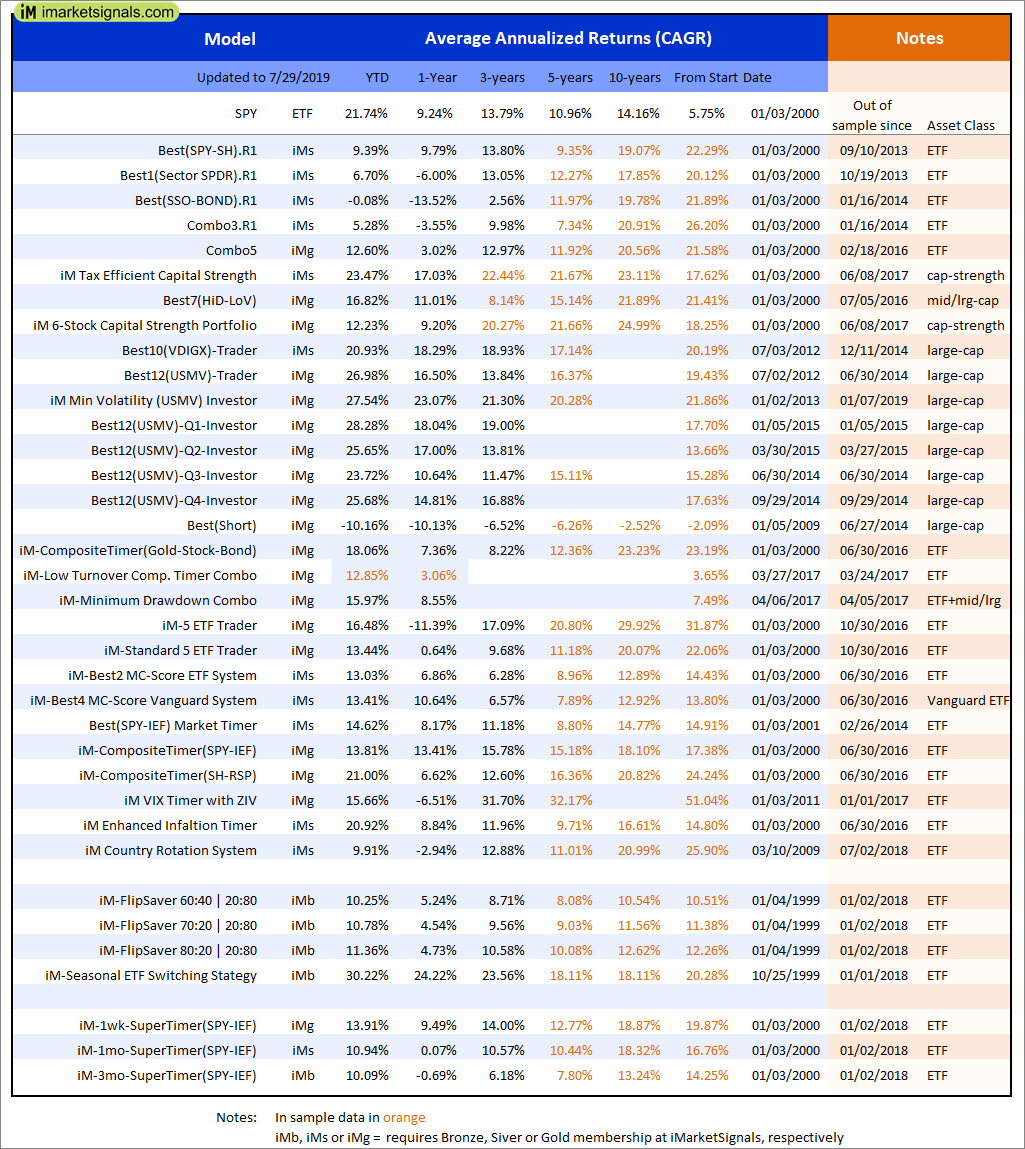
Out of sample performance summary of our models for the past 1, 2, 4 and 13 week periods. The active active return indicates how the models over- or underperformed the benchmark ETF SPY. Also the YTD, and the 1-, 3-, 5- and 10-year annualized returns are shown in the second table |
|
|
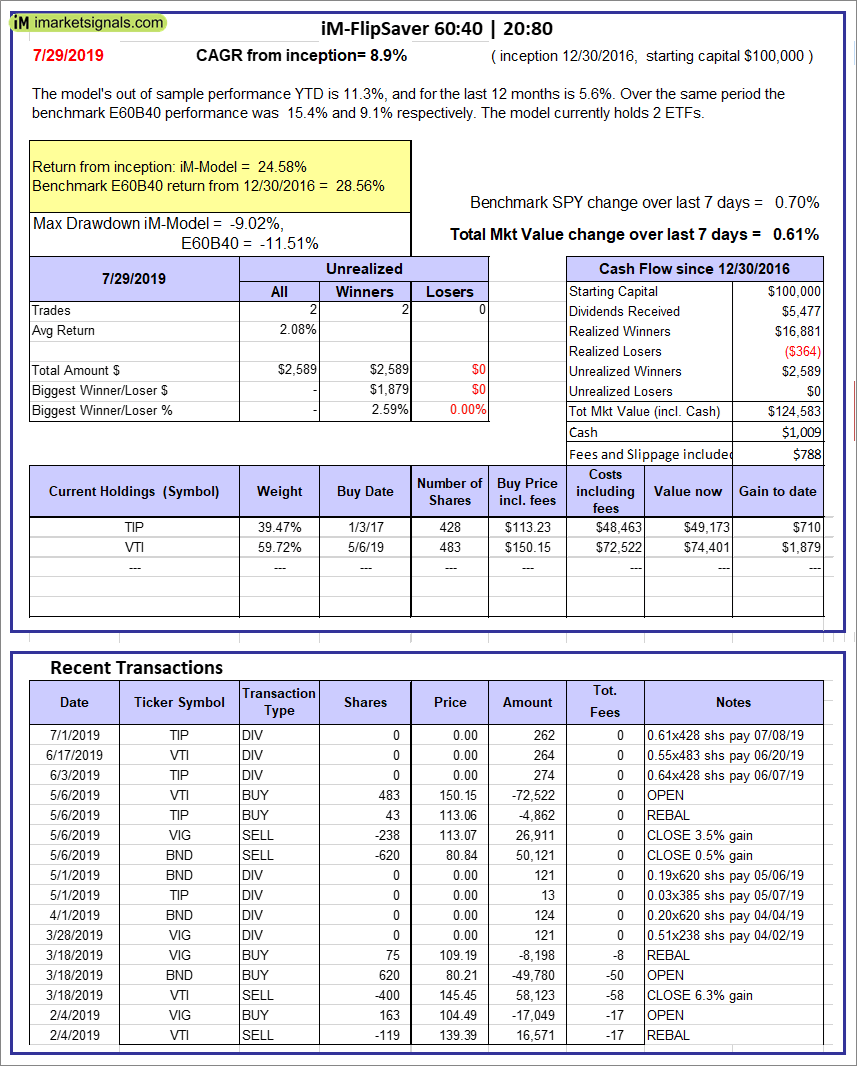
iM-FlipSaver 60:40 | 20:80 – 2017: The model’s out of sample performance YTD is 11.3%, and for the last 12 months is 5.6%. Over the same period the benchmark E60B40 performance was 15.4% and 9.1% respectively. Over the previous week the market value of iM-FlipSaver 80:20 | 20:80 gained 0.61% at a time when SPY gained 0.70%. A starting capital of $100,000 at inception on 7/16/2015 would have grown to $124,583 which includes $1,009 cash and excludes $788 spent on fees and slippage. |
|
|
iM-FlipSaver 70:30 | 20:80 – 2017: The model’s out of sample performance YTD is 11.9%, and for the last 12 months is 5.7%. Over the same period the benchmark E60B40 performance was 15.4% and 9.1% respectively. Over the previous week the market value of iM-FlipSaver 70:30 | 20:80 gained 0.77% at a time when SPY gained 0.70%. A starting capital of $100,000 at inception on 7/15/2015 would have grown to $127,470 which includes $941 cash and excludes $909 spent on fees and slippage. |
|
|
iM-FlipSaver 80:20 | 20:80 – 2017: The model’s out of sample performance YTD is 12.4%, and for the last 12 months is 5.7%. Over the same period the benchmark E60B40 performance was 15.4% and 9.1% respectively. Over the previous week the market value of iM-FlipSaver 80:20 | 20:80 gained 0.92% at a time when SPY gained 0.70%. A starting capital of $100,000 at inception on 1/2/2017 would have grown to $130,333 which includes $965 cash and excludes $1,024 spent on fees and slippage. |
|
|
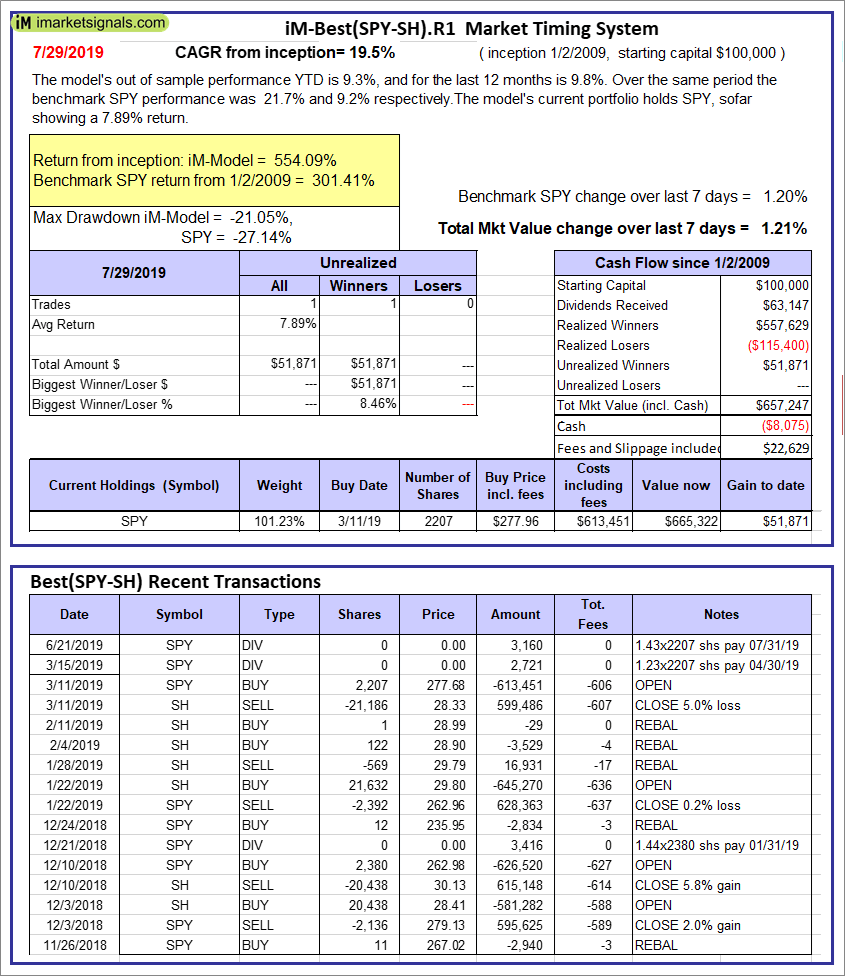
iM-Best(SPY-SH).R1: The model’s out of sample performance YTD is 9.3%, and for the last 12 months is 9.8%. Over the same period the benchmark SPY performance was 21.7% and 9.2% respectively. Over the previous week the market value of Best(SPY-SH) gained 1.21% at a time when SPY gained 1.20%. A starting capital of $100,000 at inception on 1/2/2009 would have grown to $657,247 which includes -$8,075 cash and excludes $22,629 spent on fees and slippage. |
|
|
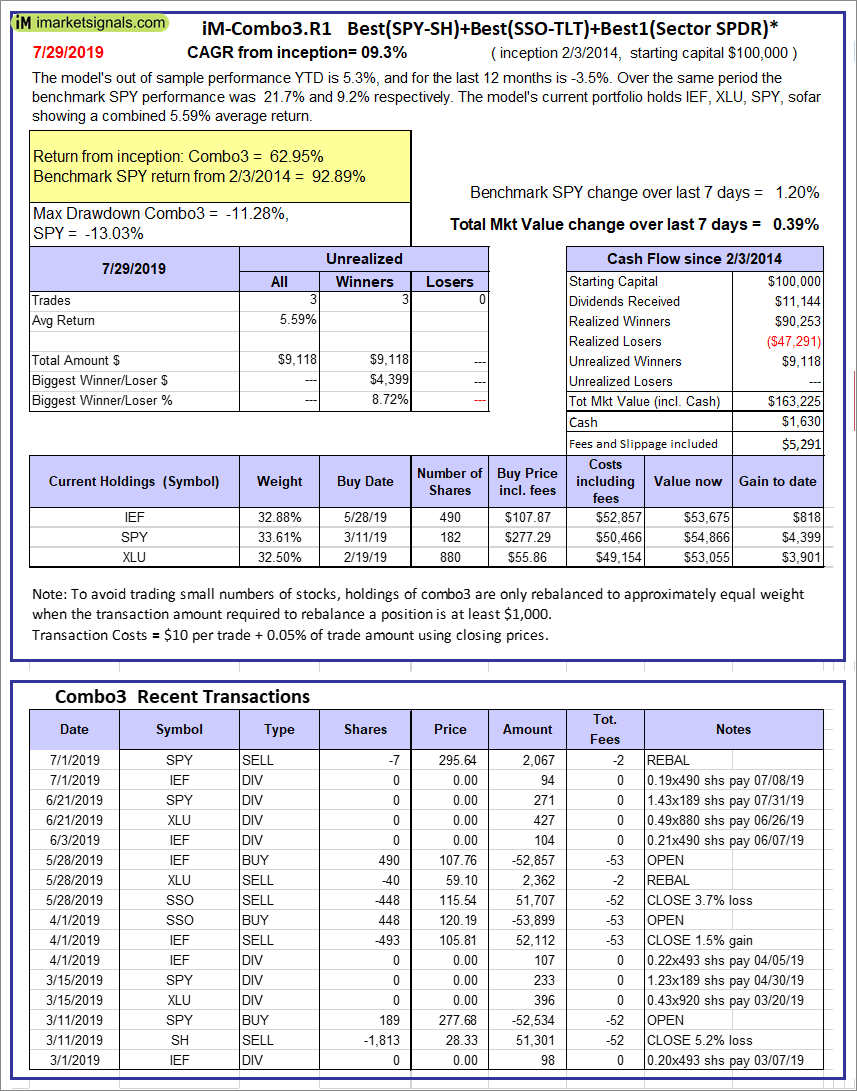
iM-Combo3.R1: The model’s out of sample performance YTD is 5.3%, and for the last 12 months is -3.5%. Over the same period the benchmark SPY performance was 21.7% and 9.2% respectively. Over the previous week the market value of iM-Combo3.R1 gained 0.39% at a time when SPY gained 1.20%. A starting capital of $100,000 at inception on 2/3/2014 would have grown to $163,225 which includes $1,630 cash and excludes $5,291 spent on fees and slippage. |
|
|
iM-Combo5: The model’s out of sample performance YTD is 12.4%, and for the last 12 months is 2.8%. Over the same period the benchmark SPY performance was 21.7% and 9.2% respectively. Over the previous week the market value of iM-Combo5 gained 0.89% at a time when SPY gained 1.20%. A starting capital of $100,000 at inception on 2/22/2016 would have grown to $143,040 which includes $1,803 cash and excludes $0 spent on fees and slippage. |
|
|
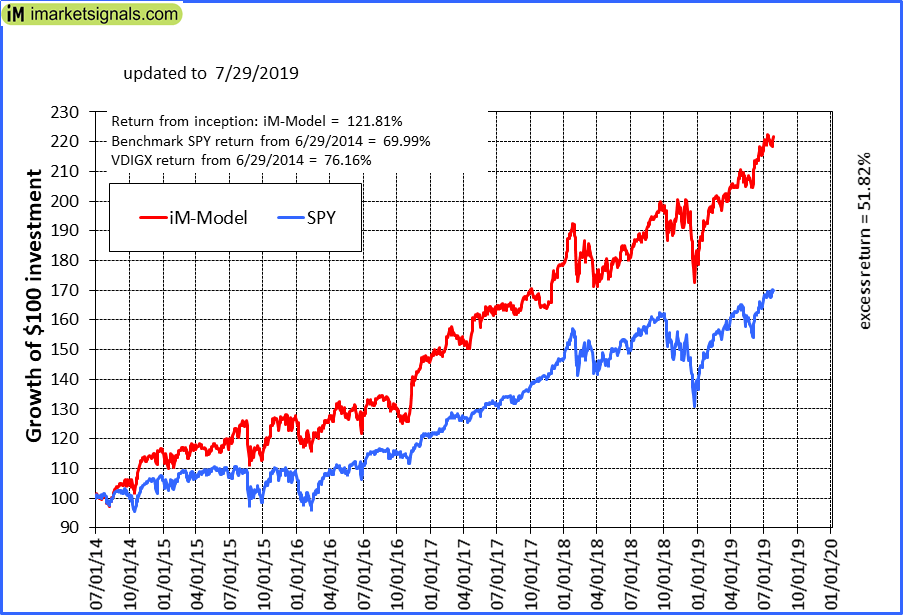
iM-Best10(VDIGX)-Trader: The model’s out of sample performance YTD is 20.9%, and for the last 12 months is 18.1%. Over the same period the benchmark SPY performance was 21.7% and 9.2% respectively. Since inception, on 7/1/2014, the model gained 121.81% while the benchmark SPY gained 69.99% and VDIGX gained 76.16% over the same period. Over the previous week the market value of iM-Best10(VDIGX) gained 1.43% at a time when SPY gained 1.20%. A starting capital of $100,000 at inception on 7/1/2014 would have grown to $221,808 which includes $636 cash and excludes $2,602 spent on fees and slippage. |
|
|
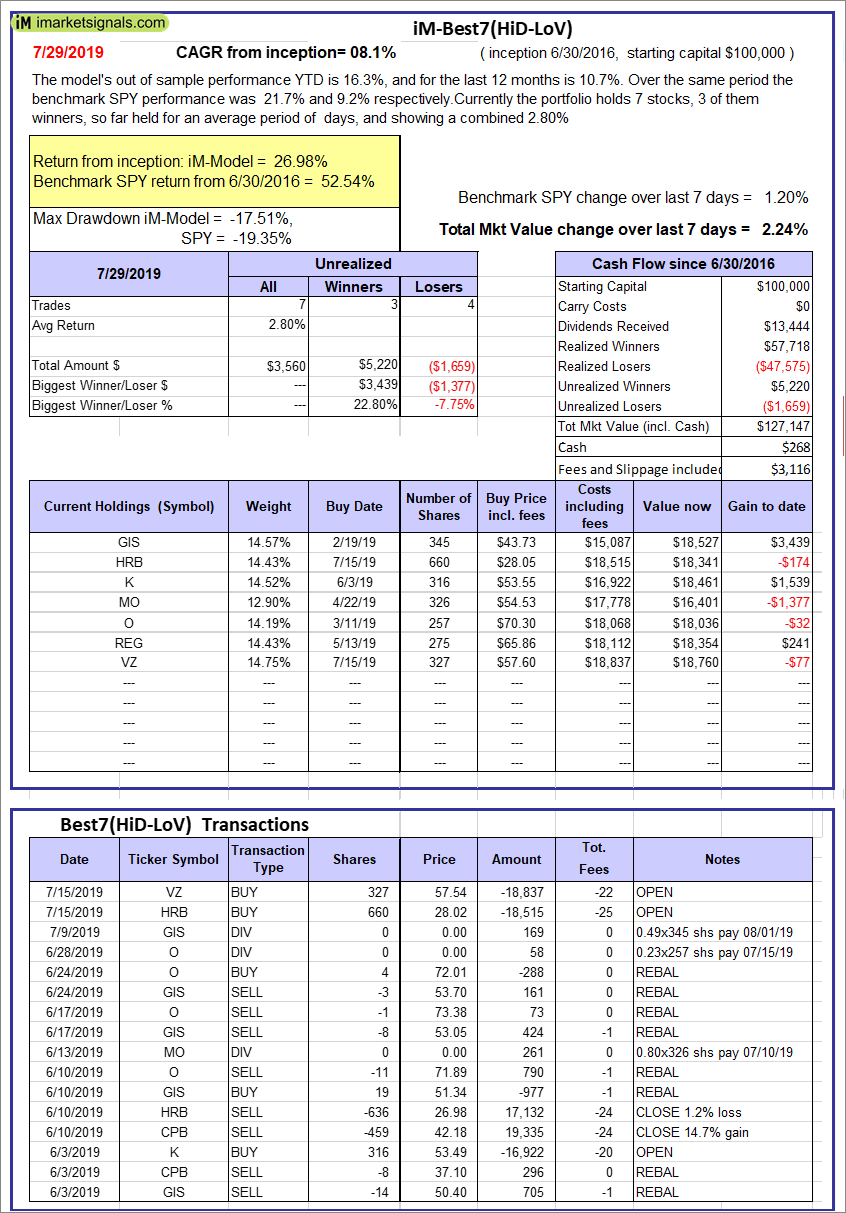
iM-Best7(HiD-LoV): The model’s out of sample performance YTD is 16.3%, and for the last 12 months is 10.7%. Over the same period the benchmark SPY performance was 21.7% and 9.2% respectively. Over the previous week the market value of iM-Best7(HiD-LoV) gained 2.24% at a time when SPY gained 1.20%. A starting capital of $100,000 at inception on 6/30/2016 would have grown to $127,147 which includes $268 cash and excludes $3,116 spent on fees and slippage. |
|
|
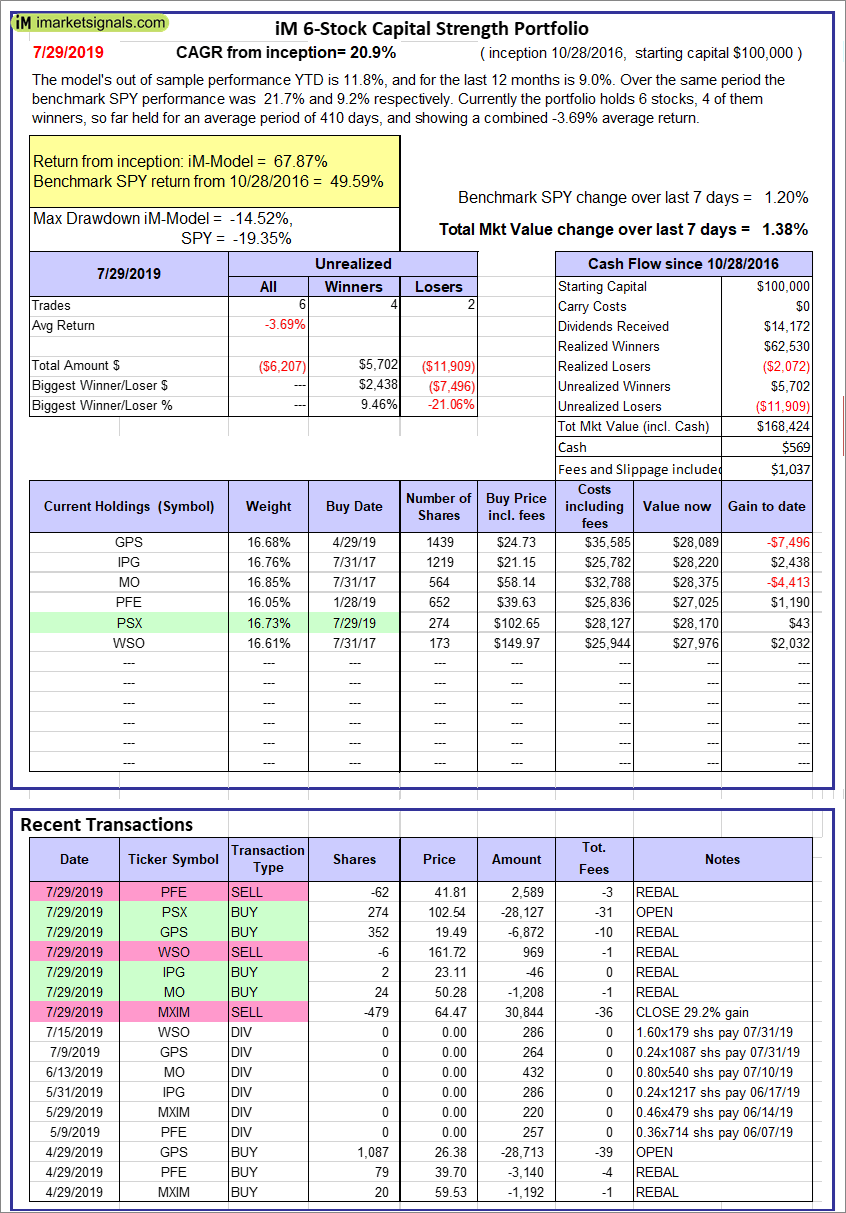
iM 6-Stock Capital Strength Portfolio: The model’s out of sample performance YTD is 11.8%, and for the last 12 months is 9.0%. Over the same period the benchmark SPY performance was 21.7% and 9.2% respectively. Over the previous week the market value of the iM 6-Stock Capital Strength Portfolio gained 1.38% at a time when SPY gained 1.20%. A starting capital of $100,000 at inception on 10/28/2016 would have grown to $168,424 which includes $569 cash and excludes $1,037 spent on fees and slippage. |
|
|
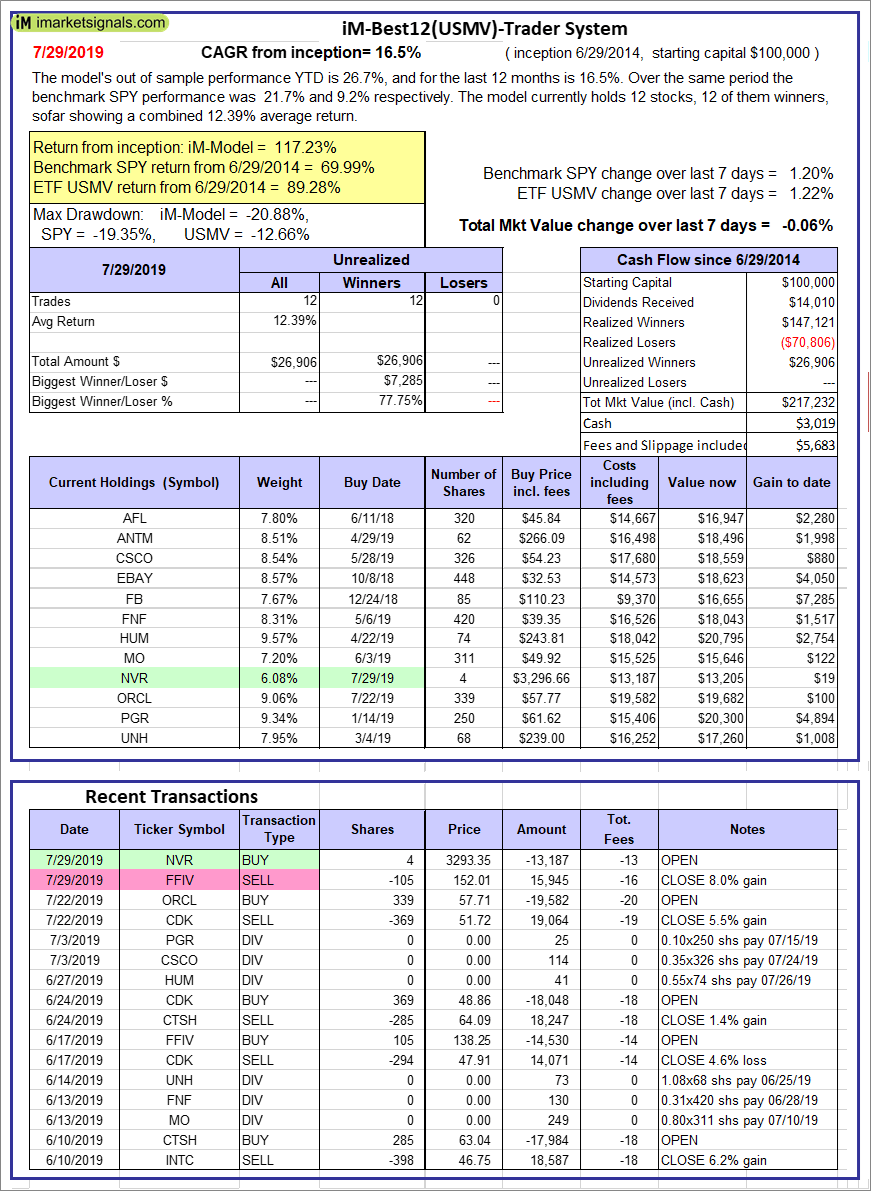
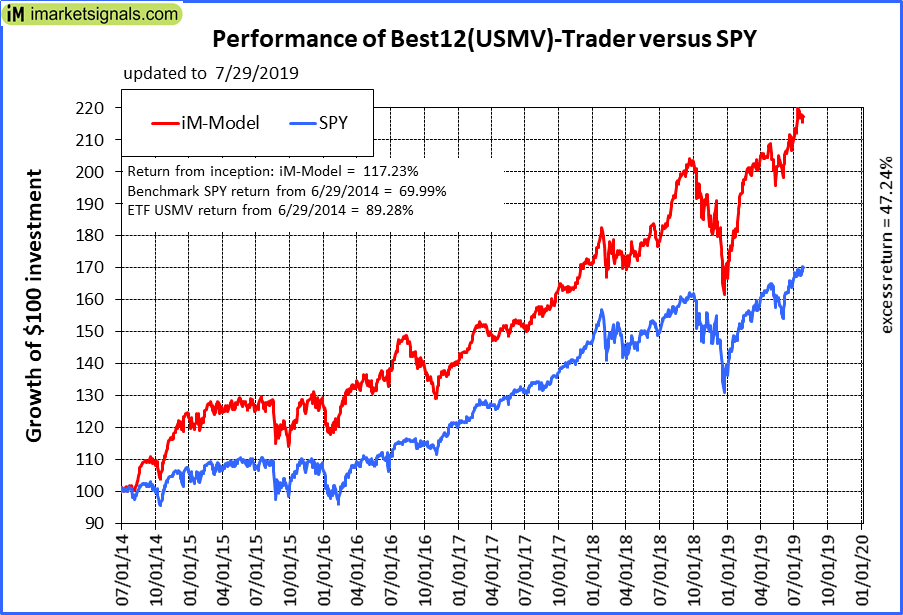
iM-Best12(USMV)-Trader: The model’s out of sample performance YTD is 26.7%, and for the last 12 months is 16.5%. Over the same period the benchmark SPY performance was 21.7% and 9.2% respectively. Since inception, on 6/30/2014, the model gained 117.23% while the benchmark SPY gained 69.99% and the ETF USMV gained 89.28% over the same period. Over the previous week the market value of iM-Best12(USMV)-Trader gained -0.06% at a time when SPY gained 1.20%. A starting capital of $100,000 at inception on 6/30/2014 would have grown to $217,232 which includes $3,019 cash and excludes $5,683 spent on fees and slippage. |
|
|
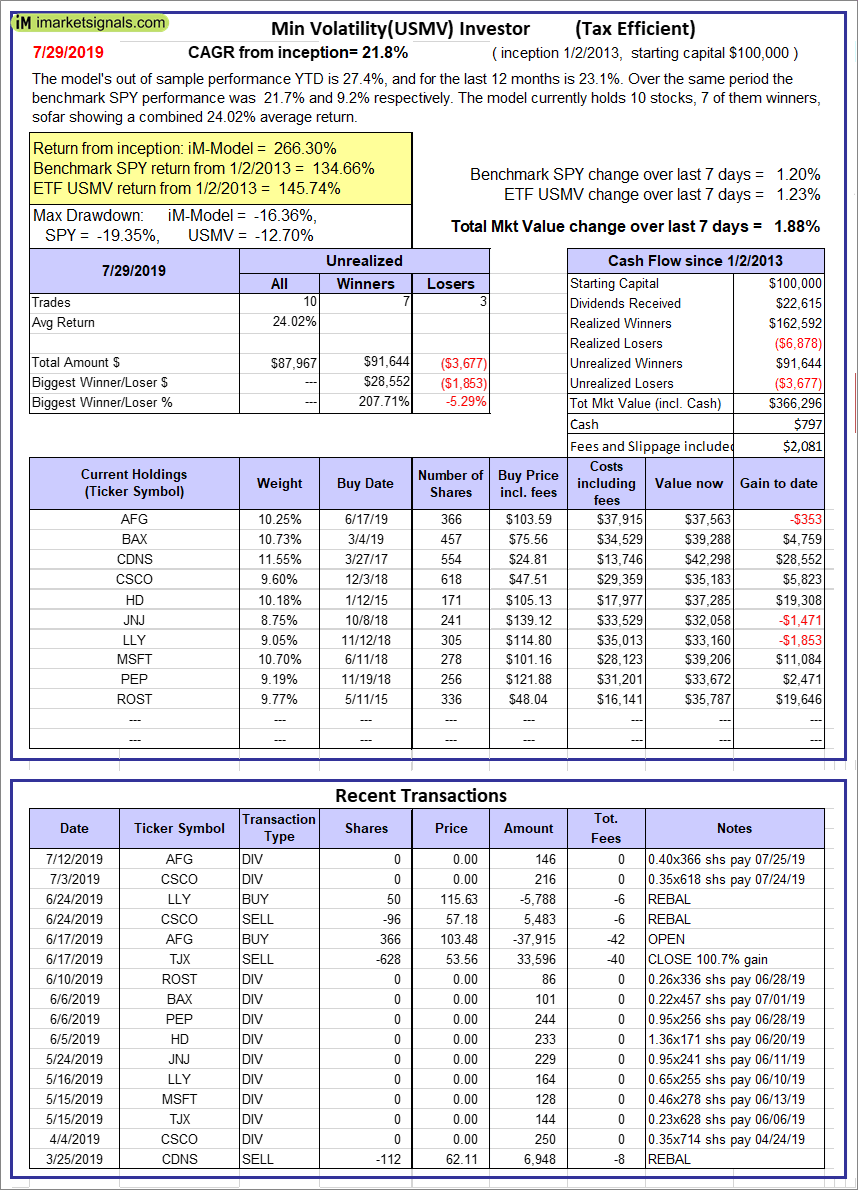
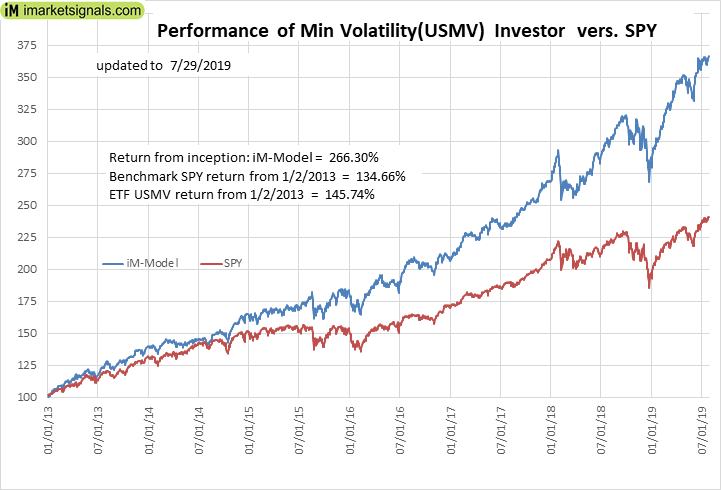
iM Min Volatility (USMV) Investor: The model’s out of sample performance YTD is 26.2%, and for the last 12 months is 24.1%. Over the same period the benchmark SPY performance was 19.9% and 9.9% respectively. Since inception, on 1/3/2013, the model gained 262.93% while the benchmark SPY gained 131.05% and the ETF USMV gained 142.65% over the same period. Over the previous week the market value of iM Min Volatility (USMV) Investor gained 1.22% at a time when SPY gained 0.39%. A starting capital of $100,000 at inception on 1/3/2013 would have grown to $362,932 which includes $651 cash and excludes $2,081 spent on fees and slippage. |
|
|
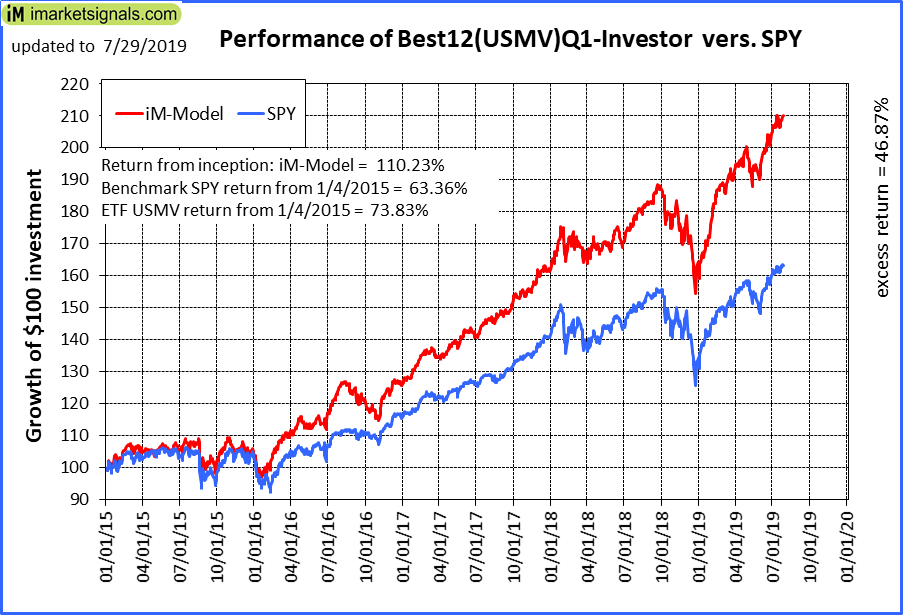
iM-Best12(USMV)Q1-Investor: To be discontinued. The model’s out of sample performance YTD is 27.9%, and for the last 12 months is 18.0%. Over the same period the benchmark SPY performance was 21.7% and 9.2% respectively. Since inception, on 1/5/2015, the model gained 110.23% while the benchmark SPY gained 63.36% and the ETF USMV gained 73.83% over the same period. Over the previous week the market value of iM-Best12(USMV)Q1 gained 1.77% at a time when SPY gained 1.20%. A starting capital of $100,000 at inception on 1/5/2015 would have grown to $210,227 which includes $764 cash and excludes $1,522 spent on fees and slippage. |
|
|
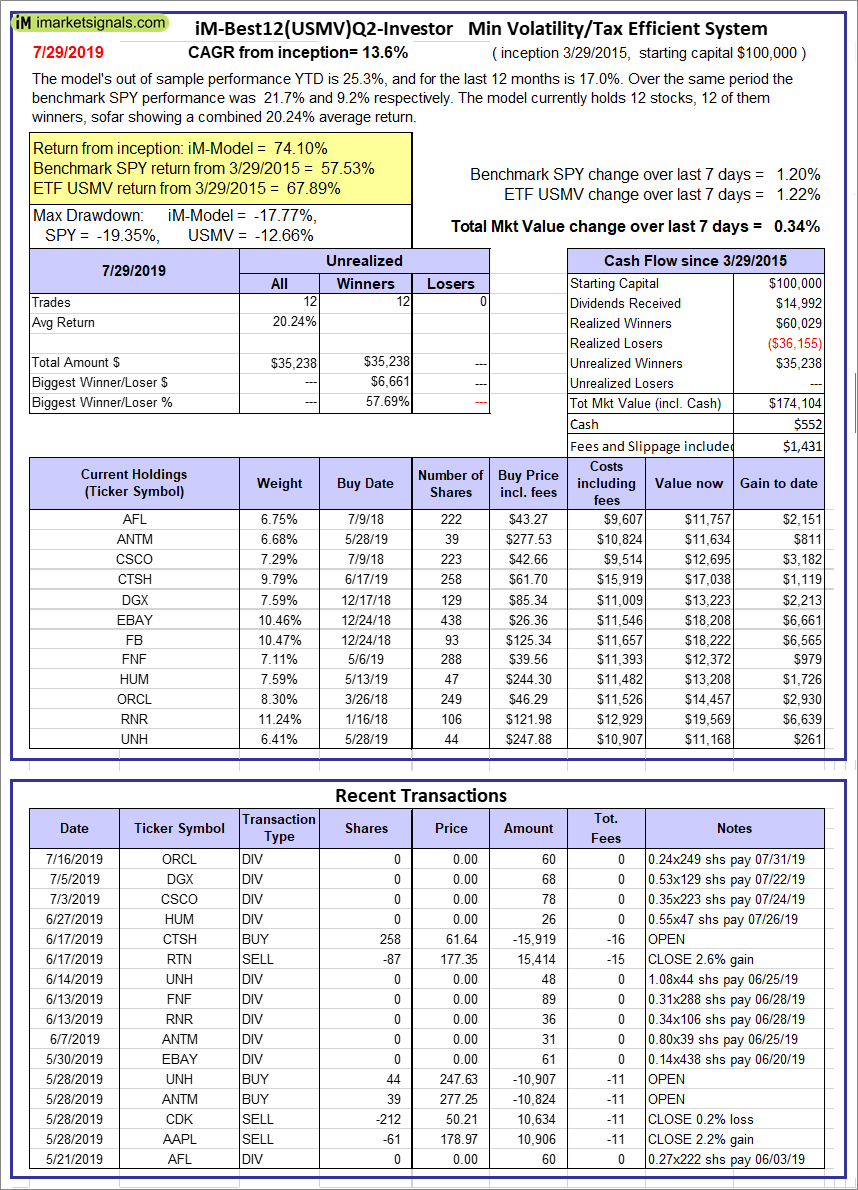
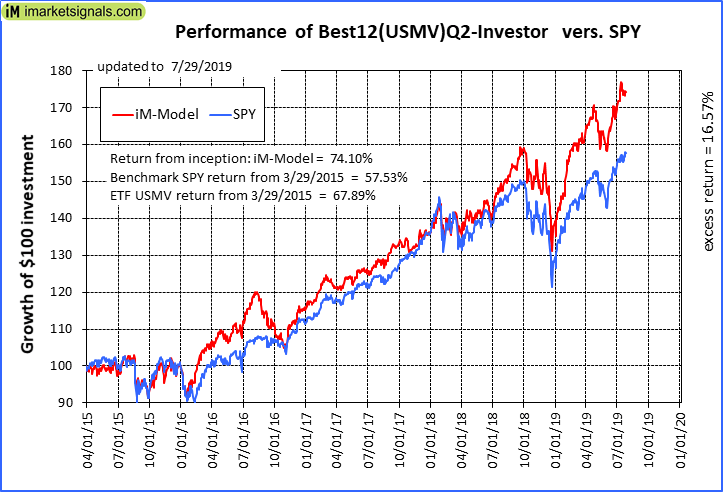
iM-Best12(USMV)Q2-Investor: Reporting will be discontinued To be discontinued. The model’s out of sample performance YTD is 25.3%, and for the last 12 months is 17.0%. Over the same period the benchmark SPY performance was 21.7% and 9.2% respectively. Since inception, on 3/30/2015, the model gained 74.10% while the benchmark SPY gained 57.53% and the ETF USMV gained 67.89% over the same period. Over the previous week the market value of iM-Best12(USMV)Q2 gained 0.34% at a time when SPY gained 1.20%. A starting capital of $100,000 at inception on 3/30/2015 would have grown to $174,104 which includes $552 cash and excludes $1,431 spent on fees and slippage. |
|
|
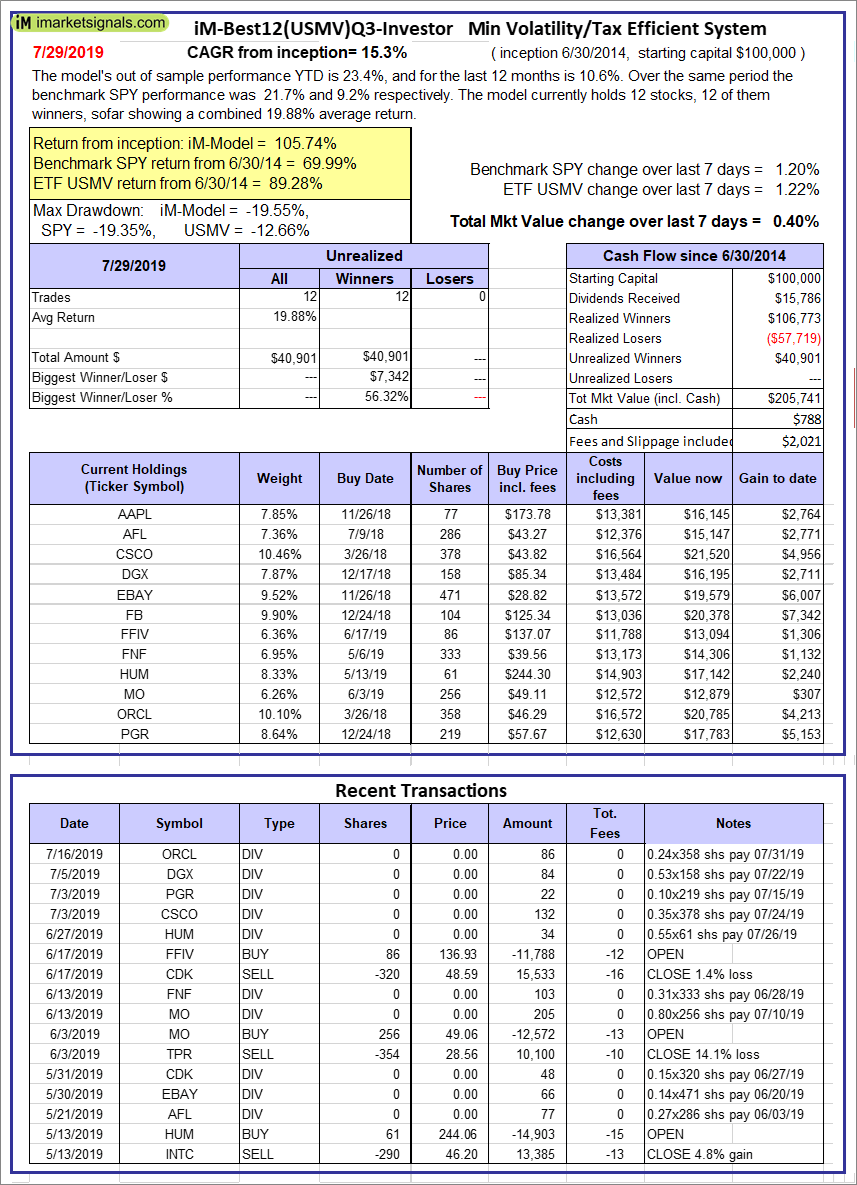
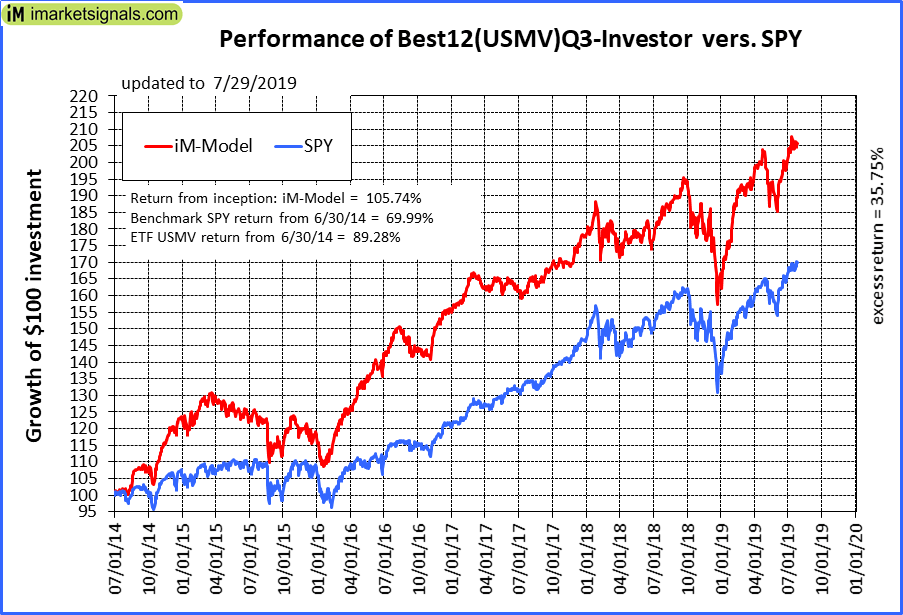
iM-Best12(USMV)Q3-Investor: Reporting will be discontinued To be discontinued. The model’s out of sample performance YTD is 23.4%, and for the last 12 months is 10.6%. Over the same period the benchmark SPY performance was 21.7% and 9.2% respectively. Since inception, on 7/1/2014, the model gained 105.74% while the benchmark SPY gained 69.99% and the ETF USMV gained 89.28% over the same period. Over the previous week the market value of iM-Best12(USMV)Q3 gained 0.40% at a time when SPY gained 1.20%. A starting capital of $100,000 at inception on 7/1/2014 would have grown to $205,741 which includes $788 cash and excludes $2,021 spent on fees and slippage. |
|
|
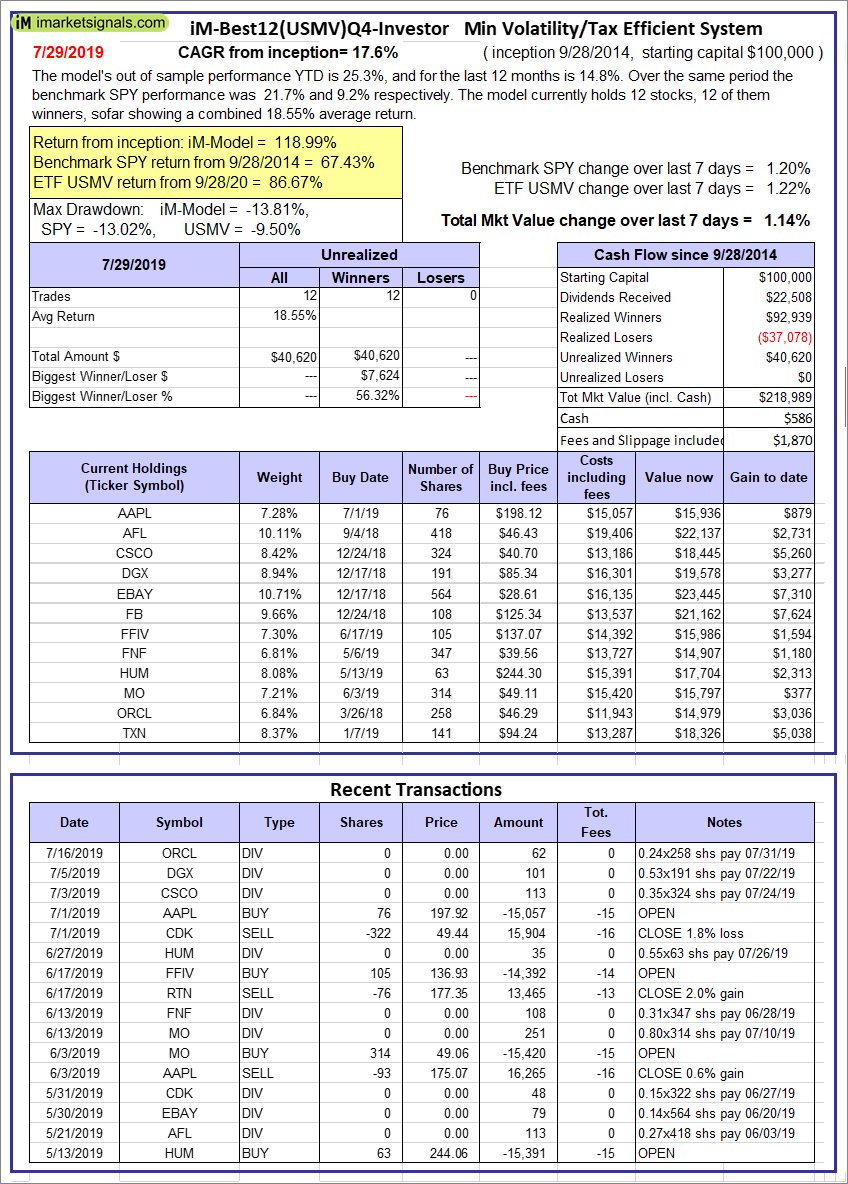
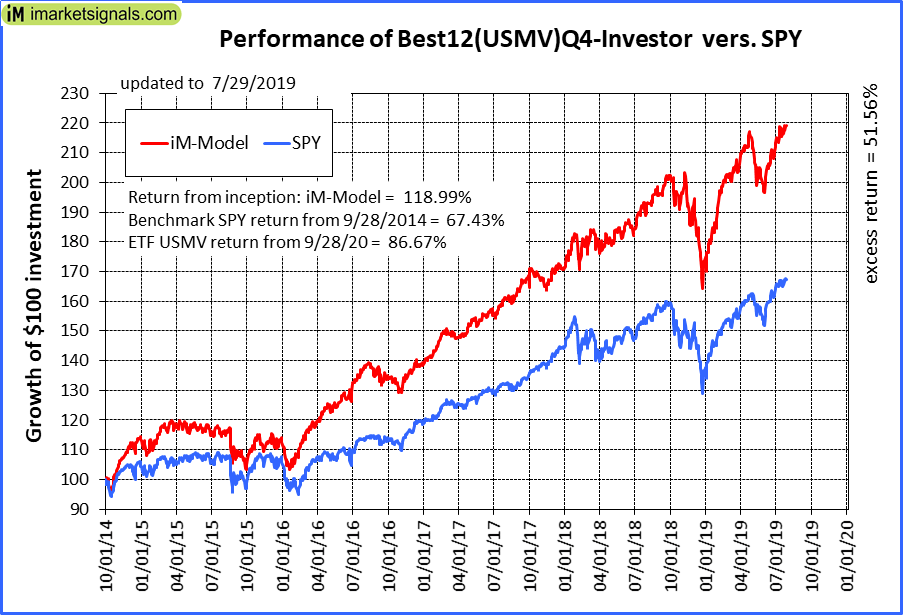
iM-Best12(USMV)Q4-Investor: Reporting will be discontinued To be discontinued. Since inception, on 9/29/2014, the model gained 118.99% while the benchmark SPY gained 67.43% and the ETF USMV gained 86.67% over the same period. Over the previous week the market value of iM-Best12(USMV)Q4 gained 1.14% at a time when SPY gained 1.20%. A starting capital of $100,000 at inception on 9/29/2014 would have grown to $218,989 which includes $586 cash and excludes $1,870 spent on fees and slippage. |
|
|
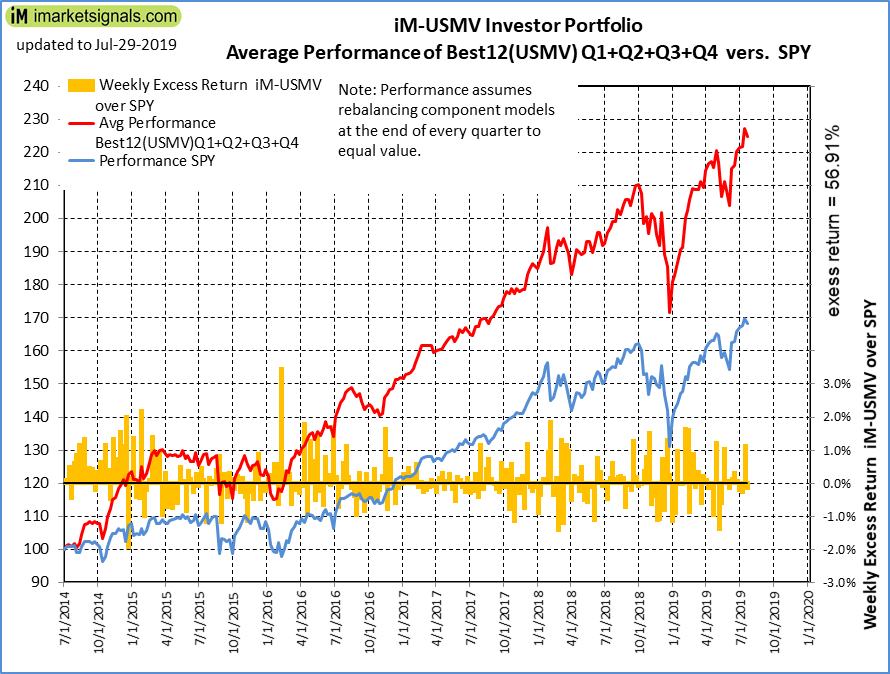
Average Performance of iM-Best12(USMV)Q1+Q2+Q3+Q4-Investor resulted in an excess return of 56.91% over SPY. (see iM-USMV Investor Portfolio) |
|
|
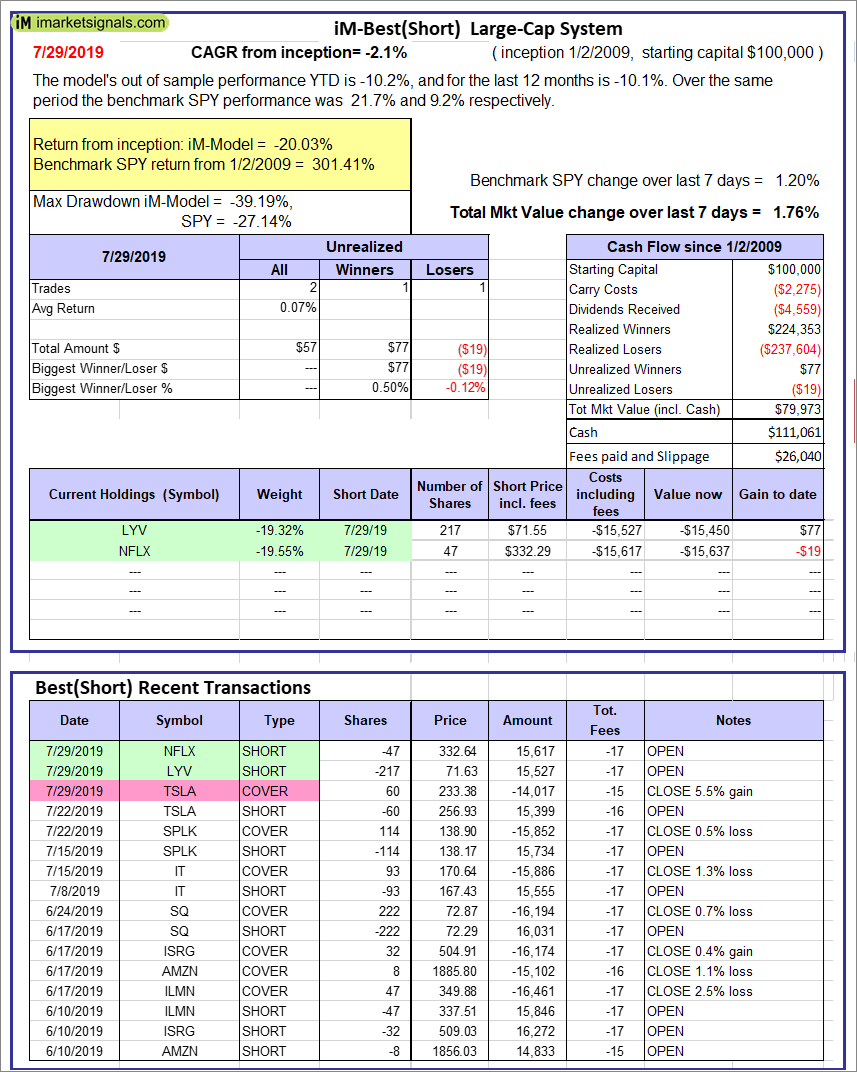
iM-Best(Short): The model’s out of sample performance YTD is -10.2%, and for the last 12 months is -10.1%. Over the same period the benchmark SPY performance was 21.7% and 9.2% respectively. Over the previous week the market value of iM-Best(Short) gained 1.76% at a time when SPY gained 1.20%. Over the period 1/2/2009 to 7/29/2019 the starting capital of $100,000 would have grown to $79,973 which includes $111,061 cash and excludes $26,040 spent on fees and slippage. |
|
|
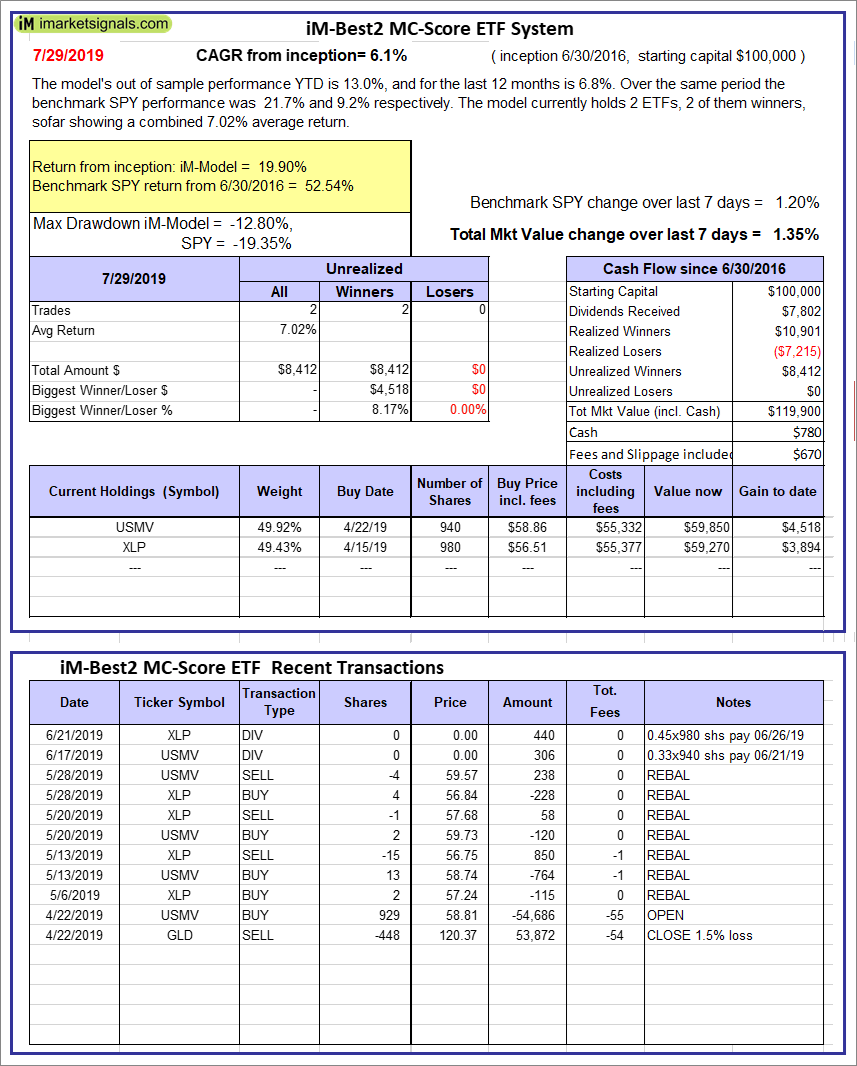
iM-Best2 MC-Score ETF System: The model’s out of sample performance YTD is 13.0%, and for the last 12 months is 6.8%. Over the same period the benchmark SPY performance was 21.7% and 9.2% respectively. Over the previous week the market value of the iM-Best2 MC-Score ETF System gained 1.35% at a time when SPY gained 1.20%. A starting capital of $100,000 at inception on 6/30/2016 would have grown to $119,900 which includes $780 cash and excludes $670 spent on fees and slippage. |
|
|
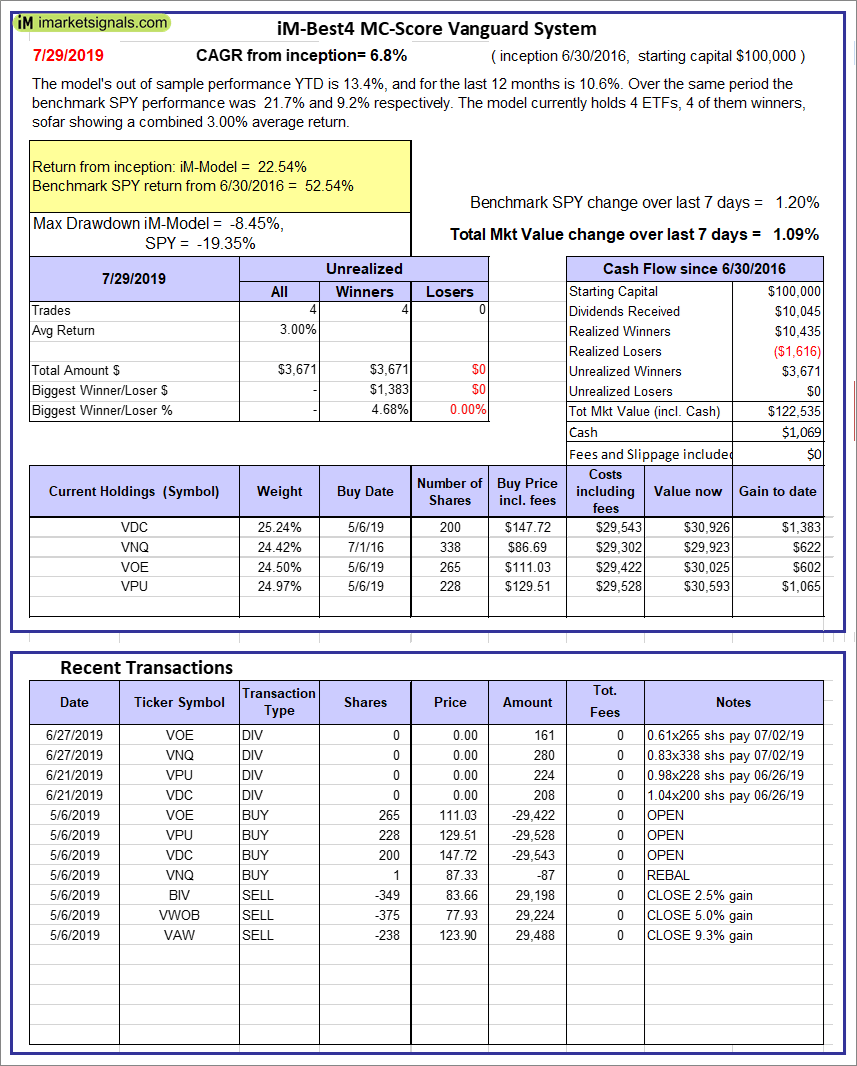
iM-Best4 MC-Score Vanguard System: The model’s out of sample performance YTD is 13.4%, and for the last 12 months is 10.6%. Over the same period the benchmark SPY performance was 21.7% and 9.2% respectively. Over the previous week the market value of the iM-Best4 MC-Score Vanguard System gained 1.09% at a time when SPY gained 1.20%. A starting capital of $100,000 at inception on 6/30/2016 would have grown to $122,535 which includes $1,069 cash and excludes $00 spent on fees and slippage. |
|
|
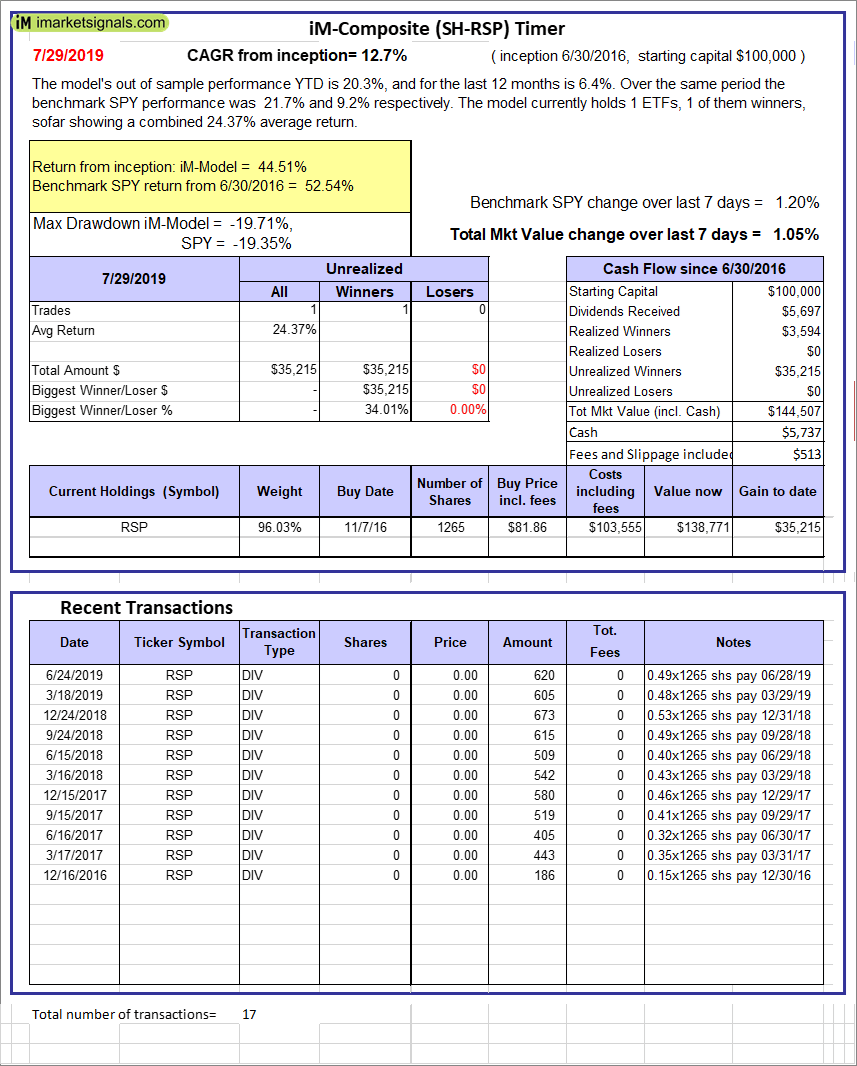
iM-Composite (SH-RSP) Timer: The model’s out of sample performance YTD is 20.3%, and for the last 12 months is 6.4%. Over the same period the benchmark SPY performance was 21.7% and 9.2% respectively. Over the previous week the market value of the iM-Composite (SH-RSP) Timer gained 1.05% at a time when SPY gained 1.20%. A starting capital of $100,000 at inception on 6/30/2016 would have grown to $144,507 which includes $5,737 cash and excludes $513 spent on fees and slippage. |
|
|
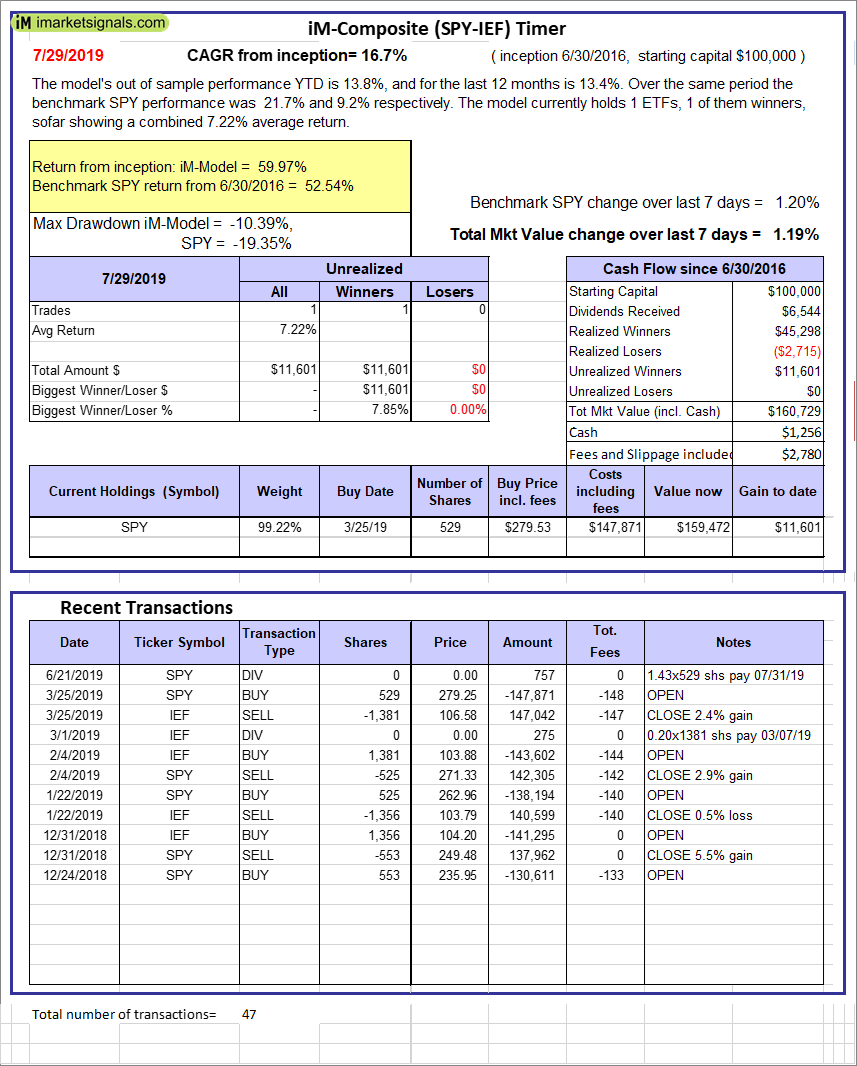
iM-Composite (SPY-IEF) Timer: The model’s out of sample performance YTD is 13.8%, and for the last 12 months is 13.4%. Over the same period the benchmark SPY performance was 21.7% and 9.2% respectively. Over the previous week the market value of the iM-Composite (SPY-IEF) Timer gained 1.19% at a time when SPY gained 1.20%. A starting capital of $100,000 at inception on 6/30/2016 would have grown to $160,729 which includes $1,256 cash and excludes $2,780 spent on fees and slippage. |
|
|
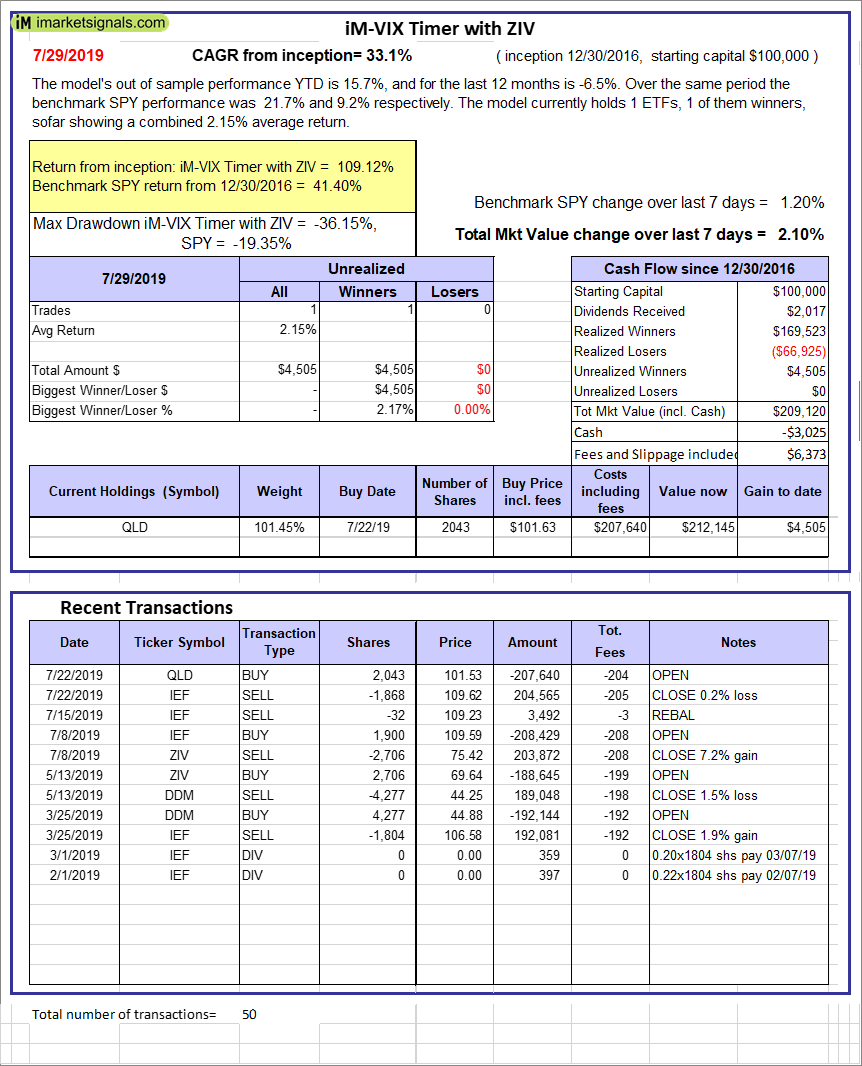
iM-VIX Timer with ZIV: The model’s out of sample performance YTD is 15.7%, and for the last 12 months is -6.5%. Over the same period the benchmark SPY performance was 21.7% and 9.2% respectively. Over the previous week the market value of the iM-VIX Timer with ZIV gained 2.10% at a time when SPY gained 1.20%. A starting capital of $100,000 at inception on 6/30/2016 would have grown to $209,120 which includes -$3,025 cash and excludes $6,373 spent on fees and slippage. |
|
|
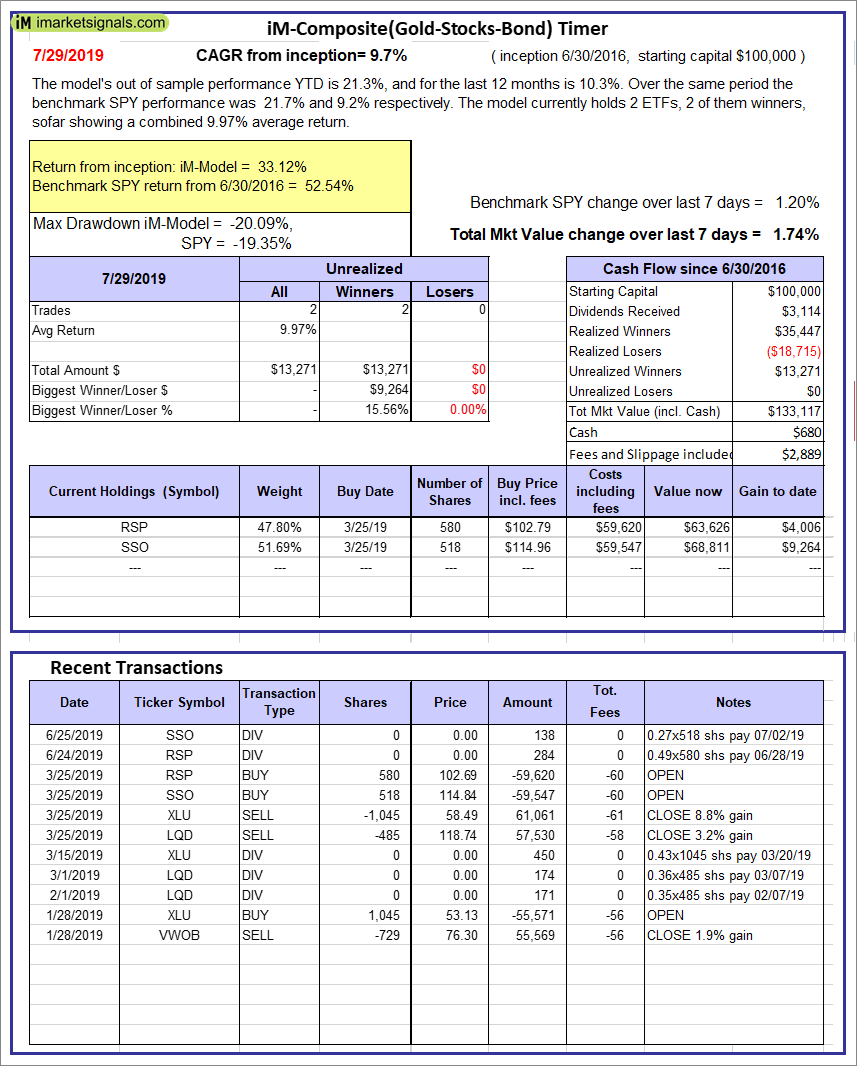
iM-Composite(Gold-Stocks-Bond) Timer: The model’s out of sample performance YTD is 21.3%, and for the last 12 months is 10.3%. Over the same period the benchmark SPY performance was 21.7% and 9.2% respectively. Over the previous week the market value of the iM-Composite(Gold-Stocks-Bond) Timer gained 1.74% at a time when SPY gained 1.20%. A starting capital of $100,000 at inception on 6/30/2016 would have grown to $133,117 which includes $680 cash and excludes $2,889 spent on fees and slippage. |
|
|
iM-Low Turnover Composite Timer Combo: The model’s out of sample performance YTD is 12.8%, and for the last 12 months is 3.1%. Over the same period the benchmark SPY performance was 21.7% and 9.2% respectively. Over the previous week the market value of the iM-Low Turnover Composite Timer Combo gained 0.89% at a time when SPY gained 1.20%. A starting capital of $100,000 at inception on 3/24/27 would have grown to $108,732 which includes $517 cash and excludes $887 spent on fees and slippage. |
|
|
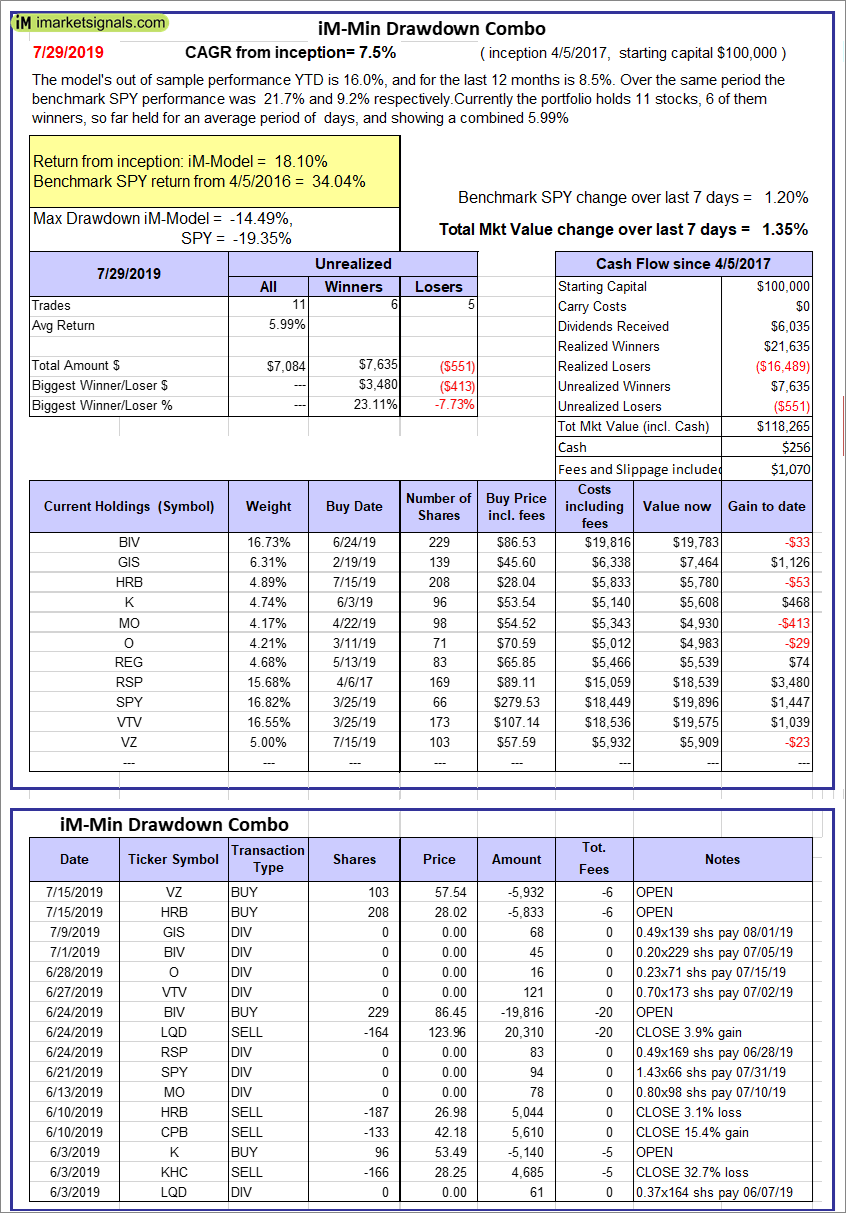
iM-Min Drawdown Combo: The model’s out of sample performance YTD is 16.0%, and for the last 12 months is 8.5%. Over the same period the benchmark SPY performance was 21.7% and 9.2% respectively. Over the previous week the market value of the iM-Min Drawdown Combo gained 1.35% at a time when SPY gained 1.20%. A starting capital of $100,000 at inception on 4/5/2017 would have grown to $118,265 which includes $256 cash and excludes $1,070 spent on fees and slippage. |
|
|
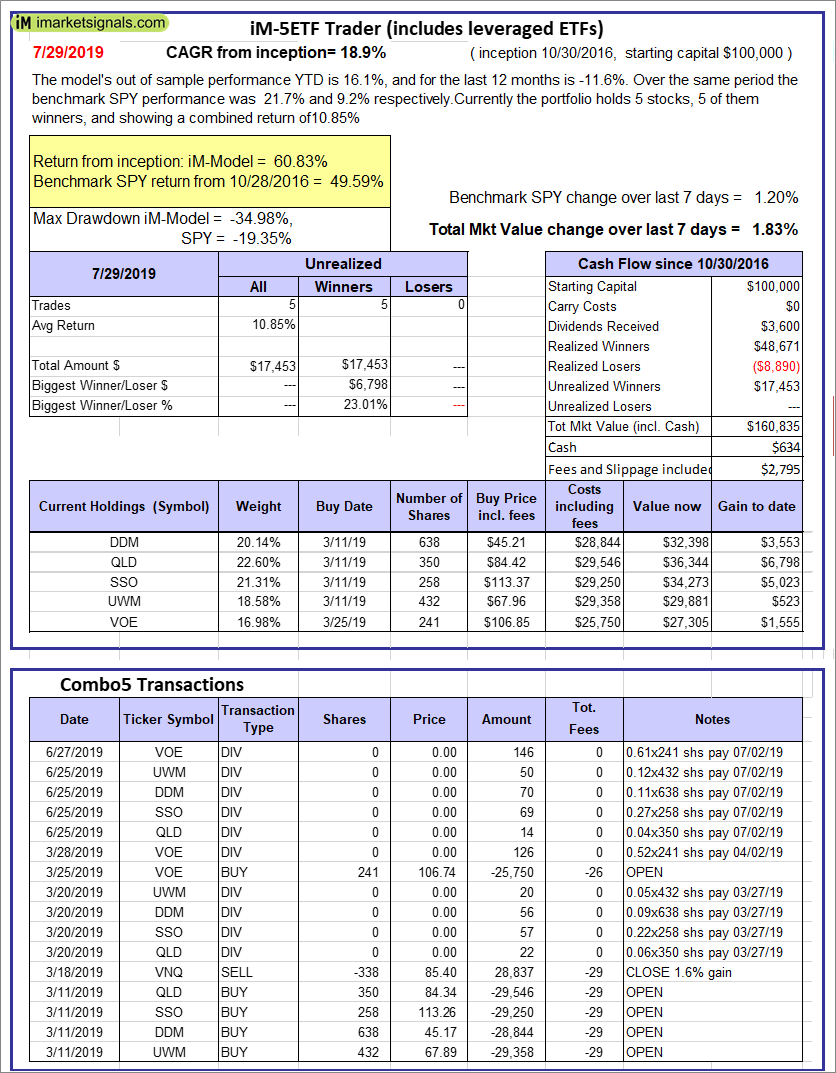
iM-5ETF Trader (includes leveraged ETFs): The model’s out of sample performance YTD is 16.1%, and for the last 12 months is -11.6%. Over the same period the benchmark SPY performance was 21.7% and 9.2% respectively. Over the previous week the market value of the iM-5ETF Trader (includes leveraged ETFs) gained 1.83% at a time when SPY gained 1.20%. A starting capital of $100,000 at inception on 10/30/2016 would have grown to $160,835 which includes $634 cash and excludes $2,795 spent on fees and slippage. |
|
|
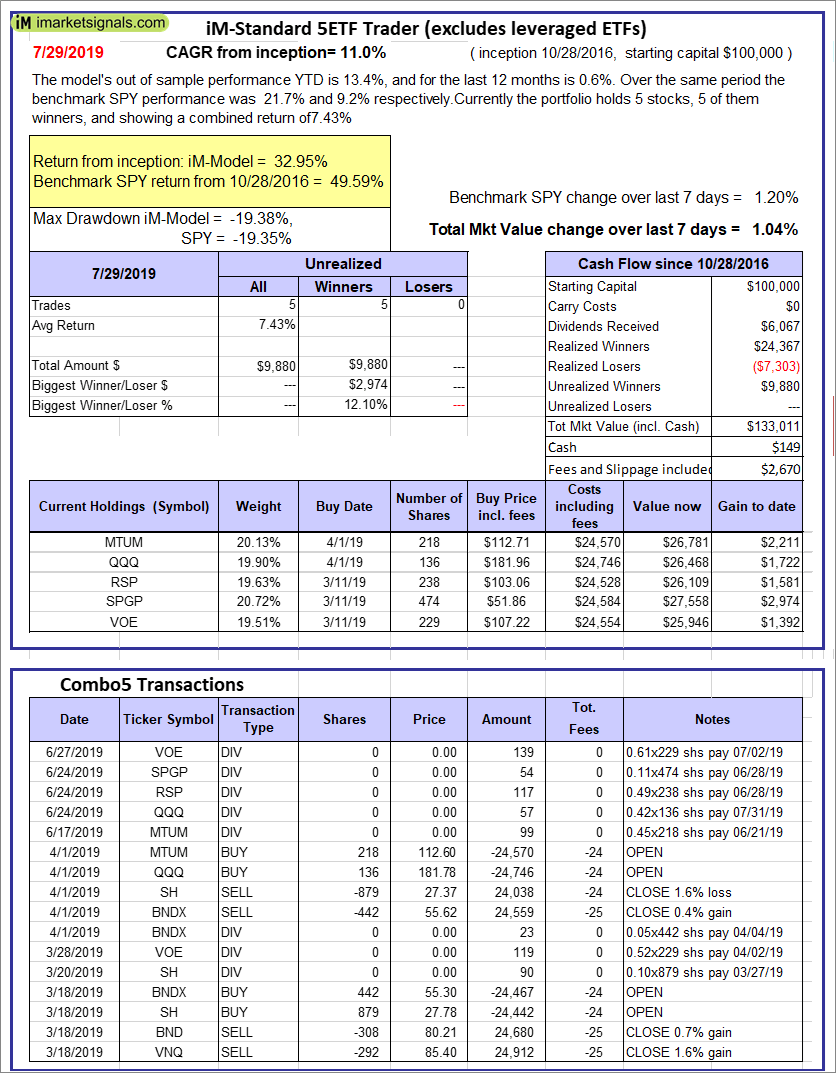
iM-Standard 5ETF Trader (excludes leveraged ETFs): The model’s out of sample performance YTD is 13.4%, and for the last 12 months is 0.6%. Over the same period the benchmark SPY performance was 21.7% and 9.2% respectively. Over the previous week the market value of the iM-Standard 5ETF Trader (excludes leveraged ETFs) gained 1.04% at a time when SPY gained 1.20%. A starting capital of $100,000 at inception on 10/30/2016 would have grown to $133,011 which includes $149 cash and excludes $2,670 spent on fees and slippage. |


Leave a Reply
You must be logged in to post a comment.