
  |
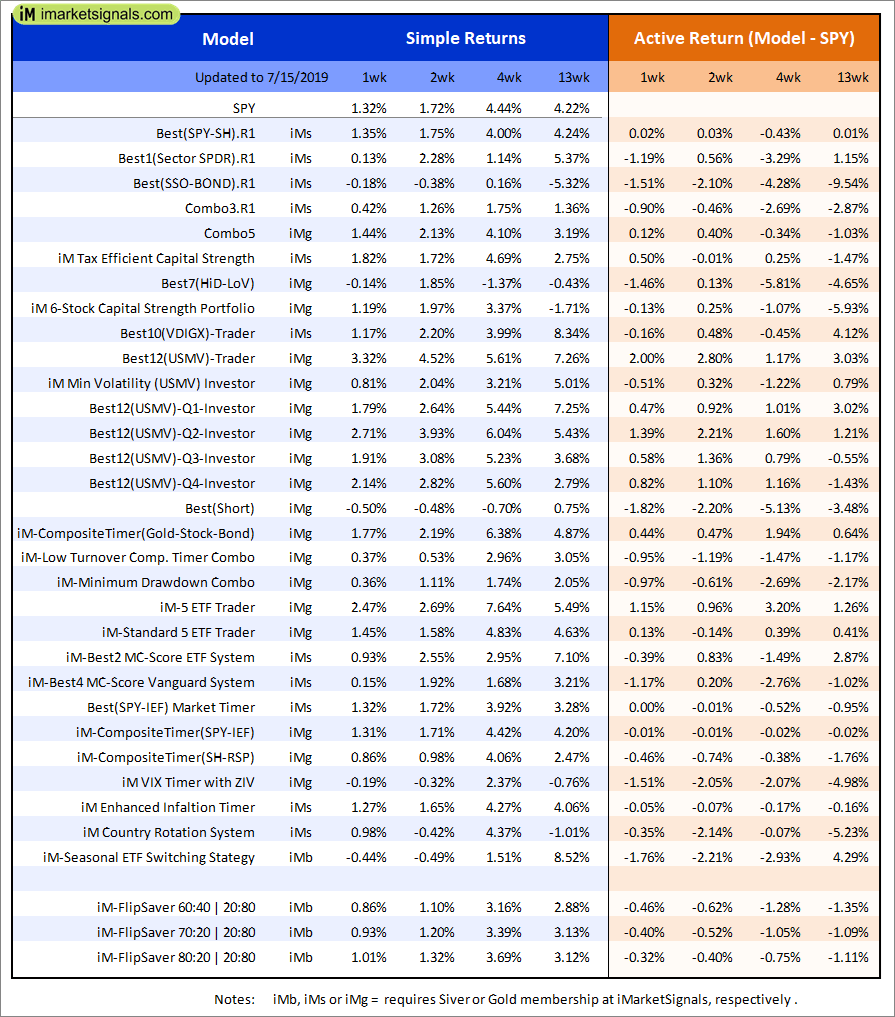
Out of sample performance summary of our models for the past 1, 2, 4 and 13 week periods. The active active return indicates how the models over- or underperformed the benchmark ETF SPY. Also the YTD, and the 1-, 3-, 5- and 10-year annualized returns are shown in the second table |
 |
iM-FlipSaver 60:40 | 20:80 – 2017: The model’s out of sample performance YTD is 10.6%, and for the last 12 months is 5.0%. Over the same period the benchmark E60B40 performance was 14.6% and 8.7% respectively. Over the previous week the market value of iM-FlipSaver 80:20 | 20:80 gained -0.48% at a time when SPY gained -0.43%. A starting capital of $100,000 at inception on 7/16/2015 would have grown to $123,834 which includes $1,009 cash and excludes $788 spent on fees and slippage. |
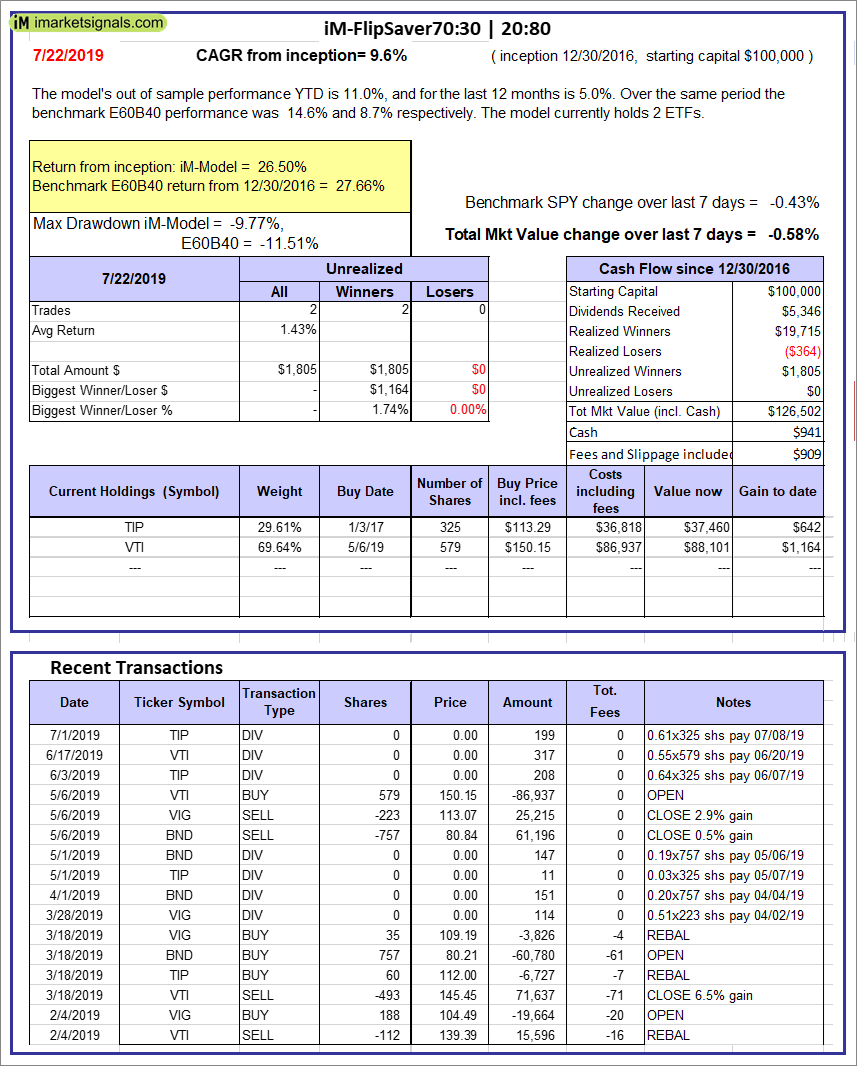 |
iM-FlipSaver 70:30 | 20:80 – 2017: The model’s out of sample performance YTD is 11.0%, and for the last 12 months is 5.0%. Over the same period the benchmark E60B40 performance was 14.6% and 8.7% respectively. Over the previous week the market value of iM-FlipSaver 70:30 | 20:80 gained -0.58% at a time when SPY gained -0.43%. A starting capital of $100,000 at inception on 7/15/2015 would have grown to $126,502 which includes $941 cash and excludes $909 spent on fees and slippage. |
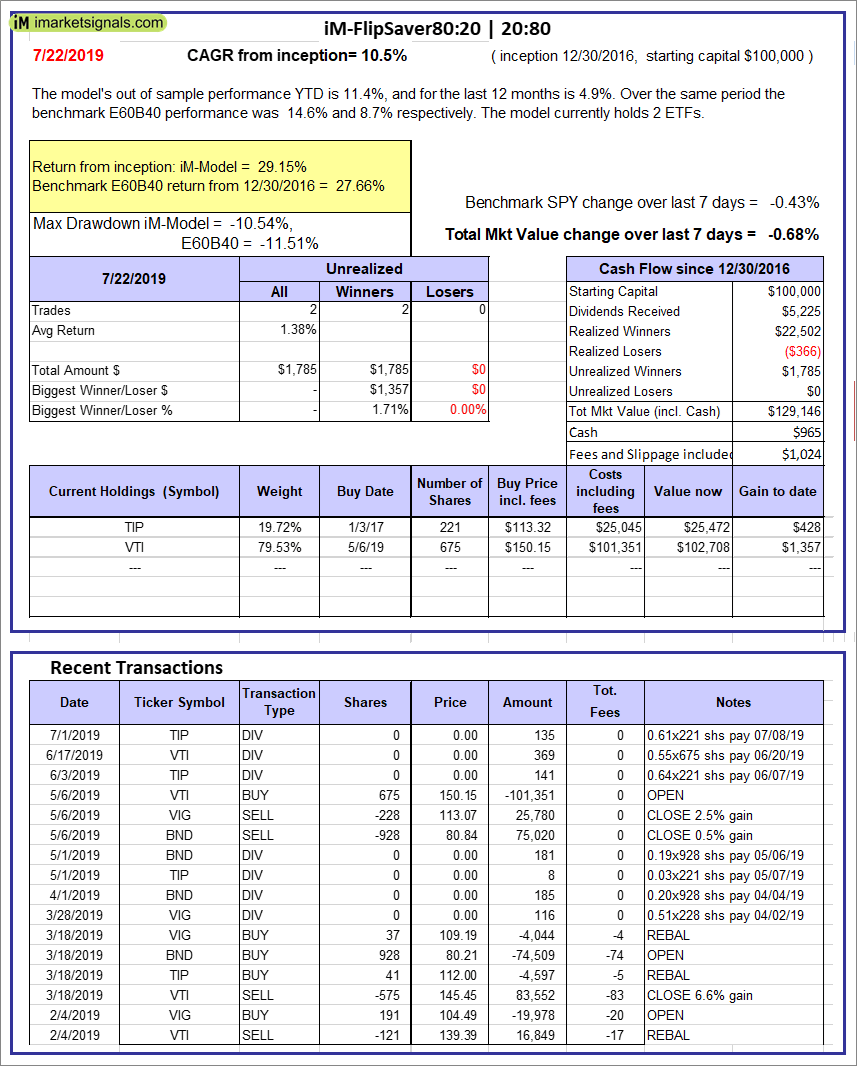 |
iM-FlipSaver 80:20 | 20:80 – 2017: The model’s out of sample performance YTD is 11.4%, and for the last 12 months is 4.9%. Over the same period the benchmark E60B40 performance was 14.6% and 8.7% respectively. Over the previous week the market value of iM-FlipSaver 80:20 | 20:80 gained -0.68% at a time when SPY gained -0.43%. A starting capital of $100,000 at inception on 1/2/2017 would have grown to $129,146 which includes $965 cash and excludes $1,024 spent on fees and slippage. |
 |
iM-Best(SPY-SH).R1: The model’s out of sample performance YTD is 8.0%, and for the last 12 months is 9.2%. Over the same period the benchmark SPY performance was 20.3% and 8.6% respectively. Over the previous week the market value of Best(SPY-SH) gained -0.96% at a time when SPY gained -0.95%. A starting capital of $100,000 at inception on 1/2/2009 would have grown to $649,390 which includes -$8,075 cash and excludes $22,629 spent on fees and slippage. |
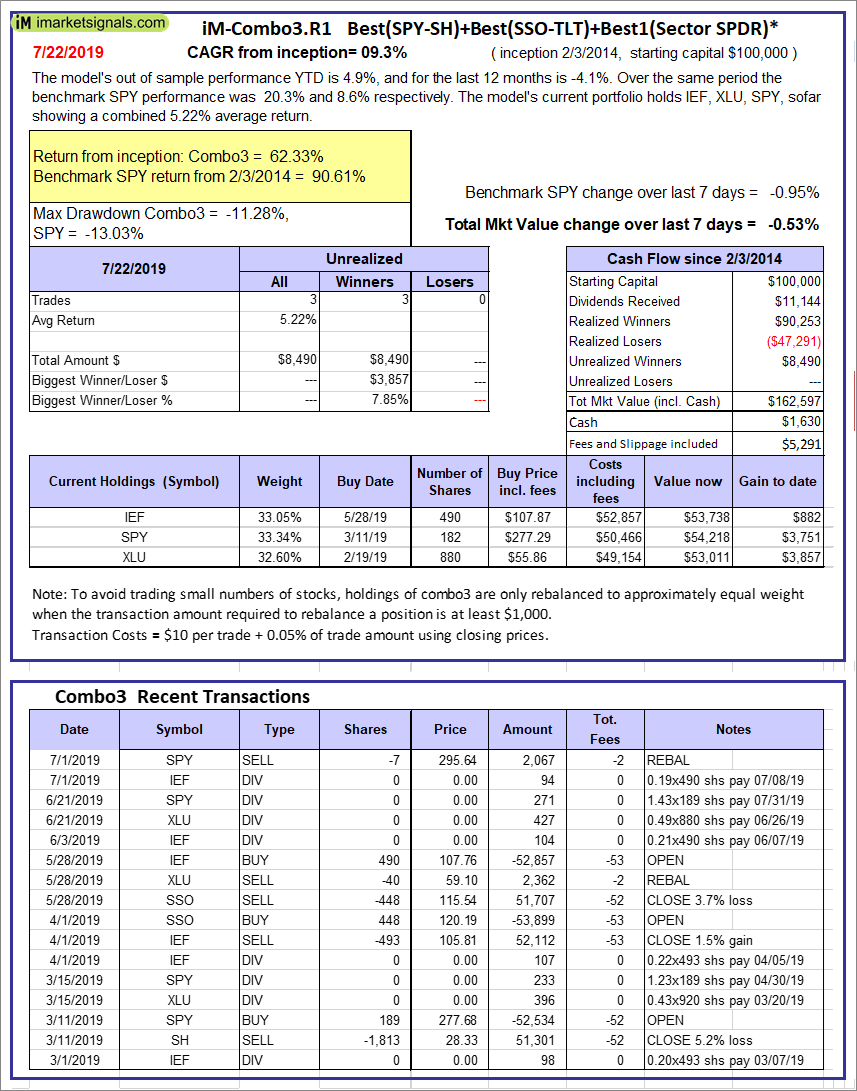 |
iM-Combo3.R1: The model’s out of sample performance YTD is 4.9%, and for the last 12 months is -4.1%. Over the same period the benchmark SPY performance was 20.3% and 8.6% respectively. Over the previous week the market value of iM-Combo3.R1 gained -0.53% at a time when SPY gained -0.95%. A starting capital of $100,000 at inception on 2/3/2014 would have grown to $162,597 which includes $1,630 cash and excludes $5,291 spent on fees and slippage. |
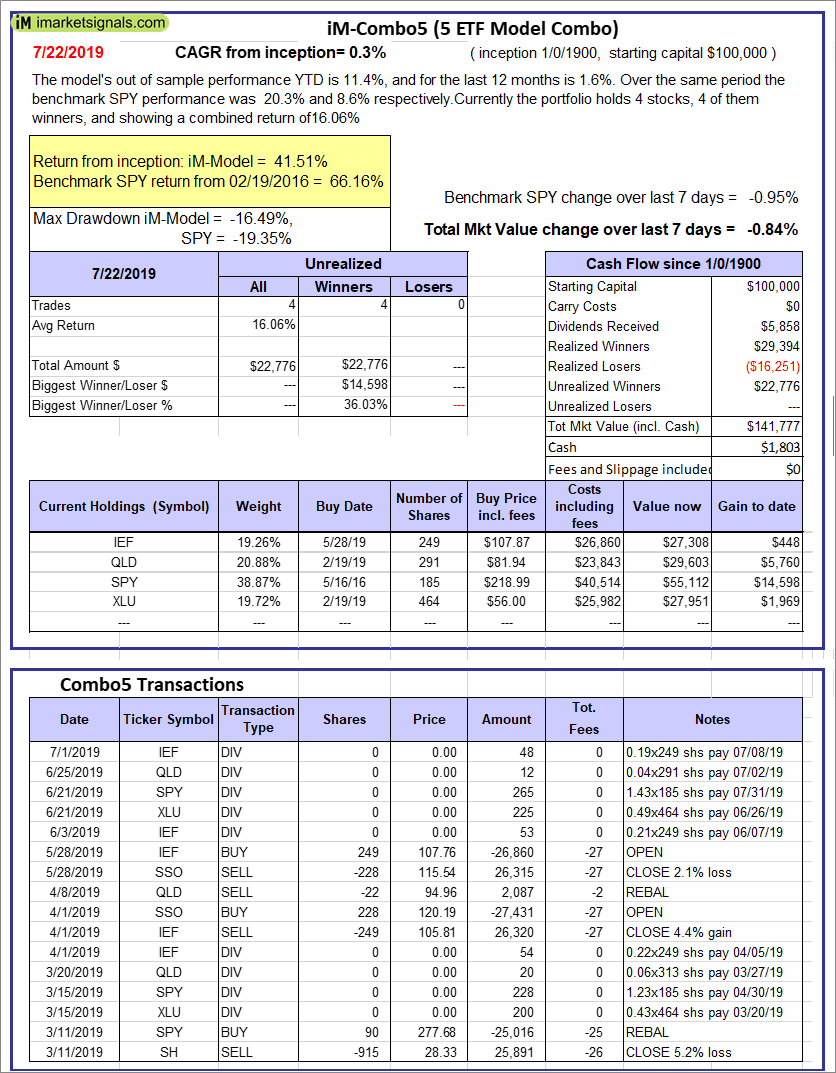 |
iM-Combo5: The model’s out of sample performance YTD is 11.4%, and for the last 12 months is 1.6%. Over the same period the benchmark SPY performance was 20.3% and 8.6% respectively. Over the previous week the market value of iM-Combo5 gained -0.84% at a time when SPY gained -0.95%. A starting capital of $100,000 at inception on 2/22/2016 would have grown to $141,777 which includes $1,803 cash and excludes $0 spent on fees and slippage. |
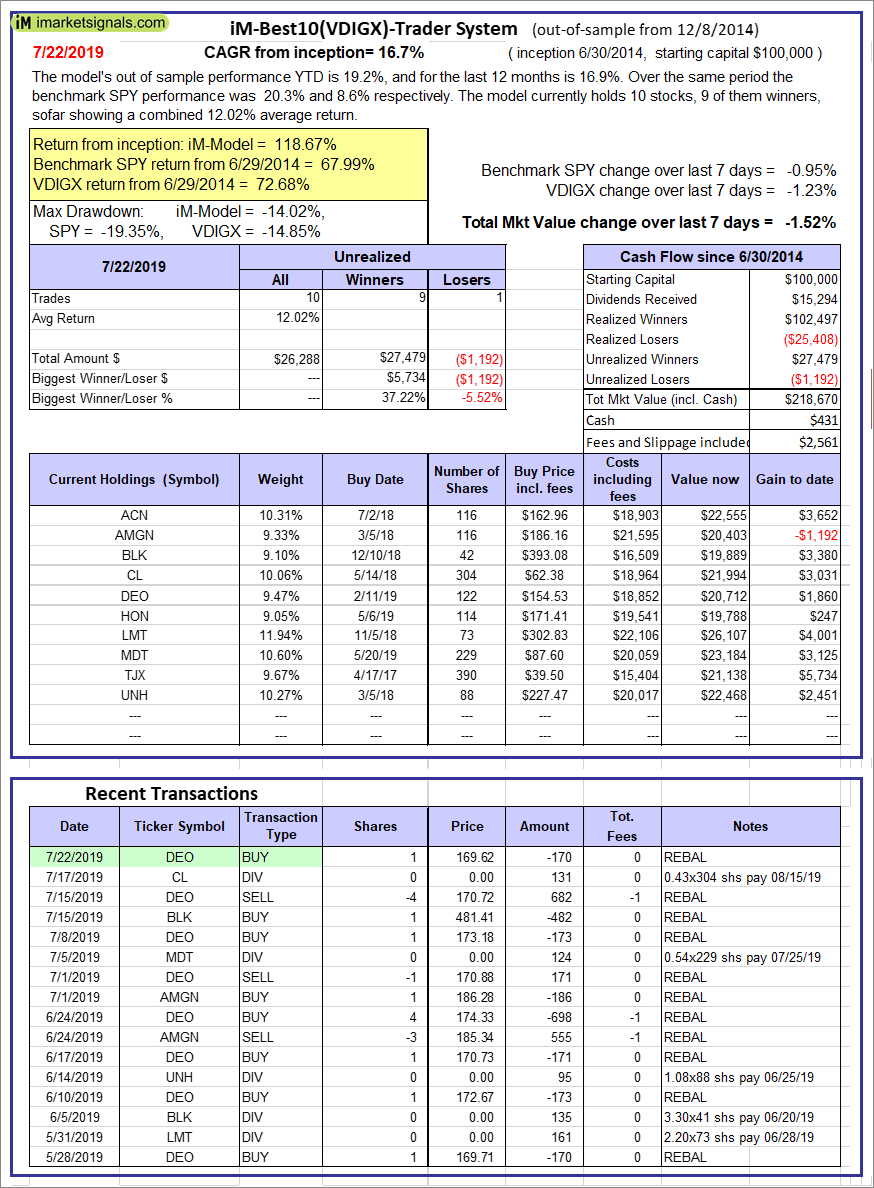 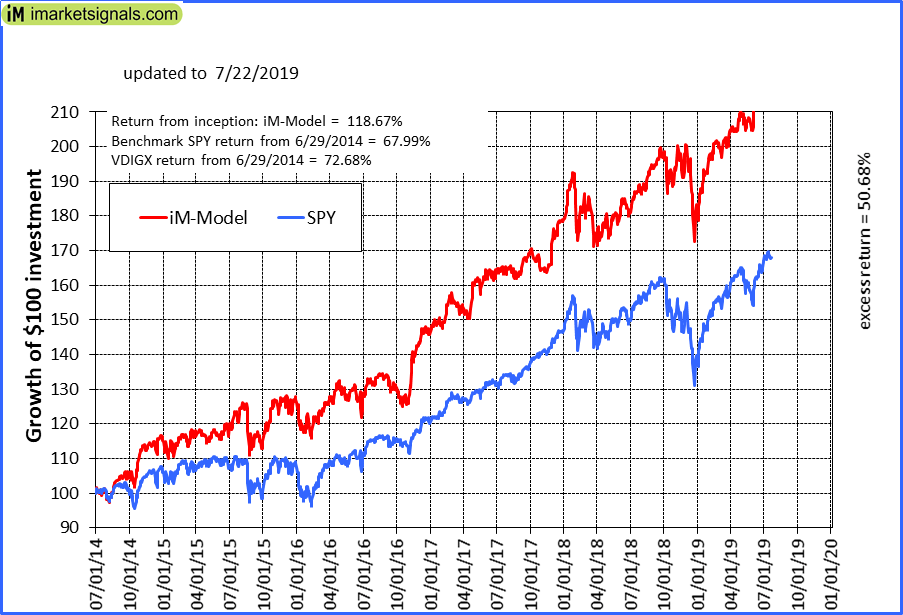 |
iM-Best10(VDIGX)-Trader: The model’s out of sample performance YTD is 19.2%, and for the last 12 months is 16.9%. Over the same period the benchmark SPY performance was 20.3% and 8.6% respectively. Since inception, on 7/1/2014, the model gained 118.67% while the benchmark SPY gained 67.99% and VDIGX gained 72.68% over the same period. Over the previous week the market value of iM-Best10(VDIGX) gained -1.52% at a time when SPY gained -0.95%. A starting capital of $100,000 at inception on 7/1/2014 would have grown to $218,670 which includes $431 cash and excludes $2,561 spent on fees and slippage. |
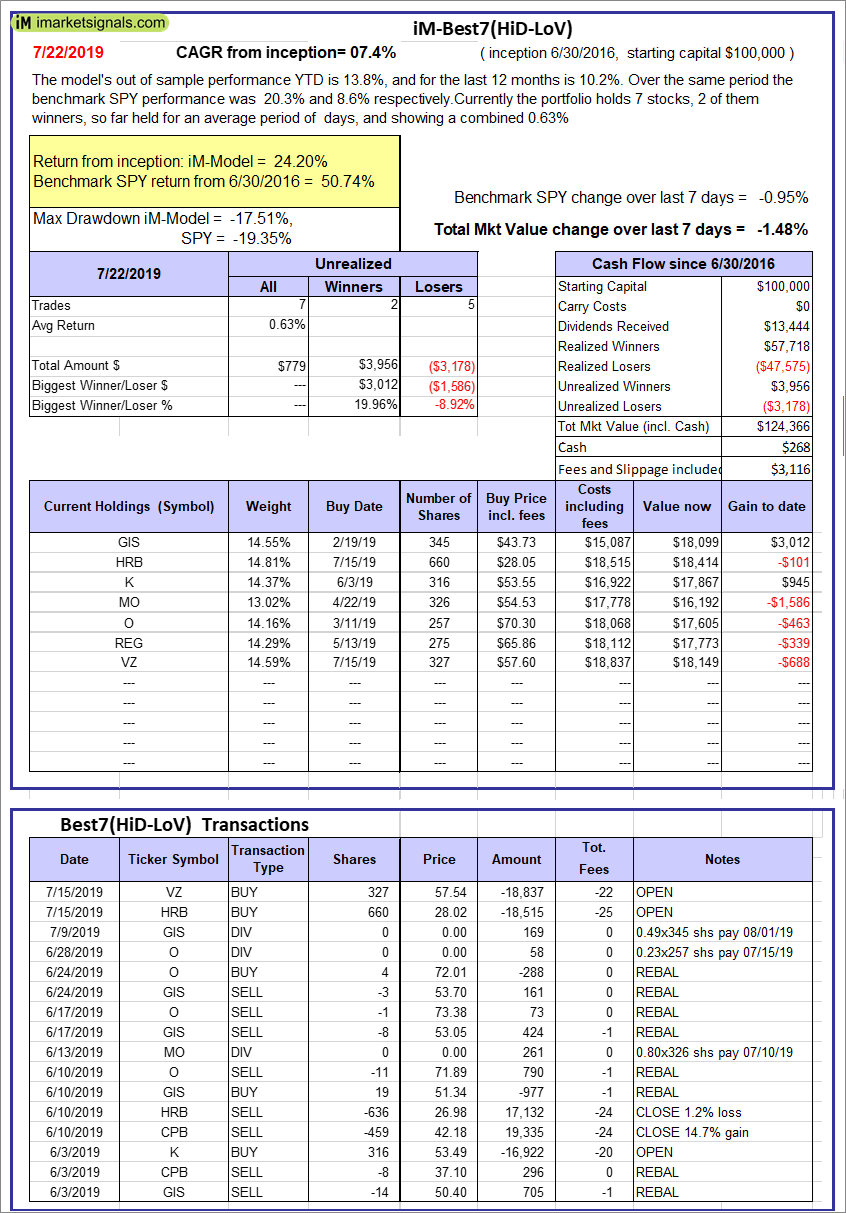 |
iM-Best7(HiD-LoV): The model’s out of sample performance YTD is 13.8%, and for the last 12 months is 10.2%. Over the same period the benchmark SPY performance was 20.3% and 8.6% respectively. Over the previous week the market value of iM-Best7(HiD-LoV) gained -1.48% at a time when SPY gained -0.95%. A starting capital of $100,000 at inception on 6/30/2016 would have grown to $124,366 which includes $268 cash and excludes $3,116 spent on fees and slippage. |
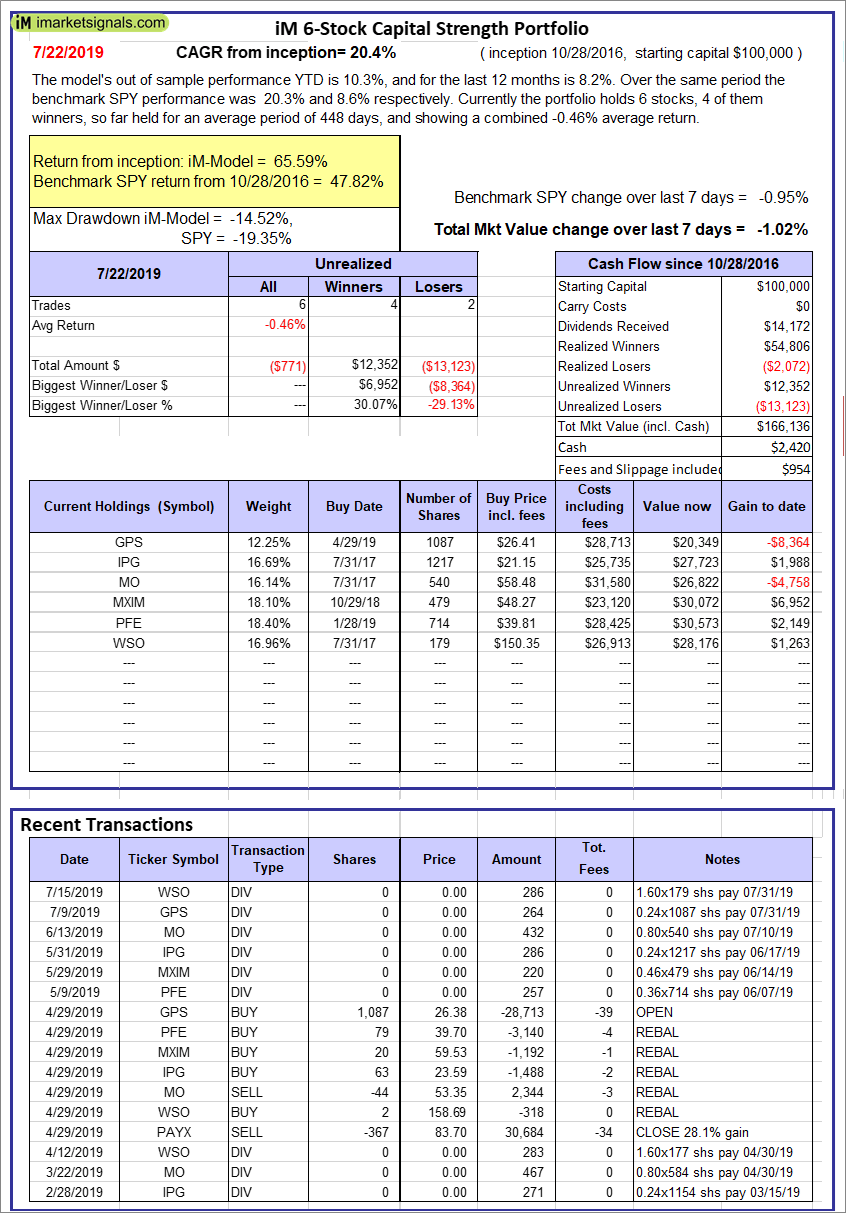 |
iM 6-Stock Capital Strength Portfolio: The model’s out of sample performance YTD is 10.3%, and for the last 12 months is 8.2%. Over the same period the benchmark SPY performance was 20.3% and 8.6% respectively. Over the previous week the market value of the iM 6-Stock Capital Strength Portfolio gained -1.02% at a time when SPY gained -0.95%. A starting capital of $100,000 at inception on 10/28/2016 would have grown to $166,136 which includes $2,420 cash and excludes $954 spent on fees and slippage. |
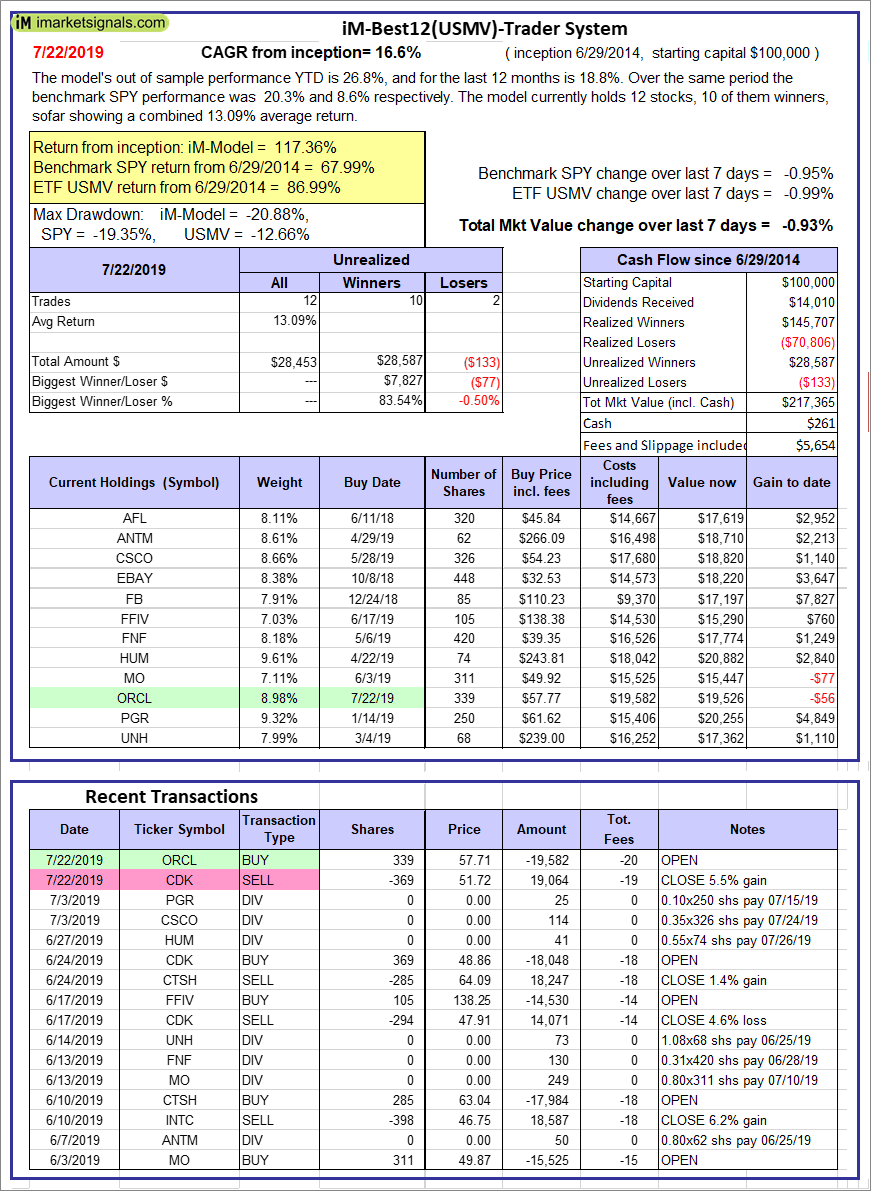 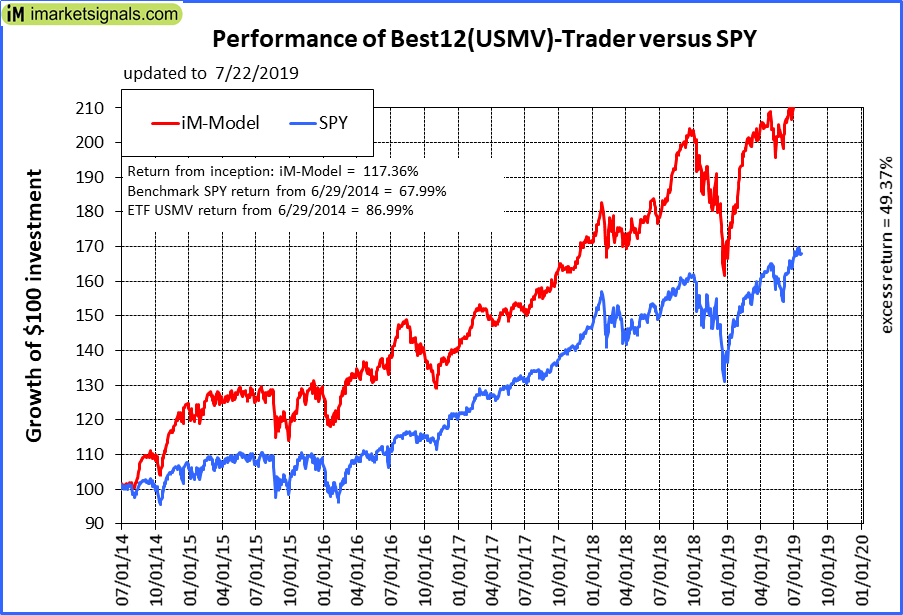 |
iM-Best12(USMV)-Trader: The model’s out of sample performance YTD is 26.8%, and for the last 12 months is 18.8%. Over the same period the benchmark SPY performance was 20.3% and 8.6% respectively. Since inception, on 6/30/2014, the model gained 117.36% while the benchmark SPY gained 67.99% and the ETF USMV gained 86.99% over the same period. Over the previous week the market value of iM-Best12(USMV)-Trader gained -0.93% at a time when SPY gained -0.95%. A starting capital of $100,000 at inception on 6/30/2014 would have grown to $217,365 which includes $261 cash and excludes $5,654 spent on fees and slippage. |
 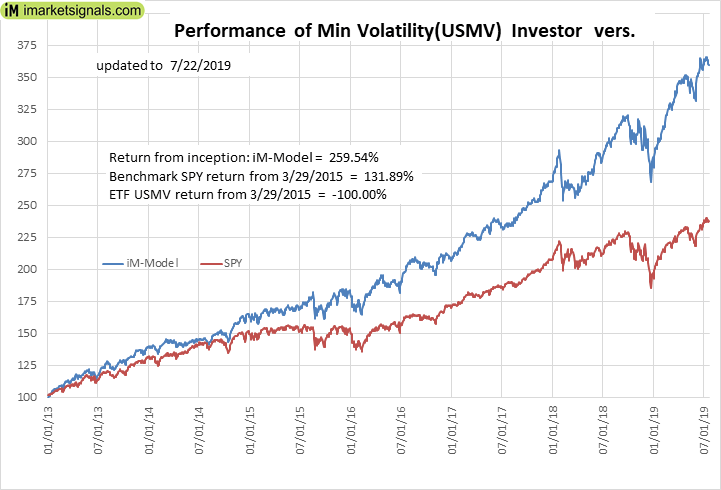 |
iM Min Volatility (USMV) Investor: The model’s out of sample performance YTD is 26.2%, and for the last 12 months is 24.1%. Over the same period the benchmark SPY performance was 19.9% and 9.9% respectively. Since inception, on 1/3/2013, the model gained 262.93% while the benchmark SPY gained 131.05% and the ETF USMV gained 142.65% over the same period. Over the previous week the market value of iM Min Volatility (USMV) Investor gained 1.22% at a time when SPY gained 0.39%. A starting capital of $100,000 at inception on 1/3/2013 would have grown to $362,932 which includes $651 cash and excludes $2,081 spent on fees and slippage. |
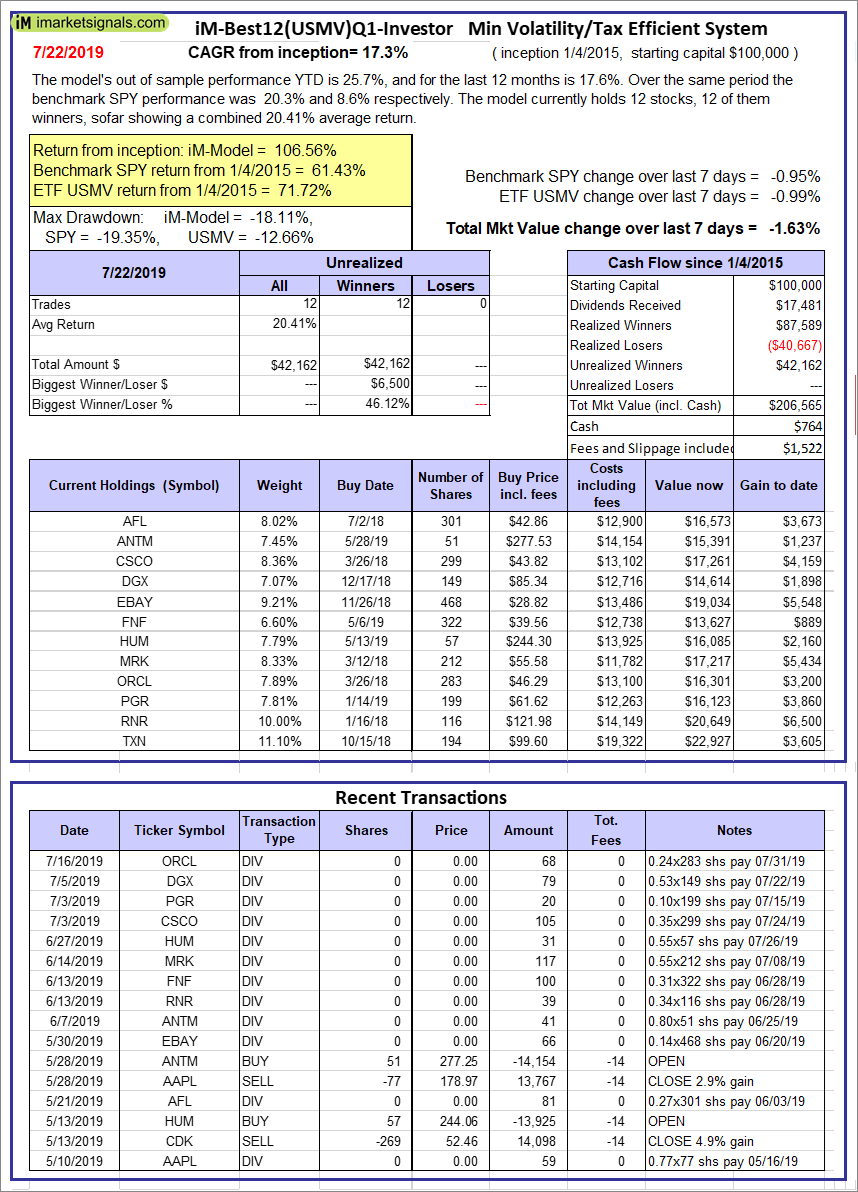 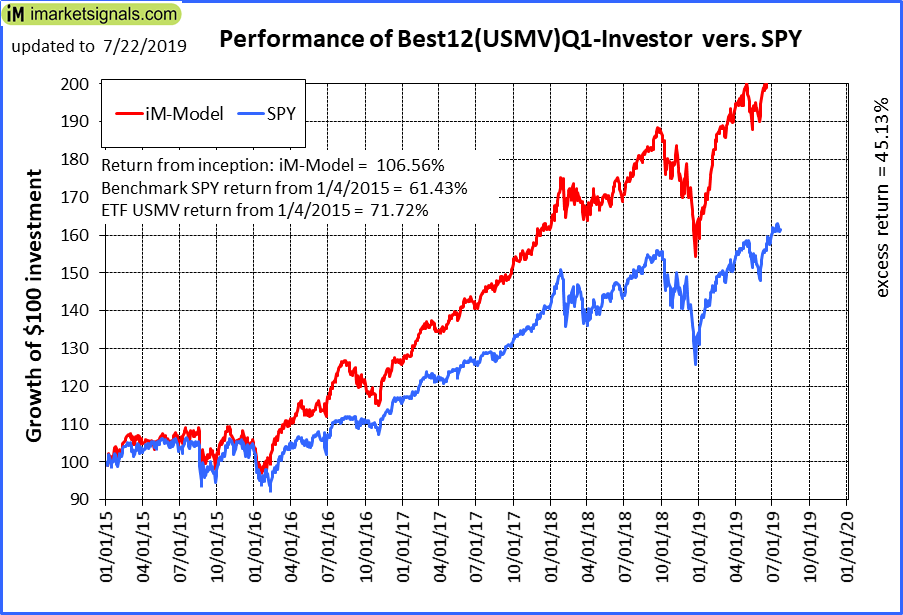 |
iM-Best12(USMV)Q1-Investor: To be discontinued. The model’s out of sample performance YTD is 25.7%, and for the last 12 months is 17.6%. Over the same period the benchmark SPY performance was 20.3% and 8.6% respectively. Since inception, on 1/5/2015, the model gained 106.56% while the benchmark SPY gained 61.43% and the ETF USMV gained 71.72% over the same period. Over the previous week the market value of iM-Best12(USMV)Q1 gained -1.63% at a time when SPY gained -0.95%. A starting capital of $100,000 at inception on 1/5/2015 would have grown to $206,565 which includes $764 cash and excludes $1,522 spent on fees and slippage. |
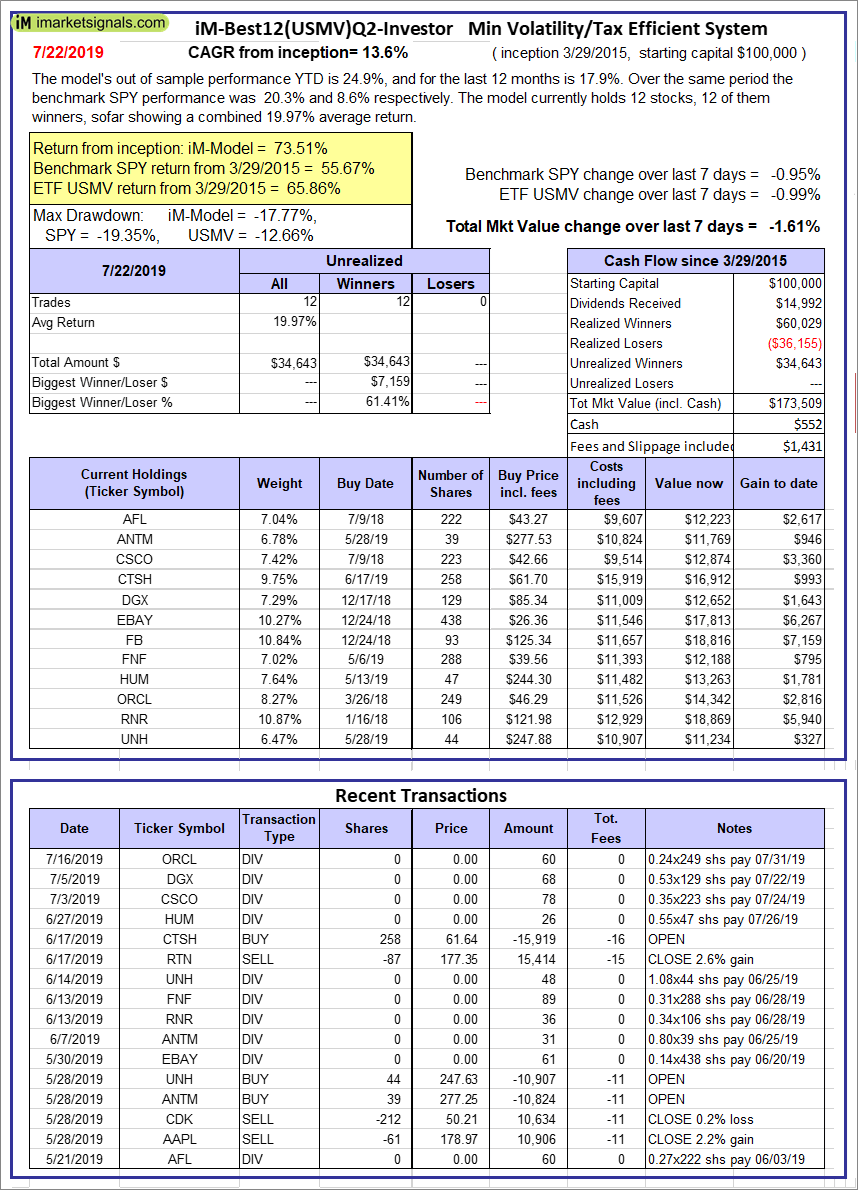 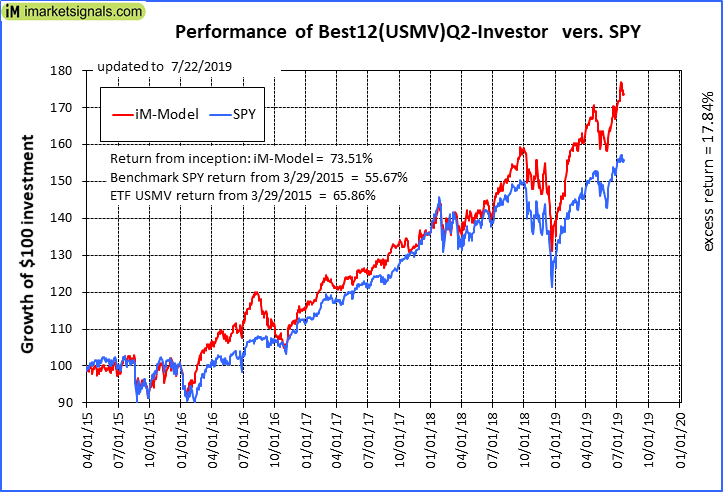 |
iM-Best12(USMV)Q2-Investor: Reporting will be discontinued To be discontinued. The model’s out of sample performance YTD is 24.9%, and for the last 12 months is 17.9%. Over the same period the benchmark SPY performance was 20.3% and 8.6% respectively. Since inception, on 3/30/2015, the model gained 73.51% while the benchmark SPY gained 55.67% and the ETF USMV gained 65.86% over the same period. Over the previous week the market value of iM-Best12(USMV)Q2 gained -1.61% at a time when SPY gained -0.95%. A starting capital of $100,000 at inception on 3/30/2015 would have grown to $173,509 which includes $552 cash and excludes $1,431 spent on fees and slippage. |
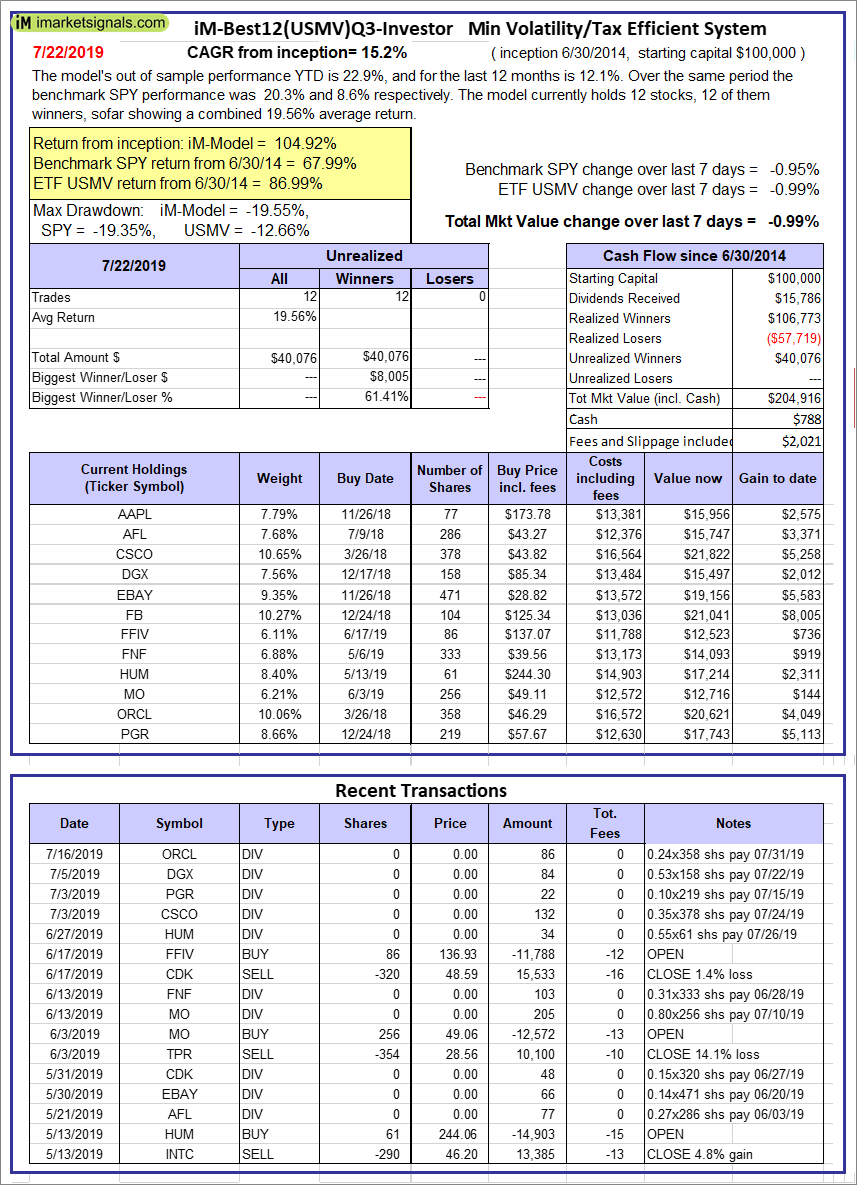 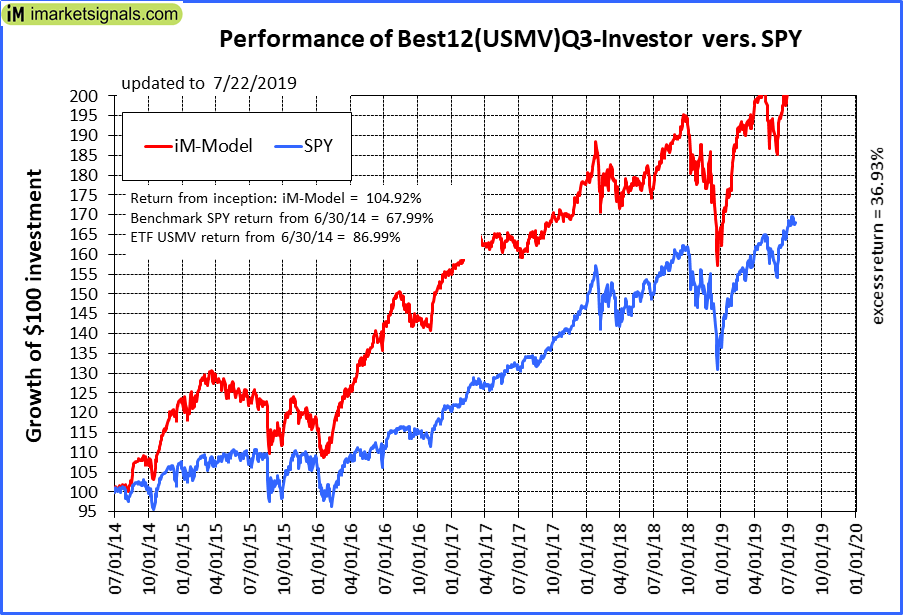 |
iM-Best12(USMV)Q3-Investor: Reporting will be discontinued To be discontinued. The model’s out of sample performance YTD is 22.9%, and for the last 12 months is 12.1%. Over the same period the benchmark SPY performance was 20.3% and 8.6% respectively. Since inception, on 7/1/2014, the model gained 104.92% while the benchmark SPY gained 67.99% and the ETF USMV gained 86.99% over the same period. Over the previous week the market value of iM-Best12(USMV)Q3 gained -0.99% at a time when SPY gained -0.95%. A starting capital of $100,000 at inception on 7/1/2014 would have grown to $204,916 which includes $788 cash and excludes $2,021 spent on fees and slippage. |
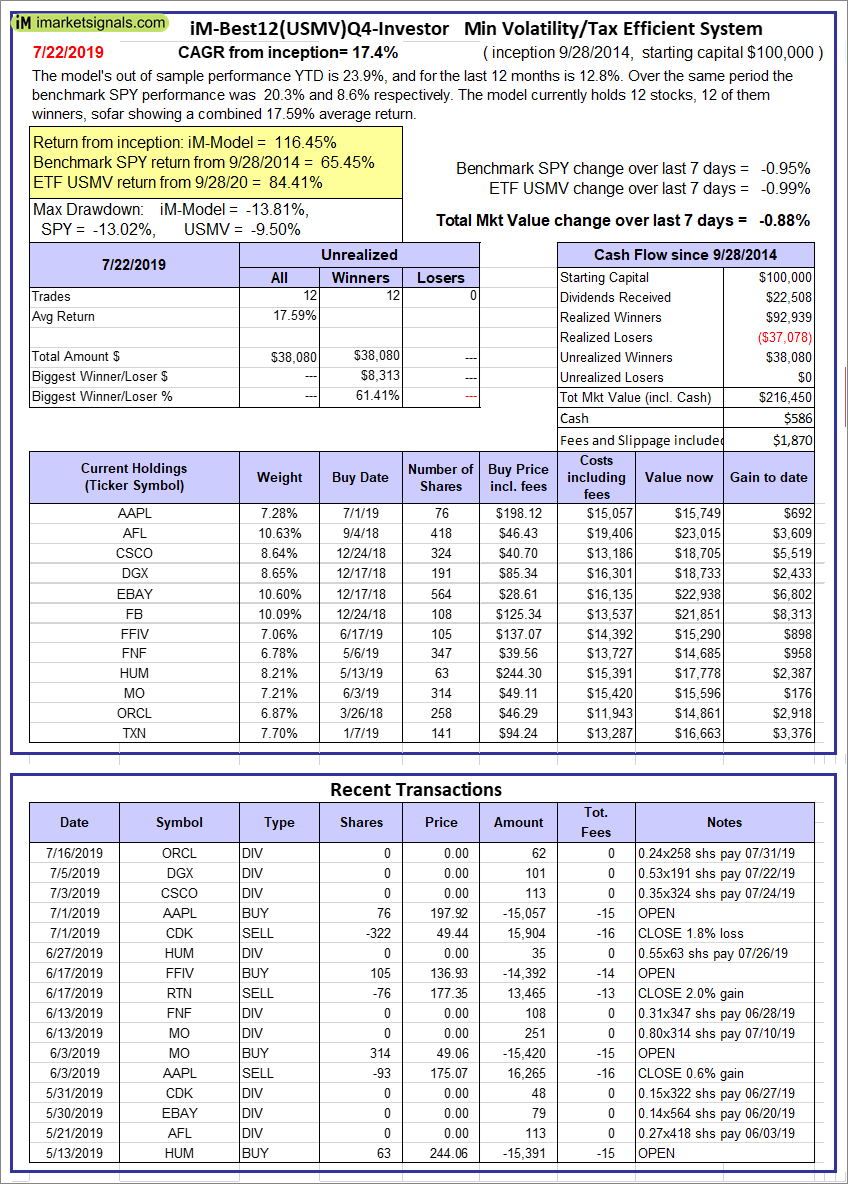 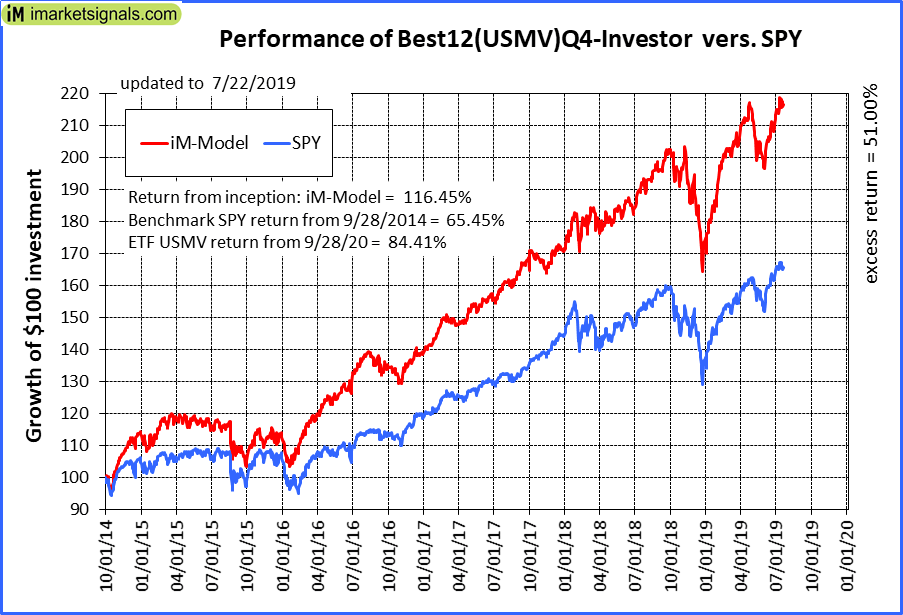 |
iM-Best12(USMV)Q4-Investor: Reporting will be discontinued To be discontinued. Since inception, on 9/29/2014, the model gained 116.45% while the benchmark SPY gained 65.45% and the ETF USMV gained 84.41% over the same period. Over the previous week the market value of iM-Best12(USMV)Q4 gained -0.88% at a time when SPY gained -0.95%. A starting capital of $100,000 at inception on 9/29/2014 would have grown to $216,450 which includes $586 cash and excludes $1,870 spent on fees and slippage. |
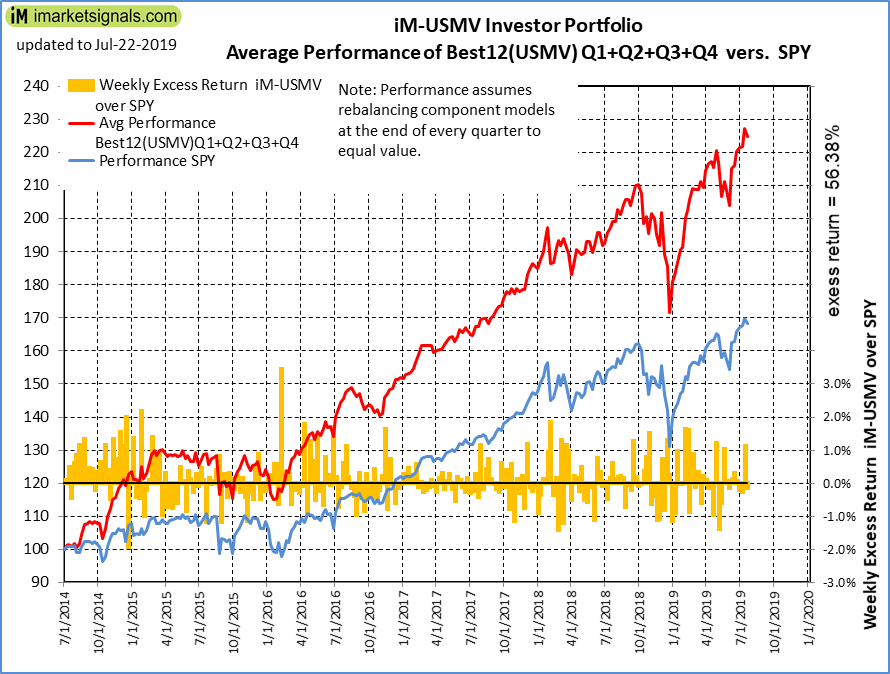 |
Average Performance of iM-Best12(USMV)Q1+Q2+Q3+Q4-Investor resulted in an excess return of 56.38% over SPY. (see iM-USMV Investor Portfolio) |
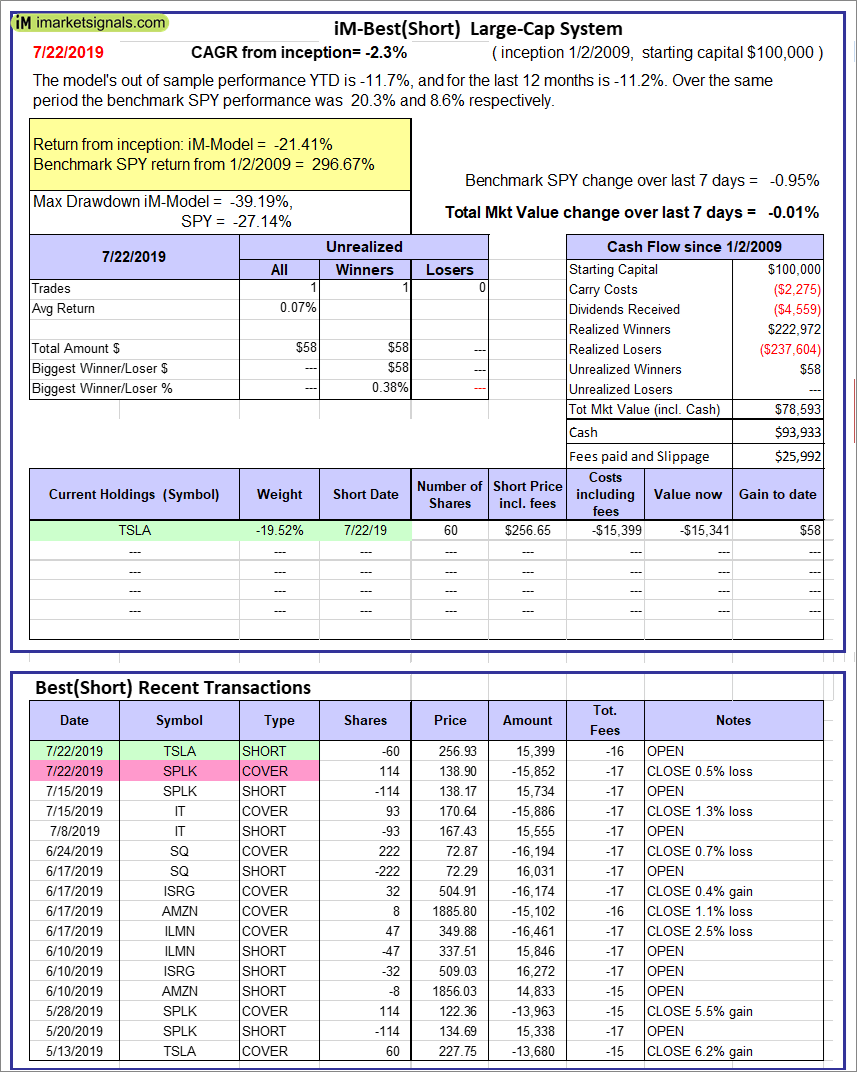 |
iM-Best(Short): The model’s out of sample performance YTD is -11.7%, and for the last 12 months is -11.2%. Over the same period the benchmark SPY performance was 20.3% and 8.6% respectively. Over the previous week the market value of iM-Best(Short) gained -0.01% at a time when SPY gained -0.95%. Over the period 1/2/2009 to 7/22/2019 the starting capital of $100,000 would have grown to $78,593 which includes $93,933 cash and excludes $25,992 spent on fees and slippage. |
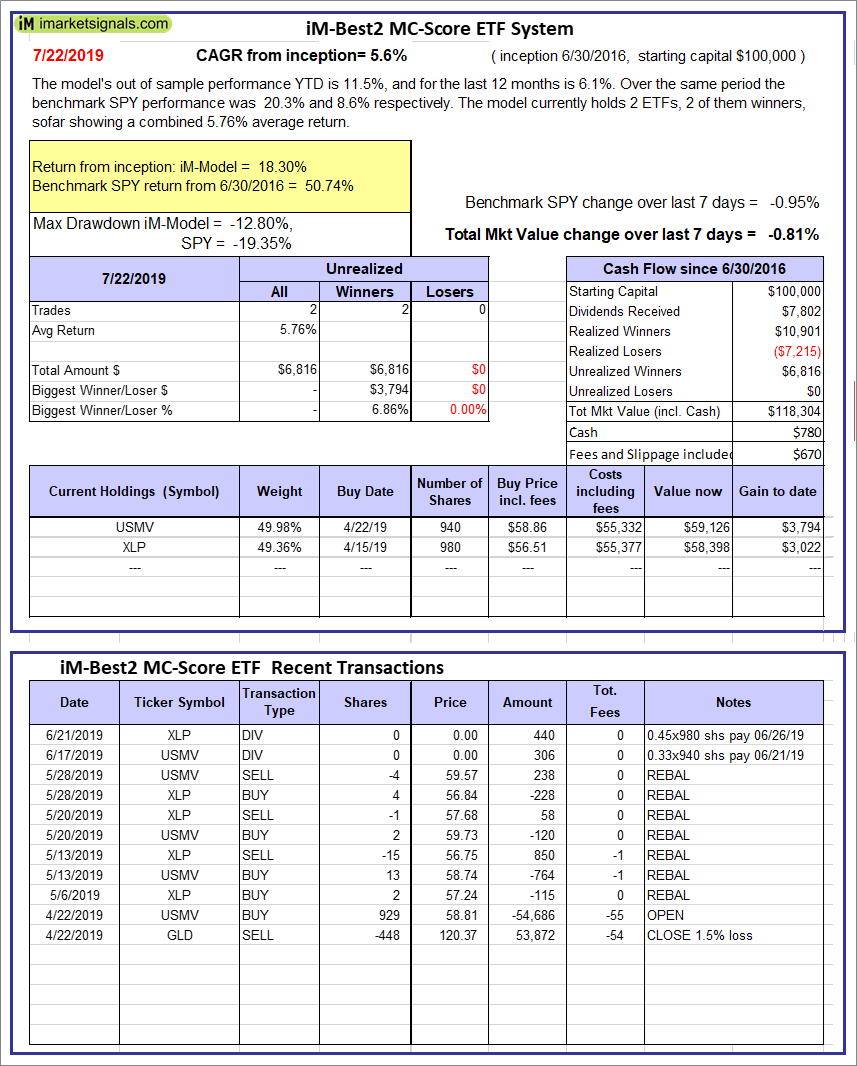 |
iM-Best2 MC-Score ETF System: The model’s out of sample performance YTD is 11.5%, and for the last 12 months is 6.1%. Over the same period the benchmark SPY performance was 20.3% and 8.6% respectively. Over the previous week the market value of the iM-Best2 MC-Score ETF System gained -0.81% at a time when SPY gained -0.95%. A starting capital of $100,000 at inception on 6/30/2016 would have grown to $118,304 which includes $780 cash and excludes $670 spent on fees and slippage. |
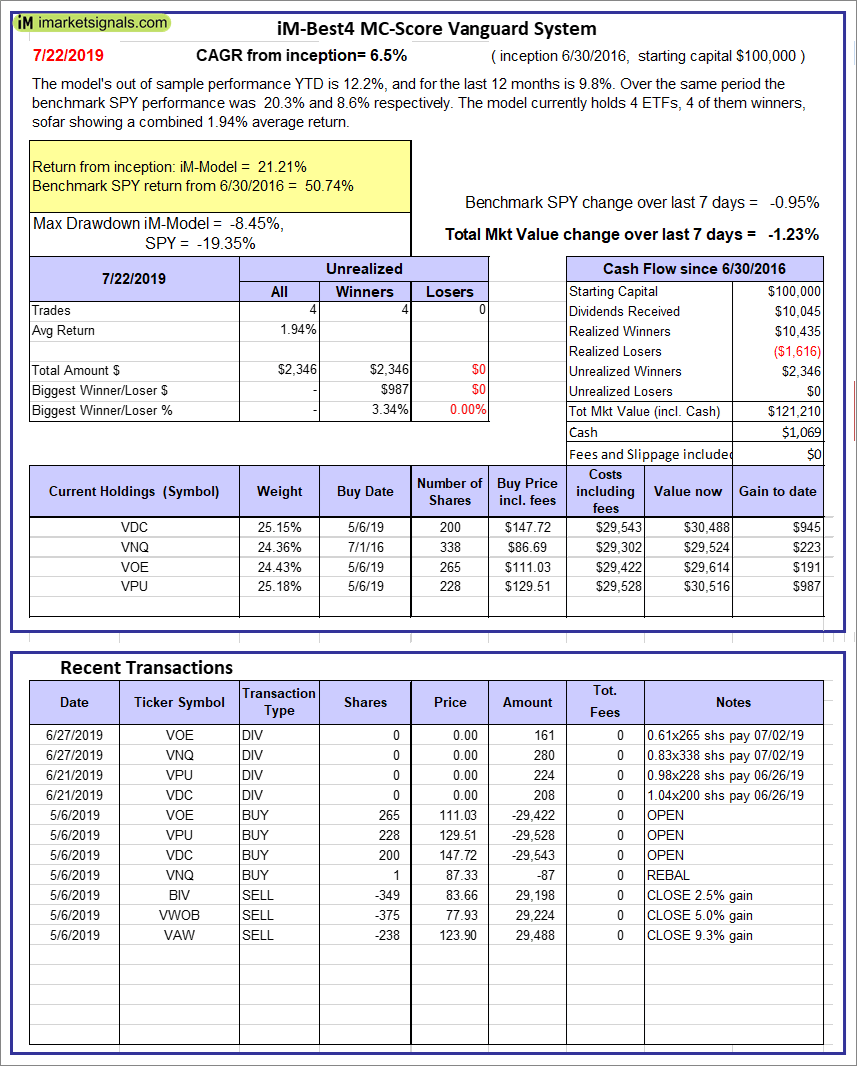 |
iM-Best4 MC-Score Vanguard System: The model’s out of sample performance YTD is 12.2%, and for the last 12 months is 9.8%. Over the same period the benchmark SPY performance was 20.3% and 8.6% respectively. Over the previous week the market value of the iM-Best4 MC-Score Vanguard System gained -1.23% at a time when SPY gained -0.95%. A starting capital of $100,000 at inception on 6/30/2016 would have grown to $121,210 which includes $1,069 cash and excludes $00 spent on fees and slippage. |
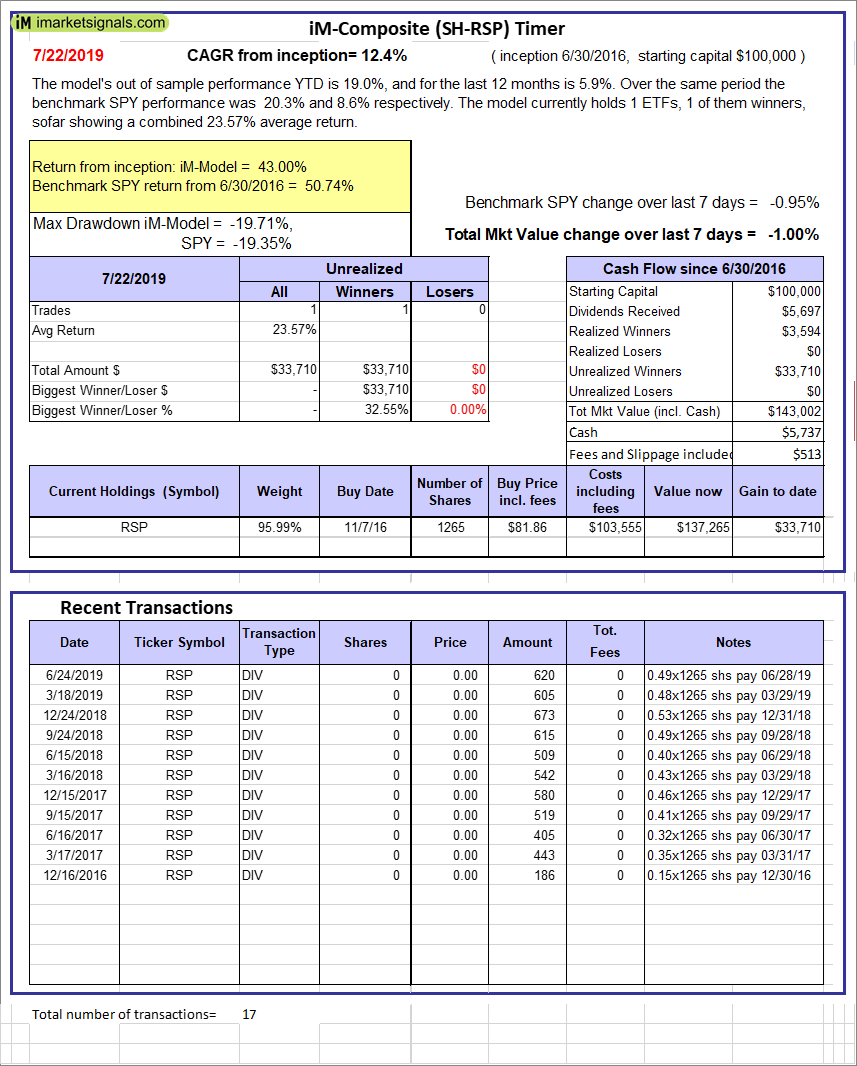 |
iM-Composite (SH-RSP) Timer: The model’s out of sample performance YTD is 19.0%, and for the last 12 months is 5.9%. Over the same period the benchmark SPY performance was 20.3% and 8.6% respectively. Over the previous week the market value of the iM-Composite (SH-RSP) Timer gained -1.00% at a time when SPY gained -0.95%. A starting capital of $100,000 at inception on 6/30/2016 would have grown to $143,002 which includes $5,737 cash and excludes $513 spent on fees and slippage. |
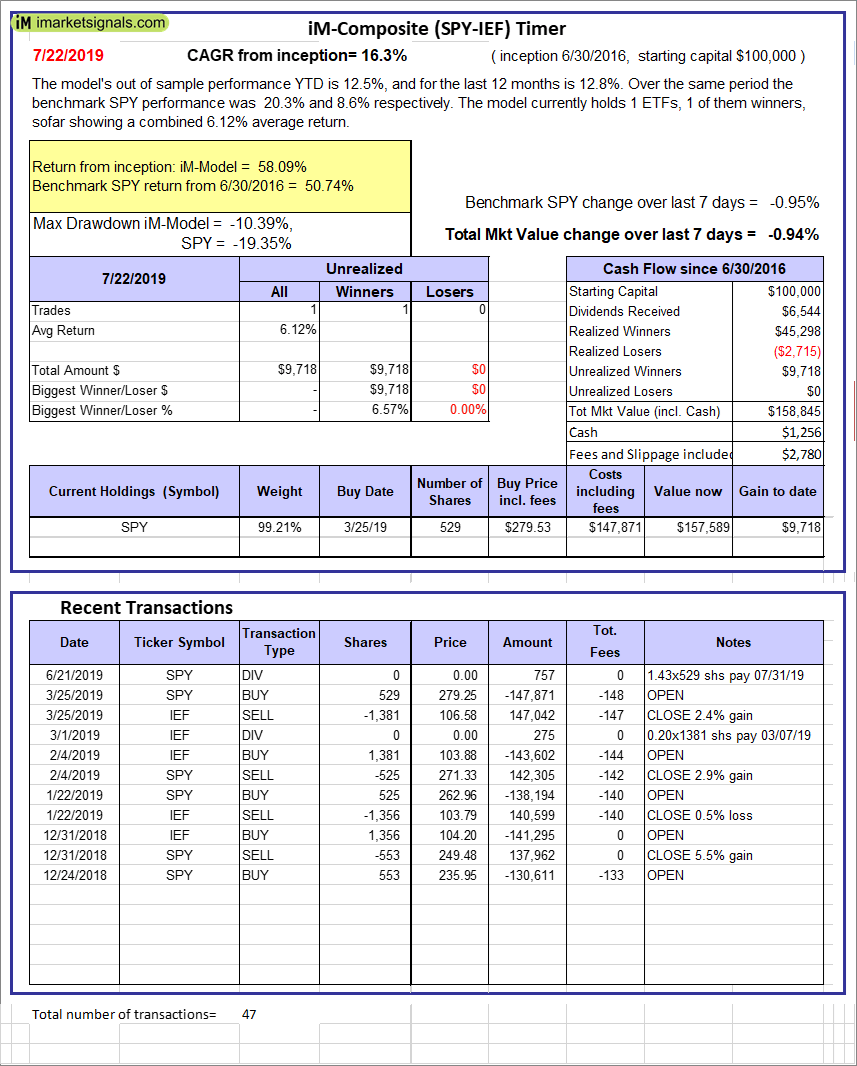 |
iM-Composite (SPY-IEF) Timer: The model’s out of sample performance YTD is 12.5%, and for the last 12 months is 12.8%. Over the same period the benchmark SPY performance was 20.3% and 8.6% respectively. Over the previous week the market value of the iM-Composite (SPY-IEF) Timer gained -0.94% at a time when SPY gained -0.95%. A starting capital of $100,000 at inception on 6/30/2016 would have grown to $158,845 which includes $1,256 cash and excludes $2,780 spent on fees and slippage. |
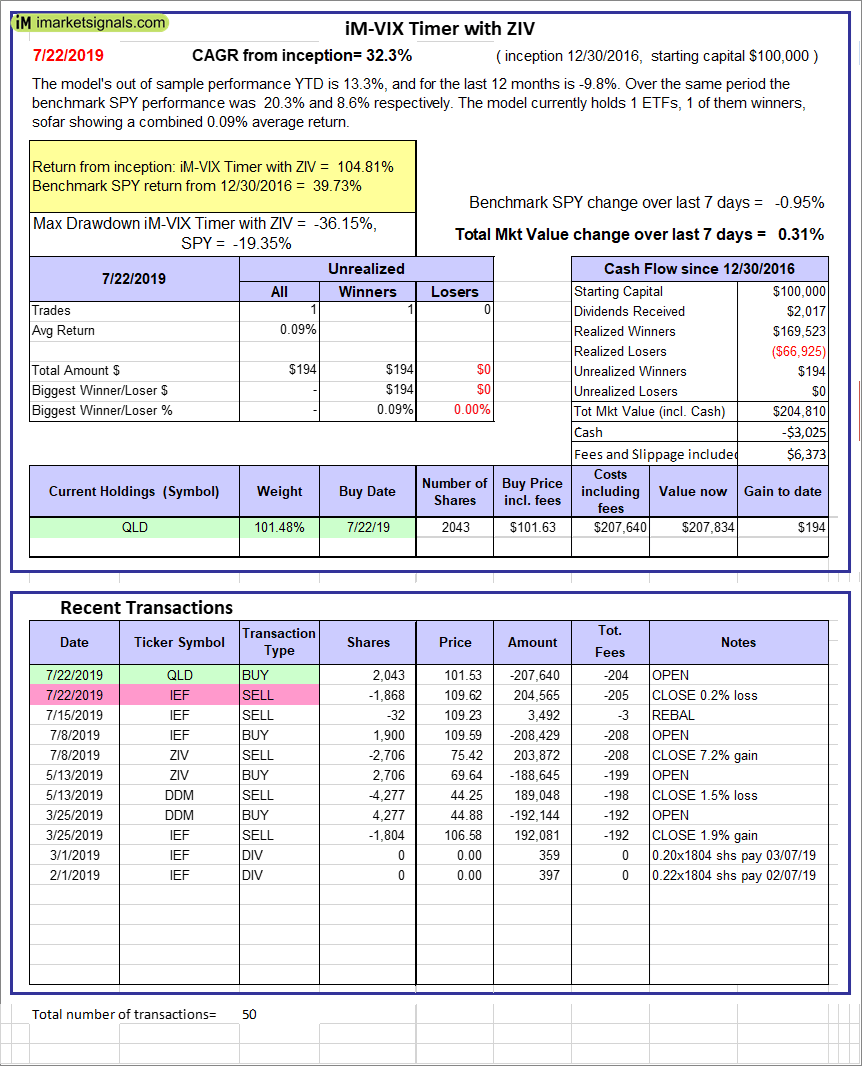 |
iM-VIX Timer with ZIV: The model’s out of sample performance YTD is 13.3%, and for the last 12 months is -9.8%. Over the same period the benchmark SPY performance was 20.3% and 8.6% respectively. Over the previous week the market value of the iM-VIX Timer with ZIV gained 0.31% at a time when SPY gained -0.95%. A starting capital of $100,000 at inception on 6/30/2016 would have grown to $204,810 which includes -$3,025 cash and excludes $6,373 spent on fees and slippage. |
 |
iM-Composite(Gold-Stocks-Bond) Timer: The model’s out of sample performance YTD is 19.3%, and for the last 12 months is 7.7%. Over the same period the benchmark SPY performance was 20.3% and 8.6% respectively. Over the previous week the market value of the iM-Composite(Gold-Stocks-Bond) Timer gained -1.52% at a time when SPY gained -0.95%. A starting capital of $100,000 at inception on 6/30/2016 would have grown to $130,836 which includes $680 cash and excludes $2,889 spent on fees and slippage. |
 |
iM-Low Turnover Composite Timer Combo: The model’s out of sample performance YTD is 11.9%, and for the last 12 months is 2.0%. Over the same period the benchmark SPY performance was 20.3% and 8.6% respectively. Over the previous week the market value of the iM-Low Turnover Composite Timer Combo gained -0.59% at a time when SPY gained -0.95%. A starting capital of $100,000 at inception on 3/24/27 would have grown to $107,774 which includes $517 cash and excludes $887 spent on fees and slippage. |
 |
iM-Min Drawdown Combo: The model’s out of sample performance YTD is 14.4%, and for the last 12 months is 7.8%. Over the same period the benchmark SPY performance was 20.3% and 8.6% respectively. Over the previous week the market value of the iM-Min Drawdown Combo gained -0.92% at a time when SPY gained -0.95%. A starting capital of $100,000 at inception on 4/5/2017 would have grown to $116,693 which includes $256 cash and excludes $1,070 spent on fees and slippage. |
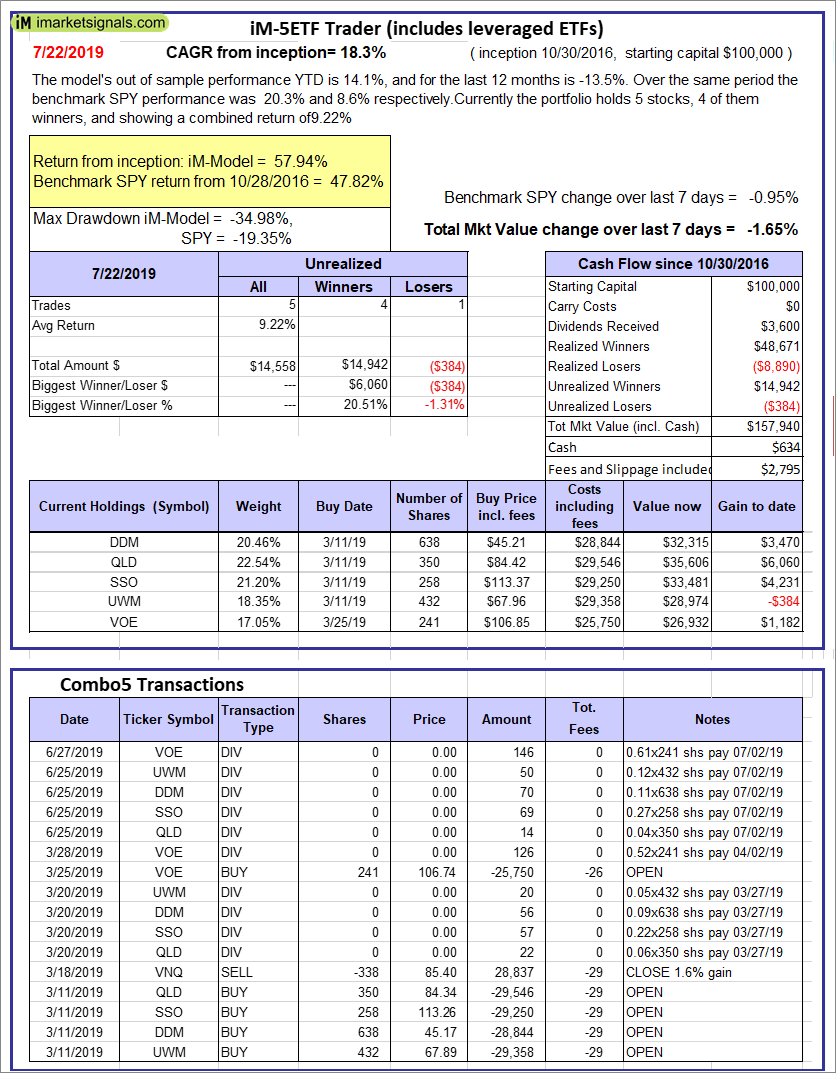 |
iM-5ETF Trader (includes leveraged ETFs): The model’s out of sample performance YTD is 14.1%, and for the last 12 months is -13.5%. Over the same period the benchmark SPY performance was 20.3% and 8.6% respectively. Over the previous week the market value of the iM-5ETF Trader (includes leveraged ETFs) gained -1.65% at a time when SPY gained -0.95%. A starting capital of $100,000 at inception on 10/30/2016 would have grown to $157,940 which includes $634 cash and excludes $2,795 spent on fees and slippage. |
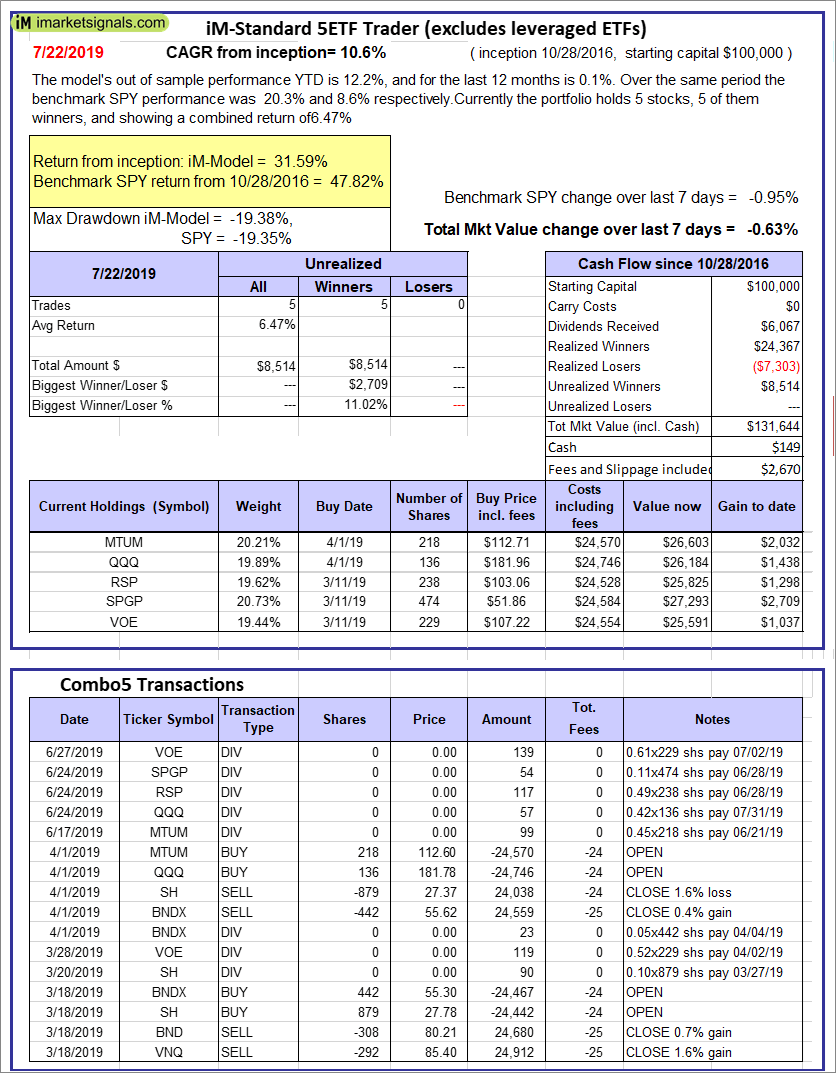 |
iM-Standard 5ETF Trader (excludes leveraged ETFs): The model’s out of sample performance YTD is 12.2%, and for the last 12 months is 0.1%. Over the same period the benchmark SPY performance was 20.3% and 8.6% respectively. Over the previous week the market value of the iM-Standard 5ETF Trader (excludes leveraged ETFs) gained -0.63% at a time when SPY gained -0.95%. A starting capital of $100,000 at inception on 10/30/2016 would have grown to $131,644 which includes $149 cash and excludes $2,670 spent on fees and slippage. |
iM-Best Reports – 7/22/2019
Posted in pmp SPY-SH
Leave a Reply
You must be logged in to post a comment.